Abstract
[18F] fluorodeoxyglucose (FDG) – positron emission tomography (PET)/computed tomography (CT) is used to stage and assess response in DLBCL, though the prognostic value of tumor metrics calculated from interim scans remains unsolved. We investigated the predictive value of interim and end-of-treatment (EOT) metabolic tumor volume (MTV) and total lesion glycolysis (TLG) on progression-free survival (PFS) at 24 months in patients with DLBCL treated with R-CHOP. Controlling for pre-treatment MTV, a positive interim MTV was highly correlated with (0.86) and a significant predictor of a positive EOT MTV (p = 0.03). Interim MTV > 0 (HR 5.51, CI 1.13, 26.79) and EOT MTV > 4.68 (HR 10.75, CI 1.31, 105.48) were significant predictors of PFS24. Our data shows PET-derived metrics of pre-treatment and interim MTV offer significant predictive value for EOT response and PFS, and can guide future response-adapted treatment approaches for DLBCL patients that build on the R-CHOP backbone.
Introduction
Diffuse large B-cell lymphoma (DLBCL) is an aggressive non-Hodgkin lymphoma with heterogeneous clinical outcomes following treatment with standard rituximab, cyclophosphamide, doxorubicin, vincristine and prednisone (R-CHOP). Currently, DLBCL initial staging utilizes [18F] fluorodeoxyglucose (FDG) – positron emission tomography (PET)/computed tomography (CT) imaging to define a modified Ann Arbor stage. PET/CT imaging can provide valuable measurements of tumor metabolism and activity both prior to and during treatment. Developing tools to identify patients who could benefit from alternate or response-adapted therapies addresses an unmet need for improving DLBCL patient outcomes1. PET-derived metrics include: tumor maximum standardized uptake value (SUV); metabolically active tumor volume (MTV), calculated as the total volume of tumor with FDG uptake; and total lesion glycolysis (TLG), the sum of tumor volume weighted by the intensity of FDG uptake. Several existing data sets indicate pre-treatment PET-derived tumor metrics may be valuable in guiding clinical and therapeutic decisions 2–4, though the value of intra-treatment PET-derived tumor metrics remains less clear. We performed a retrospective analysis to assess the prognostic value of PET/CT-derived metrics measuring tumor burden and metabolism, specifically metabolic tumor volume (MTV) and total lesion glycolysis (TLG), for predicting progression-free survival (PFS) in patients with DLBCL treated with R-CHOP chemotherapy.
Materials and Methods:
Study population
After approval by the Emory University Institutional Review Board, we utilized published methods, pathology and medical records to identify patients who were diagnosed with DLBCL as defined by the World Health Organization classification system5. Patients diagnosed with biopsy-proven DLBCL at Emory University between 2005–2016 were eligible. Patients who received R-CHOP chemotherapy as first line treatment were included if there was available information for date of last contact or date of death, LDH at time of diagnosis, and the patient had PET/CT scans performed pre-treatment, during treatment at any time point after cycle 2 until after cycle 4, and at end of treatment after cycle 6 of R-CHOP.
PET/CT Parameters and molecular analysis
All patients underwent FDG-PET from mid-thigh to the base of the skull according to Emory University protocols. DICOM images were transferred to MIM, medical imaging software for manipulation of PET, CT, PET/CT and SPECT/CT images 6. Using this software, a region of interest was drawn over lesions exhibiting SUV threshold greater than 4, as suggested in previous literature demonstrating that this approach increased specificity for tumor and yielded high interobserver reproducibility.7,8 MTV was calculated as the volumetric sum of nodal and extranodal regions of interest. TLG was also obtained using MIM software, calculated as the sum of MTV weighted by intensity of SUV uptake. Bone marrow, spleen and liver involvement were included only if there was focal uptake. Cell of origin and LDH at diagnosis were recorded when available in biopsy reports and laboratory data review. PFS was chosen as the endpoint to evaluate the prognostic significance of PET/CT tumor metrics, calculated from pre-treatment to the first recording of disease progression or death from any cause. Patients treated with rituximab containing anthracycline-based regimen who are alive without progression at 24 months from the initiation of therapy were recently demonstrated to experience survival that is similar to age and sex-matched controls.9 PFS at 24 months (PFS24) was examined as a secondary endpoint.
Statistical Analysis
Univariate analysis was used to examine the relationship between interim MTV and end of treatment MTV and LDH (defined as high > 200 or normal < 200) at time of diagnosis. Logistic regression was used to examine the predictive value of pre-treatment and interim MTV on EOT PET results as well as the relationship between LDH and pre-treatment MTV. The Kaplan–Meier estimator and Cox proportional hazard models were used to estimate hazard ratios (HR) and 95% confidence intervals (CI) for positive pre-treatment MTV, interim MTV, EOT MTV, subtype and LDH at diagnosis. Receiver operating characteristic (ROC) curves were constructed examining pre-treatment, interim, and post-treatment MTV as predictors of PFS24.
Results:
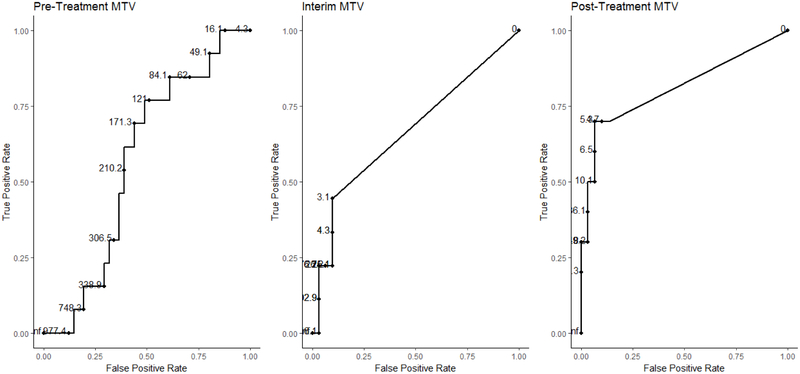
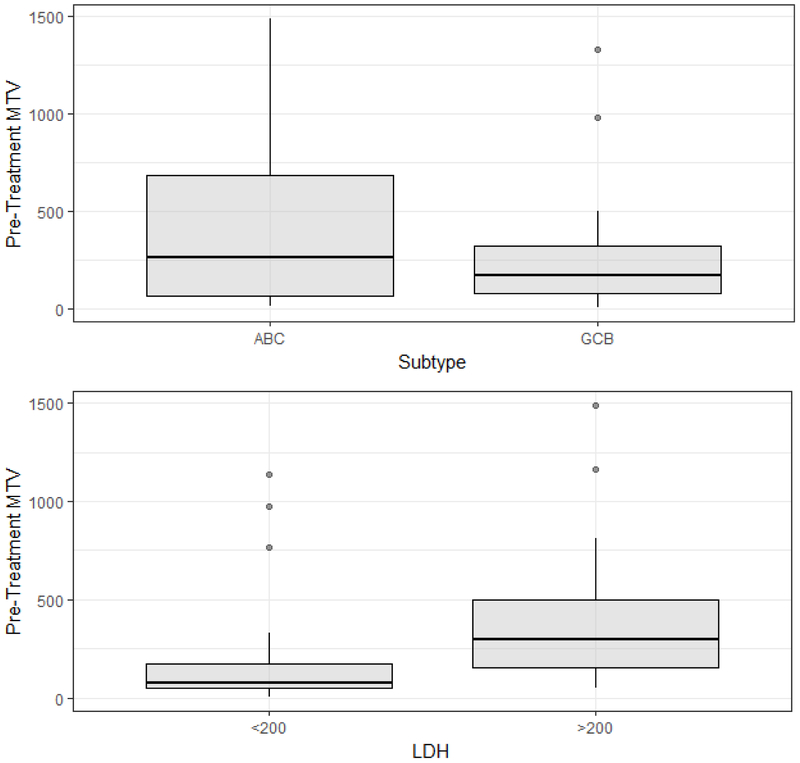
Fifty-five patients met inclusion criteria and had clinical characteristics distributed as shown in Table 1. Mean values and ranges for pre-treatment and interim and end of treatment MTV and TLG are shown in Table 2. The mean pre-treatment MTV was 261 ml (range 4.26 – 1,327 ml) and mean TLG was 2033.768 ml*SUVbw (range 24.48–8,783 ml*SUVbw) for GCB DLBCL and were 383 ml (range 12.82 – 1,488 ml) and 4344.058 (range 85.29 – 16,180 ml*SUVbw) for non-GCB DLBCL, respectively. Receiver operating characteristic curve analysis determined optimal cutoffs of pre-treatment MTV at 121 ml, interim MTV at 0 ml and EOT MTV at 4.68 ml for predicting PFS24 (Figure 1). Univariate analysis of pre-treatment MTV revealed non-GCB DLBCL and LDH > 200 were associated with higher pre-treatment MTV. Figure 2 plots pre-treatment MTV values by DLBCL subtype and baseline LDH.
Table 1: Patient Characteristics (n=55).
| Median (Range) | ||
|---|---|---|
| Age | 63 (24 – 93) | |
| Number (%) | ||
| Male/Female | 29 (53) /26 (47) | |
| NCCN-IPI Factors | ||
| < 40 years | 7 (13) | |
| 41 – 60 years | 14 (25) | |
| 61 – 75 years | 24 (44) | |
| >75 years | 10 (18) | |
| ECOG PS > 1 | 4 (7) | |
| LDH normal | 39 (71) | |
| LDH > normal < 3x ULN | 13 (24) | |
| LDH > 3x ULN | 3 (5) | |
| Stage III/IV | 21 (38) | |
| Extranodal involvement* | 21 (38) | |
| NCCN-IPI score | ||
| Low risk (0-1) | 6 (11) | |
| Low intermediate risk (2-3) | 34 (62) | |
| High intermediate risk (4-5) | 12 (22) | |
| High risk (> 6) | 3 (5) | |
| Non-GCB subtype | 19 (34) | |
| GCB subtype | 18 (33) | |
| Unreported subtype | 18 (33) |
Disease in bone marrow, CNS, liver/GI tract, or lung
Table 2: Mean metabolic tumor volume (MTV) and total lesion glycolysis (TLG) pre-treatment, interim and end of treatment PET/CT scans.
| Pre-Treatment | Interim | End of Treatment | |
|---|---|---|---|
| Mean MTV (range) ml | 304 (4.26 – 1,488) | 24.04 (0 – 446) | 23.61 (0 – 396) |
| Mean TLG (range) ml*SUVbw | 3068 (24.48 – 16,180) | 229 (0 – 7362) | 191 (0 – 5679) |
Figure 1: Receiver operating characteristic curves for pre-treatment, interim, and end of treatment metabolic tumor volume (MTV).
Figure 2: Univariate analysis of pre-metabolic tumor volume stratified by COO and LDH.
Interim MTV was highly correlated with EOT MTV (r=0.86). After controlling for pre-treatment MTV, interim MTV > 0 was a significant predictor of a EOT MTV > 0 (OR 9.07, CI 1.26, 88.55) p = 0.03). In contrast, pre-treatment MTV, pre-treatment TLG and interim TLG were not significant predictors of positive interim or EOT scans.
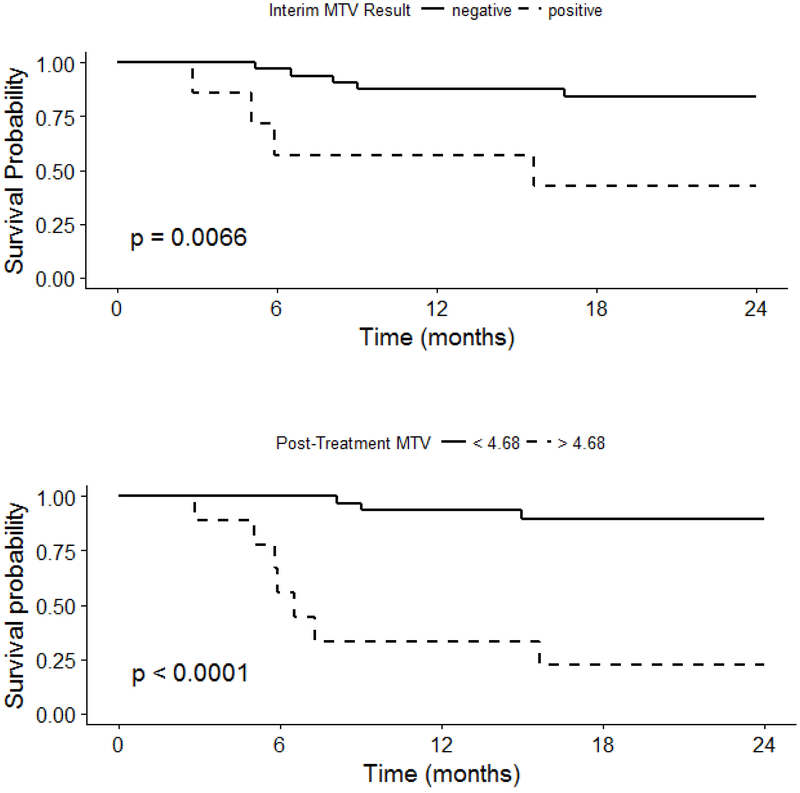
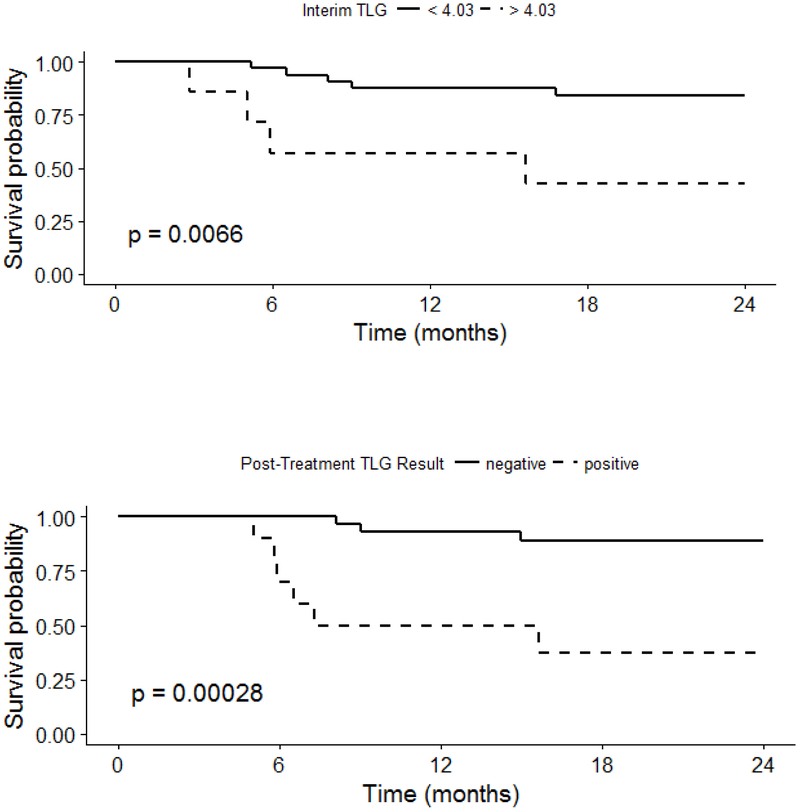
Kaplan-Meier survival curves and Cox regression analyses demonstrated that positive interim MTV and positive EOT MTV were associated with a significant difference in PFS (Figure 3). In separate multivariable regression models controlling for pre-treatment MTV, Interim MTV > 0 (HR 5.51, CI 1.13, 26.79) and EOT MTV > 4.68 (HR 10.75, CI 1.31, 105.48) were significant predictors of PFS. Similar findings were observed for interim and EOT TLG (Figure 4).
Figure 3: Progression-Free Survival by Interim and End of Treatment MTV.
Figure 4: Progression-Free Survival by Interim and End of Treatment TLG.
Discussion:
Standard clinical prognostication of DLBCL relies on the international prognostic index (IPI) and its improved successors, R-IPI and NCCN-IPI 10,11. However, due to the high heterogeneity of this disease, the IPI system has functional limitations in predicting survival for all patients, and there is an urgent need for more accurate and dynamic prognostic markers. Risk stratification by cell of origin, double hit, double expressor, and genomic prognostic factors have been developed 12–16, but have not been adopted broadly in clinical medicine and are static factors identified at diagnosis that do not address the changes in outcomes that can be influenced by ongoing treatment. In this study, we have shown that PET-CT derived tumor metrics allow dynamic reassessment of tumor response to therapy beyond a static pre-treatment model, offering prognostic information that can alter treatment regimens in a response-adapted manner.
A retrospective study comparing the prognostic value of pre-treatment MTV to NCCN-IPI score found NCCN-IPI to be the only significant independent predictive factor of PFS and OS 17–19, concluding that PET-CT derived tumor metrics did not offer prognostication beyond that which is provided by the NCCN-IPI at time of diagnosis. Interestingly, the current study also demonstrates that baseline metrics of tumor volume and metabolic activity do not hold prognostic value; however, these findings run contrary to previous reports in the literature 4,20,21. Xie et al performed a metaanalysis on the predictive value of PET-CT derived metrics, including seven studies totaling 702 patients. The analysis concluded high pre-treatment MTV was significantly associated with inferior survival in DLBCL patients treated with first-line R-CHOP and was the only independent predictor for PFS and OS as compared to SUV and TLG20. However, several methodological limitations of the included studies may make interpretation of these results difficult. Individual studies were not always adequately powered; the lowest number of patients included was 20 in one trial20. Additionally, disease characteristics were heterogeneous, with some studies excluding high risk patients, or including primarily low-risk patients as designated by IPI at time of diagnosis20. Additionally, for most studies, users were not blinded to outcomes when defining regions of interest on PET-CT.
In contrast, Jiang et al demonstrated in a retrospective study that interim PET-CT scans provided prognostic information for PFS and OS in DLCBL patients treated with R-CHOP27. Interim PET-CT scans were obtained after cycle 4 of R-CHOP chemotherapy and assessed for FDG avidity as a surrogate of metabolic tumor activity using the standardized 5-point Deauville criteria, and classified as either positive (scores 4–5) or negative (scores 1–3)27. For most groups and particularly for high-IPI score patients, a positive interim PET-CT portended poorer PFS and OS than for patients with negative interim PET-CT scans in the same IPI score category, thus improving risk stratification into treatment beyond that seen at diagnosis27.
Our results confirm previous reports of interim PET-derived tumor metrics demonstrating prognostic value in DLBCL27,28. We identified that interim MTV provides predictive value for positive EOT MTV, and furthermore predicts worse PFS (Figure 3). EOT MTV also predicted worse PFS; taken together, these data suggest that PET/CT at both timepoints can be useful predictors of PFS (Fig 3). This makes intuitive sense when correlating with the biology of the disease; namely, that a greater change in metabolically active tumor can serve as a surrogate marker for tumor sensitivity and improved response rates to chemotherapy. Because PET-CT derived tumor metrics reflect the metabolic characteristics of individual disease, they have the potential to improve the accuracy of prognostication beyond a static model. In contrast, cell of origin did not hold prognostic value in this study. Furthermore, LDH at diagnosis, though included in the NCCN-IPI for prognostication, did not hold prognostic value in our study for PFS24; however, a small sample size makes interpretation of these results difficult.
Several limitations exist in this study, which may affect interpretation of results. Our study included only fifty-five patients, involved single center bias and was retrospective in nature, and thus may have been underpowered to detect significant differences in predictors of interest. As a result, we limited analyses to univariate or simple multiple variable models. Also due to the retrospective nature of this study, the timing of interim PET/CT scans were subject to provider variability as observed in clinical practice. Furthermore, our threshold for disease was an SUV > 4, as determined by previous reports and to improve reproducibility 8; however, there is no consensus on appropriate SUV thresholds and several have been reported in the literature 3,4,21. Determining a standard SUV threshold is difficult, as FDG is not a tumor-specific substance and may accumulate in inflammatory and physiologic anatomic sites, leading to false-positive or false-negative interpretations of tumor activity depending on operator interpretation. Differing thresholds may thus contribute to the variability and poor reproducibility of these studies. Additionally, users were not blinded to outcome when defining regions of interest and subsequent MTV calculations. Variability in user expertise for obtaining regions of interest may have affected data acquisition, though we attempted to minimize heterogeneity by using a highly reproducible SUV threshold, program-automated regions of interest based on SUV threshold, and cross-referencing regions of interest with an experienced nuclear radiologist. Additionally, while all patients were initially treated with R-CHOP chemotherapy, a few underwent subsequent modifications in treatment regimens with intensification or transplant, leading to heterogeneity in treatment among patients that may influence PFS. Notably, this analysis did not address the value of interim and EOT PET/CT in patient groups with aggressive lymphomas such as double hit lymphoma. These patients are typically treated with more intensive regimens rather than R-CHOP based on data from a previous analysis15. Additional studies examining the value of interim and EOT PET/CT in these patient groups are needed. Finally, our statistical analysis used retrospective ROC values to determine optimal cutoffs for PFS, which may have overestimated prognostic value.
Conclusions:
PET-derived metrics of interim MTV and TLG offer significant predictive value for end of treatment response and PFS, and can guide future response-adapted treatment approaches for DLBCL patients that build on the R-CHOP backbone. Interim and EOT MTV and TLG provide value in DLBCL risk stratification and can be incorporated into updated integrative prognostic models that provide dynamic prognostication beyond that offered by the current IPI system. For example, patients who have positive interim PET-CT scans may have an indication for earlier treatment interventions, which could include stem cell transplantation, chimeric antigen receptor (CAR) T-cell based therapies, or intensification of the chemotherapy regimen, which have been used effectively in high risk DLBCL 15,22,23. Our findings can help determine optimal timing of interim PET/CT scans and the magnitude of effect expected. Interim PET/CT should also be considered in clinical studies evaluating PET-adapted therapy for DLBCL. Larger outcomes studies based on secondary analyses of clinical trials data or large observational cohort studies are needed to confirm these findings and validate them in clinical practice.
Acknowledgments
Financial Support: Research reported in this publication was supported in part by the Winship Research Informatics Shared Resources of Winship Cancer Institute of Emory University and NIH/NCI under award number P30CA138292 and by a V Foundation award and K24CA208132 to Dr. Flowers. The content is solely the responsibility of the authors and does not necessarily represent the official views of the National Institutes of Health.
Footnotes
Conflict of Interest Disclosure: CRF reports consultancy fees from: Abbvie, AstraZeneca, Bayer, BeiGene, Celgene (unpaid), Denovo Biopharma, Genentech/Roche (unpaid), Gilead, Karyopharm, Pharmacyclics/Janssen, and Spectrum. CRF has received research funding from: Abbvie, Acerta, BeiGene, Celgene, Gilead, Genentech/Roche, Janssen Pharmaceutical, Millennium/Takeda, Pharmacyclics, TG Therapeutics, Burroughs Wellcome Fund, Eastern Cooperative Oncology Group, National Cancer Institute, and the V Foundation. The other authors have nothing to disclose.
References:
- 1.Cohen JB, Kurtz DM, Staton AD, Flowers CR. Next-generation surveillance strategies for patients with lymphoma. Future Oncol. 2015;11(13):1977–1991. [DOI] [PMC free article] [PubMed] [Google Scholar]
- 2.Cottereau AS, Lanic H, Mareschal S, et al. Molecular Profile and FDG-PET Metabolic Volume at Staging in DLBCL-Response. Clin Cancer Res. 2016;22(13):3414–3415. [DOI] [PubMed] [Google Scholar]
- 3.Cottereau AS, Lanic H, Mareschal S, et al. Molecular Profile and FDG-PET/CT Total Metabolic Tumor Volume Improve Risk Classification at Diagnosis for Patients with Diffuse Large B-Cell Lymphoma. Clin Cancer Res. 2016;22(15):3801–3809. [DOI] [PubMed] [Google Scholar]
- 4.Song MK, Yang DH, Lee GW, et al. High total metabolic tumor volume in PET/CT predicts worse prognosis in diffuse large B cell lymphoma patients with bone marrow involvement in rituximab era. Leuk Res. 2016;42:1–6. [DOI] [PubMed] [Google Scholar]
- 5.Flowers CR, Shenoy PJ, Borate U, et al. Examining racial differences in diffuse large B-cell lymphoma presentation and survival. Leuk Lymphoma. 2013;54(2):268–276. [DOI] [PMC free article] [PubMed] [Google Scholar]
- 6.Pierce LA 2nd, Elston BF, Clunie DA, Nelson D, Kinahan PE. A Digital Reference Object to Analyze Calculation Accuracy of PET Standardized Uptake Value. Radiology. 2015;277(2):538–545. [DOI] [PMC free article] [PubMed] [Google Scholar]
- 7.Kurtz DM, Green MR, Bratman SV, et al. Noninvasive monitoring of diffuse large B-cell lymphoma by immunoglobulin high-throughput sequencing. Blood. 2015;125(24):3679–3687. [DOI] [PMC free article] [PubMed] [Google Scholar]
- 8.Nguyen NC, Kaushik A, Wolverson MK, Osman MM. Is there a common SUV threshold in oncological FDG PET/CT, at least for some common indications? A retrospective study. Acta Oncol. 2011;50(5):670–677. [DOI] [PubMed] [Google Scholar]
- 9.Maurer MJ, Habermann TM, Shi Q, et al. Progression-Free Survival at 24 Months (PFS24) and Subsequent Outcome For Patients With Diffuse Large B-Cell Lymphoma (DLBCL) Enrolled On Randomized Clinical Trials. Ann Oncol. 2018. [DOI] [PMC free article] [PubMed] [Google Scholar]
- 10.Flowers CR, Sinha R, Vose JM. Improving outcomes for patients with diffuse large B-cell lymphoma. CA Cancer J Clin. 2010;60(6):393–408. [DOI] [PubMed] [Google Scholar]
- 11.Zhou Z, Sehn LH, Rademaker AW, et al. An enhanced International Prognostic Index (NCCN-IPI) for patients with diffuse large B-cell lymphoma treated in the rituximab era. Blood. 2014;123(6):837–842. [DOI] [PMC free article] [PubMed] [Google Scholar]
- 12.Alizadeh AA, Eisen MB, Davis RE, et al. Distinct types of diffuse large B-cell lymphoma identified by gene expression profiling. Nature. 2000;403(6769):503–511. [DOI] [PubMed] [Google Scholar]
- 13.Hans CP, Weisenburger DD, Greiner TC, et al. Confirmation of the molecular classification of diffuse large B-cell lymphoma by immunohistochemistry using a tissue microarray. Blood. 2004;103(1):275–282. [DOI] [PubMed] [Google Scholar]
- 14.Koff JL, Flowers CR. Prognostic modeling in diffuse large B-cell lymphoma in the era of immunochemotherapy: Where do we go from here? Cancer. 2017;123(17):3222–3225. [DOI] [PMC free article] [PubMed] [Google Scholar]
- 15.Petrich AM, Gandhi M, Jovanovic B, et al. Impact of induction regimen and stem cell transplantation on outcomes in double-hit lymphoma: a multicenter retrospective analysis. Blood. 2014;124(15):2354–2361. [DOI] [PubMed] [Google Scholar]
- 16.Reddy A, Zhang J, Davis NS, et al. Genetic and Functional Drivers of Diffuse Large B Cell Lymphoma. Cell. 2017;171(2):481–494 e415. [DOI] [PMC free article] [PubMed] [Google Scholar]
- 17.Adams HJ, de Klerk JM, Fijnheer R, Dubois SV, Nievelstein RA, Kwee TC. CT-based versus FDG-PET/CT-based NCCN international prognostic index risk stratification in DLBCL. J Natl Compr Canc Netw. 2015;13(2):171–176. [DOI] [PubMed] [Google Scholar]
- 18.Adams HJ, de Klerk JM, Fijnheer R, et al. Prognostic superiority of the National Comprehensive Cancer Network International Prognostic Index over pretreatment whole-body volumetric-metabolic FDG-PET/CT metrics in diffuse large B-cell lymphoma. Eur J Haematol. 2015;94(6):532–539. [DOI] [PubMed] [Google Scholar]
- 19.Adams HJ, Kwee TC. Does end-of-treatment FDG-PET provide any additional prognostic value to the pre-treatment NCCN-IPI score? Br J Haematol. 2017;177(2):319–320. [DOI] [PubMed] [Google Scholar]
- 20.Xie M, Wu K, Liu Y, Jiang Q, Xie Y. Predictive value of F-18 FDG PET/CT quantization parameters in diffuse large B cell lymphoma: a meta-analysis with 702 participants. Med Oncol. 2015;32(1):446. [DOI] [PubMed] [Google Scholar]
- 21.Xie M, Zhai W, Cheng S, Zhang H, Xie Y, He W. Predictive value of F-18 FDG PET/CT quantization parameters for progression-free survival in patients with diffuse large B-cell lymphoma. Hematology. 2016;21(2):99–105. [DOI] [PubMed] [Google Scholar]
- 22.Muringampurath-John D, Flowers CR, Toscano M, et al. Rituximab-hyperfractionated cyclophosphamide, vincristine, adriamycin and dexamethasone alternating with high-dose cytarabine and methotrexate for aggressive non-Hodgkin lymphoma. Leuk Lymphoma. 2012;53(4):725–727. [DOI] [PubMed] [Google Scholar]
- 23.Oki Y, Noorani M, Lin P, et al. Double hit lymphoma: the MD Anderson Cancer Center clinical experience. Br J Haematol. 2014;166(6):891–901. [DOI] [PubMed] [Google Scholar]
- 24.Esfahani SA, Heidari P, Halpern EF, Hochberg EP, Palmer EL, Mahmood U. Baseline total lesion glycolysis measured with (18)F-FDG PET/CT as a predictor of progressionfree survival in diffuse large B-cell lymphoma: a pilot study. Am J Nucl Med Mol Imaging 2013;3:272–81. [PMC free article] [PubMed] [Google Scholar]
- 25.Barrington SF, Kluge R. FDG PET for therapy monitoring in Hodgkin and non-Hodgkin lymphomas. Eur J Nucl Med Mol Imaging 2017; August;44(Suppl 1):97–110. [DOI] [PMC free article] [PubMed] [Google Scholar]
- 26.Yang et al. Interim PET/CT-based prognostic model for the treatment of diffuse large B cell lymphoma in the post-rituximab era. Ann Hematol (2013) 92:471–479. [DOI] [PubMed] [Google Scholar]
- 27.Jiang M, Chen P, Ruan X, et al. Interim (18)F-FDG PET/CT improves the prognostic value of S-IPI, R-IPI and NCCN-IPI in patients with diffuse large B-cell lymphoma. Oncol Lett. 2017;14(6):6715–6723. [DOI] [PMC free article] [PubMed] [Google Scholar]
- 28.Kim TM, Paeng JC, Chun IK, Keam B, Jeon YK, Lee SH, Kim DW, Lee DS, Kim CW, Chung JK, Kim IH, Heo DS. Total lesion glycolysis in positron emission tomography is a better predictor of outcome than the international prognostic index for patients with diffuse large B cell lymphoma. Cancer. 2013;119:1195–202 [DOI] [PubMed] [Google Scholar]


