Abstract
Osteoarthritis (OA), also known as degenerative arthritis, affects millions of people all over the world. OA occurs when the cartilage wears down over time, which is a worldwide complaint. The aim of this study was to screen and verify hub genes involved in developmental chondrogenesis as well as to explore potential molecular mechanisms.
The expression profiles of GSE51812 were downloaded from the Gene Expression Omnibus (GEO) database, which contained 9 samples, including 6-week pre-chondrocytes (PC, 6 independent specimens) and 17-week fetal periarticular resting chondrocytes (RC, 3 independent specimens). The raw data were integrated to obtain differentially expressed genes (DEGs) and were further analyzed with bioinformatics analysis. The Gene Ontology (GO) and pathway enrichment of DEGs were conducted via Database for Annotation, Visualization, and Integrated Discovery (DAVID). The protein-protein interaction (PPI) networks of the DEGs were constructed based on data from the search tool for the retrieval of interacting genes (STRING) database. An intersection figure was provided to show the relationship between the DEGs identified in this study and genes from any existed related studies.
A total of 9486 DEGs, including 4821 upregulated genes and 4665 downregulated genes were observed. The top 30 developmental chondrogenesis associated genes were identified, including matrix metalloproteinase (MMP)1, MMP3, MMP13, prostaglandin-endoperoxide synthase 2 (PTGS2), and so on. The majority of DEGs, including PTGS2, CCL20, CHI3L1, LIF, CXCL8, and CXCL12 were intensively enriched in immune-associated biological process terms, including inflammatory, and immune responses. Additionally, the majority of DEGs were mainly enriched in NF-kappa β (NF-kβ) signaling pathway and tumor necrosis factor (TNF) signaling pathway. The hub genes identified in STRING and Cytoscape databases included MMP1, MMP3, MMP13, PTGS2 and so on. Among the top 30 upregulated and downregulated DEGs, there were 15 genes have been reported to be associated with OA or developmental chondrogenesis.
This large scale gene expression study observed genes associated with human developmental chondrogenesis and their relative GO function, which may offer opportunities for the research for cartilage tissue engineering and novel insights into the prevention of OA in the near future.
Keywords: bioinformatics analysis, enrichment analysis, human developmental chondrogenesis, PPI network module
1. Introduction
Articular cartilage protects bones of diarthrodial joints from load bearing and impact. It promotes nearly frictionless motion between the articular surfaces.[1,2] Osteoarthritis (OA) is a common clinical disease involving degradation of joints,[3–5] which was usually caused by cartilage injury and the lack of cartilage regeneration. This disease can occur in any joint, but mainly in the hip joint, knee joint, hand joint and spine facet joint. OA currently affects about 20 million people in the United States alone, which makes joint-surface restoration a major priority in modern medicine.[6]
Microarrays play an important role in the analysis of gene expression, which served as key tools in medical oncology with great clinical application.[7–9] Recently, a large number of gene expression profiling researches have been reported with the use of microarray technology. Many differentially expressed genes (DEGs) involved in different biological processes, pathways, or molecular functions have been revealed.[10,11] Comparative analysis in independent studies indicated a relatively limited degree of overlap. However, expression profiling techniques combining with integrated bioinformatics methods might solve the disadvantages.[12–14]
The present study is aimed to identify biomarkers and pathways involved in human developmental chondrogenesis with microarray gene expression profile and bioinformatics analysis. Based on the results of biological functions and pathways, these key genes and pathways involved in human developmental chondrogenesis could make substantial progress in cartilage tissue engineering, which may be helpful for the prevention of OA.
2. Materials and methods
2.1. Microarray data
The gene expression profiles GSE51812 were downloaded from the National Center for Biotechnology Information Gene Expression Omnibus DataSets (https://www.ncbi.nlm.nih.gov/gds) and were based on the Affymetrix Human Genome U133 Plus 2.0 Array. As described by Wu et al,[2] adult articular chondrocytes (N = 6) were obtained from National Disease Research Interchange. Postnatal, healthy, paraffin-embedded joint and growth plate specimens (N = 3) were kindly donated by Dr Marcel Karperien from the University of Twente (Netherlands). A total of 9 chips was used in this study, including 6 laser-capture microdissection (LCM) isolated pre-chondrocytes in chondrogenic condensations at week 6 of embryogenesis and 3 articular chondrocytes at week 17 of development. Background corrected signal intensities were determined by the MAS 5.0 software (Affymetrix). The normalization of datasets obtained on Affymetrix arrays and top 30 upregulated and downregulated DEGs were conducted by the preprocessCore package in R.[15] The results can provide insights into molecular markers during the process of pre-chondrocyte maturation.
2.2. Data preprocessing and DEGs screening
The raw data were preprocessed via Affy package of R language. Multiple Linear Regression limma was used for DEGs analysis.[16] We used the ComBat function of sva package to remove known batch effects from microarray data (2). The DEGs of each series was analyzed by the same method without sva package. Volcano plot was used to display both total DEGs and top 30 upregulated and downregulated DEGs. That was generated with ggplots package of R language. DEGs were identified using classical t test and statistically significant DEGs were defined with log2 fold change (log2 FC) >1 and P <.01 as the cut-off criterion.
2.3. Hierarchical clustering analysis
A bidirectional hierarchical clustering heatmap of total DEGs and top 30 upregulated and downregulated DEGs were constructed using gplots package of R language after extracting the expression values from the gene expression profile.[17]
2.4. Functional and pathway enrichment analysis
Gene ontology (GO) defines concepts or classes used to describe gene function and relationships. It classifies functions along 3 aspects: biological process (BP), cellular component (CC) and molecular function (MF). Kyoto Encyclopedia of Genes and Genomes (KEGG) is a database resource to understand high-level functions and utilities of biological system. The Database for Annotation, Visualization, and Integrated Discovery (DAVID) (https://david.ncifcrf.gov/tools.jsp) was used to classify significant DEGs by their biological processes, cellular components or molecular functions via GO and the significant trans cripts (Benjamini–Hochberg false discovery rate <0.05) were identified using the Functional Annotation clustering tool.[18] The DAVID database was also used to perform pathway enrichment analysis with reference from KEGG database website and Benjamini–Hochberg false discovery rate (FDR) <0.05 was considered as a cut-off point.
2.5. Protein-protein interaction network construction and module analysis
The search tool for the retrieval of interacting genes (STRING) version 10.5 (http://www. string-db.org/), a web biological database for prediction of known and unknown protein interaction relationships, was used to construct the protein-protein interaction (PPI) networks.[19] The top 30 upregulated and downregulated DEGs were selected to construct the PPI network. The results were visualized by Cytoscape software version 3.5.[20]
2.6. Cross-validation of top 30 DEGs and genes from related studies
The Bioinformatics & Evolutionary Genomics (http://bioinformatics.psb.ugent.be/webtools/Venn/) was used to construct the Venn diagram containing the top 30 DEGs and genes from existed related studies.
3. Results
3.1. Normalization of datasets
The data of gene expression was downloaded from gene expression omnibus (GEO) database (http://www.ncbi.nlm.nih.gov/geo/) (GEO accession no. GSE51812). Normalization of the data of gene expression was performed using the preprocessCore package in R and presented in a boxplot (Fig. 1). The normalization of total differentially expressed genes was shown in Figure 1A and 1B, while the normalization of the top 30 differentially expressed genes was shown in Figure 1C and 1D. The black lines in Figure 1B and Figure 1D are basically at the same level, indicating a high consistency.
Figure 1.
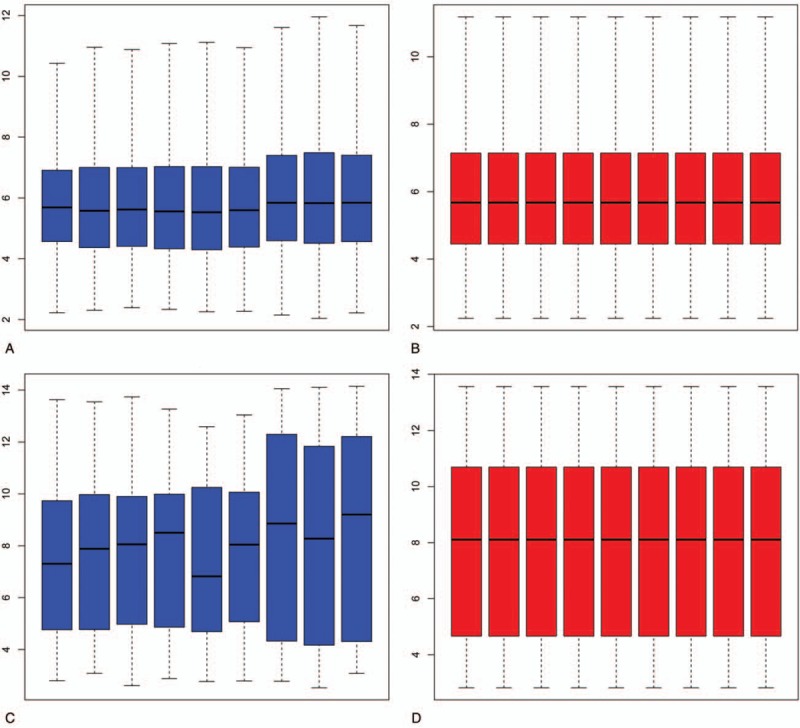
Normalization of samples. (A) Before normalization of total DEGs and (B) following normalization of total DEGs, (C) Before normalization of top 30 upregulated and downregulated DEGs and (D) following normalization of top 30 upregulated and downregulated DEGs. 1-6 = 6-week PC, 6 independent specimens, 7-9 = 17-week RC, 3 independent specimens. DEGs = differentially expressed genes, PC = prechondrocytes, RC = resting chondrocytes.
3.2. Differentially gene expression
Gene expression in 6-week pre-chondrocytes (PC) was compared with that in 17-week resting chondrocytes (RC). A total of 9486 differentially expressed genes were observed. Among them, 4821 genes were upregulated and 4665 genes were downregulated in 6-week PC compared with 17-week RC (Fig. 2A and Fig. 3A). An expression volcano plots and heat map of the top 30 upregulated and downregulated DEGs were indicated in Fig. 2B and Fig. 3B.
Figure 2.
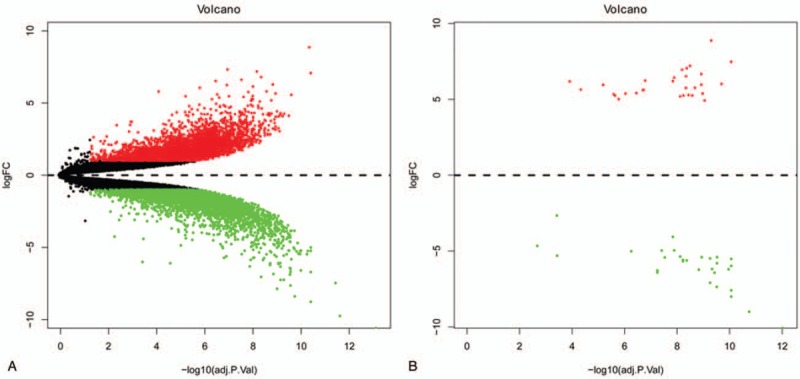
Volcano plot showing A. all DEGs and B. top 30 upregulated and downregulated DEGs in 17-week RC compared to 6-week PC. Grey represents no change in expression. Green represents down-regulation. Red represents up-regulation. DEGs = differentially expressed genes, PC = prechondrocytes, RC = resting chondrocytes.
Figure 3.
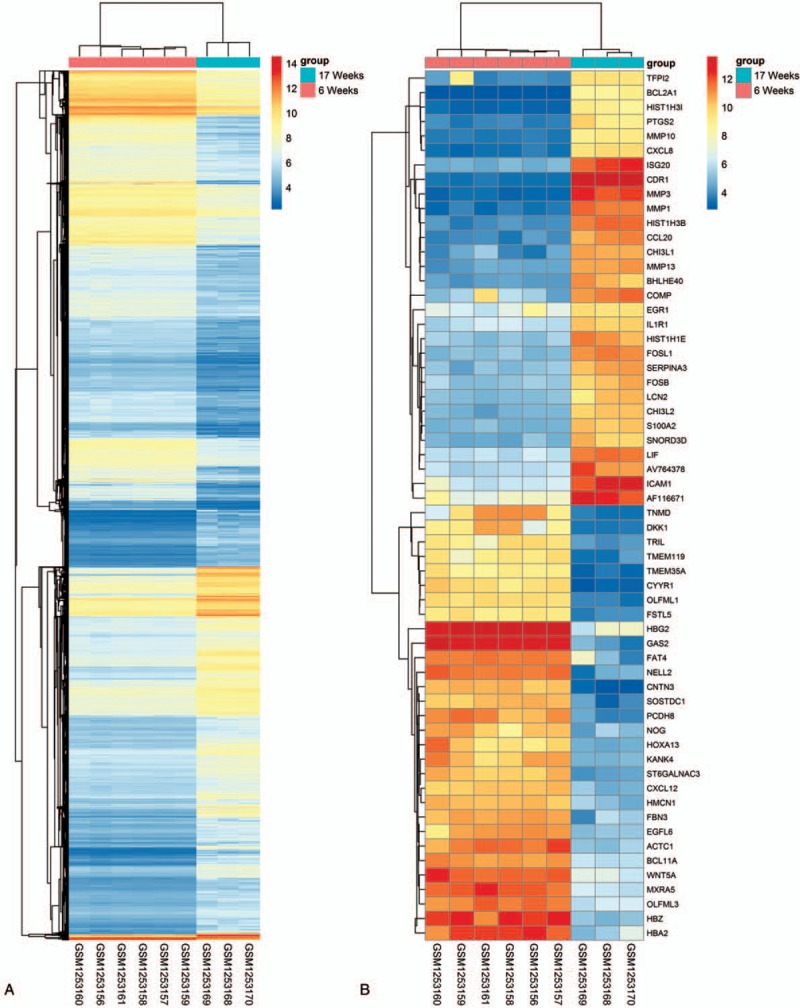
Heat map showing A. all and B. top 30 up-regulated and down-regulated differentially expressed genes in 17-week RC compared to 6-week PC. The expression values are log2 fold changes (>1 or <−1). Blue represents down-regulation and red represents up-regulation. PC = prechondrocytes, RC = resting chondrocytes.
3.3. Functional annotation of candidate genes
The pathways and associated biological processes of top 30 developmental chondrogenesis associated candidate genes were detected via the GO BP terms and KEGG pathway analyses. The top 10 GO BP terms were presented in Table 1. the majority of the top 30 upregulated and downregulated DEGs, including prostaglandin-endoperoxide synthase 2 (PTGS2), CCL20, CHI3L1, LIF, CXCL8, and CXCL12 were intensively enriched in immune-associated biological process terms, including inflammatory and immune responses. Moreover, ICAM1, COMP, and CNTN3 were involved in cell adhesion. In addition, the top 10 KEGG pathway were presented in Table 2. The majority of the top 30 upregulated and downregulated DEGs were mainly enriched in NF-kβ signaling pathway and tumor necrosis factor (TNF) signaling pathway.
Table 1.
GO analysis of top 30 upregulated and downregulated DEGs.

Table 2.
Top 10 KEGG pathway of top 30 upregulated and downregulated DEGs.

3.4. PPI network construction
According to the information in STRING and Cytoscape databases, the PPI relationships of top 30 upregulated and downregulated DEGs were obtained (Fig. 4). The hub genes included matrix metalloproteinase (MMP)1, MMP3, MMP13, PTGS2, and so on. Among these genes, MMP1, MMP3, and MMP13 possessed the highest node degree.
Figure 4.
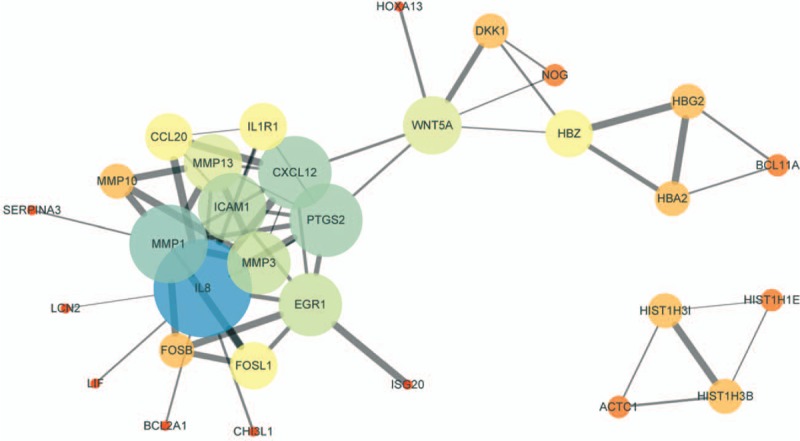
PPI network of top 30 DEGs was constructed and visualized by Cytoscape software. Low value of combined score to circle with small size or bright colors and line with small sizes. DEGs = differentially expressed genes, PPI = Protein-protein interaction.
3.5. Venn diagram containing the top 30 DEGs and genes from existed related studies
Many related studies have reported some genes involved in OA or developmental chondrogenesis. Cross-validation containing the top 30 DEGs and genes from related studies would be helpful for further research of OA. Among the top 30 upregulated and downregulated DEGs, there were 15 genes have been reported to be related to OA or developmental chondrogenesis (Fig. 5).
Figure 5.
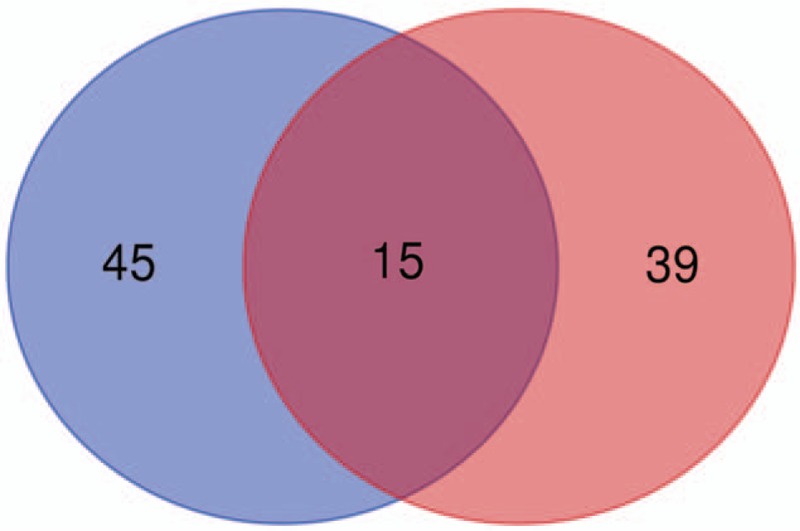
Venn diagram containing the top 30 DEGs and genes from existed related studies. A. Top 30 DEGs, B. Genes from existed related studies. Among the top 30 DEGs, there were 15 genes have been reported to be related to OA or developmental chondrogenesis (MMP-1, MMP-3, MMP-13, CCL20, LIF, CHI3L2, CXCL12, WNT5A, SERPINA3, IL1R1, LCN2, CHI3L1, ICAM1, DKK1, and COMP). DEGs = differentially expressed genes, OA = osteoarthritis.
4. Discussion
OA is a common chronic disease that afflicts the middle-aged and elderly individuals. According to statistics, the probability of this disease in male is approximately 40% while in female it is around 47%. Moreover, the incidence of people over 50 years old is rapidly increasing over time.[21] Osteoarthritis is characterized by a decrease in articular cartilage tissue, thickening of subchondral bone, and formation of callus.[22] At present, the etiology of osteoarthritis has not yet been clarified. On the surface of existing research, the occurrence of osteoarthritis is related to factors such as age, gender, family history, obesity, trauma and increased weight bearing of the joints.[23] The incidence of osteoarthritis is positively correlated with age, and the study of its etiology and pathogenesis plays an important role in early diagnosis, termination of disease progression and effective treatment. Gene expression studies have been widely used to analyze DEGs and identify novel pathways. In this study, DEGs in 6-week PC compared with 17-week RC were identified based on gene expression profiling, among which 4821 upregulated genes and 4665 downregulated genes were observed.
Furthermore, functional enrichment analysis of the top 30 genes associate with chondrogenesis was performed to demonstrate the possible biological mechanisms. The top 10 pathways and associated biological processes were detected via the GO BP terms and KEGG pathway analyses. The majority of the top 30 upregulated and downregulated DEGs, including PTGS2, CCL20, CHI3L1, LIF, CXCL8, and CXCL12 were intensively enriched in immune-associated biological process terms, including inflammatory and immune responses. Moreover, ICAM1, COMP, and CNTN3 were involved in cell adhesion. In addition, the majority of the top 30 upregulated and downregulated DEGs were mainly enriched in NF-kappa B signaling pathway and TNF signaling pathway.
The PPI network of top 30 upregulated and downregulated DEGs was constructed. The results indicated that MMP1, MMP3, MMP13, and PTGS2 were hub genes. According to previous study, PTGS2, MMP1, MMP3, and MMP13 play a crucial role in the degeneration of articular cartilage, which accelerates the destruction of articular cartilage. MMP-1, also known as collagenase-1, is the first MMPs to be characterized and isolated from human fibroblasts. It is a fibroblastic collagenase that hydrolyzes collagen, gelatin such as I, II, III, VII, VIII, cell adhesive and aggrecan. It is abundantly expressed in OA cartilage and acts on newly synthesized type II collagen. In the case of compression or damage of chondrocytes, chondrocytes synthesize MMP-1 in a large amount, and the site of action is located at the Gly775-Leu776 site on the newly formed type II collagen alpha chain in the cartilage matrix, which is cleaved into 2. The A and B segments, which are 1/4 and 3/4 long, respectively, can be further decomposed by other MMPs. Type II collagen cleavage, destruction of collagen network structure, decomposition or loss of proteoglycans in ECM accelerated the degradation of cartilage matrix, destruction of cartilage and defects, leading to OA. Additionally, Freemont et al[24] found that the expression sites of MMP1 and MMP3 in human knee OA cartilage were specific, and the abnormal expression period was not the same. MMP1 was mainly abnormal in the superficial layer of cartilage, and MMP3 was abnormally expressed in the deep layer of cartilage. MMP3 increased significantly in the early and late stages of OA. Moreover, MMP13, also known as collagenase 3, is mainly secreted by chondrocytes and is the most effective type II collagen degrading enzyme in the MMPs family.[25] Its degradation ability is 5 to 10 times stronger than that of MMP1. MMP-13 can directly degrade the most abundant and characteristic type II collagen in ECM. Compared with MMP1, MMP13 plays a more significant role during cartilage degeneration. Although MMP1 and MMP13 cannot directly degrade proteoglycans, proteoglycans are mainly linked with type II collagen and hyaluronic acid in the form of polymers. MMP1 and MMP13 directly degrade type II collagen, which leads to the loss of the connection of proteoglycans and type II collagen. It further leads to the loss of proteoglycan, indirectly reduces the content of proteoglycan and causes the mechanical properties and deformation ability of cartilage to decrease, which accelerates the degeneration process of articular cartilage.[26] Construction of PPI network of DEGs may be helpful for understanding the relationship of developmental chondrogenesis and OA. Additionally, cross-validation was performed to explore the relationship between the top 30 DEGs and genes from related studies. Among the top 30 upregulated and downregulated DEGs, there were 15 genes have been reported to be related to OA or developmental chondrogenesis. For instance, DKK1 levels correlate with osteoarthritis and are regulated by OA associated factors.[27] CXCL12 levels are correlated with disease severity in patients with knee OA.[28] Analysis of relationship between the top 30 DEGs and genes from related studies would be helpful for further study of OA and human developmental chondrogenesis.
In conclusion, the present study provides significant information that may aid in understanding the molecular mechanisms of developmental chondrogenesis. The top 30 upregulated and downregulated DEGs associated with developmental chondrogenesis were observed in this study, which may facilitate the research for cartilage tissue engineering and prevention of OA in the near future.
Acknowledgments
The authors would like to thank all co-investigators, and colleagues who made this study possible. The authors thank Dr Ayub Abdulle nur and Dr Chenxi Li for English language support in preparing manuscript.
Author contributions
Conceptualization: Jian Zhou, Wanchun Wang, Yingquan Luo.
Data curation: Jian Zhou, Xiadong Du, Wanchun Wang.
Formal analysis: Jian Zhou, Wanchun Wang.
Funding acquisition: Jian Zhou, Wanchun Wang.
Investigation: Jian Zhou, Yingquan Luo.
Methodology: Jian Zhou.
Software: Jian Zhou, Anqi Yu, Shuo Jie.
Validation: Jian Zhou, Anqi Yu, Xiadong Du, Tang Liu.
Writing – original draft: Jian Zhou, Wanchun Wang.
Writing – review & editing: Jian Zhou, Chenxi Li, Anqi Yu, Shuo Jie, Tang Liu, Wanchun Wang, Yingquan Luo.
Footnotes
Abbreviations: DAVID = Database for Annotation, Visualization, and Integrated Discovery, DEGs = differentially expressed genes, GEO = gene expression omnibus, GO = gene ontology, KEGG = Kyoto Encyclopedia of Genes and Genomes, MMP = matrix metalloproteinase, NF-kβ = NF-kappa β, OA = osteoarthritis, PC = prechondrocytes, PPI = protein-protein interaction, PTGS2 = prostaglandin-endoperoxide synthase 2, RC = resting chondrocytes, STRING = search tool for the retrieval of interacting genes, TNF = Tumor necrosis factor.
The datasets used and/or analyzed during the present study are available from the corresponding author on reasonable request.
This work was supported by the Mittal Innovation Project of Central South University, the Fundamental Research Funds for the Central Universities of Central South University (Grant No. 2018zzts930), the Central South University Sports Medicine Scholarship, the National College Students’ Innovation and Entrepreneurship Training Program (Grant No. 201710422116).
The authors report no conflicts of interest.
References
- [1].Buckwalter JA, Mankin HJ. Articular cartilage repair and transplantation. Arthritis Rheum 1998;41:1331–42. [DOI] [PubMed] [Google Scholar]
- [2].Wu L, Bluguermann C, Kyupelyan L, et al. Human developmental chondrogenesis as a basis for engineering chondrocytes from pluripotent stem cells. Stem Cell Reports 2013;1:575–89. [DOI] [PMC free article] [PubMed] [Google Scholar]
- [3].Zhou J, Xiao Y, Li C, et al. Association between use of non-steroidal anti-inflammatory drugs and risk of myocardial infarction in patients with spondyloarthritis and osteoarthritis. Ann Rheum Dis 2018;Epub ahead of print. [DOI] [PubMed] [Google Scholar]
- [4].Zhou J, Liu B, Li C, et al. Treatment of hip osteoarthritis with glucocorticoids. Ann Rheum Dis 2018;Epub ahead of print. [DOI] [PubMed] [Google Scholar]
- [5].Hutton CW. Osteoarthritis: the cause not result of joint failure. Ann Rheum Dis 1989;48:958–61. [DOI] [PMC free article] [PubMed] [Google Scholar]
- [6].Becker L. Musculoskeletal Conditions in the United States. Occup Injury Illnesses 1999;93–8. (https://www.researchgate.net/publication/288346741_Musculoskeletal_Conditions_in_the_United_States). [Google Scholar]
- [7].He P, Zhang Z, Liao W, et al. Screening of gene signatures for rheumatoid arthritis and osteoarthritis based on bioinformatics analysis. Mol Med Rep 2016;14:1587–93. [DOI] [PMC free article] [PubMed] [Google Scholar]
- [8].Li Z, Wang Q, Chen G, et al. Integration of gene expression profile data to screen and verify hub genes involved in osteoarthritis. Biomed Res Int 2018;2018:9482726. [DOI] [PMC free article] [PubMed] [Google Scholar]
- [9].Lu QY, Han QH, Li X, et al. Analysis of differentially expressed genes between rheumatoid arthritis and osteoarthritis based on the gene co-expression network. Mol Med Rep 2014;10:119–24. [DOI] [PubMed] [Google Scholar]
- [10].Takeshita M, Kuno A, Suzuki K, et al. Alteration of matrix metalloproteinase-3 O-glycan structure as a biomarker for disease activity of rheumatoid arthritis. Arthritis Res Ther 2016;18:112. [DOI] [PMC free article] [PubMed] [Google Scholar]
- [11].Lu C, Xiao C, Chen G, et al. Cold and heat pattern of rheumatoid arthritis in traditional Chinese medicine: distinct molecular signatures indentified by microarray expression profiles in CD4-positive T cell. Rheumatol Int 2012;32:61–8. [DOI] [PMC free article] [PubMed] [Google Scholar]
- [12].Lu W, Li G. Identification of key genes and pathways in rheumatoid arthritis gene expression profile by bioinformatics. Acta Reumatol Port 2018;43:109–31. [PubMed] [Google Scholar]
- [13].Lv D, Su C, Li Z, et al. Expression of long noncoding RNAs in chondrocytes from proximal interphalangeal joints. Mol Med Rep 2017;16:5175–80. [DOI] [PMC free article] [PubMed] [Google Scholar]
- [14].Gang X, Sun Y, Li F, et al. Identification of key genes associated with rheumatoid arthritis with bioinformatics approach. Medicine (Baltimore) 2017;96:e7673. [DOI] [PMC free article] [PubMed] [Google Scholar]
- [15].Bolstad BM, Irizarry RA, Astrand M, et al. A comparison of normalization methods for high density oligonucleotide array data based on variance and bias. Bioinformatics 2003;19:185–93. [DOI] [PubMed] [Google Scholar]
- [16].Phipson B, Lee S, Majewski IJ, et al. Robust hyperparameter estimation protects against hypervariable genes and improves power to detect differential expression. Ann Appl Stat 2016;10:946–63. [DOI] [PMC free article] [PubMed] [Google Scholar]
- [17].Li Y, Wang B, Lv G, et al. Obtain osteoarthritis related molecular signature genes through regulation network. Mol Med Rep 2012;5:177–83. [DOI] [PubMed] [Google Scholar]
- [18].Dennis GJ, Sherman BT, Hosack DA, et al. DAVID: database for annotation, visualization, and integrated discovery. Genome Biol 2003;4:3. [PubMed] [Google Scholar]
- [19].von Mering C, Huynen M, Jaeggi D, et al. STRING: a database of predicted functional associations between proteins. Nucleic Acids Res 2003;31:258–61. [DOI] [PMC free article] [PubMed] [Google Scholar]
- [20].Shannon P, Markiel A, Ozier O, et al. Cytoscape: a software environment for integrated models of biomolecular interaction networks. Genome Res 2003;13:2498–504. [DOI] [PMC free article] [PubMed] [Google Scholar]
- [21].Neogi T, Zhang Y. Epidemiology of osteoarthritis. Rheum Dis Clin North Am 2013;39:1–9. [DOI] [PMC free article] [PubMed] [Google Scholar]
- [22].Poulet B, Staines KA. New developments in osteoarthritis and cartilage biology. Curr Opin Pharmacol 2016;28:8–13. [DOI] [PubMed] [Google Scholar]
- [23].Allen KD, Golightly YM. State of the evidence. Curr Opin Rheumatol 2015;27:276–83. [DOI] [PMC free article] [PubMed] [Google Scholar]
- [24].Freemont AJ, Hampson V, Tilman R, et al. Gene expression of matrix metalloproteinases 1, 3, and 9 by chondrocytes in osteoarthritic human knee articular cartilage is zone and grade specific. Ann Rheum Dis 1997;56:542–9. [DOI] [PMC free article] [PubMed] [Google Scholar]
- [25].Mitchell PG, Magna HA, Reeves LM, et al. Cloning, expression, and type II collagenolytic activity of matrix metalloproteinase-13 from human osteoarthritic cartilage. J Clin Invest 1996;97:761–8. [DOI] [PMC free article] [PubMed] [Google Scholar]
- [26].Homandberg GA. Potential regulation of cartilage metabolism in osteoarthritis by fibronectin fragments. Front Biosci 1999;4:D713–30. [DOI] [PubMed] [Google Scholar]
- [27].Leijten JC, Bos SD, Landman EB, et al. GREM1, FRZB and DKK1 mRNA levels correlate with osteoarthritis and are regulated by osteoarthritis-associated factors. Arthritis Res Ther 2013;15:R126. [DOI] [PMC free article] [PubMed] [Google Scholar]
- [28].He W, Wang M, Wang Y, et al. Plasma and synovial fluid CXCL12 levels are correlated with disease severity in patients with knee osteoarthritis. J Arthroplasty 2016;31:373–7. [DOI] [PubMed] [Google Scholar]


