Abstract
To establish magnetic resonance imaging (MRI) features that differentiate residual tumors from postoperative surgical changes following the transsphenoidal approach of a pituitary adenoma.
We analyzed residual enhancements at the tumor bed in 52 patients who underwent dynamic contrast-enhanced sella MRI within 48 hours after surgery and at 6 to 28 months. Patients were divided into 2 groups defined by either peripheral or nodular enhancement patterns. For each group, we measured the maximum thickness of the residual enhancing portion and compared differences in the residual tumor and postoperative changes.
Among the tumors examined in the 52 patients, 19 residual tumors showed nodular (n = 16) and peripheral (n = 3) enhancement patterns, and 33 postoperative changes showed nodular (n = 3) and peripheral (n = 30) enhancement patterns. The mean residual tumor thickness was 7.1 mm (range, 2.9–16.8 mm) and 1.9 mm (range, 1.0–7.4 mm) in the postoperative change. Receiver operating characteristic curve analysis revealed that a 3.9-mm thickness was associated with 89% sensitivity, 97% specificity, and 94% accuracy for diagnosis of residual tumor.
On immediate postoperative MRI, residual enhancement with greater than 3.9-mm thickness and nodular pattern suggest residual pituitary adenoma tumor.
Keywords: dynamic magnetic resonance imaging, pituitary adenoma, pituitary diseases, pituitary neoplasms, transsphenoidal approach
1. Introduction
Magnetic resonance imaging (MRI) is frequently used in the postoperative follow-up of pituitary adenoma, particularly nonfunctioning adenoma.[1–4] Most residual pituitary tumors are in areas where surgery is difficult, such as the cavernous sinus, the suprasellar cistern (in very firm tumors), or the posterior clivus. However, not all residual tumors are located in these areas. Several studies have reported that immediate postoperative MRI can establish baseline postoperative status and immediately detect postoperative complications.[2,3,5] The interpretation of postoperative MR images of the sella turcica region is difficult because the postoperative appearance of the excision site depends on numerous factors, such as the size and extent of the adenoma before surgery, the surgical approach, the quality and amount of implanted materials, and the time course of resorption of postoperative changes.[1] The height of the pituitary mass might not return to normal immediately after surgery because of blood clot accumulation in the sella, packing material such as muscle or fat in the sella, or adhesion between the diaphragm sellae and overlying tumor or brain tissue.[6] Early detection of residual tumors is an opportunity for an immediate second operation, via the same transsphenoidal approach, before adhesion develops at the operation site. A previous study that analyzed early postoperative MRI following transsphenoidal resection, attempted to differentiate residual tumors from postoperative surgical changes. They found that all patients with a residual tumor showed nodular or combined nodular and peripheral enhancement.[7] However, this study, which investigated the enhancement patterns of the postoperative pituitary mass, was constrained by the lack of a sensitive, objective method for detecting residual tumors.
The purpose of this study was to establish diagnostic features of immediate postoperative MR imaging that differentiate residual tumors from postoperative surgical changes after the transsphenoidal resection of a pituitary adenoma.
2. Materials and methods
2.1. Patients
A total of 52 patients with pituitary mass, showing suprasellar extension on preoperative MRI and pathologically confirmed pituitary adenoma, were retrospectively reviewed from May 2012 to March 2015 at the Samsung Medical Center in Seoul, South Korea. All patients underwent dynamic contrast-enhanced sella MRI preoperatively, within 48 hours after surgery, and during the following 6 to 28 months. MR images with severe artifacts affecting image interpretation were excluded. The institutional review board of the hospital (Samsung Medical Center) approved the study and the board waived the requirement of informed consent because there are no human beings or animals involved in this study.
2.2. MR imaging
Magnetic resonance imaging was performed at 3-T (Achieva, Philips Medical Systems Best, The Netherlands) using 8-channel head coils. Conventional T1-weighted and T2-weighted imaging, conventional contrast-enhanced T1-weighted imaging, and dynamic contrast-enhanced MR imaging were performed. The coronal plane was acquired for each image and the sagittal plane was acquired for unenhanced conventional T1-weighted images. Unenhanced and contrast-enhanced T1-weighted images were obtained using spin echo sequence with repetition time (TR)/echo time (TE)/number of excitations (NEX) = 500/10/1; matrix = 256 × 205; section thickness = 2 mm, slice gap = 2 mm, flip angle (FA) = 70°; field of view (FOV) = 180 × 180 mm; and imaging time = 4 minutes.
Dynamic contrast-enhanced MR images were obtained after a single bolus injection of gadolinium-based MR contrast medium (gadoterate meglumine, Dotarem, Gurebet, Aulnay-sous-Bois, France; or gadobutrol, Gadovist, Bayer Schering Pharma, Berling, Germany) (0.1 mmol/kg body weight; injection rate = 1 ml/s) followed by a saline flush of 20 ml. We used a turbo spin echo sequence with TR/TE/NEX = 400–824/8.6–13/1; echo train length = 4; parallel image technique; SENSE factor = 2; matrix = 400 × 177; reconstruction matrix = 704; section thickness = 2.5–3.0 mm; no slice gap; FA = 90°; FOV = 180–210 × 180–210 mm.
2.3. Imaging analysis
Two neuroradiologists (S.T.K, a board-certified neuroradiologist with 18 years of experience and H.Y.K, a board-certified fellowship-trained radiologist) retrospectively and independently analyzed the MR images. Reviewers were blinded to patient identities and pathological and clinical data. The size of each initial pituitary mass using the largest (oblique) diameter on any coronal or sagittal image was measured. We measured the sizes of pituitary masses and identified displaced normal glands in preoperative MR images. Normal gland locations were demonstrated against the pituitary adenoma according to degree of enhancement on preoperative dynamic MR images. After surgery, criteria for differentiation of the normal gland from the residual enhancing lesion were established by analyzing the preoperative location and degree of enhancement on dynamic MR imaging. In postoperative MR images, we analyzed patterns of residual enhancing lesions and divided them into 2 groups: peripheral enhancement and nodular enhancement. For each group, we measured the maximum thickness of the residual enhancing portion excluding the normal gland, whose location was delineated on dynamic contrast-enhanced images from both preoperative and postoperative MRI (Fig. 1). If the peripheral enhancement had a submillimeter thickness, we regarded it as a 1-mm thickness. We compared differences between residual tumor and postoperative changes. Peripheral enhancement was defined as rim-like contrast enhancement in the periphery of the tumor bed with uniform thickness. Nodular enhancement was defined as a focal, nodular, enhancing lesion in the tumor bed with peripheral enhancement less than 1 mm thick or without peripheral enhancement. We defined residual tumors as lesions surgically confirmed by reoperation or residual enhancing lesions that were observed to be stable or growing upon follow-up MRI. Evaluation of residual lesions in the cavernous sinus was excluded from the postoperative MRI analysis. When observers were in disagreement, they discussed the findings until they reached a consensus.
Figure 1.
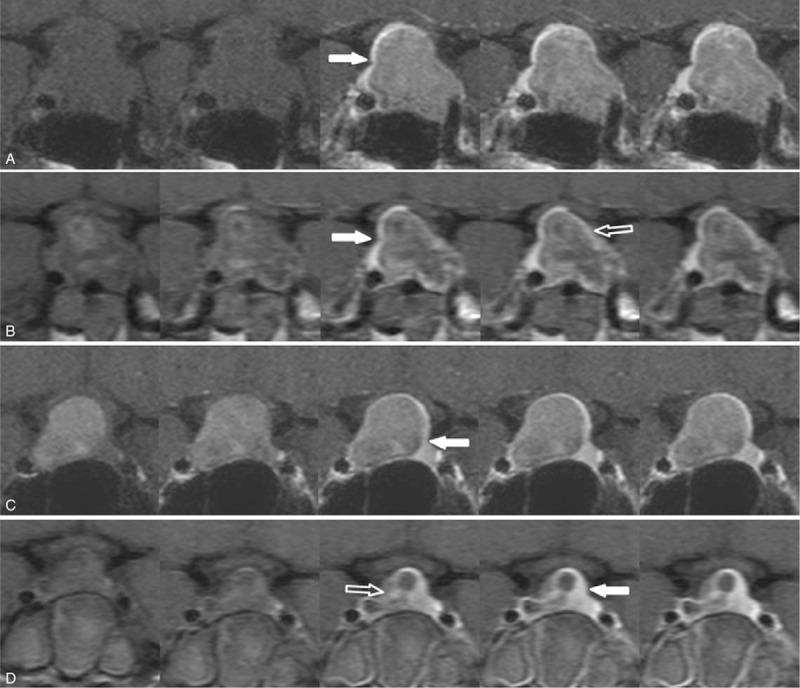
Normal gland on preoperative and postoperative dynamic contrast-enhanced MR images of 2 residual enhancement patterns. Peripheral enhancement pattern (a, b) and nodular enhancement pattern (c, d). On preoperative MRI (a, c), the location of the normal gland (solid arrows) was demonstrated against the pituitary adenoma. Upon immediate postoperative MRI (b, d), the normal gland (solid arrows) and residual enhancing lesion (open arrows) were delineated.MRI = magnetic resonance imaging.
2.4. Statistical analysis
Logistic regression analysis was applied to identify the related factors in distinguishing residual tumors from postoperative changes. The sensitivity, specificity, accuracy, and the area under the curve were used to determine diagnostic accuracy of the thickness of the residual enhancing lesion for differentiation between postoperative change and residual tumor. Statistical significance was accepted for P-values <.05 and the statistical analysis was performed using R software (http://www.r-project.org).
3. Results
There were 52 patients with pituitary macroadenoma who underwent preoperative, immediate postoperative, and follow-up sella MRI. The mean age of patients was 52.8 years (range, 15–75 years) and the study population was composed of 24 men and 28 women. Among the patients, 43 had nonfunctioning pituitary adenomas and 9 had functioning adenomas. Of the 9 functioning adenoma patients, 8 had growth hormone-secreting adenomas and 1 had a thyroid stimulating hormone-secreting adenoma. The mean size of preoperative pituitary masses was 23.5 mm (range, 9.9–50.1).
A residual tumor was confirmed in 19 patients; mean thickness was 7.1 mm (range, 2.9–16.8). Postoperative changes were confirmed in 33 patients; mean thickness was 1.9 mm (range, 1.0–7.4). Box plots were created for each group with or without residual tumor (Fig. 2).
Figure 2.
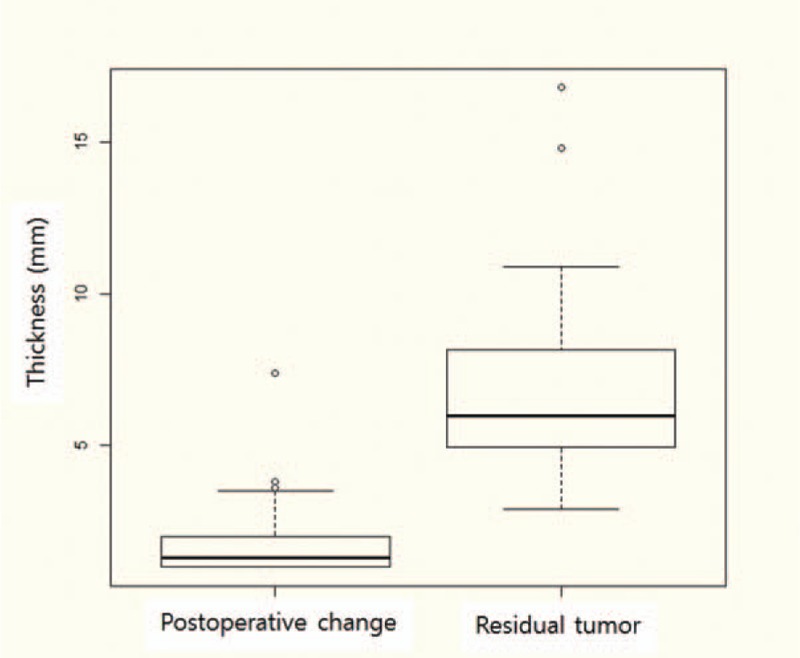
Thickness of residual enhancing lesions. The distributions of residual enhancing lesion thickness in the 2 groups. Thickness of postoperative changes and residual tumors were significantly different (P < .05). Horizontal line, median; ends of the boxes, upper and lower quartiles; vertical lines, full range of values.
The 19 patients with residual tumor were confirmed by a second operation in 2 patients and by follow-up MRI in 17 patients. Of these 19 patients, 14 showed increased lesion size upon follow-up MRI. The average interval between the operation and follow-up MRI at the time of increased lesion size was 7.3 months (range, 2.6–16.4). In the remaining 5 patients, the residual enhancing pituitary mass was unchanged upon follow-up MRI with an average follow-up period of 19.2 months (range, 14.4 –27.5). Patterns of residual enhancing lesions in postoperative MRI are shown in Table 1. Of 19 patients with confirmed residual tumors, most (74%) showed nodular enhancement (n = 16); peripheral enhancement (n = 3) was also seen.
Table 1.
Enhancement pattern and thickness of early postoperative pituitary mass.
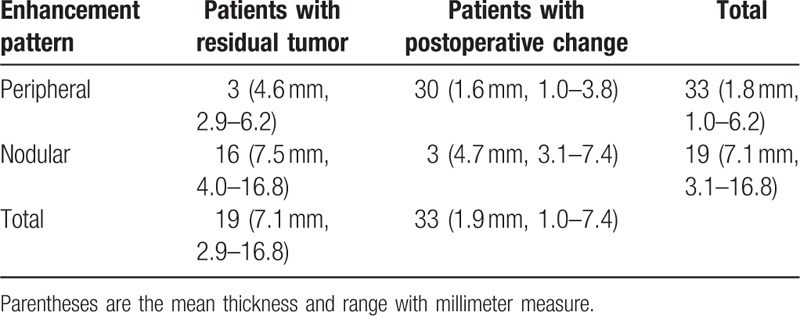
Of the total 52 patients, 33 showed peripheral enhancement with a mean thickness of 1.8 mm (range, 1.0–6.2). The mean thickness of peripheral enhancement without a residual tumor was 1.6 mm (range, 1.0–3.8), and the mean thickness of the residual tumor (Fig. 3) was 4.6 mm (range, 2.9–6.2). Nodular enhancement with a mean thickness of 7.1 mm was seen in 19 patients (range, 3.1–16.8). The mean thickness of nodular enhancement in residual tumors was 7.5 mm (range, 4.0–16.8), and the mean thickness of nodular enhancement with no residual tumor (Fig. 4) was 4.7 mm (range, 3.1–7.4).
Figure 3.
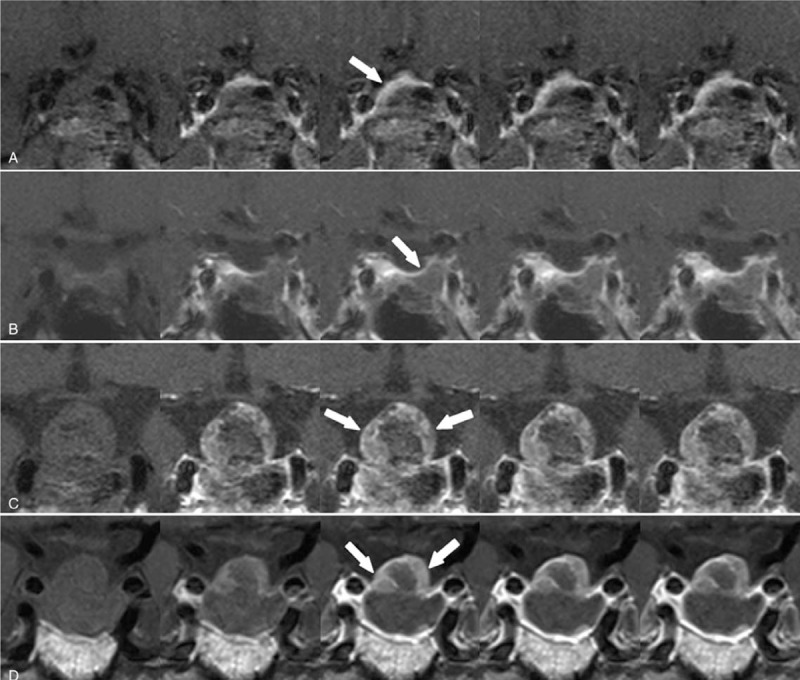
Peripheral enhancement pattern. A 44-yr-old woman with histologically confirmed pituitary adenoma. Dynamic contrast-enhanced coronal images obtained within 48 h after surgery showed (a) a residual enhancing lesion with a peripheral pattern (arrow) in the postoperative tumor bed. Dynamic-enhanced coronal images obtained 5 mo later (b) revealed involution of the enhancing lesion. A 71-yr-old man with histologically confirmed pituitary adenoma. Dynamic contrast-enhanced coronal images obtained 48 h after surgery showed (c) a residual enhancing lesion with a peripheral pattern (arrow) in the postoperative tumor bed. Dynamic-enhanced coronal images obtained 11 mo later (d) revealed persistent enhancing lesion, indicating residual tumor.
Figure 4.
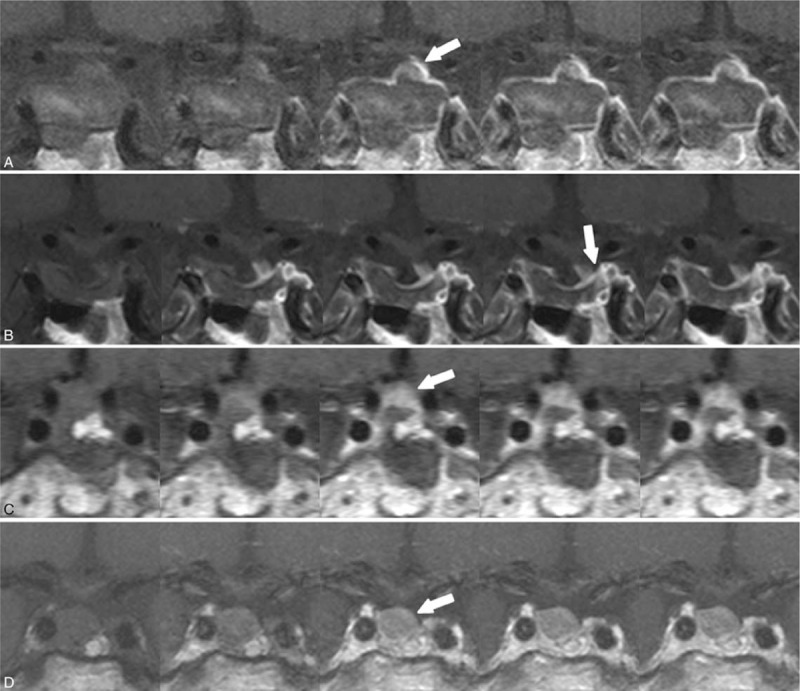
Nodular enhancement pattern. A 73-yr-old man with histologically confirmed pituitary adenoma. Dynamic contrast-enhanced coronal images obtained within 48 h after surgery showed (a) a residual enhancing lesion with a nodular pattern (arrow) in the postoperative tumor bed. Dynamic-enhanced coronal images obtained 16 mo later (b) revealed involution of the enhancing lesion. A 68-yr-old woman with histologically confirmed pituitary adenoma. Dynamic contrast-enhanced coronal images obtained within 48 h after surgery showed (c) a residual enhancing lesion with a nodular pattern (arrow) in the postoperative tumor bed. Dynamic-enhanced coronal images obtained 15 mo later (d) revealed a growing enhancing lesion, indicating residual tumor.
Receiver operating characteristic analysis for the thickness of residual enhancing lesions in postoperative changes versus residual tumors is shown in Figure 5. By analyzing threshold values, we observed that a thickness of 3.9 mm was associated with a sensitivity of 89%, specificity of 97%, and accuracy of 94% for residual tumor diagnosis.
Figure 5.
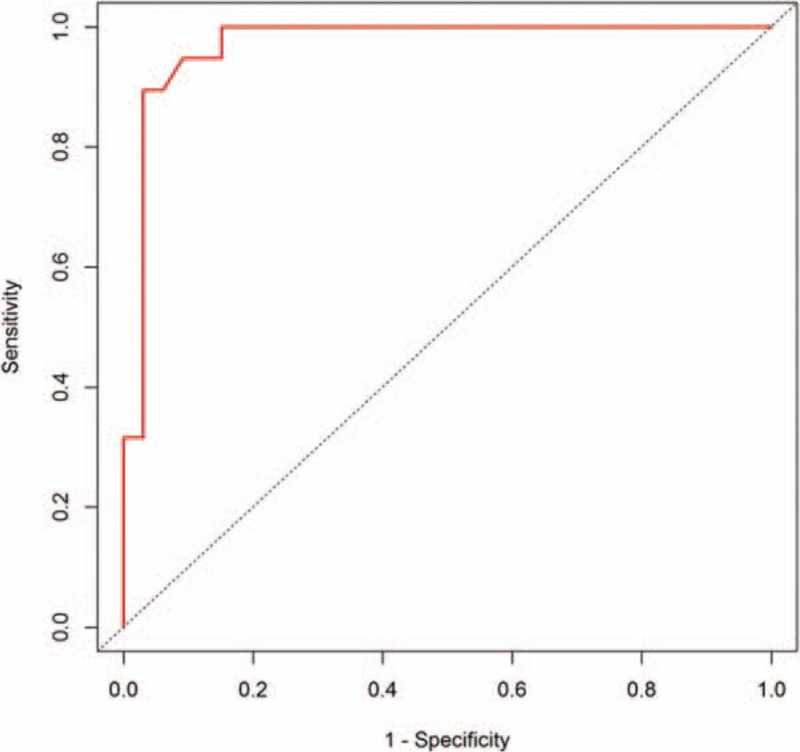
ROC curves for sensitivity, specificity, and accuracy of residual tumor diagnosis. By analyzing threshold values, 3.9-mm thickness was associated with 89% sensitivity, 97% specificity, and 94% accuracy for evaluating residual tumor on early postoperative MRI. MRI = magnetic resonance imaging, ROC = receiver operating characteristic.
4. Discussion
Pituitary adenomas are common lesions, accounting for approximately 10% to 15% of all primary intracranial neoplasms and between one-third and one-half of all sellar/juxtasellar masses.[8] Transsphenoidal microsurgery is the most common procedure for pituitary adenoma because of its safety and effectiveness.[9] According to Ciric et al,[10] the rate of recurrence after this operation is about 12%. Invasive pituitary adenoma is common and complete surgical removal is not possible in all cases. Macroadenomas with suprasellar extension and a height greater than 2.5 cm can be difficult to remove completely using transsphenoidal microsurgery.[6] In hormonally active pituitary adenomas, persistent or recurrent hypersecretion of hormones indicates residual or recurrent tumors requiring follow-up examination. Follow-up imaging might be necessary for nonfunctioning adenomas or suspected residual tumors at surgery. Several studies have reported on postoperative changes of the sella after transsphenoidal resection of a pituitary adenoma.[1–3,5] These studies did not emphasize detectability of a tumor upon follow-up MRI because it is difficult to differentiate a residual tumor from normal glands, implanted material, or postsurgical granulation tissue on follow-up MR images performed more than 6 months after surgery. Dina et al[2] mentioned residual tumors on early postoperative MR images but the study had few cases with residual tumors. Rodriguez et al[3] also reported early postoperative changes of the sella but did not address residual tumors. Yoon et al[7] reported early postoperative MRI and residual tumor in a relatively large population of patients who underwent early postoperative MRI within 7 days after surgery and follow-up MRI every 6 months thereafter. None of the patients with peripheral rim enhancement had a residual tumor; the study regarded peripheral rim enhancement as a compressed normal pituitary gland or pseudocapsule around the tumor. In that study, follow-up images showed that peripheral rim enhancement had disappeared and the normal gland had expanded in the pituitary fossa. The authors proposed that the nodular portion of an early postoperative pituitary mass was a residual tumor because the normal gland did not fully reexpand in the early period after surgery and the nodular portion showed the same signal intensity and contrast enhancement as the preoperative adenoma. Although Yoon et al[7] considered postoperative changes and residual tumors in early postoperative MRI, they did not show a quantitative standard for differentiating these occurrences. Our study divided patients into 2 categories based on the contrast enhancement pattern of the postoperative tumor bed and the measured thickness of the residual enhancing portion in each group. Several reports have suggested that peripheral enhancement on MR images in the postoperative period is a compressed normal pituitary gland.[1,2,7] In our study, most patients with peripheral enhancement patterns (91%) showed involution on follow-up MRI. However, 3 patients had a peripheral enhancement pattern that was stable or increasing upon follow-up MRI. Normal pituitary glands showed different degrees of enhancement compared to tumors and remaining enhancing portions on dynamic contrast-enhanced images on both preoperative and postoperative MR imaging; thus, displaced normal glands can be delineated and discriminated from tumors and postoperative residual enhancing lesions. Contrary to a previous report,[7] in our study, 3 patients with nodular enhancement patterns showed involution of 3.1 mm, 3.5 mm, and 7.4 mm upon follow-up MRI.
In our study, analysis of the thickness of overall residual enhancing lesions showed that a thickness greater than 3.9 mm is associated with 89% sensitivity, 97% specificity, and 94% accuracy in evaluating residual tumor on early postoperative MR images. Our results indicate that residual enhancing lesions that show involution on follow-up MRI may be extremely compressed normal pituitary glands, pseudocapsule swelling, or residual tumors that have experienced devascularization or mechanical trauma during surgery. However, it is difficult to precisely determine if residual enhancing lesions become involuted upon follow-up MRI. Recent studies[11–14] have indicated that diffusion-weighted imaging (DWI) can also predict the consistency of tumors within the sellar region, which has allowed neurologists to select an appropriate operation plan before surgery. Ma et al[15] suggested that the cerebral blood volume value can provide helpful information for assessing the blood supply of pituitary macroadenoma. Whether DWI and perfusion-weighted imaging (PWI) can be used in assessment after transsphenoidal resection of pituitary adenoma is not yet clear. Therefore, further studies using an advanced imaging protocol, such as DWI and PWI, are needed to differentiate postoperative changes and residual tumors after transsphenoidal resection of a pituitary adenoma.
This study was limited by its single-center retrospective nature and the small number of patients. Nonetheless, the reported imaging findings of immediate postoperative tumor beds represent a first step toward early diagnosis and the appropriate treatment of residual tumors. A prospective study with a large number of patients is needed to establish a more accurate standard and determine its impact on outcomes.
Upon immediate postoperative MRI after transsphenoidal resection of pituitary adenoma, residual enhancing lesions with a thickness greater than 3.9 mm and a nodular pattern suggested a residual tumor. Peripheral enhancements with a thickness less than 3.9 mm tended to improve, according to follow-up MRI, suggesting postoperative changes rather than a residual tumor.
Author contributions
Conceptualization: Sung Tae Kim, Hyung-Jin Kim.
Data curation: Ha Youn Kim, JiHoon Cha, GyeongMin Park.
Formal analysis: Ha Youn Kim.
Methodology: Ha Youn Kim, Sung Tae Kim, Do-Hyun Nam.
Project administration: Sung Tae Kim.
Software: JiHoon Cha.
Supervision: Sung Tae Kim, HongSik Byun, Doo-sik Kong, Do-Hyun Nam.
Validation: YiKyung Kim, GyeongMin Park.
Writing – original draft: Ha Youn Kim.
Writing – review and editing: Ha Youn Kim, Sung Tae Kim, Hyung-Jin Kim, Pyoung Jeon, HongSik Byun, YiKyung Kim, JiHoon Cha, Doo-sik Kong.
Ha Youn Kim orcid: 0000-0002-7139-8410.
Footnotes
Abbreviations: DWI = diffusion-weighted imaging, MRI = magnetic resonance imaging, PWI = perfusion-weighted imaging.
The authors have no conflicts of interest to disclose.
References
- [1].Steiner E, Knosp E, Herold CJ, et al. Pituitary adenomas: findings of postoperative MR imaging. Radiology 1992;185:521–7. [DOI] [PubMed] [Google Scholar]
- [2].Dina TSFS, Laws ER, Davis DO. MR of the pituitary gland postsurgery: serial MR studies following transsphenoidal resection. Am J Neuroradiol 1994;14:763–9. [PMC free article] [PubMed] [Google Scholar]
- [3].Rodriguez O, Mateos B, de la Pedraja R, et al. Postoperative follow-up of pituitary adenomas after trans-sphenoidal resection: MRI and clinical correlation. Neuroradiology 1996;38:747–54. [DOI] [PubMed] [Google Scholar]
- [4].Mikhael MA, Ciric IS. MR imaging of pituitary tumors before and after surgical and/or medical treatment. J Comput Assist Tomogr 1988;12:441–5. [DOI] [PubMed] [Google Scholar]
- [5].Bonneville JF, Bonneville F, Cattin F. Magnetic resonance imaging of pituitary adenomas. Eur Radiol 2005;15:543–8. [DOI] [PubMed] [Google Scholar]
- [6].Teng MM, Huang CI, Chang T. The pituitary mass after transsphenoidal hypophysectomy. Am J Neuroradiol 1988;9:23–6. [PMC free article] [PubMed] [Google Scholar]
- [7].Yoon PH, Kim DI, Jeon P, et al. Pituitary adenomas: early postoperative MR imaging after transsphenoidal resection. Am J Neuroradiol 2001;22:1097–104. [PMC free article] [PubMed] [Google Scholar]
- [8].Kovacs K, Horvath E, Asa SL. Wilkins RH, Rengachary SS. Classification and pathology of pituitary tumors. Neuro-surgery. New York: McGraw-Hill; 1985. 834–42. [Google Scholar]
- [9].Kern EB, Laws ER., Jr Laws ER, Jr, Randall RV, Kern EB, Abboud CF. The rationale and technique of selective transsphenoidal microsurgery for the removal of pituitary tumors. Management of pituitary adenomas and related lesions with emphasis on transsphenoidal microsurgery. New York: Appleton-Century-Crofts; 1982. 219–44. [Google Scholar]
- [10].Ciric I, Mikhael M, Stafford T, et al. Transsphenoidal microsurgery of pituitary macroadenomas with long-term follow-up results. J Neurosurg 1983;59:395–401. [DOI] [PubMed] [Google Scholar]
- [11].Pierallini A, Caramia F, Falcone C, et al. Pituitary macroadenomas: preoperative evaluation of consistency with diffusion-weighted MR imaging – initial experience. Radiology 2006;239:223–31. [DOI] [PubMed] [Google Scholar]
- [12].Suzuki C, Maeda M, Hori K, et al. Apparent diffusion coefficient of pituitary macroadenoma evaluated with line-scan diffusion-weighted imaging. J Neuroradiol 2007;34:228–35. [DOI] [PubMed] [Google Scholar]
- [13].Boxerman JL, Rogg JM, Donahue JE, et al. Preoperative MRI evaluation of pituitary macroadenoma: imaging features predictive of successful transsphenoidal surgery. Am J Roentgenol 2010;195:720–8. [DOI] [PubMed] [Google Scholar]
- [14].Yiping L, Hui L, Kun Z, et al. Diffusion-weighted imaging of the sellar region: a comparison study of BLADE and single-shot echo planar imaging sequences. Eur J Radiol 2014;83:1239–44. [DOI] [PubMed] [Google Scholar]
- [15].Ma Z, He W, Zhao Y, et al. Predictive value of PWI for blood supply and T1-spin echo MRI for consistency of pituitary adenoma. Neuroradiology 2016;58:51–7. [DOI] [PubMed] [Google Scholar]


