

Abstract
Hydrogen sulfide (H2S) is a gaseous signaling molecule, which modulates a wide range of mammalian physiological processes. Cystathionine γ-lyase (CSE) catalyzes H2S synthesis and is a potential target for modulating H2S levels under pathophysiological conditions. CSE is inhibited by propargylglycine (PPG), a widely used mechanism-based inhibitor. In this study, we report that inhibition of H2S synthesis from cysteine, but not the canonical cystathionine cleavage reaction catalyzed by CSE in vitro, is sensitive to preincubation of the enzyme with PPG. In contrast, the efficacy of S-3-carboxpropyl-l-cysteine (CPC) a new inhibitor described herein, was not dependent on the order of substrate/inhibitor addition. We observed that CPC inhibited the γ-elimination reaction of cystathionine and H2S synthesis from cysteine by human CSE with Ki values of 50 ± 3 and 180 ± 15 μm, respectively. We noted that CPC spared the other enzymes involved either directly (cystathionine β-synthase and mercaptopyruvate sulfurtransferase) or indirectly (cysteine aminotransferase) in H2S biogenesis. CPC also targeted CSE in cultured cells, inhibiting transsulfuration flux by 80–90%, as monitored by the transfer of radiolabel from [35S]methionine to GSH. The 2.5 Å resolution crystal structure of human CSE in complex with the CPC-derived aminoacrylate intermediate provided a structural framework for the molecular basis of its inhibitory effect. In summary, our study reveals a previously unknown confounding effect of PPG, widely used to inhibit CSE-dependent H2S synthesis, and reports on an alternative inhibitor, CPC, which could be used as a scaffold to develop more potent H2S biogenesis inhibitors.
Keywords: enzyme kinetics, crystal structure, pyridoxal phosphate, hydrogen sulfide, enzyme inhibitor, chemical screen, cystathionine gamma-lyase, cysteine catabolism, PLP enzyme, propargylglycine, transsulfuration pathway
Introduction
Hydrogen sulfide (H2S) is a biological signaling molecule that modulates multiple physiological processes (1, 2). In mammals, H2S is produced by two pyridoxal 5′-phosphate (PLP)2–dependent enzymes, cystathionine β-synthase (CBS) and cystathionine γ-lyase (CSE), and by mercaptopyruvate sulfurtransferase (MST) in conjunction with cysteine aminotransferase (CAT) in the cysteine catabolism pathway (3). MST generates H2S from 3-mercaptopyruvate in the presence of a thiol-regenerating system such as thioredoxin/thioredoxin reductase (4, 5). CBS and CSE together constitute the transsulfuration pathway, in which homocysteine formed in the methionine cycle is shunted to cysteine synthesis (Fig. 1A). The transsulfuration pathway can represent a significant source of endogenous cysteine, the limiting reagent for the synthesis of GSH (6, 7). In addition to their roles in cysteine synthesis, both CBS and CSE exhibit considerable substrate and reaction promiscuity (8) and synthesize H2S from cysteine and/or homocysteine (9, 10). Understanding how substrate and reaction specificity of the transsulfuration pathway enzymes is controlled to meet cellular needs for cysteine versus H2S is an important issue. CBS has an NO- and CO-responsive heme sensor (11–13) and allosterically regulates CSE, the next enzyme in the pathway (14). Kinetic simulations predict that at physiological concentrations of substrates, CSE is a quantitatively more significant source of H2S than CBS in some tissues (15).
Figure 1.

The transsulfuration pathway connects the methionine cycle to GSH and H2S synthesis. A, CBS and CSE catalyze the successive conversion of homocysteine (Hcy) and Ser to cystathionine and Cys, respectively, in the canonical transsulfuration pathway. Hcy is an intermediate in the methionine cycle. Due to substrate and reaction promiscuity, CBS and CSE each catalyze additional reactions that lead to H2S generation. The five CSE-catalyzed H2S-producing reactions are shown. B, crystal structure of human CSE (PDB code 6NBA) in which the N- and C-terminal domains in each monomer are shown in dark and light blue, respectively. The PLP cofactor in each subunit is shown in a spherical representation.
CSE belongs to the γ-subfamily of PLP-dependent enzymes (16) and catalyzes the α-γ elimination of cystathionine (formed in the CBS reaction) to cysteine, α-ketobutyrate, and ammonia (Fig. 1A). Of the various reaction possibilities, the α-β elimination of cysteine is the major source of CSE-derived H2S synthesis at physiological substrate concentrations (10). Mutations in CSE lead to cystathionuria, an autosomal recessive disorder that is often benign, although cystathionuria can also be secondary to other pathologies (e.g. neuroblastoma) (17). CSE is a homotetramer in which each monomer is organized into a large N-terminal domain that binds PLP and a smaller C-terminal domain (Fig. 1B) (18). The PLP cofactor is covalently linked via a Schiff base to Lys-212 in the active site of human CSE. During catalysis, the amino group of the substrate (i.e. cystathionine, cysteine, or homocysteine) displaces Lys-212 to form an external aldimine intermediate, which subsequently undergoes α-β or α-γ elimination, depending on the substrate (9, 19). CSE also catalyzes the conversion of cystine to cysteine persulfide, which can subsequently decompose, releasing H2S (20, 21). The low intracellular concentration of cystine makes it unlikely to be a quantitatively significant substrate for CSE under normoxic conditions (21). Instead, CSE is likely to be a source of cysteine in cells having an intact transsulfuration pathway and of H2S in cells lacking CBS or under conditions where CBS activity is inhibited so that competition from the canonical transsulfuration pathway intermediate cystathionine is limited (14).
Given the importance of CSE for H2S synthesis in many cell types, the ability to modulate its activity would be useful for in vitro and in vivo studies. Several compounds are currently used for the pharmacological inhibition of CSE, including propargylglycine (PPG), β-cyanoalanine, aminooxyacetic acid, and l-aminoethoxyvinylglycine (22). Each of these compounds suffers from a lack of specificity, including PPG, which was developed as a mechanism-based inhibitor of CSE (23). Off-target activity has been reported for β-cyanoalanine (asparaginase (24)) and for aminooxyacetic acid (γ-aminobutyric-α-ketoglutaric transaminase (25), aspartate/cysteine aminotransferase (26), and CBS (22)). Aminoethoxyvinylglycine, an antimicrobial natural product isolated from Streptomyces, is a slow-binding reversible inhibitor of CSE and other γ-subfamily PLP enzymes (27, 28). It might be the most specific of the inhibitors used to target mammalian CSE because its other major targets are either microbial or plant-specific enzymes (28, 29).
PPG is the most widely used inhibitor of CSE. In addition to CSE, it also targets alanine transaminase (30). PPG is an acetylenic substrate analog that leads to an irreversible and time-dependent loss of activity (Scheme 1) (23). Covalent labeling of CSE by [14C]PPG is precluded by pretreatment with borohydride, which reduces the Schiff base. These observations led to the proposal that proton abstraction at the β-carbon of the external aldimine with PPG results in a reactive allene intermediate that undergoes Michael addition by an active-site nucleophile, resulting in covalent capture (Scheme 1A). The crystal structure of the CSE·PPG complex, however, revealed that Lys-212 is bound to PLP in an internal aldimine, whereas the Cγ of PPG is covalently linked to Tyr-114, which stacks over the pyridine ring of PLP (18).
SCHEME 1.

Inhibition of CSE by PPG versus CPC.
In this study, we screened several analogs of cysteine and cystathionine as potential reversible inhibitors of human CSE. We report a combined kinetic, cellular, and crystallographic analysis of the most effective inhibitor, S-3-carboxypropyl-l-cysteine (CPC). Our study reveals that CPC inhibits both the cystathionine and cysteine cleavage reactions catalyzed by CSE but spares the activity of the other enzymes involved in H2S synthesis (i.e. CBS and MST (and PLP-dependent CAT)). Our study reveals that, in contrast to CPC, PPG requires preincubation with CSE to effectively inhibit H2S synthesis in vitro. In cell lines and tissues like kidney, where cysteine concentrations are high, PPG is expected to be less effective at inhibiting the β-elimination reaction of cysteine to form H2S.
Results
CSE inhibitor screening
We queried Aldrich Market Select for compounds that are structurally similar to cystathionine and screened 11 (Table 1) as potential CSE inhibitors in the cystathionine cleavage assay (Fig. 2). The compounds exhibited varying inhibitor potencies with IC50 values ranging from 0.07 to 9.1 mm in the standard assay (Table 1). CPC, a cystathionine analog lacking the α-amino group on the homocysteine side of the thioether, was the most potent inhibitor (IC50 = 71 ± 7 μm). We also evaluated the potential of each compound (at a concentration of 10 mm) to inhibit H2S synthesis by CBS but saw no inhibition under these conditions. Based on these initial screening data, we focused on CPC for further characterization. CPC (at a concentration of 5 mm) also failed to inhibit MST and CAT (not shown).
Table 1.
List of compounds and estimated apparent Ki for CSE inhibition

Figure 2.

Inhibition of human CSE activity by substrate analogs. The reaction mixtures contained 100 mm HEPES, pH 7.4, 0.15 mm l-cystathionine, 1 mm DTNB, CSE (10 μg/ml), and varying concentrations of S-carboxymethyl-l-cysteine (A), S-(2-aminoethyl)-l-cysteine HCl (B), S-(2-carboxyethyl)-l-cysteine (C), S-3-carboxpropyl-l-cysteine or CPC (D), S-(2-boronoethyl)-l-cysteine HCl (E), 2,8-diaminononanedioic acid (F), 2,7-diaminooctanedioic acid (G), suberic acid (H), dl-2-aminosuberic acid (I), dl-2,6-diaminopimelic acid (J), and ll-2,6-diaminopimelic acid (K). The data in each panel are representative of two independent experiments (with ≤10% error between the data sets).
The Ki of CPC was assessed in both the cystathionine and cysteine cleavage assays catalyzed by CSE in the presence of varying concentrations of the respective substrates. A Lineweaver–Burk analysis of the data was consistent with CPC being a competitive inhibitor in both reactions (Fig. 3). Nonlinear regression analysis yielded Ki values of 50 ± 3 and 180 ± 15 μm in the cystathionine and cysteine cleavage assays, respectively. The affinity of CPC for CSE (Kd = 26 ± 3 μm) was assessed by isothermal titration calorimetry (Fig. 4). The number of binding sites (n) was estimated to be 0.7 ± 0.1, and binding was primarily enthalpically driven (ΔH = −4.18 kcal/mol, TΔS = 1.95 kcal/mol, and ΔG = −6.13 kcal/mol).
Figure 3.

Kinetics of CSE inhibition by CPC. Lineweaver–Burk plot analysis of CSE inhibition by CPC. A, inhibition of the cystathionine cleavage reaction was determined in assay mixtures containing 100 mm HEPES, pH 7.4, 0.1–1.0 mm l-cystathionine, 1 mm DTNB, CSE (10 μg/ml), and varying concentrations of CPC (0–150 μm). B, inhibition of H2S synthesis was determined in reaction mixtures containing 100 mm HEPES, pH 7.4, 0.9–8.0 mm l-cysteine, 0.4 mm lead nitrate, 20 μg/ml CSE, and varying concentrations of CPC (0–150 μm). The data in each panel are representative of two independent experiments (with ≤10% error between the data sets).
Figure 4.
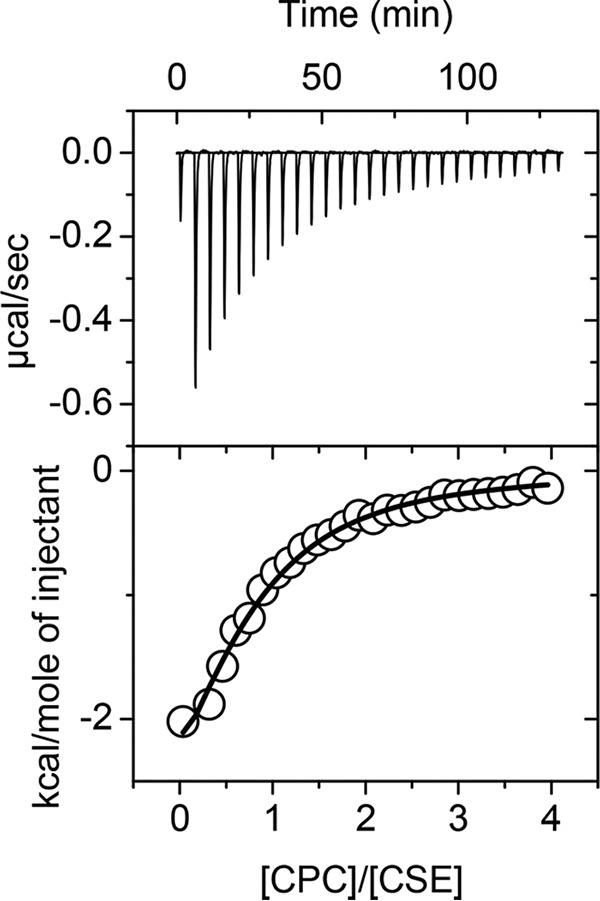
ITC analysis of CPC binding to CSE. Aliquots (8 μl) of 1.0 mm CPC in 50 mm potassium phosphate buffer, pH 7.4, were added to CSE (40 μm) in the same buffer at 25 °C. The top panel shows the raw data (power versus time), and the bottom panel shows the integrated peak area normalized to the moles of CPC added per injection versus the ratio of [CPC]/[CSE]. In the bottom panel, the circles represent the experimental data, whereas the line represents the fit using a single-site binding model, which yielded a Kd of 26 ± 3. μm. The data are representative of two independent experiments.
CPC inhibits the transsulfuration pathway in cultured cells
The addition of CPC (0.5–10 mm) to HepG2 cells inhibited radiolabel incorporation from [35S]methionine into GSH, which was monitored over 17 h (Fig. 5A). These data indicate that CPC is membrane-permeable. At CPC concentrations ≥5 mm, <10% radiolabel incorporation was observed compared with untreated controls (Fig. 5A).
Figure 5.

CPC inhibits the transsulfuration pathway in mammalian cells. A, concentration-dependent inhibition by CPC of radiolabel transfer from [35S]methionine to GSH in HepG2 cells after 17 h. The data represent the mean ± S.D. (error bars) of two independent experiments. B, time-dependent changes in radiolabel incorporation from [35S]methionine to GSH in HepG2 cells incubated with CPC (2.5 or 6.0 mm) or PPG (2.5 mm). The data represent the mean ± S.D. of two independent experiments. C, comparative effects of PPG (2.5 mm) versus CPC (5 mm) on radiolabel transfer from [35S]methionine to GSH in three cell lines after 17 h. D, Western blot analysis of CBS and CSE expression in cell lines. STD, purified standards for human CBS and CSE; MW, positions of molecular weight standards. The following amount of total protein was loaded in each lane: HepG2 (150 μg), HT29 (150 μg), HEK293 (30 μg), bEnd3 (150 μg), and SH-SY5Y (30 μg).
Next, the time dependence of the effect of CPC versus PPG on radiolabel incorporation from [35S]methionine into GSH was compared in HepG2 cells (Fig. 5B). PPG, which is typically used at a concentration of 2.5 mm in cell culture experiments, led to the complete loss of radiolabel incorporation over 10 h. A comparable concentration of CPC led to ∼65% inhibition, whereas complete inhibition was observed with 6 mm CPC. The ability of CPC versus PPG to inhibit the transsulfuration pathway was examined in other cell lines, including HEK293, SH-SY5Y, HT29, and bEnd3. Radiolabel incorporation from [35S]methionine into GSH was observed in HEK293 and SH-SY5Y cells (Fig. 5C). The absence of an active transsulfuration pathway in the other cell lines was consistent with our inability to detect CBS (HT29) or both CBS and CSE (bEnd3) by Western blot analysis in them (Fig. 5D). In HepG2, HEK293, and SH-SY5Y cells, 5 mm CPC resulted in 80–90% inhibition of the transsulfuration flux compared with complete inhibition by 2.5 mm PPG (Fig. 5C). To potentially improve intracellular availability of CPC, three ester derivatives were used. However, compared with CPC, which showed >80% inhibition, 2-amino-3[(4-methoxy-4-oxobutyl) sulfanyl] propanoic acid, methyl 4-[(2-amino-3-methoxy-3-oxopropyl) sulfanyl] butanoate, and methyl 4-[(2-amino-3-ethoxy-3-oxopropyl) sulfanyl] butanoate showed ∼30–40% inhibition (at a concentration of 2.5 mm for each compound) (not shown).
Structure of CSE co-crystallized with CPC
The structure of CSE co-crystallized with CPC was determined by molecular replacement and refined at 2.5 Å resolution with a crystallographic Rwork/Rfree value of 0.196/0.230 (Table 2). Four copies of the CSE·CPC complex were present in an asymmetric unit forming a homotetramer (Fig. 1B). The monomers are tightly packed against each other through a series of hydrogen-bonding and hydrophobic interactions. As seen previously (18), each monomer is composed of an N-terminal PLP domain (residues 10–263) and a C-terminal domain (residues 264–398) (Fig. 6A). The PLP-binding domain comprises an α-β-α fold with seven β-sheets surrounded by eight α helices; the C-terminal domain comprises three α-helices on one side of four β-sheets.
Table 2.
Crystallographic data collection and refinement statistics for human CSE·CPC
| PDB ID | 6NBA |
|---|---|
| Data collection | |
| Space group | P21 |
| Cell dimensions | |
| a, b, c (Å) | 68.55, 152.17, 83.77 |
| α, β, γ (degrees) | 90, 112.25, 90 |
| Resolution (Å) | 50.00–2.50 (2.54–2.50)a |
| Rsym (%) | 12.5 (61.0) |
| I/σI | 11.5 (1.5) |
| Completeness (%) | 99.2 (93.5) |
| Redundancy | 4.2 (3.8) |
| Refinement | |
| Resolution | 42.45–2.50 (2.56–2.50) |
| No. of reflections | 54,556 |
| Rwork/Rfree (%) | 19.6 (31.2) / 23.0 (35.2) |
| No. of atoms | |
| Protein | 12,051 |
| Ligand | 84 |
| Water | 194 |
| B factors | |
| Protein | 50.17 |
| Aminoacrylate | 45.86 |
| Water | 38.29 |
| r.m.s. deviation | |
| Bond lengths (Å) | 0.005 |
| Bond angles (degrees) | 0.838 |
a Values in parentheses are for the highest-resolution shell.
Figure 6.

Structure of human CSE co-crystallized with CPC. A, ribbon diagram of a CSE monomer with the CPC-derived aminoacrylate shown as spheres. B–D, structural overlays of Cα atoms of CSE with the AA intermediate bound to PLP (AA-PLP; blue) and PLP bound to CSE (PDB code 2NMP; salmon) (B), with PLP·PPG bound to CSE (PDB 3COG; purple) (C), or with ligand-free apo-CSE (PDB code 3ELP; yellow) (D). The well-defined loop structure in CSE co-crystallized with CPC is indicated by the red oval. All molecular structure images were illustrated using PyMOL (Schroedinger, LLC).
The structure of CSE co-crystallized with CPC exhibits high structural similarity with the PLP-bound and PLP·PPG-bound CSE structures with Cα r.m.s. differences of 0.35 and 0.30 Å, respectively (Fig. 6, B and C) (18). The structure of CSE co-crystallized with CPC exhibits a closed conformation and a Cα r.m.s. difference of 1.39 Å from the open active-site conformation in the apo-CSE structure (Fig. 6D). The transition from the open to closed active site conformation involves changes in two loops (residues 110–118 and 210–216), as reported previously (18). These conformational changes position Lys-212 in proximity of PLP, enabling formation of the internal aldimine. The N-terminal loop (residues 28–63) in the CSE structure co-crystallized with CPC is well-ordered in contrast to the PLP-bound, PLP·PPG-bound, and apo-CSE structures, in which it is disordered (Fig. 6, B–D).
A closer examination of the active site revealed the presence of an aminoacrylate intermediate rather than CPC (Fig. 7A), indicating that the alkaline crystallization conditions (pH 8.5) had promoted β-elimination of the external aldimine of CPC (Scheme 1B). The carboxyl group of the aminoacrylate intermediate is stabilized via hydrogen bonds with Asn-161 and Arg-375 (Fig. 7B). Side chains of Tyr-60 and Arg-62 from the adjacent monomer engage in electrostatic interactions with the phosphate group of PLP (Fig. 7B).
Figure 7.

Close-up of the CSE structure co-crystallized with CPC in stereo view. A, the composite omit map (weighted 2Fo − Fc) contoured at 1 σ, of the AA intermediate (green) bound to PLP (yellow) in the active site of CSE. The map was calculated without the aminoacrylate intermediate bound to PLP by omitting 10% of the total residues in each cycle using the program composite omit map in the PHENIX software package. Residues from adjacent monomers are depicted in cyan and dark blue. B, close-up showing the interactions between the aminoacrylate intermediate and active site residues. Tyr-114 makes a stacking interaction with the pyridine ring of PLP, whereas Lys-212 is positioned near the β-carbon of the intermediate, where it can act as a general base. C, structural comparison between CSE with PLP bound as an internal aldimine via Lys-212 (PDB code 2NMP) versus the external aldimine of the aminoacrylate intermediate (PDB code 6NBA). Note the repositioning of the Lys-212 side chain from the PLP toward the β-carbon of the intermediate.
The active site architecture of the CPC-derived aminoacrylate (AA) bound to CSE overlays well with that of PLP-bound CSE, which also exhibits a closed conformation (Fig. 7C). The side-chain orientations in the two structures are almost identical, indicating that inhibition by CPC does not involve a significant conformational change. A key difference, however, is the conformation of Lys-212, which is covalently attached to PLP in the internal aldimine in the PLP·CSE structure, but has moved away from the aminoacrylate intermediate in the CPC-treated AA-PLP·CSE structure (Fig. 7C).
The overall structure and side-chain conformations in the active sites of the PPG- and aminoacrylate-bound CSE structures are also very similar (Fig. 8). Notably, the nitrite ion present in the PPG-bound structure overlays with the carboxyl of the aminoacrylate intermediate and forms the same hydrogen-bonding interactions with Asn-161 and Arg-375 (Fig. 8). PPG is covalently linked to Tyr-114 and rotated ∼180° away from the PLP (18). PPG presumably suppresses CSE activity by blocking substrate entry into the active site.
Figure 8.

Structural insights into CSE inhibition by CPC versus PPG. Stereo view of an overlay of active sites in the CSE crystallized with PPG (PDB code 3COG) or with the CPC-derived aminoacrylate (PDB code 6NBA).
Reactivity of CPC as an alternate substrate of CSE
The presence of an aminoacrylate intermediate in the structure of CSE co-crystallized with CPC suggested that CPC could potentially serve as an alternate substrate. However, at the pH of 7.4 used in the steady-state assay, formation of 4-mercaptobutanoic acid was not observed in the CSE-catalyzed β-elimination of CPC, even in the presence of high concentrations of enzyme (300 μg/ml). In contrast, at pH 8.5, CSE catalyzed the slow elimination of CPC, and formation of an aminoacrylate intermediate was indicated by the appearance of a peak at 460 nm in the UV-visible spectrum (Fig. 9). The kcat for β-elimination of CPC was 0.005 s−1 at pH 8.5 and 37 °C compared with 2.3 s−1 for the β-elimination of cysteine to H2S and 0.47 s−1 for the γ-elimination of cystathionine to cysteine at pH 7.4 and 37 °C.
Figure 9.

Spectroscopic evidence for CPC-dependent aminoacrylate formation. Stack plot showing difference spectra between (CSE + CPC) − (CSE) that were obtained using samples containing CSE (100 μm) in 100 mm Tris, pH 8.5, at 25 °C to which aliquots (0.2 mm) of CPC were added. The final concentration of CPC was 2 mm.
Inhibition of cysteine-dependent H2S synthesis by PPG but not CPC requires preincubation with CSE
In the presence of 1 mm ll-cystathionine as substrate, CPC and PPG inhibited CSE activity 85 and 100%, respectively (Fig. 10A). The two inhibitors similarly affected H2S synthesis from homocysteine (1 mm). Surprisingly, when H2S synthesis was monitored from cysteine (1 mm), CPC led to ∼85% inhibition, whereas PPG did not have a significant effect. Notably, these reactions were initiated by the addition of CSE (i.e. conditions under which the enzyme simultaneously was presented with both substrate and inhibitor). These results indicate that cysteine competitively inhibits PPG binding to CSE at the concentration of each used in this experiment.
Figure 10.

CPC but not PPG effectively inhibits CSE-catalyzed H2S synthesis from cysteine. A, inhibition of CSE-catalyzed cystathionine cleavage was monitored in a reaction mixture containing 1 mm l-cystathionine, 1 mm DTNB, 10 μg/ml CSE, and 1 mm PPG or CPC, whereas inhibition of H2S synthesis was monitored in the presence of 1 mm cysteine or homocysteine and 1 mm PPG or CPC, 0.4 mm lead acetate, 10 μg/ml CSE. All reactions were initiated by the addition of CSE and carried out in 100 mm HEPES buffer, pH 7.4, at 37 °C. The data represent the mean ± S.D. of three independent experiments. B, cysteine suppresses the effect of PPG on CSE-catalyzed H2S production. The reaction mixture contained 100 mm HEPES, pH 7.4, PPG (0, 2.5, or 10 mm), cysteine (0–2 mm), and 20 μg/ml CSE (added last). Aliquots from the gas phase were removed after a 15-min incubation at 37 °C and analyzed by GC to estimate the concentration of H2S as described under “Experimental procedures.” The data represent the mean ± S.D. (error bars) from 3–5 independent experiments.
To understand why PPG failed to inhibit H2S synthesis at an equivalent concentration of cysteine, we analyzed PPG-dependent inhibition of CSE at varying concentrations of cysteine and PPG (Fig. 10B). For this, sulfide chemiluminescence detection coupled to GC was used to circumvent the limited sensitivity of the lead sulfide assay at low cysteine concentrations. The sensitivity of CSE inhibition to PPG depended on the concentration of cysteine within a physiologically relevant range (31) and indicated that 2.5 mm PPG, which is widely used in the literature, competes effectively for binding to CSE only when cysteine concentrations are low (≤0.1 mm).
Discussion
Despite the growing number of studies on the cellular and physiological effects of H2S, tools for specifically manipulating H2S synthesis and degradation are very limited (1, 2). Increased H2S levels in inflammation accompanying burn injury (32), rheumatoid arthritis (33), and endotoxic shock (34, 35) have been correlated with the up-regulation of CSE. CSE is considered to be a major source of H2S in several tissues, and an inhibitor that effectively targets it could be useful. PPG is by far the most widely used inhibitor of CSE and was developed as a mechanism-based inhibitor that binds stoichiometrically to each of the four active sites in the CSE tetramer (27). Because PPG is a time-dependent irreversible inhibitor, the reported IC50 values (40 ± 8 μm in the presence of 1 mm cysteine (22) or 0.2 mm in the presence of 5 mm l-cysteine (18)) are not meaningful. As discussed below, the extent of inhibition depends on the assay's duration, on whether or not CSE was preincubated with PPG, and on the concentration of cysteine used in the H2S synthesis assay.
In this study, we report a lead compound that is a structural analog of cystathionine and has some of the desired attributes for inhibiting H2S synthesis by CSE. CPC is a reversible inhibitor of CSE that exhibits an IC50 value of 71 ± 7 μm at pH 7.4 and 37 °C in the presence of 0.15 mm l-cystathionine. By comparison, 5–10 mm CPC failed to inhibit CBS, MST, or CAT. Thus, CPC holds promise for functionalization to increase its potency as a CSE-specific inhibitor. To this end, the activity data on structurally similar compounds provide useful insights for future optimization of CSE inhibitor design. Increasing the chain length in the series, S-carboxymethyl-, S-carboxyethyl-, and S-carboxypropyl-cysteine led to an ∼18-fold decrease in the IC50 value. The dethia analog of cystathionine, 2,7-diaminooctanedioic acid, showed a 13-fold higher IC50 value compared with CPC, whereas shortening (ll-2,6-diaminopimelic acid) or lengthening (2,8-diaminononanedioic acid) its backbone by a methylene group increased the IC50 value 49- and 27-fold, respectively. The importance of the sulfur was clear by the 10-fold increase in the IC50 value of the dethia analog of CPC, assuming that only half of the racemic dl-2-aminosuberic acid mixture bound to CSE (Table 1).
CPC was a competitive inhibitor with respect to both cystathionine and cysteine in the canonical and H2S synthesis reactions, respectively. The lower Ki value in the cystathionine (50 ± 3 μm) versus cysteine (180 ± 15 μm) cleavage assay suggests that CPC competes more effectively against the longer cystathionine versus the shorter cysteine substrate. The Kd(app) for CPC binding to CSE was 26 ± 3 μm. In cell culture, CPC inhibited the transsulfuration flux, an indicator of the canonical CSE reaction; ≥80% inhibition was observed in HepG2 cells at a concentration of 2.5 mm CPC (Fig. 5A). For comparison, PPG, used extensively in cell culture experiments, is typically added at concentrations ranging from 1 to 10 mm (36, 37). At a concentration of 2.5 mm PPG, the transsulfuration flux was inhibited by >95%; a comparable degree of inhibition was obtained at 6.0 mm CPC. The lower efficacy of CPC versus PPG in inhibiting the cystathionine cleavage reaction (Fig. 5B) could result from the reversibility of CPC inhibition and/or its slow metabolism by CSE (Fig. 9).
Significantly, we found that PPG is less effective than CPC in inhibiting the β-elimination of cysteine to generate H2S in vitro. Thus, when purified human CSE was simultaneously exposed to cysteine (1 mm) and either CPC or PPG (1 mm each), H2S synthesis was effectively inhibited only by CPC (Fig. 10A). This was in sharp contrast to assays in which CSE was simultaneously exposed to cystathionine (1 mm) or homocysteine (1 mm) and either PPG or CPC, which resulted in almost complete inhibition. In contrast to the experiments described herein, in prior studies in which the kinetics of PPG inhibition of CSE-catalyzed H2S synthesis were characterized, the inhibitor was preincubated with the enzyme for 15 or 30 min prior to cysteine exposure (18, 22).
The concentration of PPG needed to achieve half-maximal inhibition under our experimental conditions increased 22-fold as cysteine concentration increased from 0.1 to 2.0 mm. Because intracellular cysteine reportedly ranges from ∼0.05 to 5 mm, with the highest concentration reported in kidney (31, 38), the ability of cysteine to attenuate the efficacy of PPG inhibition of CSE-catalyzed H2S synthesis could be physiologically relevant in some cell culture and in vivo experiments where intracellular cysteine concentrations are high. In particular, high endogenous cysteine concentrations in kidney might protect CSE from PPG inhibition.
Another generally unappreciated complication with the use of PPG is its ability to function as a cysteine analog in cells and to target other metabolic pathways. PPG is incorporated during GSH synthesis, forming γ-glutamylproparglyglycine, which was isolated as a major metabolite from rat liver (39). A dose-dependent increase in this GSH derivative was seen as the concentration of PPG injected intraperitonially was increased. l-PPG is a natural product found in the poisonous mushroom, Amanita abrupta, and enhanced lipid peroxidation and decreased glycogen levels in rat hepatocytes during prolonged incubation (5 h) (40).
In conclusion, we describe CPC as a reversible and selective inhibitor of human CSE, which binds by displacing the active-site lysine residue to form an external aldimine. Biochemical and cellular studies reveal that CPC can be utilized in vitro and in cell culture experiments to inhibit both the canonical CSE-dependent transsulfuration flux and H2S production. Our study also reveals that PPG, while effective as a mechanism-based inhibitor of the canonical cystathionine cleavage reaction for which it was originally developed, can give rise to tissue-sensitive inconsistencies in inhibiting CSE-catalyzed H2S synthesis. For this reason, CPC might be a preferred reagent for pharmacological targeting of CSE.
Experimental procedures
Materials
l-cysteine, l-homocysteine, l-cystathionine, dl-propargylglycine (PPG), 5,5′-dithiobis(2-nitrobenzoic acid) (DTNB), protease inhibitor mixture for mammalian tissues, S-(2-aminoethyl)-l-cysteine-HCl, S-(2-boronoethyl)-l-cysteine-HCl, suberic acid, dl-2,6-diaminopimelic acid, and ll-2,6-diaminopimelic acid were purchased from Sigma-Aldrich. S-(2-Carboxyethyl)-l-cysteine, lanthionine (dl- and the meso- mixture), and dl-2-aminosuberic acid were purchased from TCI America (Portland, OR). 2,8-Diaminononanedioic acid and 2,7-diaminooctanedioic acid were from Vitascreen, LLC (Champaign, IL). S-Carboxymethyl-l-cysteine was purchased from TimTec LLC (Newark, DE), and CPC was from Toronto Research Chemicals (Toronto, Canada). 2-Amino-3[(4-methoxy-4-oxobutyl) sulfanyl] propanoic acid, methyl 4-[(2-amino-3-methoxy-3-oxopropyl) sulfanyl] butanoate, and methyl 4-[(2-amino-3-ethoxy-3-oxopropyl) sulfanyl] butanoate were from Aldlab Chemicals, LLC. All other chemicals were purchased from Fisher Scientific.
Preparation of recombinant human CSE and CBS
Recombinant human CSE (polymorphic variant S403) and recombinant human CBS were expressed in Escherichia coli and purified as described previously (41, 42).
Inhibitor screening
Initial screening of inhibitors against CSE was performed using DTNB to detect the cleavage of cystathionine to cysteine, as described previously (9). Briefly, the reaction mixture (1 ml) containing 100 mm HEPES buffer, pH 7.4, 0.15 mm l-cystathionine, 1 mm DTNB, and varying concentrations of inhibitor (using 100 mm stock solutions in PBS neutralized with NaOH to pH 7.4) was preincubated at 37 °C for 3 min. The reaction (in a thermostatted cuvette holder at 37 °C) was started by the addition of CSE (10 μg), and the increase in absorption at 412 nm due to formation of the nitrobenzene thiolate anion was monitored. A molar extinction coefficient of 13,600 m−1 cm−1 was used to calculate the specific activity of CSE. Inhibition data were fitted using the following equation,
| (Eq. 1) |
where y = rate of the reaction without inhibitor, x = inhibitor concentration, a = slope, and b = inhibitor concentration that yields 50% inhibition.
Inhibition of H2S production by CBS (10 μg) was monitored in the presence of 1 mm each of cysteine and homocysteine in 100 mm HEPES buffer, pH 7.4, at 37 °C and at a 10 mm concentration of each compound listed in Table 1 using the lead sulfide assay as described previously (43).
Inhibition of CSE-catalyzed cystathionine versus H2S synthesis by CPC
To estimate the inhibition constant (Ki) for CPC, CSE activity was measured in the presence of varying concentrations of CPC in the two CSE-catalyzed reactions described below. The Ki values were obtained using the following equation,
| (Eq. 2) |
where v is the initial rate, and [S] and [I] refer to the concentration of substrate and CPC, respectively.
Cystathionine cleavage assay
Cysteine formation from cystathionine was monitored in the DTNB assay described above, in the presence of different concentrations of cystathionine (0.1–1.0 mm) and CPC (0, 30, 70, or 150 μm); the reaction was started by the addition of CSE (10 μg).
H2S synthesis assay
H2S synthesis from cysteine was detected by the lead sulfide assay as described previously (9). Briefly, 1 ml of reaction mixture containing 100 mm HEPES buffer, pH 7.4, 0.4 mm lead nitrate, and varying concentrations of cysteine (0.9–8.0 mm) and CPC (0, 30, 70, or 150 μm) was incubated at 37 °C for 3 min. The reaction was started by the addition of CSE (20 μg), and an increase in absorption at 390 nm due to lead sulfide formation was monitored. An extinction coefficient of 5,500 m−1 cm−1 was used to calculate the specific activity of CSE.
Assessment of CSE inhibition by CPC versus PPG
The effect of PPG versus CPC on the rate of CSE-catalyzed cysteine or H2S synthesis was monitored as follows. Cystathionine cleavage was monitored in the presence of 1 mm l-cystathionine with or without 1 mm each of PPG or CPC using the DTNB assay as described above. The rate of H2S production was monitored in the presence of 1 mm cysteine or 1 mm homocysteine with or without 1 mm each of CPC or PPG using the lead sulfide assay described above. All assays were initiated by the addition of CSE.
GC-chemiluminescence analysis of H2S synthesis
To measure H2S production by purified CSE in the presence of varying PPG and cysteine concentrations, the GC-sulfur chemiluminescence method was used for its greater sensitivity (44). Briefly, 0.5 ml of the reaction mixture containing 100 mm HEPES buffer, pH 7.4, PPG (0, 2.5, or 10 mm), varying concentrations of cysteine (0.1, 0.5, 1, or 2 mm), and 10 μg of human CSE was placed in the barrel of a 20-ml polypropylene syringe and sealed with a plunger. The syringe content was made anaerobic by flushing with N2 and incubated for 15 min at 37 °C with constant shaking (70 rpm). The concentration of H2S in the gas phase of the syringe was determined using GC equipped with a 355 sulfur chemiluminescence detector (Agilent) as described previously (44).
MST activity assay
H2S formation by MST was estimated as described before (4) in the presence and absence of CPC. Briefly, the reaction mixture containing 200 mm HEPES buffer, pH 7.4, 0.5 mm 3-mercaptopyruvate, 20 mm cysteine, 0.4 mm lead nitrate with or without 5 mm CPC was incubated at 37 °C for 3 min. The reaction was initiated by the addition of purified human MST (10 μg), and lead sulfide formation was followed as described above.
CAT activity assay
The activity of CAT was estimated as described earlier (45). Briefly, the reaction mixture containing 100 mm HEPES buffer, pH 7.4, 0.25 mm NADH, 0.5 mm α-ketoglutarate, 10 mm cysteine, 10 units of bovine lactate dehydrogenase (Sigma) with or without 5 mm CPC was incubated for 3 min at 37 °C. The reaction was started by the addition of either the cytoplasmic (300 μg) or the mitochondrial (100 μg) form of purified human CAT. The rate of NADH oxidation was monitored at 340 nm (ϵ = 6220 m−1 cm−1) to determine the specific activity.
Aminoacrylate intermediate formation from CPC
Spectroscopic changes in CSE were monitored following the addition of 5 mm CPC in 100 mm Tris buffer, pH 8.5, or 100 mm HEPES buffer, pH 7.4. For this, 1 ml of the reaction mixture containing the desired buffer, 5 mm CPC, and CSE (50, 100, 200, or 300 μg) was incubated at 37 °C, and 100-μl aliquots were removed every 30 min over 3 h and mixed immediately with 1 mm DTNB (to react with 4-mercaptobutanoate), and the absorbance was recorded at 412 nm. A molar extinction coefficient of 13,600 m−1 cm−1 was used to estimate the concentration of nitrobenzene thiolate anion formed. Formation of the aminoacrylate intermediate from CPC at pH 8.5 was detected by absorption spectroscopy. For this, aliquots of CPC (0.2 mm) were added to CSE (100 μm) in 100 mm Tris buffer, pH 8.5, at 25 °C.
Isothermal titration calorimetry
For isothermal titration calorimetry analysis, 8-μl aliquots of 1.0 mm CPC dissolved in in 50 mm potassium phosphate, pH 7.4, were added to CSE (40 μm in the same buffer) at 20 °C. The data were analyzed by MicroCal ORIGIN software and fitted to a single-site model to determine the Kd for CPC binding to CSE.
Inhibition of transsulfuration flux by CPC in cell culture
Human hepatocarcinoma (HepG2), human embryonic kidney (HEK293), human neuroblastoma (SH-SY5Y), and mouse endothelioma (bEnd3) cell lines were obtained from ATCC (Manassas, VA). The human colon cancer cell line HT29 was a gift from Dr. William Smith (University of Michigan) and was authenticated by short tandem repeat analysis at the Genomics Core Facility (University of Michigan). The following media were used for cell culture: Eagle's minimum essential medium for HepG2, HEK293, and bEnd3; RPMI 1640 with 2 mm glutamine for HT29; and Dulbecco's modified Eagle's medium/F12 for SH-SY5Y. All media were supplemented with 10% fetal bovine serum (v/v), 100 units/ml penicillin, and 100 μg/ml streptomycin (Invitrogen). Cells were cultured to confluence of 80–90% at 37 °C in 6-cm plates with 4 ml of culture medium in a 5% CO2 incubator. The medium was changed every 3 days and 2 h before the start of the experiment. Then [35S]methionine (PerkinElmer Life Sciences) was added to a final concentration of 2 μCi/ml per plate. PPG (250 mm stock in PBS) or CPC (100 mm stock in PBS neutralized to pH 7.4 with NaOH) was added to the desired concentration, and incubation was continued for the desired length of time. In control experiments, [35S]methionine was added to cells in the absence of inhibitor.
To measure radiolabel incorporation into GSH, cell lysates were analyzed by HPLC as described previously (6, 7). Fractions corresponding to the GSH peak were collected, and radioactivity was measured using a liquid scintillation counter and normalized to the protein concentration in the same sample.
Inhibition of the transsulfuration flux in HepG2 cells was also tested in the presence of three esters of CPC (2.5 mm each dissolved in 10% DMSO), 2-amino-3[(4-methoxy-4-oxobutyl) sulfanyl] propanoic acid, methyl 4-[(2-amino-3-methoxy-3-oxopropyl) sulfanyl] butanoate, and methyl 4-[(2-amino-3-ethoxy-3-oxopropyl) sulfanyl] butanoate, as described above.
Western blot analysis of CBS and CSE
Cells were grown in 10-cm plates to a confluence of 80–90% as described above and washed twice with 4 ml of PBS, scraped, and placed in 1.5 ml of preweighed Eppendorf tubes. Following centrifugation for 5 min at 2000 × g at 4 °C, the cell pellet was weighed and then resuspended in 400 μl of lysis buffer (20 mm HEPES, pH 7.5, 25 mm KCl, 0.5% Nonidet P-40 (v/v), 1% (v/v) protease inhibitor mixture for mammalian tissues (Sigma)) per 100-mg pellet. The suspension was frozen and thawed and centrifuged, and the presence of CBS and CSE in the supernatant was detected by Western blot analysis as described previously (15). Rabbit monoclonal CBS antibody (Abcam, catalogue no. ab140600) was used at a dilution of 1:1000, and rabbit polyclonal CSE antibody (ProteinTech, catalogue no. 12217.1.AP) was used at a dilution of 1:2000. Purified recombinant human CBS and CSE were used as positive controls.
Crystallization and X-ray data collection
Crystals of CSE in complex with CPC (10 mg/ml CSE and 5 mm CPC in 20 mm HEPES, pH 7.4, 300 mm NaCl, 0.5 mm tris(2-carboxyethyl)phosphine, 10% glycerol) were grown using the hanging drop vapor diffusion method at 20 °C by mixing at a 1:1 ratio with the reservoir solution (0.03 m sodium nitrate, 0.03 m sodium phosphate dibasic, 0.03 m ammonium sulfate, 12.5% (v/v) methyl-2,4-pentanediol, 12.5% (w/v) PEG 1000, 12.5% (w/v) PEG 3350, and 0.1 m Tris-Bicine buffer, pH 8.5). Plate-like crystals obtained after 1 week were harvested and cryoprotected with the solution containing 16 mm HEPES, pH 7.4, 240 mm NaCl, 72 mm sodium nitrate, 72 mm sodium phosphate dibasic, 72 mm ammonium sulfate, 10% (v/v) methyl-2,4-pentanediol, 10% (w/v) PEG 1000, 10% (w/v) PEG 3350, 80 mm Tris-Bicine buffer, pH 8.5, and 10% (v/v) glycerol. Crystals were flash-frozen in liquid N2 and used for data collection. A 2.5 Å resolution Bragg diffracting data set was collected at the LS-CAT 21-ID-G beam line (Advanced Photon Source, Argonne National Laboratory) at 0.9786-Å wavelength.
Crystal structure determination
The raw data sets were integrated and scaled using HKL2000. The space group and the unit cell dimension of the CSE co-crystallized with CPC was P21 with a = 68.55 Å, b = 152.17 Å, c = 83.77 Å, α = 90°, β = 112.25°, and γ = 90°, respectively. The initial phases were obtained by molecular replacement using Phaser (46) with CSE as a search model (PDB code 2NMP) (18). The model was built using COOT (47), and refinement calculations were carried out using Phenix.Refine (48). The final model of the CSE·CPC complex had Rwork/Rfree of 0.196/0.230, and the Ramachandran statistics for favored/allowed/disallowed were 0.99/0.01/0%. Crystallographic data statistics are summarized in Table 2.
Author contributions
P. K. Y. and V. V. designed, performed, and analyzed the biochemical and cell culture experiments; P. K. Y. and U.-S. C. performed and H. K. assisted with the crystallographic analysis; A. W. assisted with inhibitor design; and R. B. helped conceive the experiments and analyze the data and co-wrote the manuscript with P. K. Y. and V. V. All authors edited the manuscript and approved the final version of the manuscript.
This work was supported in part by National Institutes of Health Grants HL58984 (to R. B.) and DK111465 (to U.-S. C.). The authors declare that they have no conflicts of interest with the contents of this article. The content is solely the responsibility of the authors and does not necessarily represent the official views of the National Institutes of Health.
The atomic coordinates and structure factors (code 6NBA) have been deposited in the Protein Data Bank (http://wwpdb.org/).
- PLP
- pyridoxal 5′-phosphate
- CAT
- cysteine aminotransferase
- CBS
- cystathionine β-synthase
- CPC
- S-3-carboxypropyl-l-cysteine
- CSE
- cystathionine γ-lyase
- MST
- mercaptopyruvate sulfurtransferase
- PPG
- propargylglycine
- Bicine
- N,N-bis(2-hydroxyethyl)glycine
- r.m.s.
- root mean square
- AA
- aminoacrylate
- DTNB
- 5,5′-dithiobis(2-nitrobenzoic acid)
- PDB
- Protein Data Bank.
References
- 1. Filipovic M. R., Zivanovic J., Alvarez B., and Banerjee R. (2018) Chemical biology of H2S signaling through persulfidation. Chem. Rev. 118, 1253–1337 10.1021/acs.chemrev.7b00205 [DOI] [PMC free article] [PubMed] [Google Scholar]
- 2. Kabil O., and Banerjee R. (2010) The redox biochemistry of hydrogen sulfide. J. Biol. Chem. 285, 21903–21907 10.1074/jbc.R110.128363 [DOI] [PMC free article] [PubMed] [Google Scholar]
- 3. Singh S., and Banerjee R. (2011) PLP-dependent H2S biogenesis. Biochim. Biophys. Acta 1814, 1518–1527 10.1016/j.bbapap.2011.02.004 [DOI] [PMC free article] [PubMed] [Google Scholar]
- 4. Yadav P. K., Yamada K., Chiku T., Koutmos M., and Banerjee R. (2013) Structure and kinetic analysis of H2S production by human mercaptopyruvate sulfurtransferase. J. Biol. Chem. 288, 20002–20013 10.1074/jbc.M113.466177 [DOI] [PMC free article] [PubMed] [Google Scholar]
- 5. Nagahara N., Yoshii T., Abe Y., and Matsumura T. (2007) Thioredoxin-dependent enzymatic activation of mercaptopyruvate sulfurtransferase: an intersubunit disulfide bond serves as a redox switch for activation. J. Biol. Chem. 282, 1561–1569 10.1074/jbc.M605931200 [DOI] [PubMed] [Google Scholar]
- 6. Mosharov E., Cranford M. R., and Banerjee R. (2000) The quantitatively important relationship between homocysteine metabolism and glutathione synthesis by the transsulfuration pathway and its regulation by redox changes. Biochemistry 39, 13005–13011 10.1021/bi001088w [DOI] [PubMed] [Google Scholar]
- 7. Vitvitsky V., Thomas M., Ghorpade A., Gendelman H. E., and Banerjee R. (2006) A functional transsulfuration pathway in the brain links to glutathione homeostasis. J. Biol. Chem. 281, 35785–35793 10.1074/jbc.M602799200 [DOI] [PubMed] [Google Scholar]
- 8. Banerjee R. (2017) Catalytic promiscuity and heme-dependent redox regulation of H2S synthesis. Curr. Opin. Chem. Biol. 37, 115–121 10.1016/j.cbpa.2017.02.021 [DOI] [PMC free article] [PubMed] [Google Scholar]
- 9. Chiku T., Padovani D., Zhu W., Singh S., Vitvitsky V., and Banerjee R. (2009) H2S biogenesis by human cystathionine γ-lyase leads to the novel sulfur metabolites lanthionine and homolanthionine and is responsive to the grade of hyperhomocysteinemia. J. Biol. Chem. 284, 11601–11612 10.1074/jbc.M808026200 [DOI] [PMC free article] [PubMed] [Google Scholar]
- 10. Singh S., Padovani D., Leslie R. A., Chiku T., and Banerjee R. (2009) Relative contributions of cystathionine beta-synthase and γ-cystathionase to H2S biogenesis via alternative trans-sulfuration reactions. J. Biol. Chem. 284, 22457–22466 10.1074/jbc.M109.010868 [DOI] [PMC free article] [PubMed] [Google Scholar]
- 11. Taoka S., Ohja S., Shan X., Kruger W. D., and Banerjee R. (1998) Evidence for heme-mediated redox regulation of human cystathionine β-synthase activity. J. Biol. Chem. 273, 25179–25184 10.1074/jbc.273.39.25179 [DOI] [PubMed] [Google Scholar]
- 12. Taoka S., and Banerjee R. (2001) Characterization of NO binding to human cystathionine [beta]-synthase: possible implications of the effects of CO and NO binding to the human enzyme. J. Inorg. Biochem. 87, 245–251 10.1016/S0162-0134(01)00335-X [DOI] [PubMed] [Google Scholar]
- 13. Taoka S., West M., and Banerjee R. (1999) Characterization of the heme and pyridoxal phosphate cofactors of human cystathionine β-synthase reveals nonequivalent active sites. Biochemistry 38, 2738–2744 10.1021/bi9826052 [DOI] [PubMed] [Google Scholar]
- 14. Kabil O., Yadav V., and Banerjee R. (2016) Heme-dependent metabolite switching regulates H2S synthesis in response to ER stress. J. Biol. Chem. 291, 16418–16423 10.1074/jbc.C116.742213 [DOI] [PMC free article] [PubMed] [Google Scholar]
- 15. Kabil O., Vitvitsky V., Xie P., and Banerjee R. (2011) The quantitative significance of the transsulfuration enzymes for H2S production in murine tissues. Antioxid. Redox Signal. 15, 363–372 10.1089/ars.2010.3781 [DOI] [PMC free article] [PubMed] [Google Scholar]
- 16. Jansonius J. N. (1998) Structure, evolution and action of vitamin B6-dependent enzymes. Curr. Opin. Struct. Biol. 8, 759–769 10.1016/S0959-440X(98)80096-1 [DOI] [PubMed] [Google Scholar]
- 17. Wang J., and Hegele R. (2003) Genomic basis of cystathioninuria (MIM 219500) revealed by multiple mutations in cystathionine γ-lyase (CTH). Hum. Genet. 112, 404–408 10.1007/s00439-003-0906-8 [DOI] [PubMed] [Google Scholar]
- 18. Sun Q., Collins R., Huang S., Holmberg-Schiavone L., Anand G. S., Tan C. H., van-den-Berg S., Deng L. W., Moore P. K., Karlberg T., and Sivaraman J. (2009) Structural basis for the inhibition mechanism of human cystathionine γ-lyase, an enzyme responsible for the production of H2S. J. Biol. Chem. 284, 3076–3085 10.1074/jbc.M805459200 [DOI] [PubMed] [Google Scholar]
- 19. Yamagata S., Yasugahira T., Okuda Y., and Iwama T. (2003) Conversion of the aminocrotonate intermediate limits the rate of γ-elimination reaction catalyzed by l-cystathionine γ-lyase of the yeast Saccharomyces cerevisiae. J. Biochem. 134, 607–613 10.1093/jb/mvg179 [DOI] [PubMed] [Google Scholar]
- 20. Ida T., Sawa T., Ihara H., Tsuchiya Y., Watanabe Y., Kumagai Y., Suematsu M., Motohashi H., Fujii S., Matsunaga T., Yamamoto M., Ono K., Devarie-Baez N. O., Xian M., Fukuto J. M., and Akaike T. (2014) Reactive cysteine persulfides and S-polythiolation regulate oxidative stress and redox signaling. Proc. Natl. Acad. Sci. U.S.A. 111, 7606–7611 10.1073/pnas.1321232111 [DOI] [PMC free article] [PubMed] [Google Scholar]
- 21. Yadav P. K., Martinov M., Vitvitsky V., Seravalli J., Wedmann R., Filipovic M. R., and Banerjee R. (2016) Biosynthesis and reactivity of cysteine persulfides in signaling. J. Am. Chem. Soc. 138, 289–299 10.1021/jacs.5b10494 [DOI] [PMC free article] [PubMed] [Google Scholar]
- 22. Asimakopoulou A., Panopoulos P., Chasapis C. T., Coletta C., Zhou Z., Cirino G., Giannis A., Szabo C., Spyroulias G. A., and Papapetropoulos A. (2013) Selectivity of commonly used pharmacological inhibitors for cystathionine β synthase (CBS) and cystathionine γ lyase (CSE). Br. J. Pharmacol. 169, 922–932 10.1111/bph.12171 [DOI] [PMC free article] [PubMed] [Google Scholar]
- 23. Abeles R. H., and Walsh C. (1973) Acetylenic enzyme inactivators: inactivation of γ-cystathionase, in vitro and in vivo by propargylglycine. J. Am. Chem. Soc. 95, 6124–6125 10.1021/ja00799a053 [DOI] [PubMed] [Google Scholar]
- 24. Lauinger C., and Ressler C. (1970) β-Cyanoalanine as a substrate for asparaginase: stoichiometry, kinetics, and inhibition. Biochim. Biophys. Acta 198, 316–323 10.1016/0005-2744(70)90064-1 [DOI] [PubMed] [Google Scholar]
- 25. Baxter C. F., and Roberts E. (1961) Elevation of γ-aminobutyric acid in brain: selective inhibition of γ-aminobutyric-α-ketoglutaric acid transaminase. J. Biol. Chem. 236, 3287–3294 [PubMed] [Google Scholar]
- 26. Rej R. (1977) Aminooxyacetate is not an adequate differential inhibitor of aspartate aminotransferase isoenzymes. Clin. Chem. 23, 1508–1509 [PubMed] [Google Scholar]
- 27. Steegborn C., Clausen T., Sondermann P., Jacob U., Worbs M., Marinkovic S., Huber R., and Wahl M. C. (1999) Kinetics and inhibition of recombinant human cystathionine γ-lyase: toward the rational control of transsulfuration. J. Biol. Chem. 274, 12675–12684 10.1074/jbc.274.18.12675 [DOI] [PubMed] [Google Scholar]
- 28. Clausen T., Huber R., Messerschmidt A., Pohlenz H. D., and Laber B. (1997) Slow-binding inhibition of Escherichia coli cystathionine β-lyase by l-aminoethoxyvinylglycine: a kinetic and X-ray study. Biochemistry 36, 12633–12643 10.1021/bi970630m [DOI] [PubMed] [Google Scholar]
- 29. Capitani G., McCarthy D. L., Gut H., Grütter M. G., and Kirsch J. F. (2002) Apple 1-aminocyclopropane-1-carboxylate synthase in complex with the inhibitor l-aminoethoxyvinylglycine: evidence for a ketimine intermediate. J. Biol. Chem. 277, 49735–49742 10.1074/jbc.M208427200 [DOI] [PubMed] [Google Scholar]
- 30. Shinozuka S., Tanase S., and Morino Y. (1982) Metabolic consequences of affinity labeling of cystathionase and alanine aminotransferase by l-propargylglycine in vivo. Eur. J. Biochem. 124, 377–382 [DOI] [PubMed] [Google Scholar]
- 31. Roman H. B., Hirschberger L. L., Krijt J., Valli A., Kožich V., and Stipanuk M. H. (2013) The cysteine dioxgenase knockout mouse: altered cysteine metabolism in nonhepatic tissues leads to excess H2S/HS− production and evidence of pancreatic and lung toxicity. Antioxid. Redox Signal. 19, 1321–1336 10.1089/ars.2012.5010 [DOI] [PMC free article] [PubMed] [Google Scholar]
- 32. Zhang J., Sio S. W., Moochhala S., and Bhatia M. (2010) Role of hydrogen sulfide in severe burn injury-induced inflammation in mice. Mol. Med. 16, 417–424 10.2119/molmed.2010.00027 [DOI] [PMC free article] [PubMed] [Google Scholar]
- 33. Whiteman M., Haigh R., Tarr J. M., Gooding K. M., Shore A. C., and Winyard P. G. (2010) Detection of hydrogen sulfide in plasma and knee-joint synovial fluid from rheumatoid arthritis patients: relation to clinical and laboratory measures of inflammation. Ann. N.Y. Acad. Sci. 1203, 146–150 10.1111/j.1749-6632.2010.05556.x [DOI] [PubMed] [Google Scholar]
- 34. Li L., Bhatia M., Zhu Y. Z., Zhu Y. C., Ramnath R. D., Wang Z. J., Anuar F. B., Whiteman M., Salto-Tellez M., and Moore P. K. (2005) Hydrogen sulfide is a novel mediator of lipopolysaccharide-induced inflammation in the mouse. FASEB J. 19, 1196–1198 10.1096/fj.04-3583fje [DOI] [PubMed] [Google Scholar]
- 35. Yan Y., Chen C., Zhou H., Gao H., Chen L., Chen L., Gao L., Zhao R., and Sun Y. (2013) Endogenous hydrogen sulfide formation mediates the liver damage in endotoxemic rats. Res. Vet. Sci. 94, 590–595 10.1016/j.rvsc.2012.10.009 [DOI] [PubMed] [Google Scholar]
- 36. Beatty P. W., and Reed D. J. (1980) Involvement of the cystathionine pathway in the biosynthesis of glutathione by isolated rat hepatocytes. Arch. Biochem. Biophys. 204, 80–87 10.1016/0003-9861(80)90009-0 [DOI] [PubMed] [Google Scholar]
- 37. Whiteman M., Le Trionnaire S., Chopra M., Fox B., and Whatmore J. (2011) Emerging role of hydrogen sulfide in health and disease: critical appraisal of biomarkers and pharmacological tools. Clin. Sci. 121, 459–488 10.1042/CS20110267 [DOI] [PubMed] [Google Scholar]
- 38. Vitvitsky V., Martinov M., Ataullakhanov F., Miller R. A., and Banerjee R. (2013) Sulfur-based redox alterations in long-lived Snell dwarf mice. Mech. Ageing Dev. 134, 321–330 10.1016/j.mad.2013.05.004 [DOI] [PMC free article] [PubMed] [Google Scholar]
- 39. Ohta J., Ubuka T., Kodama H., Sugahara K., and Nagamine N. (1997) A new metabolite of proglypargylglycine, γ-glutamylpropargylglycylglycine, in liver of dl-propargylglycine-administered rats. Biochim. Biophys. Acta 1334, 240–246 10.1016/S0304-4165(96)00100-6 [DOI] [PubMed] [Google Scholar]
- 40. Kawaji A., Sone T., Natsuki R., Isobe M., Takabatake E., and Yamaura Y. (1990) In vitro toxicity test of poisonous mushroom extracts with isolated rat hepatocytes. J. Toxicol. Sci. 15, 145–156 10.2131/jts.15.145 [DOI] [PubMed] [Google Scholar]
- 41. Zhu W., Lin A., and Banerjee R. (2008) Kinetic properties of polymorphic variants and pathogenic mutants in human cystathionine γ-lyase. Biochemistry 47, 6226–6232 10.1021/bi800351a [DOI] [PMC free article] [PubMed] [Google Scholar]
- 42. Yadav P. K., and Banerjee R. (2012) Detection of reaction intermediates during human cystathionine β-synthase-monitored turnover and H2S production. J. Biol. Chem. 287, 43464–43471 10.1074/jbc.M112.414722 [DOI] [PMC free article] [PubMed] [Google Scholar]
- 43. Yadav P. K., Xie P., and Banerjee R. (2012) Allosteric communication between the pyridoxal 5′-phosphate (PLP) and heme sites in the H2S generator human cystathionine β-synthase. J. Biol. Chem. 287, 37611–37620 10.1074/jbc.M112.414706 [DOI] [PMC free article] [PubMed] [Google Scholar]
- 44. Vitvitsky V., and Banerjee R. (2015) H2S analysis in biological samples using gas chromatography with sulfur chemiluminescence detection. Methods Enzymol. 554, 111–123 10.1016/bs.mie.2014.11.013 [DOI] [PMC free article] [PubMed] [Google Scholar]
- 45. Akagi R. (1982) Purification and characterization of cysteine aminotransferase from rat liver cytosol. Acta Med. Okayama 36, 187–197 10.18926/AMO/30697 [DOI] [PubMed] [Google Scholar]
- 46. McCoy A. J., Grosse-Kunstleve R. W., Adams P. D., Winn M. D., Storoni L. C., and Read R. J. (2007) Phaser crystallographic software. J. Appl. Crystallogr. 40, 658–674 10.1107/S0021889807021206 [DOI] [PMC free article] [PubMed] [Google Scholar]
- 47. Emsley P., Lohkamp B., Scott W. G., and Cowtan K. (2010) Features and development of Coot. Acta Crystallogr. D Biol. Crystallogr. 66, 486–501 10.1107/S0907444910007493 [DOI] [PMC free article] [PubMed] [Google Scholar]
- 48. Adams P. D., Afonine P. V., Bunkóczi G., Chen V. B., Davis I. W., Echols N., Headd J. J., Hung L. W., Kapral G. J., Grosse-Kunstleve R. W., McCoy A. J., Moriarty N. W., Oeffner R., Read R. J., Richardson D. C., et al. (2010) PHENIX: a comprehensive Python-based system for macromolecular structure solution. Acta Crystallogr. D Biol. Crystallogr. 66, 213–221 10.1107/S0907444909052925 [DOI] [PMC free article] [PubMed] [Google Scholar]