

Abstract
The mitochondrial matrix ATPase associated with diverse cellular activities (m-AAA) protease spastic paraplegia 7 (SPG7) has been recently implicated as either a negative or positive regulatory component of the mitochondrial permeability transition pore (mPTP) by two research groups. To address this controversy, we investigated possible mechanisms that explain the discrepancies between these two studies. We found that loss of the SPG7 gene increased resistance to Ca2+-induced mPTP opening. However, this occurs independently of cyclophilin D (cyclosporine A insensitive) rather it is through decreased mitochondrial Ca2+ concentrations and subsequent adaptations mediated by impaired formation of functional mitochondrial Ca2+ uniporter complexes. We found that SPG7 directs the m-AAA complex to favor association with the mitochondrial Ca2+ uniporter (MCU) and MCU processing regulates higher order MCU-complex formation. The results suggest that SPG7 does not constitute a core component of the mPTP but can modulate mPTP through regulation of the basal mitochondrial Ca2+ concentration.
Keywords: mitochondrial permeability transition (MPT), calcium, cyclophilin D, protein turnover, protein processing, mitochondrial calcium uniporter, spastic paraplegia 7
Introduction
The mitochondrial permeability transition pore (mPTP)2 is a Ca2+- and reactive oxygen species (ROS)-sensitive nonselective channel of unknown identity that is involved in many pathologies including ischemia reperfusion injury, Alzheimer's disease, amyloid lateral sclerosis, and diabetes (1–5). Over the past 40 years many models of the mPTP have been hypothesized; often these models rely on the idea that the core pore forming proteins bind to cyclophilin D (CypD) in a cyclosporine A (CsA)-sensitive manner. This is from the discovery that the immunosuppressant CsA could dramatically increase the threshold to mitochondrial Ca2+ overload-mediated pore opening (6, 7). Currently, one of the strongest candidates for the pore forming unit is the F0F1-ATP synthase, either as dimers or a dissociation between the F0 and F1 subunits (8, 9). The ATP synthase binds to CypD through the oligomycin sensitivity conferring protein in a CsA-sensitive manner; displaying conductance states similar to those observed in the mPTP, has a Mg2+ competitive Ca2+-binding site, pH sensitivity, and displays sensitivity to other pharmacological regulators of the pore, most notably benzodiazepines (10–12).
In contrast to this model there has recently been a report suggesting that the m-AAA protease spastic paraplegia 7 (SPG7) is an essential part of the mPTP (13). Shanmughapriya et al. (13) used an unbiased RNAi screen to identify candidates that when lost increase the calcium retention capacity (CRC) of human embryonic kidney (HEK) 293T cells independent of ROS. Additionally, using a yeast two-hybrid and co-immunoprecipitation technique, Shanmughapriya et al. (13) demonstrated that the C-terminal portion of SPG7, amino acids 700–795, was required for binding to CypD. Concerns have already been brought forth regarding how loss of the mPTP could lead to the clinical presentation of spastic paraplegia, as well as some broader concerns related to interpretation of the data presented (14). Our main concern was a lack of direct evidence linking SPG7 as a regulator of the mPTP through CypD. Shanmughapriya et al. (13) using human cell lines, created a CypD mutant that was insensitive to CsA and unable to bind to SPG7. Expression of this mutant failed to restore the phenotype of the SPG7 knockdown cells. Unfortunately, one of the sites they changed, R97G, is the same mutation used to render CypD isomerase deficient and unable to have any effect on the mPTP regardless of its binding partner (15). Additionally, in contrast to the report by Shanmughapriya et al. (13), it was recently shown that m-AAA–deficient mitochondria exhibited significantly reduced CRC and facilitated mPTP opening (16). These authors also show, using a knockout mouse model, that the loss of the m-AAA protease AFG3L2, the obligate binding partner of SPG7, increases mitochondrial Ca2+ through regulation of essential MCU regulator (EMRE) processing and formation of ungated mitochondrial Ca2+ uniporter (MCU) complexes (MCUc) (16, 17). In light of these discrepancies, we tested the ability of SPG7 to regulate the mPTP in a CypD-dependent manner and found that SPG7 does not constitute a core component of the mPTP, but instead regulates mPTP activity by lowering the basal mitochondrial Ca2+ ([Ca2+]mt) levels via regulation of MCU regulator 1 (MCUR1) and MCUc assembly.
Results
Characterization of the SPG7 KO cell line and constructs
In humans SPG7 functions in a hexameric complex in a 1:1 ratio with AFG3L2 but not as a homomeric complex (Fig. 1A). Therefore m-AAA protease KO HEK cell lines were created using a CRISPR Cas9 D10A NIckase (18, 19) using paired sgRNAs described in Table S2. Following 2 weeks of selection with puromycin, individual colonies were expanded. A genotyping protocol to detect the small change in size of an indel by using primers flanking the targeted cut site was used to verify knockout (Fig. 1B). The increase in the size of the amplicon from 327 to ∼350 bp indicates the presence of an indel in the SPG7 gene. To rescue the knockout, a CRISPR-resistant full-length (FL), a C-terminal-truncated (Δct, missing amino acids 700–795 that renders it unable to bind CypD), or a dominant-negative (DN, mutated Zn2+-binding region H574G, E575G, G577S, rendering it catalytically inactive) SPG7 was used (Fig. 1A) (13). The loss of SPG7 in the knockout and subsequent rescued cell lines were verified by immunoblotting (Fig. 1C). These results indicate that we could accurately reproduce model HEK 293T cell lines with both a loss of and rescue with SPG7.
Figure 1.

CRISPR-mediated deletion and rescue of SPG7. A, top: schematic of the structure of m-AAA proteases. TM, transmembrane spanning amino acids. Bottom: hexameric assembly of the m-AAA protease complexes in humans. B, representative gel of the PCR product from cDNA isolated from either HEK 293T control or SPG7 KO cells and schematic of guide RNAs (red) cut site (green arrow) and PAM motif (blue), and PCR strategy to verify the presence of indels by genotyping. C, representative Western blotting of HEK 293T control, SPG7 KO, FL SPG7 rescue, and Δct SPG7 rescue cell lines. The membrane is probed for SPG7 and AFG3L2 with HSP60 as a loading control (n = 3).
SPG7 modulates the mPTP in a manner independent of CypD
To assess the susceptibility of mPTP opening of each cell line, the CRC of permeabilized WT HEK 293T, the SPG7 KO, as well as the FL, Δct, and DN SPG7 rescue cell lines was determined (Fig. 2A). In these assays, the addition of CsA was used to achieve the maximum CRC for each cell population and thus was served as a reference point (21). The CRC of the WT HEK 293T cells was 34.2 ± 1.3% of the CsA capacity. As shown in Ref. 13, the loss of SPG7 resulted in a substantial increase in CRC to 50.6 ± 3.2% of the CsA capacity (Fig. 2). Interestingly, loss of SPG7 resulted in an ∼40 nmol increase of both the Ca2+ and Ca2+ + CsA treatment groups versus HEK 293T cells suggesting a greater reservoir for Ca2+ uptake (Fig. 2, G and H). Interestingly, loss of SPG7 did not alter the effects of CsA suggesting that SPG7 and CypD are acting via different mechanisms to open the mPTP. Both the FL and Δct SPG7 were able to reverse the increases in the CRC of the SPG7 KO cell line to 41.8 ± 5.1 and 39.3 ± 8.3% of CsA capacity, respectively, similar to those of WT HEK 293T cells (Fig. 2). Surprisingly, rescue of SPG7 KO with the DN SPG7 rescued the cells to mPTP opening with a CRC of 28.6 ± 1.5% of CsA capacity. This phenocopied the AFG3L2 KO cells that also had a CRC of 28.6 ± 1.5% of CsA capacity and reduced both the Ca2+ treatment and Ca2+ + CsA treatment groups versus HEK 293T cells (Fig. 2, E and F, Fig. S1A). These results indicate that the resistance to mPTP opening by the loss of SPG7 is acting in a manner independent of CypD.
Figure 2.

Loss of SPG7 increases CRC independent of CypD. A–F, representative traces of [Ca2+] clearance (Fura2-FF) of 3.75 × 10⁶ digitonin-permeabilized HEK 293T cells pulsed with 10 nmol of Ca2+ treated with vehicle (black trace) or 1 μm CsA (red trace). B, SPG7 KO. C, FL SPG7 rescue. D, Δct SPG7 rescue. E, DN SPG7 rescue. F, AFG3L2 KO. G, chart summarizing the results of A–F. H, quantification of the CRC ratio from A–F (S.D.; n = 3–6). *, p < 0.05 versus HEK 293T, individual values are represented by black dots.
Loss of SPG7 reduces mitochondrial matrix Ca2+ content and influx kinetics
The potential mechanisms why SPG7 KO can lead to an increased CRC were then investigated. We hypothesized that the [Ca2+]mt may be regulated by SPG7 function, which increases the available reservoir for mitochondria to take up more Ca2+ before mPTP opening occurs. Therefore, the basal [Ca2+]mt was assayed by incubating permeabilized HEK 293T cells in a solution containing membrane impermanent Fura2-FF, and thapsigargin to block ER Ca2+ uptake, using addition of 3 μm FCCP to collapse mitochondrial membrane potential and release the [Ca2+]mt into the incubating solution. Mitochondria in the SPG7 KO cells released 63 ± 24 nm Ca2+ versus 284 ± 75 nm Ca2+ in HEK 293T cells. Conversely the mitochondria from the DN SPG7 cells released 717 ± 197 nm Ca2+ (Fig. 3, A and B). To confirm our findings, we measured the levels of phosphorylated pyruvate dehydrogenase (PDH) at serine 293 (P-Ser293) as an indirect measurement of [Ca2+]mt. PDH is dephosphorylated by a Ca2+-dependent phosphatase, thus an increase in P-Ser293 PDH is indicative of lower [Ca2+]mt. When assayed via Western blotting, the SPG7 KO compared with control HEK 293T cells had a P-Ser293 PDH/total PDH ratio 1.57 ± 0.22 times that of HEK 293T cells, whereas the DN SPG7 expressing cells had a P-Ser293 PDH/total PDH ratio of 0.54 ± 0.25 times that of HEK 293T cells (Fig. 3, C and D). Last, to confirm our results the mitochondrial matrix targeted (Mt) Ca2+ probe GCamp6f (22) was transfected into our cell lines. Similar to the two other assays, the SPG7 KO had less, whereas the DN SPG7 rescue cells had more [Ca2+]mt than HEK 293T cells (Fig. S1, C and D). Because the [Ca2+]mt was affected, alterations in mitochondrial Ca2+ influx was interrogated. Using permeabilized HEK 293T cells in the presence of thapsigargin the SPG7 KO cells took up a bolus of 0.5 μm Ca2+ at a rate of 41.2 ± 5.47 nm/min versus 58.08 ± 2.02 and 79 ± 0.1.77 nm/min of HEK 293T and DN SPG7 cells, respectively (Fig. 4, A and B). To ensure that the differences in influx were not due to alterations of the driving force, mitochondrial membrane potential was assessed by the change of tetramethylrhodamine methyl ester fluorescence after addition of FCCP; no difference was observed (Fig. S1E). Taken together, these results indicate that loss of SPG7 is lowering the basal level of [Ca2+]mt content and the rate of Ca2+ influx, whereas loss of both SPG7 and AFG3L2 activity increases basal levels of [Ca2+]mt and the rate of Ca2+ influx. From these data we can infer that alterations in mitochondrial Ca2+ handling are likely a mechanism by which m-AAA proteases regulate tolerance to Ca2+-induced mPTP opening.
Figure 3.

SPG7 regulates basal mitochondrial matrix Ca2+ content. A, representative traces of the extramitochondrial [Ca2+] (Fura2-FF) of 3.75 × 10⁶ digitonin-permeabilized HEK 293T (black trace), SPG7 KO (red trace), or DN SPG7 (blue trace) cells in the presence of 2 μm thapsigargin. At 2 min, 3 μm FCCP is added. B, quantification of the average change in fluorescence ratio observed between basal state and after addition of 3 μm FCCP (S.D.; n = 8). C, representative Western blotting of mitochondria isolated from HEK 293T, SPG7 KO, or DN SPG7 cells. The membrane is probed for SPG7, P-Ser293 PDH, and total PDH. D, quantification of the average fluorescence intensity of P-Ser293 PDH/total PDH (S.D.; n = 4). *, p < 0.05 versus HEK 293T, individual values are represented by black dots.
Figure 4.

Loss of SPG7 lowers mitochondrial Ca2+ influx. A, representative trace of Calcium Green 5N fluorescence in 3.75 × 10⁶ digitonin-permeabilized HEK 293T (black trace), SPG7 KO (red trace), and DN SPG7 (blue trace) cells challenged with 0.5 μm Ca2+ in the presence of 2 μm thapsigargin. B, quantification of the average slope for the time to reach 50% Ca2+ uptake (S.D.; n = 4–5). *, p < 0.05 versus HEK 293T, individual values are represented by black dots.
Loss of SPG7 alters the MCU complex
To better understand the mechanism behind how Ca2+ influx was altered by m-AAA proteases we examined the expression of components of the MCU complex (Fig. 5, A and B). The SPG7 KO cells expressed 69.0 ± 7.8% MCUR1 more than HEK 293T, whereas DN SPG7 expressing cells had 192.5 ± 22.5% MCUR1 more than HEK 293T cells. MCU expressed 180.5 ± 10.7% that of HEK 293T cells in SPG7 KO cells, whereas DN SPG7 cells expressed 148.2 ± 11.0% of HEK 293T cells. The 11-kDa unprocessed form of EMRE was expressed at 46.4 ± 1.2 and 39.4 ± 1.6% in SPG7 KO and DN SPG7 cells, respectively, when compared with HEK 293T. The 7-kDa processed form of EMRE was expressed at 395.7 ± 31.9% in SPG7 KO and 175.0 ± 3.5% in DN SPG7 cells when compared with the HEK 293T cells. Last, MICU1 expression was increased to 184.1 ± 5.0% in SPG7 KO cells relative to HEK 293T cells, whereas DN SPG7 was 102.6 ± 8.4% and not significantly different from the HEK 293T cells (Fig. 5, A and B). These data suggested major alterations to MCU stoichiometry and assembly. Therefore we sought to estimate the changes in MCU assembly that would lead to alterations in the number of functional MCUc units; we estimated the SPG7 KO and DN SPG7 lines have a MCUc functional level of 36 ± 1 and 133 ± 6% that of HEK 293T cells, respectively (Fig. S2F). To assess if MCU complex assembly is indeed affected we took advantage of the fact that the MCU complex is partially resistant to denaturing SDS-PAGE (23). A C terminally hemagglutinin A (HA)-tagged MCU was overexpressed and immunoprecipitated to enrich the MCU complexes resident in each cell line. When immunoblotted for the HA tag, bands are observed at 34 and 40 kDa, and a faint 45-kDa complex could also be observed in the SPG7 KO and DN SPG7 input lanes (Fig. 6A). A large increase in higher order complex formation (40 kDa+) in the DN SPG7 sample was present in the immunoprecipitated samples (Fig. 6A). Surprisingly, only when immunoblotted for MCU did we observe the expected band at 30 kDa. A 60-kDa complex was also present in the input that could not be immunoprecipitated by anti-HA as this MCU complex was not recognized by our HA antibody (Fig. 6A). When the immunoprecipitated complexes were quantified the full-length (FL) 40-kDa MCU was 179.8 ± 21.6 and 627.9 ± 7.8% in the SPG7 KO and DN SPG7 versus HEK 293T cells, respectively (Fig. 6C); the MCU with the mitochondrial targeting sequence (MTS) removed appearing at 34 kDa was 153.7 ± 12.1 and 235.2 ± 21.3% in SPG7 KO and DN SPG7 versus HEK 293T cells, respectively (Fig. 6C); last the 3 bands between 34 and 30 kDa we term m-AAA MCU (blue bracket in Fig. 6A, right) were 283.4 ± 5.9 and 386.8 ± 41.3% in SPG7 KO and DN SPG7 versus HEK 293T cells, respectively (Fig. 6C). We expected to observe an accumulation of the products in each step of MCU processing affected by loss of SPG7. Therefore, we measured the ratios between the FL and MTS MCU to observe if the removal of the MTS or the ratio between the MTS- and 30–34 kDa m-AAA MCU were adversely affected.
Figure 5.
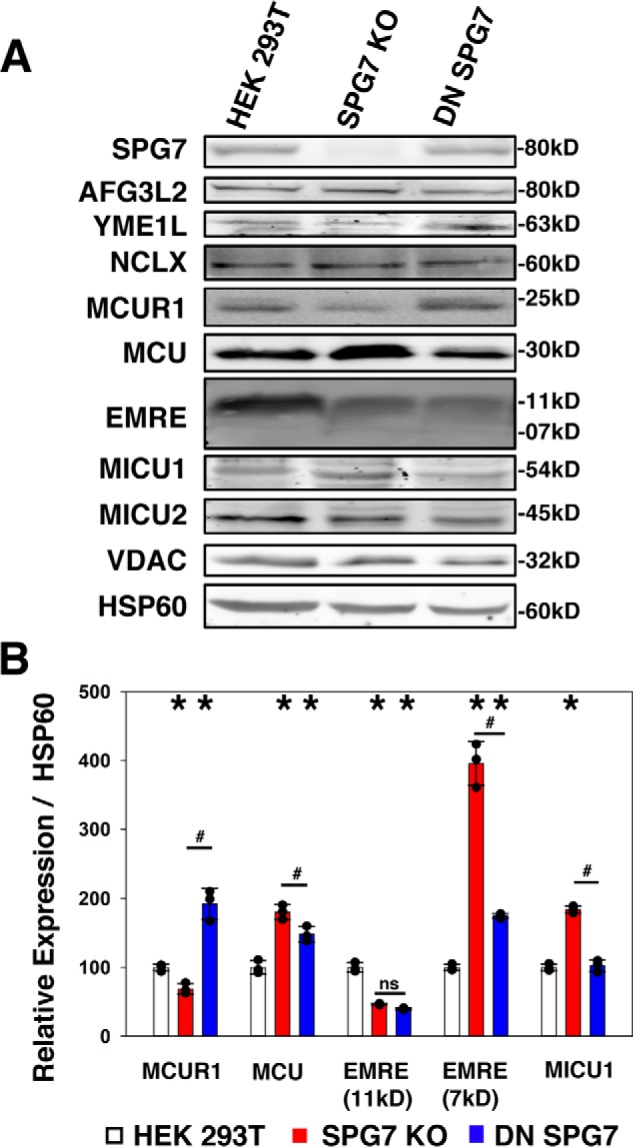
SPG7 modulates MCU and MCUR1. A, representative Western blotting of HEK 293T, SPG7 KO, and DN SPG7 cells. The membrane is probed for SPG7, AFG3L2, YME1L, NCLX, MCUR1, MCU, EMRE, MICU1, MICU2, VDAC, and HSP60 as a loading control. B, quantification of the average fluorescence intensity of the indicated bands normalized to HSP60 as a percentage of HEK 293T (S.D.; n = 3). *, p < 0.05 versus HEK 293T; #, p < 0.05 between groups, individual values are represented by black dots.
Figure 6.

SPG7 modulates MCU complex assembly. A, Western blotting of immunoprecipitation of HEK 293T, SPG7 KO, or DN SPG7 cells transfected with MCU-HA probed with either anti-HA (left) or anti-MCU (right) antibodies. Bands representative of higher order MCU complexes (red), MTS processing (green), and m-AAA protease processing (blue) are highlighted between colored brackets. Dashed red lines indicate splice sites between the merged 700 and 800 nm channels. B, schematic of the MCU protein. TM: transmembrane. C, quantification of the 40-kDa FL, 34-kDa MTS, and 34–30–kDa m-AAA–processed MCU from the membrane probed with MCU antibody in A normalized to the 50-kDa IgG band (S.D.; n = 3). D, quantification of the ratio between MTS/FL MCU and m-AAA/MTS MCU from C (S.D.; n = 3). *, p < 0.05 versus HEK 293T, ns = not significant, individual values are represented by black dots.
The MTS/FL MCU ratio remained unchanged at 85.7 ± 6.3% in the SPG7 KO versus HEK 293T cells and a significant decrease to 37.4 ± 3.7% in DN SPG7 versus HEK 293T cells (Fig. 6D). We also observed a significant increase to 185.0 ± 12.7% in the m-AAA/MTS MCU ratio in SPG7 KO versus control that is similarly present in the DN SPG7 cells, 165.8 ± 28.1%, versus HEK 293T cells (Fig. 6D). These changes were both likely driven by increases in the m-AAA levels. To confirm that alterations in m-AAA activity could drive changes in MCUc formation we performed a native PAGE of HEK293T, SPG7 KO, DN SPG7, and MCU KO cells. We observe increased levels of complex formation at 160.4 ± 10.3 and 227.1 ± 2.0% in SPG7 KO and DN SPG7 versus HEK 293T cells, respectively (Fig. S1). We suspect the major functional difference lies in the proportion of gated versus MCUc. To assess changes in the complex assembly we estimated the propensity for cells to form the basic functional MCUc unit of MCU + EMRE, factored in the available subunits for gating via MICU1, and lastly factored in the capacity for MCUc assembly via MCUR1 levels (Fig. S2).
Last, to see if there was a direct interaction between MCU and SPG7; MCU-HA– and FL SPG7-cMyc–tagged proteins were overexpressed in SPG7 KO cells and immunoprecipitated with either anti-HA or anti-cMyc antibody-conjugated beads. We observed that FL SPG7 was able to co-immunoprecipitate with MCU when precipitating with either antigen suggesting strongly that these proteins interact (Fig. 7, A and B). Moreover, we found no difference in binding affinity between FL SPG7 and DN SPG7; to our surprise Δct SPG7 had an increased affinity for MCU (Fig. S2, B and C). These results indicate that the MCU protein is directly modified by the m-AAA protease complex at the C terminus with increased efficiency when functional SPG7:AFG3L2 hetero-oligomers are present.
Figure 7.
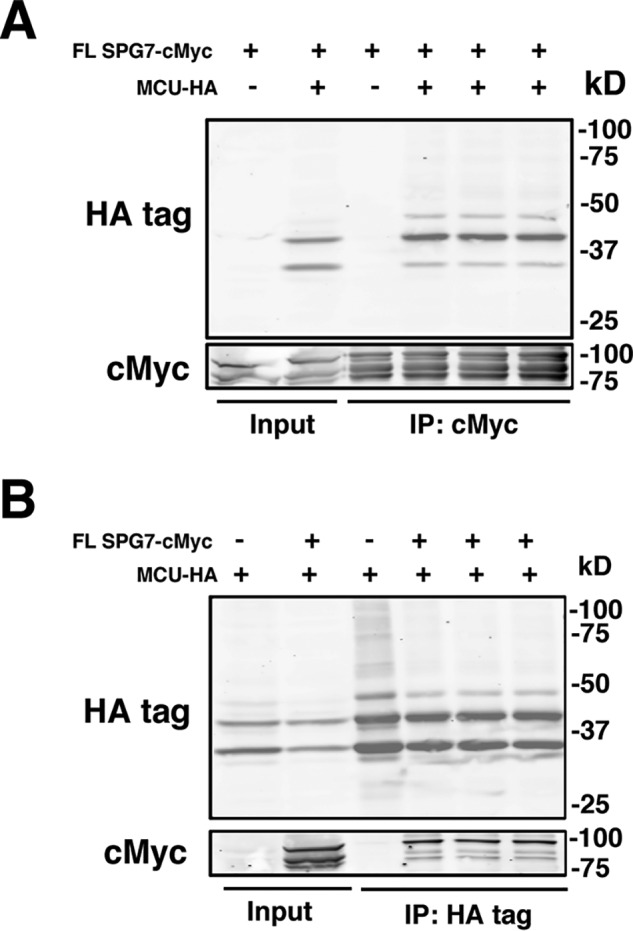
SPG7 interacts directly with MCU. Western blotting of SPG7 KO cells transfected with FL-SPG7 cMyc, MCU-HA, or both plasmids were immunoprecipitated (IP) with beads conjugated with anti-cMyc tag (A) or anti-HA (B) antibodies. Membranes were probed with anti-HA tag and cMyc antibodies.
Discussion
The current discrepancy between reports of SPG7 acting as either a positive or negative regulator of the mPTP led us to investigate the mechanism of mPTP regulation by SPG7 in HEK 293T cell lines with a loss of and subsequent rescue of SPG7. Using this experimental model we found that the CRC in SPG7 KO cells was still significantly increased by CsA, which suggests that CypD is binding to another complex and not mediating its effects through SPG7. Moreover, rescue of the SPG7 KO with a mutant of SPG7 that is unable to bind to CypD, could reverse the increases of CRC by SPG7 KO as well as maintain the sensitivity to CsA, which further confirmed CypD is binding to a protein other than SPG7 to regulate the mPTP. Strikingly, rather than failing to rescue the KO, rescue with a DN SPG7 restored the cells mPTP sensitivity, and reduced the maximum capacity when treated with CsA; phenotypically identical to loss of AFG3L2. We then investigated the potential mechanisms of how physical loss of SPG7 (KO) can lead to an increase in CRC, whereas functional loss (DN) can restore CRC. Using both a direct [Ca2+]mt release assay and the P-Ser293 PDH/total PDH ratio as a “bio-sensor,” we found that the loss of SPG7 led to lower basal levels of [Ca2+]mt, whereas expression of DN SPG7 increased the levels, which closely mirrors the trend of the CRC data. It is important to note there is a large discrepancy between the values in Ca2+ taken up by the CRC assay and those determined by the Ca2+ release assay. Although the SPG7 KO could take up 40 nmol of additional Ca2+/3.75 × 106 cells versus HEK 293T cells before mPTP opening, yet there was only a difference of 0.4412 nmol of Ca2+ released between SPG7 KO and HEK 293T cells in the Ca2+-release assay. One possible mechanism could be how the cells adapt to loss of SPG7 and the resulting sustained lower [Ca2+]mt. It was recently shown that mice lacking MCU from birth compensated to the lower basal [Ca2+]mt by sensitizing the mPTP threshold via phosphorylation on CypD (24). The authors hypothesize that the reduced [Ca2+]mt lowers the activity of the Ca2+-dependent phosphatases present, thus raising the basal level of phospho-CypD/total CypD, and thus its affinity to regulate the mPTP. It is possible a similar mechanism may be at play in the SPG7 KO cells; after ∼20 passages in culture the cells CRC began to normalize toward a similar capacity as WT cells. However, there was also a corresponding increase in AFG3L2 expression (data not shown).
Two recent reports suggested that the m-AAA proteases, of which SPG7 and AFG3L2 are members, can regulate [Ca2+]mt through the processing of EMRE (16, 17). However, both of these studies focused on the protein AFG3L2, which can form a homo-oligomer or hetero-oligomer with SPG7. Because SPG7 does not form functional homo-oligomers, we reasoned it may be responsible for targeting the m-AAA protease to a different substrate of the mitochondrial Ca2+ import machinery than the AFG3L2 homo-oligomers. This role was previously reported for SPG7's ability to target the m-AAA complex to process complex 1 of the electron transport chain independent of SPG7 proteolytic activity (26). Therefore, we measured the relative protein expression for the MCU complex components for [Ca2+]mt influx and NCLX to see if [Ca2+]mt efflux was altered. The loss of SPG7 significantly affected MCU, EMRE, MICU1, and MCUR1 levels, suggesting there may be alterations in functional MCU complex assembly.
To explore this, we immunoprecipitated HA-tagged MCU and looked at higher order complex assembly. To our surprise, we saw a difference in the bands identified by the anti-HA and anti-MCU antibodies. The HA antibody does not recognize proteins lower than 34 kDa. 34 kDa is the predicted molecular mass for MCU after processing by the mitochondrial processing peptidase, which is largely responsible for removing positively charged N-terminal mitochondrial targeting pre-sequences (27). MCU is predicted to lose the first 50–55 amino acids reducing the total molecular mass from 40 to 34 kDa (28, 29). Furthermore, the appearance of multiple bands between 34 and 30 kDa only recognized by the MCU antibody suggests MCU is being cleaved C terminally in a processive fashion, one of the key hallmarks of AAA-proteases, rather than a site-specific peptidase (30). Another striking difference between the DN and SPG7 KO was the presence of a 45-kDa band greatly increased in the DN SPG7 KO. We hypothesize that this is the ungated MCU:EMRE complex described in previous studies on AFG3L2-mediated regulation of MCU (16, 17). 45-kDa is the size one would expect of unprocessed EMRE (11 kDa) bound to the 34-kDa MTS-processed MCU. We believe the change in this complex is largely responsible for the disparity between the SPG7 KO, which preferentially targets the m-AAA hexamer to process MCU, and DN SPG7, which affects MCU processing and EMRE processing through its inhibition of AFG3L2. We observed that SPG7 KO has a minimal effect on the processing from FL MCU to MTS MCU yet the DN SPG7 has a profound effect on this process. It is likely that the available pool of functional AFG3L2 homo-oligomers is reduced through overexpression of DN-SPG7, which integrates into the AFG3L2 complex. The remaining pool of functional AFG3L2 homohexamers is likely overwhelmed with substrate and the resulting backup of mitochondrial protein turnover leads to loss of protein homeostasis and degradation. This ultimately results in an accumulation of intermediate forms of all m-AAA protease substrates; whereas loss of SPG7 affects a select subset of substrates leaving the majority of mitochondrial proteins available to turnover at a level the cell can compensate.
One open question we did not extensively explore is if SPG7 is directly regulating MCUR1 or if the change in expression we observed was due to lack of fully processed MCU to aid with stabilizing the MCUR1 protein scaffold. Overexpression of MCUR1 in SPG7 KO and HEK 293T cells displayed reduced 25-kDa processed MCUR1 in the KO, but unlike with MCU overexpression, no increased appearance of the 37-kDa form. However, in DN SPG7 cells, overexpression of MCUR1 resulted in an increase in the full-length MCUR1 at 37 kDa as well as more 25-kDa MCUR1, suggesting that AFG3L2 may be responsible for clearance and turnover of MCUR1 (data not shown). The MCU residues identified as essential to binding to MCUR1 were amino acids 150–220 in the N-terminal domain region and to a lesser extent amino acids 291–320 (31). Based on the observed 30-kDa size of MCU we would expect the m-AAA protease to remove the C-terminal amino acids up to approximately amino 314–320 leaving the MCUR1-binding regions largely intact. The loss of MCUR1 itself has a significant impact on Ca2+ sensitivity and threshold for opening of the mPTP (32). MCUR1 may act as a link between the MCU complex and the mPTP, thus less MCUR1 would keep Ca2+ influx, and the high Ca2+ nanodomains present at the MCU complex, separate from the mPTP; an idea affirmed by the observation that mitochondria can handle more Ca2+ with a steady slow infusion of Ca2+ versus a large bolus where rapid influx results in temporary nanodomains of high Ca2+ due to the slower kinetics of the phosphate buffering (17). Indeed, loss of the C-terminal amino acids on MCU may be essential to exposing the MCUR1-binding site for efficient complex assembly.
When König et al. (16) knocked out SPG7 in their model they observed no change in CRC capacity, in contrast to both Shanmughapriya et al. (13) and our data. We believe the key difference is that they used a murine model, which also expresses the m-AAA protease AFG3L1 and was lost as a pseudogene in humans (20). Because AFG3L1 can form functional homohexamers as well as heterohexamers with AFG3L2 and SPG7 it is likely the loss of SPG7 alone can be compensated for as one of these murine-specific complexes may be able to efficiently target MCU. Indeed, the major differences between AFG3L1 and AFG3L2 reside in the N-terminal region, which is suggested as a domain that contributes to substrate recognition (30). Even though SPG7 is different from both AFG3L1 and AFG3L2 at the N terminus, rescuing the SPG7 KO cells with AFG3L1 restored the CRC phenotype back to WT as well as the basal Ca2+ as assessed by Mt GCamp6f fluorescence. It is possible that rather than revealing a novel targeting motif the AFG3L1 and SPG7 subunits mask the AFG3L2-targeting site, which excludes substrates; a hypothesis we cannot rule out especially because SPG7 and AFG3L1 are quite different in the N-terminal motifs.
Whether SPG7 is acting solely through substrates of the MCU complex and we are observing an epistatic effect on mPTP regulation cannot be ruled out; the evidence there were no changes in ROS sensitivity of the mPTP in SPG7 KO, no changes in mitochondrial membrane potential, and that DN SPG7 expression did not alter the Ca2+ levels in MCU KO cells leads us to conclude that changes in MCUc formation are likely the primary mechanism of action (Fig. 8, Fig. S1).
Figure 8.

Central hypothesis. Schematic of m-AAA protease processing and regulation of MCU in the mitochondria. Loss of SPG7 KO reduces targeting of the hexameric m-AAA protease to MCU, whereas expression of DN SPG7 reduces total m-AAA capacity resulting in overwhelmed processing. These alterations change the stoichiometry and balanced assembly of the MCUc components, leading to reduced or disrupted basal [Ca2+]mt that can desensitize (SPG7 KO) or sensitize (DN SPG7) mPTP opening.
Our study investigated possible mechanisms for how m-AAA proteases could be both a positive and negative regulator of the mPTP. We conclude that SPG7 is not an essential component of the mPTP through its interaction with CypD, but rather a key regulator of the assembly of the mitochondrial Ca2+ influx mechanism. Loss of SPG7 reduces MCU processing as well as MCUR1 levels, whereas inhibition of all m-AAA protease activity has the opposite effect. Loss of SPG7 reduces the capacity for mitochondria to uptake Ca2+ at lower concentrations of Ca2+ as well as decreasing the basal resting state of [Ca2+]mt by reducing the number of fully functional MCU complexes. A chronic decrease in basal [Ca2+]mt ultimately leads to compensatory effects in the mitochondria that alter the mPTP threshold and Ca2+ sensitivity. Expression of DN-SPG7/loss of AFG3L2 further reduces the total pool of functional m-AAA proteases resulting in loss of mitochondrial protein homeostasis, formation of ungated MCU:EMRE channels, and increased levels of MCUR1. This ultimately leads to an increased basal [Ca2+]mt and mPTP sensitivity.
Experimental procedures
Materials
All materials and reagents used in this study are described in Tables S1–S3.
Cell culture
HEK 293T cells (ATCC, CRL-3216) were grown in high-glucose Dulbecco's modified Eagle's minimum essential medium (Fisher Scientific) supplemented with 10% heat-inactivated fetal bovine serum (Gibco) and 1% penicillin/streptomycin (Corning). Cells were kept in an incubator at 37 °C with 5% CO2.
Development of CRISPR knockout cell lines
The Cas9 D10A NIckase-2A Puro enzyme and U6 promoter and empty sgRNA site (Addgene) were each subcloned into modified pRSET vector with either a cytomegalovirus promoter system or with no promoter and terminator sequence. The sgRNAs were inserted into the empty sgRNA guide vector via Q5 site-directed mutagenesis and verified by DNA sequencing (Genscript) using the U6 Fwd Seq primer. Each sgRNA with promoter was PCR amplified and purified for Golden Gate Assembly to form a functional pair of guide RNAs using the primers indicated in Table S3. Final sgRNA vector was verified by DNA sequencing (Genscript) using the sgRNA seq Fwd and sgRNA seq Rev primers (Table S3). HEK 293T cells were transfected with 1 μg of Cas9 D10A NIckase plasmid and 2 μg of the sgRNA pair plasmid. Cells were selected with 1 μg/ml of puromycin for 2 weeks. Single cells were then clonally isolated and verified by PCR-genotyping of flanking regions of the targeted cut site and/or Western blotting.
Transfection
Cells plated in a 35-mm dish at 80% confluence were transfected by adding 3 μg of plasmid to 100 μl of Xfect Buffer, mixed, and 0.9 μl of nanoparticles (Clontech) were added to the tube and vortexed. The DNA:nanoparticle complex was added dropwise to the cells and incubated for 2 h at 37 °C before replacing the media with 2 ml of standard culture media. Cells are assayed or begin selection for stable cell lines at 48 h post transfection.
Western blotting
Protein content was quantified using a BCA protein assay (Thermo Fisher Scientific). Equal quantities of protein for each sample was diluted in Laemmli buffer (60 mm Tris, 5% β-mercaptoethanol, 2% sodium dodecyl sulfate, 10% glycerol, 0.01% bromphenol blue, pH 6.8). Primary antibodies (see Table S2) were diluted in PBS-T (0.05% Tween) as follows: 1:200: AFG3L2, MICU1, PDH E1-A, and NCLX; 1:500: EMRE; 1:1000: SPG7, MCU, and MICU2; 1:2000: cMyc and HA; 1:5000: VDAC; 1:10,000: P-Ser293 PDHE1-A. Secondary antibodies were diluted 1:20,000 in PBS-T (0.05% Tween). Membrane was read by an Odyssey Classic machine (LI-COR). Image was analyzed using Image Studio Lite Software (LI-COR).
Native gel electrophoresis
Equal quantities of protein for each sample samples were diluted in Native Buffer (60 mm Tris, 10% glycerol, 0.01% bromphenol blue, pH 6.8) and run on a 4–20% PAGE gel (Bio-Rad). Membranes are probed with Ponceau stain (0.1% Ponceau S, 1% acetic acid, v/v) and subsequently immunoprobed using anti-MCU 1:1000 as described under “Western blotting.”
Estimation of MCUc assembly
As the exact stoichiometry between MCUc remains unknown, using the protein expression determined by Western blotting we determined the capacity to form the minimal functional MCUc unit comprised of EMRE and MCU. To determine whether the complex was gated we divided the minimal MCUc unit capacity by MICU1 expression. Last, to estimate the capacity to assemble the complex we multiplied the gated MCUc by the availability of the assembly factor, MCUR1.
| (Eq. 1) |
Immunoprecipitation
Cell lysate was prepared from transiently transfected cells using 1× lysis buffer (Cell Signaling Technologies) with protease and phosphatase inhibitor cocktails (Biotool). Cells are cleared by centrifugation at 2000 × g for 5 min at 4 °C. 10% Lysate was reserved as input. Anti-HA– or myc tag–conjugated magnetic beads were added to the remaining lysate as per the manufacturer's instructions and incubated 2 h at room temperature while shaking. Beads are washed 3 times with PBS and eluted in Laemmli buffer (60 mm Tris, 5% β-mercaptoethanol, 2% sodium dodecyl sulfate, 10% glycerol, 0.01% bromphenol blue, pH 6.8) incubated at 95 °C for 5 min. Input and immunoprecipitation elute were subsequently analyzed by Western blotting.
Calcium retention capacity
HEK 293T cells were counted and resuspended to a concentration of 12.5 × 10⁶ cells/ml in mitochondrial assay buffer (20 mm Tris, 150 mm sucrose, 50 mm KCl, 2 mm KH2PO4, and 5 mm succinate, 20 μm EGTA). 300 μl of cell suspension (3.75 × 10⁶ cells) was transferred to each of 4 cuvettes containing 1.7 ml of mitochondrial assay buffer supplemented with 2 μm thapsigargin, 0.6 μm JC1, and 0.5 μm Fura2-FF. 1 μm CsA was added to 2 of the 4 cuvettes. Cuvettes were placed into a Cary Eclipse fluorescent spectrophotometer. Digitonin (20 μm) was added at 1 min and, starting at 5 min, 40 nmol of CaCl2 was added and 10 nmol of CaCl2 every 2 min after until mPTP was opened.
Assessment of mitochondrial Ca2+ content and membrane potential
HEK 293T cells were counted and resuspended to a concentration of 12.5 × 10⁶ cells/ml in mitochondrial assay buffer. 300 μl of the cell suspension (3.75 × 10⁶ cells) was transferred to each of 4 cuvettes containing 1.7 ml of mitochondrial assay buffer supplemented with 2 μm thapsigargin, and 0.5 μm Fura2-FF (Ca2+) or 1 μm tetramethylrhodamine methyl ester (membrane potential), and 20 μm digitonin. Cuvettes were placed into a Cary Eclipse fluorescent spectrophotometer. At 2 min of basal recording 3 μm FCCP was added to release [Ca2+]mt.
Alternatively, HEK 293T cells were transfected with Mt GCamp6f. After 48 h images were collected using GFP filters (excitation 488 nm, emission 510 nm) and 20–50 cells were acquired at ×40 using an Olympus FV1000 confocal microscope per experiment. Background corrected cell fluorescence was obtained and normalized to the average fluorescence/cell in each experiment.
Assessment of mitochondrial Ca2+ kinetics
HEK 293T cells were counted and resuspended to a concentration of 12.5 × 10⁶ cells/ml in mitochondrial assay buffer. 300 μl of the cell suspension (3.75 × 10⁶ cells) was transferred to 1 of 2 cuvettes, each containing 1.7 ml of mitochondrial assay buffer supplemented with 2 μm thapsigargin, and 0.5 μm calcium green, 5 n hexapotassium salt, and 20 μm digitonin. Cuvettes were placed into a Cary Eclipse fluorescent spectrophotometer.
10 nmol of CaCl2 was added (0.5 μm final to each cuvette) and read for 5 min. The rate of Ca2+ clearance was calculated as the average slope from addition to reach 50% Ca2+ clearance.
Ligation independent cloning
pcDNA3.1 Hygro+ vectors with the Multiple Cloning Site were replaced with a ligation independent cloning site (TTCGCAGGAGCGGCCGCTCCGCTGAA) and in-frame tag or targeting signal insertion sites via a Q5 site-directed mutagenesis kit (New England Biolabs) and the primers indicated in Table S3. Vectors were linearized with NotI and treated with T4 DNA polymerase in the presence of only dTTP. Target Genes were PCR amplified from cDNA from human or mouse heart tissue with the primers indicated in Table S3. Agarose gel was purified and treated with T4 DNA polymerase in the presence of only dATP. Insert and vector are mixed at a ratio of 3/1 and transformed into New England Biolabs 10-β bacteria. Plasmids are verified by DNA sequencing (Genscript). DN SPG7 vectors were generated using Q5 site-directed mutagenesis and the primers indicated in Table S2.
Statistical analysis
Data for multiple experiments were quantified and expressed as mean ± S.E. where indicated. Differences between groups were determined using independent Student's t test. Differences in means among multiple groups were analyzed using one-way analysis of variance with a Bonferroni's and Tukey's post hoc test to determine significance between groups. Statistical significance was set at a threshold of p < 0.05. The data were computed using SPSS version 23.0.0 software.
Author contributions
S. H. and S.-S. S. conceptualization; S. H. and A. B. investigation; S. H. and S.-S. S. methodology; S. H. writing-original draft; S. H., G. C., and S.-S. S. writing-review and editing; S.-S. S. supervision; S.-S. S. funding acquisition.
Supplementary Material
Acknowledgments
We acknowledge Sergio DeLaFuente-Perez, Celia Fernandez-Sanz, Yuexing Yuan, Sebastian Lanvermann, Stephan Attilus, and Jennifer Wilson for their valuable comments and suggestions in preparation of this manuscript.
This work was supported by National Institutes of Health Grants 2R01HL093671, 1R01HL122124, and 1RO1114760 (to S.-S. S.) and T32AA007463 (to S. H.). The authors declare that they have no conflicts of interest with the contents of this article. The content is solely the responsibility of the authors and does not necessarily represent the official views of the National Institutes of Health.
This article contains Figs. S1–S2 and Tables S1–S3.
- mPTP
- mitochondrial permeability transition pore
- m-AAA
- matrix ATPase associated with diverse cellular activities
- ROS
- reactive oxygen species
- CypD
- cyclophilin D
- CsA
- cyclosporine A
- SPG7
- spastic paraplegia 7
- CRC
- calcium retention capacity
- EMRE
- essential MCU regulator
- MCU
- mitochondrial Ca2+ uniporter
- MCUR1
- MCU regulator 1
- HEK
- human embryonic kidney
- sgRNA
- single guide RNA
- DN
- dominant-negative
- FCCP
- carbonyl cyanide p-trifluoromethoxyphenylhydrazone
- PDH
- pyruvate dehydrogenase
- Mt
- matrix targeted
- HA
- hemagglutinin A
- FL
- full-length
- MTS
- mitochondrial targeting sequence
- IP
- immunoprecipitated
- [Ca2+]mt
- mitochondrial Ca2+.
References
- 1. Du H., Guo L., Fang F., Chen D., Sosunov A. A., McKhann G. M., Yan Y., Wang C., Zhang H., Molkentin J. D., Gunn-Moore F. J., Vonsattel J. P., Arancio O., Chen J. X., and Yan S. D. (2008) Cyclophilin D deficiency attenuates mitochondrial and neuronal perturbation and ameliorates learning and memory in Alzheimer's disease. Nat. Med. 14, 1097–1105 10.1038/nm.1868 [DOI] [PMC free article] [PubMed] [Google Scholar]
- 2. Martin L. J., Fancelli D., Wong M., Niedzwiecki M., Ballarini M., Plyte S., and Chang Q. (2014) GNX-4728, a novel small molecule drug inhibitor of mitochondrial permeability transition, is therapeutic in a mouse model of amyotrophic lateral sclerosis. Front. Cell Neurosci. 8, 433 [DOI] [PMC free article] [PubMed] [Google Scholar]
- 3. Shiga Y., Onodera H., Matsuo Y., and Kogure K. (1992) Cyclosporin A protects against ischemia-reperfusion injury in the brain. Brain Res. 595, 145–148 10.1016/0006-8993(92)91465-Q [DOI] [PubMed] [Google Scholar]
- 4. Gomez L., Paillard M., Thibault H., Derumeaux G., and Ovize M. (2008) Inhibition of GSK3β by postconditioning is required to prevent opening of the mitochondrial permeability transition pore during reperfusion. Circulation 117, 2761–2768 10.1161/CIRCULATIONAHA.107.755066 [DOI] [PubMed] [Google Scholar]
- 5. Ding Y., Fang H., Shang W., Xiao Y., Sun T., Hou N., Pan L., Sun X., Ma Q., Zhou J., Wang X., Zhang X., and Cheng H. (2015) Mitoflash altered by metabolic stress in insulin-resistant skeletal muscle. J. Mol. Med. 93, 1119–1130 10.1007/s00109-015-1278-y [DOI] [PMC free article] [PubMed] [Google Scholar]
- 6. Fournier N., Ducet G., and Crevat A. (1987) Action of cyclosporine on mitochondrial calcium fluxes. J. Bioenerg. Biomembr. 19, 297–303 10.1007/BF00762419 [DOI] [PubMed] [Google Scholar]
- 7. Crompton M., Ellinger H., and Costi A. (1988) Inhibition by cyclosporin A of a Ca2+-dependent pore in heart mitochondria activated by inorganic phosphate and oxidative stress. Biochem. J. 255, 357–360 [PMC free article] [PubMed] [Google Scholar]
- 8. Alavian K. N., Beutner G., Lazrove E., Sacchetti S., Park H.-A., Licznerski P., Li H., Nabili P., Hockensmith K., Graham M., Porter G. A., and Jonas E. A. (2014) An uncoupling channel within the c-subunit ring of the F1FO-ATP synthase is the mitochondrial permeability transition pore. Proc. Natl. Acad. Sci. U.S.A. 111, 10580–10585 10.1073/pnas.1401591111 [DOI] [PMC free article] [PubMed] [Google Scholar]
- 9. Giorgio V., Stockum, von S., Antoniel M., Fabbro A., Fogolari F., Forte M., Glick G. D., Petronilli V., Zoratti M., Szabó I., Lippe G., and Bernardi P. (2013) Dimers of mitochondrial ATP synthase form the permeability transition pore. Proc. Natl. Acad. Sci. U.S.A. 110, 5887–5892 10.1073/pnas.1217823110 [DOI] [PMC free article] [PubMed] [Google Scholar]
- 10. Antoniel M., Giorgio V., Fogolari F., Glick G. D., Bernardi P., and Lippe G. (2014) The oligomycin-sensitivity conferring protein of mitochondrial ATP synthase: emerging new roles in mitochondrial pathophysiology. Int. J. Mol. Sci. 15, 7513–7536 10.3390/ijms15057513 [DOI] [PMC free article] [PubMed] [Google Scholar]
- 11. Bernardi P., Rasola A., Forte M., and Lippe G. (2015) The mitochondrial permeability transition pore: channel formation by F-ATP synthase, integration in signal transduction, and role in pathophysiology. Physiol. Rev. 95, 1111–1155 10.1152/physrev.00001.2015 [DOI] [PMC free article] [PubMed] [Google Scholar]
- 12. Giorgio V., Burchell V., Schiavone M., Bassot C., Minervini G., Petronilli V., Argenton F., Forte M., Tosatto S., Lippe G., and Bernardi P. (2017) Ca2+ binding to F-ATP synthase β subunit triggers the mitochondrial permeability transition. EMBO Rep. 18, 1065–1076 10.15252/embr.201643354 [DOI] [PMC free article] [PubMed] [Google Scholar]
- 13. Shanmughapriya S., Rajan S., Hoffman N. E., Higgins A. M., Tomar D., Nemani N., Hines K. J., Smith D. J., Eguchi A., Vallem S., Shaikh F., Cheung M., Leonard N. J., Stolakis R. S., Wolfers M. P., et al. (2015) SPG7 is an essential and conserved component of the mitochondrial permeability transition pore. Mol. Cell 60, 47–62 10.1016/j.molcel.2015.08.009 [DOI] [PMC free article] [PubMed] [Google Scholar]
- 14. Bernardi P., and Forte M. (2015) Commentary: SPG7 is an essential and conserved component of the mitochondrial permeability transition pore. Front. Physiol. 6, 320 [DOI] [PMC free article] [PubMed] [Google Scholar]
- 15. Baines C. P., Kaiser R. A., Purcell N. H., Blair N. S., Osinska H., Hambleton M. A., Brunskill E. W., Sayen M. R., Gottlieb R. A., Dorn G. W., Robbins J., and Molkentin J. D. (2005) Loss of cyclophilin D reveals a critical role for mitochondrial permeability transition in cell death. Nature 434, 658–662 10.1038/nature03434 [DOI] [PubMed] [Google Scholar]
- 16. König T., Tröder S. E., Bakka K., Korwitz A., Richter-Dennerlein R., Lampe P. A., Patron M., Mühlmeister M., Guerrero-Castillo S., Brandt U., Decker T., Lauria I., Paggio A., Rizzuto R., Rugarli E. I., et al. (2016) The m-AAA protease associated with neurodegeneration limits MCU activity in mitochondria. Mol. Cell 64, 148–162 10.1016/j.molcel.2016.08.020 [DOI] [PubMed] [Google Scholar]
- 17. Tsai C.-W., Wu Y., Pao P.-C., Phillips C. B., Williams C., Miller C., Ranaghan M., and Tsai M.-F. (2017) Proteolytic control of the mitochondrial calcium uniporter complex. Proc. Natl. Acad. Sci. U.S.A. 114, 4388–4393 10.1073/pnas.1702938114 [DOI] [PMC free article] [PubMed] [Google Scholar]
- 18. Ran F. A., Hsu P. D., Lin C.-Y., Gootenberg J. S., Konermann S., Trevino A. E., Scott D. A., Inoue A., Matoba S., Zhang Y., and Zhang F. (2013) Double nicking by RNA-guided CRISPR Cas9 for enhanced genome editing specificity. Cell 154, 1380–1389 10.1016/j.cell.2013.08.021 [DOI] [PMC free article] [PubMed] [Google Scholar]
- 19. Ran F. A., Hsu P. D., Wright J., Agarwala V., Scott D. A., and Zhang F. (2013) Genome engineering using the CRISPR-Cas9 system. Nat. Protoc. 8, 2281–2308 10.1038/nprot.2013.143 [DOI] [PMC free article] [PubMed] [Google Scholar]
- 20. Consolato F., Maltecca F., Tulli S., Sambri I., and Casari G. (2018) m-AAA and i-AAA complexes coordinate to regulate OMA1, the stress-activated supervisor of mitochondrial dynamics. J. Cell Sci. 131, jcs213546 10.1242/jcs.213546 [DOI] [PubMed] [Google Scholar]
- 21. He J., Ford H. C., Carroll J., Ding S., Fearnley I. M., and Walker J. E. (2017) Persistence of the mitochondrial permeability transition in the absence of subunit c of human ATP synthase. Proc. Natl. Acad. Sci. U.S.A. 114, 3409–3414 10.1073/pnas.1702357114 [DOI] [PMC free article] [PubMed] [Google Scholar]
- 22. Chen T.-W., Wardill T. J., Sun Y., Pulver S. R., Renninger S. L., Baohan A., Schreiter E. R., Kerr R. A., Orger M. B., Jayaraman V., Looger L. L., Svoboda K., and Kim D. S. (2013) Ultrasensitive fluorescent proteins for imaging neuronal activity. Nature 499, 295–300 10.1038/nature12354 [DOI] [PMC free article] [PubMed] [Google Scholar]
- 23. Lee S. K., Shanmughapriya S., Mok M. C. Y., Dong Z., Tomar D., Carvalho E., Rajan S., Junop M. S., Madesh M., and Stathopulos P. B. (2016) Structural insights into mitochondrial calcium uniporter regulation by divalent cations. Cell Chem. Biol. 23, 1157–1169 10.1016/j.chembiol.2016.07.012 [DOI] [PMC free article] [PubMed] [Google Scholar]
- 24. Parks R. J., Menazza S., Holmström K. M., Amanakis G., Fergusson M., Ma H., Aponte A. M., Bernardi P., Finkel T., and Murphy E. (2019) Cyclophilin D-mediated regulation of the permeability transition pore is altered in mice lacking the mitochondrial calcium uniporter. Cardiovasc. Res. 115, 385–394 10.1093/cvr/cvy218 [DOI] [PMC free article] [PubMed] [Google Scholar]
- 25. Chalmers S., and Nicholls D. G. (2003) The relationship between free and total calcium concentrations in the matrix of liver and brain mitochondria. J. Biol. Chem. 278, 19062–19070 10.1074/jbc.M212661200 [DOI] [PubMed] [Google Scholar]
- 26. Atorino L., Silvestri L., Koppen M., Cassina L., Ballabio A., Marconi R., Langer T., and Casari G. (2003) Loss of m-AAA protease in mitochondria causes complex I deficiency and increased sensitivity to oxidative stress in hereditary spastic paraplegia. J. Cell Biol. 163, 777–787 10.1083/jcb.200304112 [DOI] [PMC free article] [PubMed] [Google Scholar]
- 27. Teixeira P. F., and Glaser E. (2013) Processing peptidases in mitochondria and chloroplasts. Biochim. Biophys. Acta 1833, 360–370 10.1016/j.bbamcr.2012.03.012 [DOI] [PubMed] [Google Scholar]
- 28. Emanuelsson O., Brunak S., von Heijne G., and Nielsen H. (2007) Locating proteins in the cell using TargetP, SignalP and related tools. Nat. Protoc. 2, 953–971 10.1038/nprot.2007.131 [DOI] [PubMed] [Google Scholar]
- 29. Claros M. G., and Vincens P. (1996) Computational method to predict mitochondrially imported proteins and their targeting sequences. Eur. J. Biochem. 241, 779–786 10.1111/j.1432-1033.1996.00779.x [DOI] [PubMed] [Google Scholar]
- 30. Glynn S. E. (2017) Multifunctional mitochondrial AAA proteases. Front. Mol. Biosci. 4, 34 10.3389/fmolb.2017.00034 [DOI] [PMC free article] [PubMed] [Google Scholar]
- 31. Tomar D., Dong Z., Shanmughapriya S., Koch D. A., Thomas T., Hoffman N. E., Timbalia S. A., Goldman S. J., Breves S. L., Corbally D. P., Nemani N., Fairweather J. P., Cutri A. R., Zhang X., Song J., et al. (2016) MCUR1 is a scaffold factor for the MCU complex function and promotes mitochondrial bioenergetics. Cell Rep. 15, 1673–1685 10.1016/j.celrep.2016.04.050 [DOI] [PMC free article] [PubMed] [Google Scholar]
- 32. Chaudhuri D., Artiga D. J., Abiria S. A., and Clapham D. E. (2016) Mitochondrial calcium uniporter regulator 1 (MCUR1) regulates the calcium threshold for the mitochondrial permeability transition. Proc. Natl. Acad. Sci. U.S.A. 113, E1872–E1880 10.1073/pnas.1602264113 [DOI] [PMC free article] [PubMed] [Google Scholar]
Associated Data
This section collects any data citations, data availability statements, or supplementary materials included in this article.