

Abstract
The fibroblast growth factor (FGF) signaling cascade is a key signaling pathway in hepatocarcinogenesis. We report high FGF receptor (FGFR) expression in 17.7% (11 of 62) of hepatocellular carcinoma (HCC) models. Infigratinib, a pan‐FGFR inhibitor, potently suppresses the growth of high‐FGFR‐expressing and sorafenib‐resistant HCCs. Infigratinib inhibits FGFR signaling and its downstream targets, cell proliferation, the angiogenic rescue program, hypoxia, invasion, and metastasis. Infigratinib also induces apoptosis and vessel normalization and improves the overall survival of mice bearing FGFR‐driven HCCs. Infigratinib acts in synergy with the microtubule‐depolymerizing drug vinorelbine to promote apoptosis, suppress tumor growth, and improve the overall survival of mice. Increased expression levels of FGFR‐2 and FGFR‐3 through gene amplification correlate with treatment response and may serve as potential biomarkers for patient selection. Conclusion: Treatments with Infigratinib alone or in combination with vinorelbine may be effective in a subset of patients with HCC with FGFR‐driven tumors.
Abbreviations
- ERK
extracellular signal‐regulated kinase
- FGF
fibroblast growth factor
- FGFR
fibroblast growth factor receptor
- HCC
hepatocellular carcinoma
- HGF
hepatocyte growth factor
- HIF1α
hypoxia inducible factor 1 alpha subunit
- OS
overall survival
- PARP
poly(adenosine diphosphate ribose) polymerase
- VEGF
vascular endothelial growth factor
Hepatocellular carcinoma (HCC) is the second most common cause of cancer death worldwide.1 Two randomized controlled trials of sorafenib in patients with HCC showed improvements in median overall survival (OS) to almost 3 months and established sorafenib as a standard of care for advanced HCC.2, 3 Although sorafenib improves the OS of patients with HCC, the benefit is at best modest and transient.2, 3 Recently, lenvatinib has been shown to be noninferior to sorafenib in a phase III trial4 and was approved by the U.S. Food and Drug Administration (FDA) as a first line of treatment for HCC. In second line, regorafenib5 and cabozantinib6 were approved after significantly improved OS in patients with HCC. Nivolumab was approved by the FDA for HCC treatment based on the objective response rate and durability of response observed in a phase I/II trial.7 Thus, there is clearly a need for effective therapies to combat this deadly disease.
Overexpression of fibroblast growth factor (FGF) receptor (FGFR)‐2 and FGFR‐3 contributes to the tumorigenesis, metastasis, and poor prognosis of HCC.8, 9 FGF‐8, FGF‐17, FGF‐18, and FGFR‐2 were elevated in the majority of HCC cases.9, 10 High expression of FGFR‐2 in HCC has been correlated with distant recurrence, less tumor differentiation, portal vein invasion, and poor prognosis.8 FGF is a potent angiogenic factor in HCC.11 FGF has been shown to augment vascular endothelial growth factor (VEGF)‐mediated angiogenesis12 and may lead to resistance to VEGF/VEGF receptor (VEGFR)‐targeted agents.13
Infigratinib is a pan‐FGFR kinase inhibitor that has a lower potency for FGFR‐4 than for FGFR‐1, ‐2, or ‐3.14, 15 Infigratinib potently inhibits bladder cancer xenografts and basic FGF (bFGF)‐stimulated angiogenesis but does not impair VEGF‐induced blood vessel formation.14 In phase I and II clinical trials, infigratinib has a manageable safety profile and showed antitumor activity in FGFR‐3‐mutant bladder, FGFR‐1‐amplified lung cancer, and cholangiocarcinoma with FGFR‐2 fusion.16, 17
The goals of the present study are to gain a better understanding of the mechanisms underlying the antitumor effect of infigratinib in human HCC Patient‐Derived Xenograft (PDX) mouse models.18
Materials and Methods
The reagents, cell isolation and culture, whole exome sequencing, western blot analysis, immunohistochemistry, proangiogenic factor analysis, flow cytometric analysis, development of the sorafenib‐resistant HCC model, vessel perfusion studies, and statistical analysis are described in detail under Supporting Materials and Methods.
For hepatocyte growth factor (HGF)‐ and FGF‐stimulated activation of FGFR, freshly isolated HCC01‐0909 cells were treated with vehicle or 1 µM infigratinib for 24 hours and then stimulated with 50 ng/mL bFGF, 50 ng/mL acidic FGF, 200 ng/mL FGF19, or 50 ng/mL HGF for 10 minutes. The cells were harvested, and changes in the proteins of interest were determined by western blotting.
Efficacy of Infigratinib in Subcutaneous HCC Models
All animals received humane care according to the criteria outlined in the “Guide for the Care and Use of Laboratory Animals” prepared by the National Academy of Sciences and published by the National Institutes of Health (NIH publication 86‐23 revised 1985).
HCC PDX xenograft lines were used to establish tumors in male C.B‐17 SCID mice aged 9‐10 weeks and weighed 23‐25 g (InVivos Pte. Ltd., Singapore) as described previously.18, 19 Mice were provided with sterilized food and water ad libitum, and housed in negative pressure isolators with corn cob bedding, which were set at 23°C and 43% humidity, with 12‐h light/dark cycles.
For dose‐response experiments, mice bearing HCC06‐0606 xenografts (10 mice per group) were orally administered vehicle (7 parts 30% wt/vol Captisol to 3 parts PEG300) or 10, 20, and 30 mg/kg infigratinib once daily for 14 days.
For time‐dependent inhibition of infigratinib targets, mice bearing HCC06‐0606 tumors were orally administered a single dose of infigratinib at 20 mg/kg. Two tumors were harvested after treatment at each of the indicated time points for western blotting.
To investigate the antitumor effects of infigratinib, mice bearing tumors were orally administered either vehicle or 20 mg/kg infigratinib once daily for 10‐28 days. Each group consisted of 8‐10 mice. Treatment was initiated when the tumors reached sizes of approximately 170‐250 mm3. Tumor growth was monitored, and tumor volume was calculated as described.18, 19 At the end of the study, the body and tumor weights were recorded, and the tumors were harvested 2 hours after the last treatments for subsequent analyses.
For the infigratinib/vinorelbine combination experiments, mice bearing tumors were treated as follows: (1) intraperitoneal injection with 200 µL vehicle, (2) 15 mg/kg oral infigratinib once daily, (3) intraperitoneal injection with 3 mg/kg vinorelbine, and (4) combined oral infigratinib and intraperitoneal‐injected vinorelbine. Control and vinorelbine injections were performed every 3 days for indicated times. Treatments started when the tumors were approximately 170‐250 mm3. Tumor growth was monitored, and tumor volume was calculated as described.18, 19 Mice were sacrificed 2 hours after the last treatments, and tumor tissues were collected for subsequent analysis.
Efficacy of Infigratinib in Orthotopic HCC Models
HCC09‐0913, HCC13‐0109, and HCC06‐0606 orthotopic models were established as described.19 Animals were randomized into groups (n = 10) when the tumors were approximately 100‐150 mm3, and treatment was initiated on day 9 after tumor implantation. For survival, metastasis, and invasion experiments, mice bearing tumors were treated once daily with vehicle or 15 mg/kg infigratinib for 28 days. Body weight, ascites formation, and overall survival were monitored daily. Tumor‐bearing mice were sacrificed when they became moribund. The extent of macroscopic lung metastasis and the sizes of the primary orthotopic tumors were also documented.
Gene Copy Number
DNA samples were genotyped using Affymetrix SNP array 6.0, and copy number analysis of FGFRs was performed as described.20, 21
Results
Expression of FGFR‐1 to ‐4 in HCC PDX Models
We first characterized a panel of 62 HCC models for the expression of FGFR‐1 to ‐4 by western blot analysis. FGFR‐1 protein was very low but detectable in 22.5% (14/62) of the models. FGFR‐2, FGFR‐3, and FGFR‐4 proteins were detected in 44% (21 of 62), 48.3% (30 of 62), and 100% (62 of 62) of models, respectively. Consistent with a previous study,10 11 of 62 (17.7%) HCC models tested expressed high levels of FGFR‐2, ‐3, and ‐4 (Fig. 1A; Supporting Fig. S1). They were chosen for subsequent studies.
Figure 1.
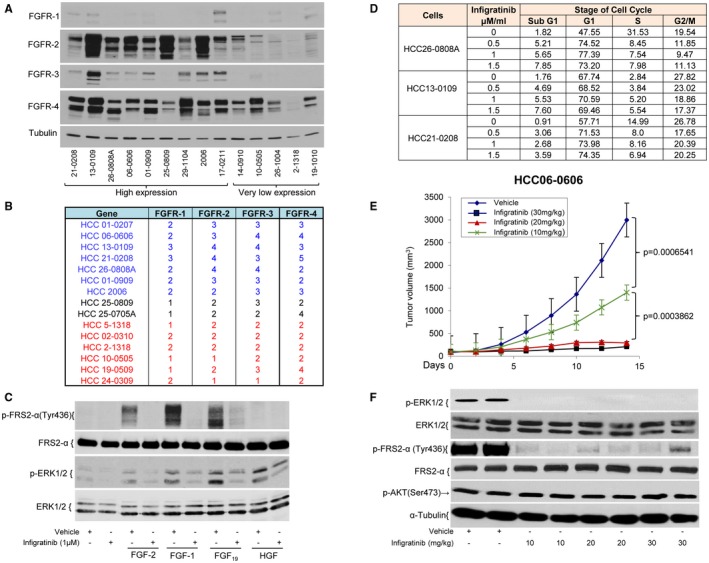
FGFR‐1 to ‐4 expression in HCC models and the effects of infigratinib on the cell cycle and on FGF‐stimulated FGFR activation in the HCC01‐0909 model. Tumor samples were collected from 14 HCC PDX models when tumors were approximately 800‐1000 mm3. Tumor lysates were prepared and subjected to western blot analysis. (A) Representative blots. Fifteen DNA samples were genotyped using Affymetrix SNP array 6.0. (B) The copy number analysis of FGFRs was performed using Aroma.Affymetrix (Version 1.3.0) software. HCC01‐0909 cells were treated with vehicle or 1 µM infigratinib for 24 hours and then stimulated with 50 ng/mL FGF‐2, 50 ng/mL FGF‐1, 200 ng/mL FGF19, or 50 ng/mL HGF for 10 minutes. The cells were harvested and analyzed by western blotting. (C) Representative blots. HCC21‐0208, HCC13‐0109, and HCC26‐0808A cells were treated with either 0.1% DMSO or three doses (0.5, 1, and 1.5 µM) of infigratinib for 24 hours and fixed in 70% ethanol. (D) Cell cycle analysis was performed. Mice bearing the HCC06‐0606 xenograft were orally administered vehicle or 10, 20, or 30 mg/kg infigratinib once daily for 14 days as described in Materials and Methods. (E) Tumor volumes plotted as the mean ± standard error and statistical analysis (Student t test). Mice bearing HCC06‐0606 xenografts were treated as described in (E) for 3 days. Tumors were collected 2 hours after the last dose of therapy for marker analysis by western blotting. (F) Representative blots. Western blotting and cell cycle analyses were performed as described in Supporting Materials and Methods.
Determination of FGFR1‐4 Mutation and Copy Number in HCC PDX Models
Whole Exome Sequencing (WES) analysis revealed that none of the HCC models tested harbored any mutations in the FGFRs.22 Because FGFRs can also be dysregulated by overexpression through gene amplification,22, 23 we analyzed 15 selected models for determination of FGFR copy number using Affymetrix SNP array. Amplification of the FGFR‐2, ‐3, and ‐4 genes (copy number ≥ 3) were common among HCC models with high FGFR expression (Fig. 1B). Expression of FGFR‐2 and ‐3 proteins correlated with the gene copy number. Low levels of FGFR‐1 were detected in HCC21‐0208 and HCC13‐0109 even though they had 3 copies of FGFR‐1. Loss of 1 copy of FGFR‐1 was very common in low‐FGFR‐1‐expressing models (33.3%).
Infigratinib Inhibits FGF‐Induced Activation of the FGFR Signaling Pathway and Cell Cycle Progression
Pretreatment of HCC01‐0909 cells with 1.0 µM Infigratinib for 18 hours abolished FGF‐2‐, FGF‐1‐, and FGF‐19‐stimulated phosphorylation of Fibroblast Growth Factor Receptor Substrate 2 alpha (FRS2‐α) and extracellular signal‐regulated kinase (ERK)1/2 (Fig. 1C). Infigratinib had no effect on HGF‐induced phosphorylation of ERK1/2, suggesting that the inhibitory effect of infigratinib was specific to the FGF/FGFR signaling pathway. Infigratinib caused a significant increase in the percentage of cells in the G1 and sub‐G1 phases with a concomitant reduction in the percentage of cells in the G2/M and S phases (Fig. 1D), suggesting that infigratinib causes G1 cell cycle arrest.
Dose‐Dependent Antitumor Activity and the Duration of FGFR Pathway Inhibition by Infigratinib in HCC06‐0606 Model
Daily treatment of HCC06‐0606 tumor‐bearing mice with 10, 20, and 30 mg/kg infigratinib for 14 days led to approximately 65%, 96%, and 98% reductions in tumor burden, respectively (Fig. 1E). Consistent with the safety profiles of infigratinib in human studies,16, 17 daily treatment of mice with infigratinib resulted in significant elevation in alanine aminotransferase (ALT), alkaline phosphatase (ALP), and aspartate aminotransferase (AST) and a significant decrease in serum creatinine (Supporting Fig. S2). Infigratinib potently inhibited p‐FRS2‐α and p‐ERK1/2 (Figure 1F), and the inhibition of these biomarkers occurred within 2 hours after a single oral dose of 20 mg/kg infigratinib, was maintained for approximately 10 hours, and returned to baseline by 12 hours after treatment (Fig. 2A). Unlike p‐ERK1/2, p‐AKT was not significantly affected (Figs. 1F, 2A). The dose of 15‐20 mg/kg infigratinib was deemed efficacious and was therefore chosen for subsequent experiments.
Figure 2.
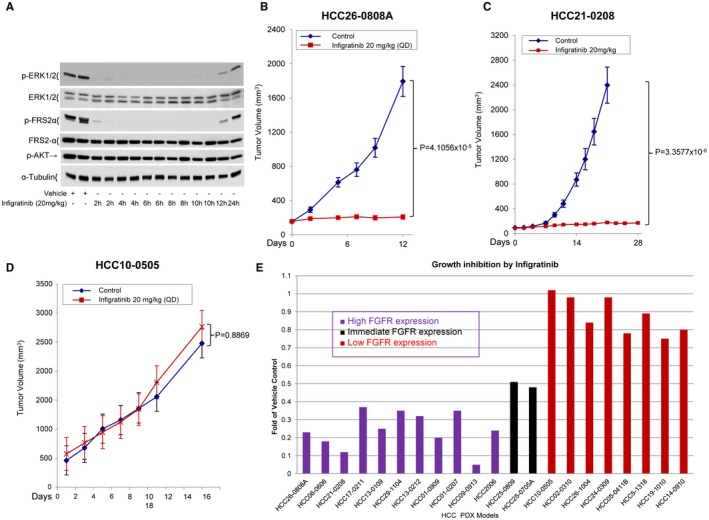
Effects of Infigratinib on the tumor growth of HCC PDX models. Mice bearing HCC06‐0606 tumors were orally administered 200 µL of vehicle (n = 6) or 20 mg/kg/day infigratinib (n = 10). Two tumors per treatment group were harvested at indicated times for western blotting. (A) Representative blots. Mice bearing indicated HCC tumors (22 models) were treated with vehicle or 20 mg/kg infigratinib once daily (QD) for 10‐28 days (depending on the model). Each group consisted of 10 mice. Tumor volumes were calculated and plotted as described in Materials and Methods. (B‐D) The representative tumor volumes ± standard errors at the indicated time points and statistical significance (Student t test). (E) Efficacy of infigratinib on high‐, intermediate‐, and low‐FGFR‐expressing HCC models was determined as the fold change relative to the vehicle control, where the median weight of the respective vehicle‐treated tumor at the end of treatment was assigned as 1.
Infigratinib Demonstrates Potent Antitumor, Antiproliferative, and Apoptotic Activities in HCC Models
We next examined the antitumor activity of 20 mg/kg infigratinib in 11 high‐ and 8 low‐FGFR‐expressing HCC PDXs. The growth rates of high‐FGFR‐expressing HCC26‐0808A and HCC21‐0208 xenografts were significantly decreased by infigratinib treatment (Fig. 2, P < 0.00001). Infigratinib had no significant effects on the growth of low‐FGFR‐expressing HCC10‐0505 tumors (Fig. 2D, P = 0.8869). Infigratinib was active in 11 HCC models that expressed high levels of FGFR‐2, ‐3, and ‐4. In contrast, low‐FGFR‐expressing HCC models were insensitive to infigratinib (Fig. 2E; Supporting Fig. S3).
Compared with the vehicle treatment, infigratinib treatment caused a significant decrease in p‐Histone 3 Ser10‐positive cells and a significant elevation in cleaved poly(adenosine diphosphate ribose) polymerase (PARP)‐positive cells in the high‐FGFR‐expressing HCC13‐0109 (Fig. 3A), HCC26‐0808A (Supporting Fig. S4A) and HCC17‐0212 models (Supporting Fig. S5) (P < 0.05). In contrast, there were no significant differences in the percentages of apoptotic and mitotic cells between the vehicle‐ and infigratinib‐treated low‐FGFR‐expressing HCC10‐0505 and HCC2‐1318 tumors (Supporting Fig. S4A). In addition, infigratinib was able to induce tumor cell differentiation as determined by cell size and nuclear morphology. This is associated with elevation of hepatocyte nuclear factor (HNF) 4α and cytochrome p450 3A4 (Supporting Fig. S6).
Figure 3.
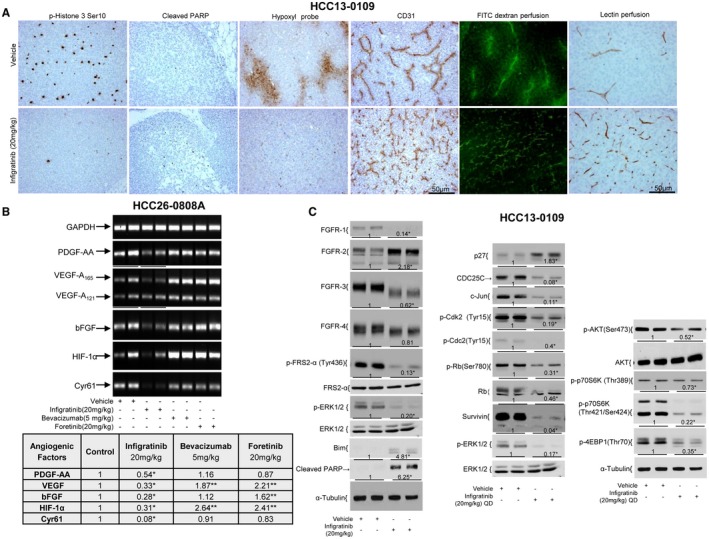
Effects of infigratinib on cell proliferation, apoptosis, vessel normalization, the expression of angiogenic factors, and the FGFR signaling pathway and its downstream targets in the high‐FGFR‐expressing HCC model. Mice bearing HCC13‐0109 tumors were treated once daily (QD) with vehicle control or 20 mg/kg infigratinib for 14 days. Vehicle‐ and infigratinib‐treated mice were perfused with biotinylated Lycopersicon esculentum (Tomato) lectin and injected with pimonidazole hydrochloride as described in Supporting Materials and Methods. Tumors collected 2 hours after the last treatments were processed for immunohistochemistry as described in Supporting Materials and Methods. (A) Representative images of tumor sections from vehicle‐ and infigratinib‐treated mice stained for p‐Histone H3 Ser10, cleaved PARP, lectin, Hypoxyprobe, and blood vessel. Vehicle‐ and infigratinib‐treated mice were intravenously injected with fluorescein isothiocyanate (FITC)‐dextran as described in Supporting Materials Methods. Fifteen‐micron sections were prepared, and extensive leakage of FITC‐dextran from the tumor vasculature into the interstitial microvessels was visualized using an Olympus BX60 microscope (Olympus, Japan) equipped with appropriate filters. (A) Representative photographs. Mice bearing indicated tumors were treated with vehicle control, 20 mg/kg foretinib once daily, 5 mg/kg bevacizumab weekly, or 20 mg/kg infigratinib once daily for 12 days. Tumors were collected, and RNA extractions were performed according to the Qiagen RNeasy protocol. Real‐time quantitative PCR was performed as described in Supporting Materials and Methods. (B) Representative ethidium bromide–stained gels. Mice bearing high‐FGFR‐expressing HCC13‐0109 tumors were orally administered vehicle or 20 mg/kg infigratinib once daily for 5 days. Each group consisted of four mice. Treatment started when the tumors reached sizes of approximately 500 mm3. Tumors were harvested 2 hours after the last dose of infigratinib, and tumor lysates were prepared and subjected to western blot analysis as described in Supporting Materials and Methods. (C) Representative blots. Densitometric data (fold changes) are shown below each group. Different asterisks (*) indicate significant differences (P < 0.05, Student t test). Abbreviation: GAPDH, glyceraldehyde 3‐phosphate dehydrogenase.
Infigratinib Inhibits Tumor Hypoxia Through Blood Vessel Normalization in HCC Models
Fig. 3A and Supporting Fig. S4A show that blood vessels in vehicle‐treated high‐FGFR‐expressing HCC13‐0109 and HCC26‐0808A tumors are irregularly shaped and tortuous, indicative of vascular remodeling. In contrast, blood vessels in the infigratinib‐treated tumors remain slim, resembling capillary‐like vessels. Interestingly, infigratinib did not cause a similar blood vessel phenotype in low‐FGFR‐expressing HCC2‐1318 and HCC10‐0505 tumors (Supporting Fig. S4A). Within 5 days after infigratinib withdrawal, there was evidence of reversibility of the blood vessels, and by day 7, the tumors had a blood vessel density that was nearly similar to that of the vehicle‐treated tumors (Supporting Fig. S4B), suggesting that persistent FGFR blockade is required to maintain capillary‐like blood vessels.
To determine whether the increased network of vessels in infigratinib‐treated tumors was functional, biotinylated Lycopersicon esculentum (Tomato) lectin was injected intravenously into vehicle‐ and infigratinib‐treated tumor‐bearing mice for labeling of the murine vascular endothelium, allowing detection of the perfused vasculature, followed by pimonidazole HCl infusion to measure the hypoxic microenvironment in the tumors as evidence of vessel normalization. As clearly shown in Fig. 3A, very little or no lectin was bound in the blood vessels of the vehicle‐treated high‐FGFR‐expressing HCC13‐0109 and other high‐FGFR‐expressing models (Supporting Figs. S5 and S7), suggesting that they were not functional. Large regions of the tumor section were stained positively with hypoxyprobe, indicative of hypoxic regions (Fig. 3A; Supporting Fig. S5). In contrast, the majority of capillary‐like blood vessels induced by infigratinib treatment stained positively for biotinylated lectin, suggesting that they were well perfused and productive (Fig. 3A; Supporting Figs. S5 and S7). In addition, hypoxyprobe staining was negative across the large sections of the tumors, indicating that the regions were well oxygenated (Fig. 3A; Supporting Fig. S5). Fig. 3A shows representative images with diffused vascularization and rapid leakage in the vehicle‐treated tumors compared with the infigratinib‐treated tumors as determined by intravenous injection of 40‐kDa fluorescent dextran. These data suggest that inhibition of FGFR signaling results in the formation of well‐perfused productive blood vessels, leading to a reduction in tumor hypoxia.
To investigate the mechanistic basis of nonfunctional/leaky vessels in HCC cells, we overexpressed the FGFR‐2 in HCC14‐0910 cells (FGFR‐2‐HCC14‐0910) (Supporting Fig. S8). Mice bearing tumors were treated with vehicle or 20 mg/kg infigratinib once daily for 14 days. Our preliminary data showed that the vessel density, lectin perfusion, and tumor hypoxia was not significantly altered by overexpression of FGFR‐2 in vivo. The density of blood vessels in FGFR‐2‐HCC14‐0910 tumors was significantly increased following infigratinib treatment as determined by CD31 immunostaining. Very little or no lectin was detected in blood vessels of vehicle‐treated FGFR‐2‐expressing HCC14‐0910 tumors, suggesting that they were not functional. Large regions of the tumor section derived from vehicle‐treated FGFR‐2‐HCC14‐0910 tumors were stained positively with hypoxyprobe, indicative of hypoxic regions. In contrast, many capillary‐like blood vessels induced by infigratinib were stained positive for biotinylated lectin, suggesting that they were well perfused and functional. In addition, hypoxyprobe staining was negative across the large section of the infigratinib‐treated FGFR‐2‐HCC14‐0910 tumor, indicating the region was well oxygenated. Infigratinib did not mimic the similar phenotype of blood vessels in parental HCC14‐0910 tumors. These data suggest that the functional tumor vasculature is regulated at least in part by FGFR‐2 signaling.
Infigratinib Switches Off the Angiogenic Rescue Program in HCC Models
Because low oxygen up‐regulates hypoxia inducible factor 1 alpha subunit (HIF1α), which stimulates tumor cells to produce a variety of proangiogenic factors (HIF1α, VEGF, platelet‐derived growth factor‐AA, Cyr61, and bFGF) that stimulate new blood vessel formation within hypoxic areas,24, 25 we analyzed the mRNA levels of proangiogenic factors in tumors by real‐time quantitative PCR. As expected, treatment of high‐FGFR‐expressing HCC26‐0808A model with bevacizumab or foretinib resulted in a significant up‐regulation of VEGF and HIF1α, which explains the presence of the rescue angiogenic program (Fig. 3B, P < 0.05). In the HCC26‐0808A model, infigratinib reduced the expression of proangiogenic factors (Fig. 3B, P < 0.05), and this occurred on day 3 before changes in HIF1α (Supporting Fig. S9). These changes did not occur in the low‐FGFR‐expressing HCC26‐1004 model (Supporting Fig. S9). Supporting Fig. S8C showed that the levels of intratumoral VEGF and basic FGF were significantly reduced when FGFR‐2‐expressing HCC14‐0910 tumors were treated with infigratinib. These data suggest that the expression of VEGF and FGF‐2 is regulated at least in part by FGFR‐2 signaling.
Infigratinib Induces Apoptosis and Inhibits FGFR Signaling and its Downstream Targets in HCC PDXs
Supporting Fig. S10A showed that the FGFR‐1 to ‐4 proteins from the infigratinib‐treated HCC13‐0109 (Fig. 3C) and HCC09‐0913 lysates exhibited faster migration than the proteins from the vehicle‐treated tumor lysates, possibly due to reduced phosphorylation. Whereas the FGFR‐1, ‐3, and ‐4 levels in the infigratinib‐treated HCC13‐0109 tumors were significantly reduced (P < 0.05), the FGFR‐2 level was significantly increased (Fig. 3C, P < 0.05). The FGFR‐3 levels were modestly increased in the HCC09‐0913 tumors (Supporting Fig. S10A). The levels of p‐FRS2‐α, p‐ERK1/2, p‐p70S6K, p‐4EBP1, p‐Cdk‐2, p‐Cdc‐2, p‐RB, Survivin, CDC25C, and retinoblastoma in the infigratinib‐treated HCC13‐0109 (Fig. 3C) and HCC09‐0913 (Supporting Fig. S10A) tumors were significantly reduced (P < 0.05), suggesting that FGFR activity was inhibited. Furthermore, infigratinib treatment caused an up‐regulation of Bim, p27, and cleaved PARP. These changes were not observed in the infigratinib‐treated low‐FGFR‐expressing HCC10‐0505 tumors (Supporting Fig. S10B). Similar data were obtained when high‐FGFR‐expressing HCC21‐0208 and HCC01‐0909 tumors were analyzed (Supporting Fig. S11).
Infigratinib Inhibits Tumor Invasion and Lung Metastasis and Prolongs the Survival of Mice
Fig. 4A and Supporting Fig. S10C show that infigratinib treatment potently inhibited tumor growth, and small‐sized tumors were detectable in the livers of treated animals (P < 0.01). Whereas tumors treated with infigratinib displayed smooth edges, suggesting minimal invasion, tumors in mice treated with vehicle showed very uneven edges and invasion into the surrounding normal liver tissue (Fig. 4B). Compared with the vehicle treatment, infigratinib treatment significantly reduced the Lymphatic Vessel Endothelial Receptor‐1 (LYVE‐1) positive peritumoral lymphatic vessel density and area by approximately 80% and 40%, respectively (Fig. 4B, P < 0.05). Lung metastasis was detected in 9 of 10 control mice and 1 of 10 infigratinib‐treated mice (Fig. 4C). A Kaplan‐Meier survival analysis confirmed that all vehicle‐treated HCC09‐0913 and HCC13‐0109 mice were moribund on days 52 and 47, respectively. However, the survival time of the infigratinib‐treated mice was substantially longer; the HCC09‐0913 and HCC13‐0109 mice were moribund after day 250 and on day 77, respectively (Fig. 4D; Supporting Fig. S10D). The results show that infigratinib inhibits lung metastasis and prolongs the survival of mice bearing high‐FGFR‐expressing HCC tumors (P < 0.01, log‐rank test).
Figure 4.
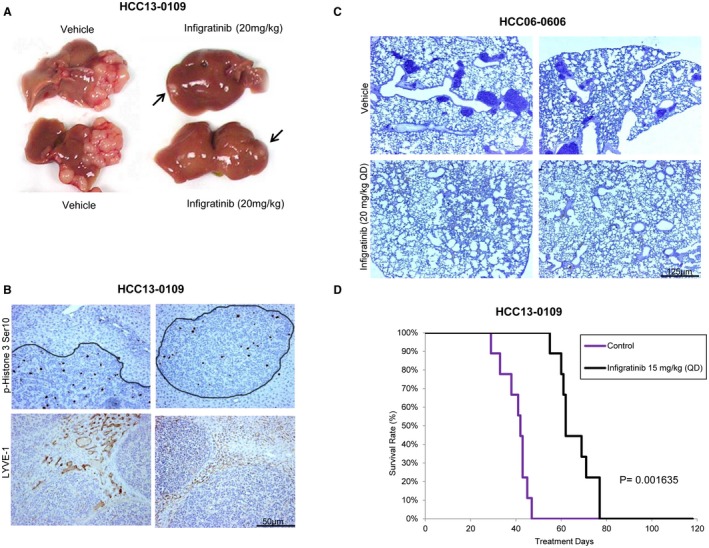
Effects of infigratinib on the tumor growth, invasion, and lung metastasis and on the survival of mice bearing high‐FGFR‐expressing HCC tumors. HCC13‐0109 and HCC06‐0606 orthotopic models were established as described.19 Mice bearing tumors were treated with vehicle or 15 mg/kg infigratinib once daily (QD) for 28 days. Each treatment group consisted of 10 mice. Treatments were initiated when the tumors reached sizes of approximately 100‐150 mm3. (A) The sizes of the primary orthotopic tumors, (B) tumor cell invasion and the Lymphatic Vessel Endothelial Receptor‐1 (LYVE‐1) positive peritumoral lymphatic vessel density, (C) the extent of microscopic lung metastasis, and (D) a Kaplan‐Meier survival analysis are shown. Infigratinib inhibited tumor cell invasion, tumor growth (P = 0.0001653), and lung metastasis (P = 4.653 × 10‐5) and improved the overall survival of mice (log‐rank test, P = 0.001653). Bars: 125 μM and 50 μM.
Effects of Infigratinib on Tumor Growth, Angiogenesis, Cell Proliferation, and Apoptosis in Sorafenib‐Resistant HCC Tumors
Treatment of HCC06‐0606 models with sorafenib resulted in the up‐regulation of FGFR‐3/‐4, p‐FRS2‐α, and p‐ERK1/2 (Supporting Fig. S12A). A study of sorafenib‐resistant HCC06‐0606 tumors revealed an up‐regulation of FGFRs, p‐FGFR, and p‐ERK1/2 after the tumors became resistant to sorafenib therapy (Supporting Fig. S12B). Fig. 5A,B show that the HCC26‐0808ASora46 and HCC06‐0606Sora87 tumors exhibited significant growth inhibition when FGFR signaling was blocked by infigratinib, as evidenced by the reductions in p‐FRS2‐α and p‐ERK1/2. Elevations in Bim and cleaved PARP were also detected (Fig. 5C). Infigratinib treatment also increased the number of productive tumor vessels as determined by lectin perfusion, reduced hypoxia and tumor cell proliferation, and induced apoptosis (Fig. 5D). These observations suggest that sorafenib up‐regulates mediators of the FGFR signaling pathway, which may induce resistance to sorafenib therapy.
Figure 5.
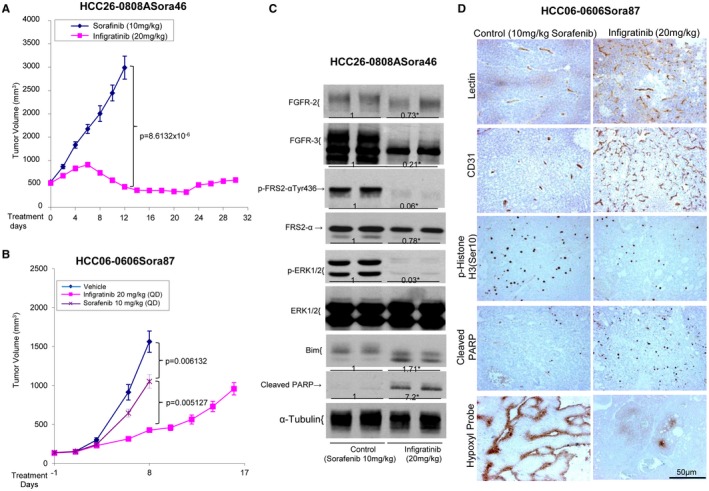
Effects of infigratinib on tumor growth, angiogenesis, the FGFR signaling pathway, cell proliferation, and the apoptosis of sorafenib‐resistant HCC tumors. HCC26‐0808ASora46 and HCC06‐0606Sora87 tumors were implanted subcutaneously into severe combined immunodeficient mice as described in Materials and Methods. Mice bearing indicated tumors were treated with 10 mg/kg sorafenib or 20 mg/kg infigratinib once daily (QD) for 17 to 30 days. For HCC06‐0606Sora87 tumors, a vehicle group was included. Each treatment arm involved 10 independent tumor‐bearing mice. Tumor tissues were collected 2 hours after the last treatments. (A,B) Tumor volumes ± standard errors at given time points and statistical analysis (Student t test), (C) a representative western blot analysis of the FGFR signaling pathway, and (D) representative images of tumor sections from sorafenib‐treated and infigratinib‐treated mice stained for lectin perfusion, blood vessels, p‐Histone H3 Ser10, cleaved PARP, and Hypoxyprobe are shown. Densitometric data (fold changes) are shown below each group. Different letters or asterisks (*) indicate significant differences (P < 0.05, Student t test).
Infigratinib Plus Vinorelbine Inhibits Tumor Growth and Prolongs the Survival of Mice
Tumor vessel normalization reportedly improves chemotherapeutic drug delivery in mouse models, decreases tumor growth, and increases survival.26, 27, 28 We determined whether infigratinib treatment increased the delivery of the microtubule‐depolymerizing drug vinorelbine, whose toxicity relies on the prolonged mitotic arrest to tumors with corresponding decreases in tumor growth and improvements in the survival times of mice bearing high‐FGFR‐expressing tumors. Supporting Fig. S13 showed that vinorelbine had better antitumor activity than doxorubicin and paclitaxel. As expected, infigratinib significantly inhibited the growth of high‐FGFR‐expressing tumors. The addition of vinorelbine to infigratinib significantly improved the antitumor efficacies of the single agents (Table 1, P < 0.01).
Table 1.
Effects of Infigratinib, Vinorelbine, and Infigratinib Plus Vinorelbine on Tumor Growth in the Hepatocellular Carcinoma Models
| Tumor Burden (g) | P Value | ||||
|---|---|---|---|---|---|
| Xenograft Lines | Vehicle | Infigratinib (15 mg/kg) | Vinorelbine (3 mg/kg) | Infigratinib + Vinorelbine | |
| HCC21‐0208 | 1.1453 ± 0.0987 | 0.5104 ± 0.8763 | 0.1256 ± 0.020 | 0.0342 ± 0.008 | Inf vs. Inf/Vino P = 0.0005805; Vino vs. Inf/Vino P = 0.0003969; Vino vs. Inf P = 0.006709 |
| HC13‐0109 | 1.4027 ± 0.1033 | 0.1862 ± 0.0271 | 0.0815 ± 0.0163 | 0.0342 ± 0.0091 | Inf vs. Inf/Vino P = 0.0007203; Vino vs. Inf/Vino P = 0.020009; Vino vs. Inf P = 0.02812 |
| HCC13‐0212 | 1.9304 ± 0.2564 | 0.8606 ± 0.1181 | 0.4250 ± 0.072 | 0.0796 ± 0.0276 | Inf vs. Inf/Vino P = 1.546 × 10⁻⁵; Vino vs. Inf/Vino P = 0.0005196; Vino vs. Inf P = 0.007098 |
| HCC25‐0809 | 0.9468 ± 0.0613 | 0.6351 ± 0.0371 | 0.4087 ± 0.0389 | 0.0791 ± 0.0200 | Inf vs. Inf/Vino P = 1.078 × 10⁻¹⁰; Vino vs. Inf/Vino P = 5.637 × 10⁻⁷; Vino vs. Inf P = 0.0005207 |
| HCC06‐0606 | 2.4531 ± 0.2248 | 0.8067 ± 0.1210 | 1.3251 ± 0.0550 | 0.0798 ± 0.0101 | Inf vs. Inf/Vino P = 3.3371 × 10⁻⁵; Vino vs. Inf/Vino P = 2.5252 × 10⁻¹²; Vino vs. Inf P = 0.001603 |
| HCC09‐0913 | 1.8632 ± 0.1980 | 0.8205 ± 0.1076 | 0.2450 ± 0.0758 | 0.05302 ± 0.04802 | Inf vs. Inf/Vino P = 0.0003642; Vino vs. Inf/Vino P = 2.6578 × 10⁻⁵; Vino vs. Inf P = 0.0005438 |
| HCC26‐0808ASora62 | 2.3597 ± 0.1857 | 0.9109 ± 0.1346 | 2.6342 ± 0.3176 | 0.2462 ± 0.0239 | Inf vs. Inf/Vino P = 0.0005010; Vino vs. Inf/Vino P = 5.3631 × 10⁻⁶; Vino vs. Inf P = 9.36512 × 10⁻⁵ |
| HCC06‐0606Sora80 | 2.4531 ± 0.2248 | 0.8067 ± 0.1210 | 1.3251 ± 0.0550 | 0.0798 ± 0.0101 | Inf vs. Inf/Vino P = 0.0005805; Vino vs. Inf/Vino P = 0.0003969; Vino vs. Inf P = 0.0006709 |
| HCC26‐0808A | 1.5680 ± 0.1079 | 0.1893 ± 0.0230 | 1.2350 ± 0.1088 | 0.0721 ± 0.016 | Inf vs. Inf/Vino P = 0.0001975; Vino vs. Inf/Vino P = 6.234 × 10⁻⁵; Vino vs. Inf P = 0.000422 |
| HCC25‐0705A | 1.8573 ± 0.1247 | 1.6341 ± 0.1018 | 1.6986 ± 0.0971 | 0.5646 ± 0.0626 | Inf vs. Inf/Vino P = 4.7662 × 10⁻⁸; Vino vs. Inf/Vino P = 1.1799 × 10⁻⁸; Vino vs. Inf P = 0.6518 |
| HCC17‐0211 | 1.0509 ± 0.1040 | 0.4225 ± 0.0370 | 0.5759 ± 0.0635 | 0.1751 ± 0.0358 | Inf vs. Inf/Vino P = 0.002687; Vino vs. Inf/Vino P = 0.0006256; Vino vs. Inf P = 0.0459 |
| HCC01‐0909 | 2.0568 ± 0.1567 | 0.5234 ± 0.04344 | 1.9504 ± 0.1234 | 0.2634 ± 0.07812 | Inf vs. Inf/Vino P = 0.001623; Vino vs. Inf/Vino P = 5.6757 × 10⁻⁵; Vino vs. Inf P = 7.8892 × 10⁻⁵ |
| HCC29‐1104 | 1.8250 ± 0.0987 | 0.7805 ± 0.6798 | 0.8350 ± 0.1167 | 0.2156 ± 0.0430 | Inf vs. Inf/Vino P = 0.00674; Vino vs. Inf/Vino P = 0.007379; Vino vs. Inf P = 0.3547 |
| HCC02‐0113 | 1.3375 ± 0.1550 | 1.1463 ± 0.177 | 1.2772 ± 0.1553 | 0.950 ± 0.132 | Inf vs. Inf/Vino P = 0.04780; Vino vs. Inf/Vino P = 0.0567; Vino vs. Inf P = 0.6328 |
| HCC24‐0714 | 1.5470 ± 0.0832 | 1.1360 ± 0.0642 | 0.8120 ± 0.0977 | 0.3845 ± 0.0412 | Inf vs. Inf/Vino P = 0.01034; Vino vs. Inf/Vino P = 0.000426; Vino vs. Inf P = 0.00812 |
| HCC16‐1014 | 1.2949 ± 0.1272 | 0.7945 ± 0.0884 | 0.5442 ± 0.0665 | 0.4259 ± 0.0620 | Inf vs. Inf/Vino P = 0.003091; Vino vs. Inf/Vino P = 0.2137; Vino vs. Inf P = 0.04589 |
| HCC19‐0913 | 1.3912 ± 0.0975 | 1.0317 ± 0.0793 | 0.5401 ± 0.0566 | 0.2205 ± 0.0326 | Inf vs. Inf/Vino P = 1.8547 × 10⁻⁷; Vino vs. Inf/Vino P = 0.0003150; Vino vs. Inf P = 9.1730 × 10⁻⁵ |
| HCC01‐1214 | 0.8853 ± 0.0855 | 0.8201 ± 0.0408 | 0.8722 ± 0.0657 | 0.7003 ± 0.1127 | Inf vs. Inf/Vino P = 0.3312; Vino vs. Inf/Vino P = 0.2042; Vino vs. Inf P = 0.5087 |
| HCC29‐0714B | 1.7185 ± 0.2168 | 1.2884 ± 0.1269 | 1.1851 ± 0.0440 | 0.8443 ± 0.0895 | Inf vs. Inf/Vino P = 0.0104; Vino vs. Inf/Vino P = 0.003081; Vino vs Inf P = 0.4518 |
| HCC11‐0314 | 1.6534 ± 0.1257 | 1.0350 ± 0.1107 | 1.4080 ± 0.1346 | 0.8123 ± 0.1325 | Inf vs. Inf/Vino P = 0.2503; Vino vs. Inf/Vino P = 0.06534; Vino vs. Inf P = 0.7546 |
Indicated tumors were implanted subcutaneously into severe combined immunodeficient mice as described in Materials and Methods. Mice bearing indicated tumors were randomized and divided into four groups. They were orally treated with (1) 200 µL of vehicle, (2) 15 mg/kg infigratinib once daily, (3) 3 mg/kg vinorelbine once every 3.5 days, or (4) 20 mg/kg infigratinib plus vinorelbine for 14 to 28 days. Each treatment arm comprised 8‐10 independent tumor‐bearing mice. The median weights of the drug‐treated and vehicle‐treated tumors at sacrifice are shown. Differences in the tumor weight between infigratinib (Inf), vinorelbine (Vino), and infigratinib/vinorelbine (Inf/Vino) groups were compared using Student t test.
Compared with the vehicle‐ or infigratinib‐treated tumors, the vinorelbine‐ and infigratinib/vinorelbine‐treated tumors had a 1.3‐ to 1.8‐fold higher proportion of p‐Histone 3 Ser10‐positive cells, probably due to the ability of vinorelbine to arrest cells in mitosis.29 Infigratinib modestly reduced or had no effects (Supporting Figs. S14 and S15) on the vinorelbine‐induced elevation of p‐Histone 3‐positive cells. The infigratinib/vinorelbine combination group had 2‐ to 15‐fold more cleaved PARP‐positive cells than the infigratinib and vinorelbine alone groups (Supporting Figs. S14‐S16, P < 0.01). As expected, the infigratinib‐treated tumors had increased productive blood vessels and no hypoxia compared with the vehicle control– and vinorelbine‐treated tumors (Supporting Fig. S14, P < 0.05). No significant difference in lectin perfusion and tumor hypoxia was observed in infigratinib‐ and infigratinib/vinorelbine‐treated tumors (P = 0.421), suggesting that vinorelbine does not antagonize the effects of infigratinib on blood vessel normalization.
The levels of FGFR‐1‐4 in the infigratinib‐ and infigratinib/vinorelbine‐treated tumors were significantly decreased (Fig. 6A; Supporting Figs. S17 and S18A). These proteins also migrated faster than their equivalents in the vehicle‐ and vinorelbine‐treated tumors, possibly because of reduced phosphorylation. Vinorelbine significantly increased FGFR‐4, FRS2‐α, p‐p70S6K, p‐S6R, and p‐4EBP1 in the HCC29‐1104 tumors. Compared with infigratinib, treatment with infigratinib/vinorelbine led to further reductions in FGFR‐2, FGFR‐4, p‐Rb, p‐FRS2‐α, cyclin B1, CDC25C, p‐Cdc2, p‐P70S6K, p‐4EBP1, and Survivin. Significant up‐regulation of p27, Bim, and cleaved caspase 3 was detected in the infigratinib/vinorelbine‐treated tumors (Fig. 6A; Supporting Fig. S17 and S18A, P < 0.05).
Figure 6.
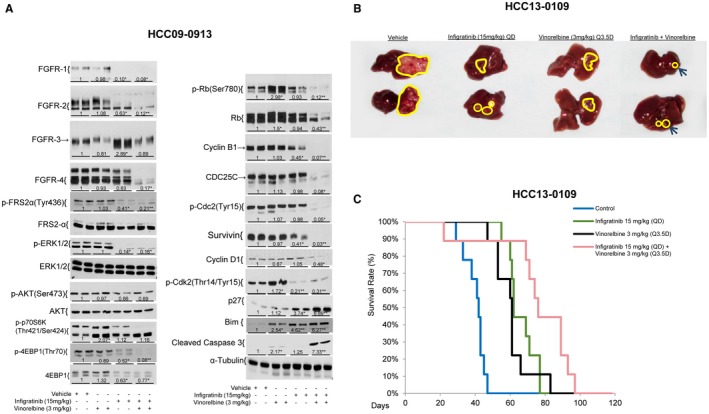
Effects of infigratinib, vinorelbine, and infigratinib plus vinorelbine on tumor growth, the survival of mice, the FGFR signaling pathway, and FGFR downstream targets in high‐FGFR‐expressing HCC tumors. Mice bearing HCC09‐0913 tumors were treated with infigratinib once daily (QD), vinorelbine once every three and half days (Q3.5D), and infigratinib plus vinorelbine for 5 days as described in Materials and Methods. Each treatment arm comprised four independent tumor‐bearing mice. Tumors were harvested 2 hours after the last dose of treatment. Tumor lysates were subjected to western blot analysis as described in Supporting Materials and Methods. Blots were incubated with indicated antibodies. (A) Representative blots and densitometric data (fold changes) are shown below each group. Different letters or asterisks (*) indicate significant differences (P < 0.05, Student t test). The HCC13‐0109 orthotopic model was established as described.19 Tumor‐bearing mice were treated daily with infigratinib, vinorelbine, or infigratinib plus vinorelbine as described in Materials and Methods for 28 days. Each treatment group comprised 10 mice. (B) The sizes of the primary orthotopic tumors and a (C) Kaplan‐Meier survival analysis are shown. Infigratinib/vinorelbine inhibited tumor growth and significantly improved the overall survival of mice (log‐rank test, vehicle versus vinorelbine: P = 0.0001221, vehicle versus infigratinib plus vinorelbine: P = 0.00007421, Infigratinib versus infigratinib plus vinorelbine: P = 0.02645; vinorelbine versus infigratinib plus vinorelbine: P = 0.01237).
The infigratinib/vinorelbine combination was more potent than the single agents in inhibiting tumor growth in the orthotopic models (Fig. 6B; Supporting Fig. S18B). A Kaplan‐Meier survival analysis showed that all mice in the vehicle, vinorelbine, and infigratinib groups were moribund on days 47, 84, and 76, respectively, in the HCC13‐0109 groups (Fig. 6C) and on days 14, 35, and 20, respectively, in the HCC25‐0705A groups (Supporting Fig. S18C). The survival time was substantially longer for the infigratinib/vinorelbine combination group than for the groups treated with single agents; the mice were moribund on day 96 in the HCC13‐0109 combination group (Fig. 6C) and on day 80 in the HCC25‐0707A combination group (Supporting Fig. S18C, P < 0.05, log‐rank test).
Discussion
The diagnosis of HCC portends a dismal diagnosis and is not amenable to existing therapeutic modalities.30 Because overexpression of FGFRs contributes to HCC tumorigenesis and metastasis,8, 9 targeting the inhibition of the FGF/FGFR signaling cascade may represent a new treatment approach for patients with HCC. A number of FGFR inhibitors31, 32, 33 are currently in clinical trials to treat cancers harboring FGFR aberrations. We demonstrate that the known FGFR‐2 and ‐3 mutations are not detected in the 62 HCC models examined.22 Up to 77% of HCC model studies have very low or undetectable levels of FGFR‐1. Loss of one copy of the FGFR‐1 gene is very common among the low‐FGFR‐1‐expressing models. Overexpression of FGFR‐2 and FGFR‐3 through gene amplification was detected in 11 of the 62 (17.7%) HCC models tested.
In the study, we demonstrated that infigratinib treatment results in a profound antitumor activity in HCC models expressing high FGFR‐2 and ‐3 levels and HCC tumors with acquired sorafenib resistance. Infigratinib treatment results in elevation in serum ALT, ALP, and AST, which is consistent with the safety profiles of infigratinib in human studies.16, 17 The higher antitumor activity observed in infigratinib‐treated mice can plausibly be explained by the ability of infigratinib to inhibit the FGFR pathway and its downstream targets, which are implicated in HCC development, metastasis, and resistance to VEGFR modulating agents.13, 34, 35 In high‐FGFR‐expressing HCC models, the reductions in the expression of HIF1α and proangiogenic factors with subsequent intratumoral hypoxia are due to the ability of infigratinib to increase the tumor oxygen supply through normalization of tumor blood vessels. Decreased tumor cell proliferation and the induction of apoptosis, in combination with the blood vessel normalization effect, result in significant antitumor efficacy. The therapeutic response to infigratinib using orthotopic models shows significant inhibition of tumor growth, invasion, and lung metastasis. As a result, infigratinib significantly prolongs the survival of mice. The addition of vinorelbine to infigratinib significantly augments the apoptotic and antitumor activity of the single agents without altering the blood vessel normalization induced by infigratinib. Because there is a need for more effective therapies to combat HCC, infigratinib alone or in combination with vinorelbine may serve as an alternative treatment for a subset of patients with HCC with FGFR‐driven tumors.
Mechanistic analysis reveals that infigratinib causes G1 cell cycle arrest and apoptosis probably by reducing the levels of p‐Rb, p‐Cdc2, p‐Cdk‐2, CDC25C and Survivin, with a concomitant increase in p27 and Bim. Up‐regulation of differentiation marker HNF4α and down‐regulation of Yes‐Associate Protein (YAP) following infigratinib treatment may also contribute to the growth inhibition. Inhibition of the Mitogen‐activated protein kinase/Extracellular‐signal regulated Kinase (MEK/ERK)36 and p70S6K pathways37 is also observed. One of the effects of the MEK/ERK pathway on apoptosis is mediated by ERK1/2 phosphorylation of Bim, a potent inducer of apoptosis (reviewed in Steelman et al.38). Infigratinib and infigratinib/vinorelbine inhibit p‐ERK1/2, leading to dephosphorylation of Bim as indicated by a shift in migration. Enhanced inhibition of FGFRs, p‐FRS2‐α, cyclin B1, p‐Cdc2, and p‐Cdk2 and up‐regulation of p27 and Bim may contribute in part to the potent antitumor activity observed with infigratinib/vinorelbine treatment. These proteins may serve as predictive biomarkers of response to infigratinib. Given an expected low response rate, a step forward would identify responders among the large patient population of nonresponders. In this regard, the FGFR‐2 and ‐3 are potential biomarkers for patient selection.
The exact mechanisms underlying the ability of infigratinib to induce blood vessel normalization remain to be elucidated. We found that whereas angiogenic vessels in the vasculatures of vehicle‐treated tumors are hyperdilated, distorted, leaky, and nonfunctional, the majority of vessels in the vasculatures of infigratinib‐treated tumors are slim, elongated, regularly shaped, and well functional. The decrease in tumor hypoxia in the infigratinib‐treated tumors suggests that the dense capillary‐like network of vessels restores the local oxygen concentration. These phenomena appear to be dependent on the activation statuses of FGFRs in the tumors. Importantly, FGFR signaling in tumor cells can alter the tumor microenvironment by regulating secreted factors such as VEGF and bFGF that allow angiogenesis to proceed at disorganized large vessels. In the context of FGFR‐dependent tumors, FGFR blockade with infigratinib leads to reductions in the expression of VEGF, bFGF, and many others that affect capillary‐like blood vessel formation. As infigratinib treatment continues, the expression of proangiogenic factors such as VEGF and bFGF diminish as productive blood vessels form and restore the local oxygen concentration. This hypothesis was supported by a study demonstrating that intramuscular injection of cloned myoblasts with low amounts of VEGF secretion could generate nonleaky, relatively normal capillaries.39 In the present study, we showed that the density of blood vessels in tumors derived from FGFR‐2‐overexpressed HCC14‐0910 but not parental HCC14‐0910 cells was significantly increased following infigratinib treatment. These blood vessels were functional and well oxygenated. These observations further suggest that the tumor vasculature is regulated at least in part through FGFR‐2 signaling.
Although FGFR blockade in FGFR‐dependent HCC promotes vascular normalization, FGFR reactivation after infigratinib withdrawal restores the aberrant vasculature. The overall message seems to be that even in tumor vascular networks, a regulated balance of growth factor receptors can generate a hierarchy of well‐organized and functional vessels. Previously, angiogenesis‐based cancer therapy had focused on trying to block angiogenesis or the pruning of the vasculature to improve tumor perfusion and oxygenation40, 41, 42; however, our results using FGFR blockade suggest an alternative therapeutic approach based on promoting “normalization” in the growing tumor vasculature.
Our present study shows that infigratinib induces tumor vessel normalization and that the addition of vinorelbine to infigratinib significantly improves the antitumor activity of the single agents and the overall survival of mice bearing orthotopic tumors. These observations are in agreement with those of previous studies.26, 27, 28 It has been demonstrated that vessel normalization increases tumor responses to immunotherapy.43, 44, 45 In this regard, inhibition of the FGFR signaling pathway by infigratinib would potentially improve immune checkpoint inhibitors or cytotoxic drugs, partially because of normalization of the abnormal tumor vasculature.43, 44, 46
In the present study, FGFRs are up‐regulated during sorafenib treatment and in sorafenib‐resistant tumors. Importantly, inhibition of FGFR signaling displays significant antitumor effect in sorafenib‐resistant HCC models. Our observations are supported by those of previous studies showing that up‐regulation of the FGF signaling pathway is one mechanism responsible for resistance.13, 47 This raises the possibility of using FGFR inhibitors for the treatment of HCCs with acquired sorafenib resistance.
In conclusion, our current study shows that the FGFR pathway is activated and functionally linked in the majority of HCC xenografts. Infigratinib inhibits hypoxia through blood vessel normalization and acts synergistically with vinorelbine to inhibit tumor growth and improve the survival of mice. Despite positive data from preclinical studies, the anticancer efficacy of infigratinib and the infigratinib/vinorelbine combination remains to be established in clinical trials.
Supporting information
Supported by Singapore National Medical Research Council (NMRC)–NMRC/MOHIAFCAT2/006/2016, NRF‐CRP17‐2017‐05, NMRC/MOHIAFCat1/0026/2015, and NMRC/MOHIAFCat1/0009/2014 (H.H.).
Potential conflict of interest: Nothing to report.
References
Author names in bold designate shared co‐first authorship.
- 1. Siegel RL, Miller KD, Jemal A. Cancer statistics, 2017. CA Cancer J Clin 2017;67:7‐30. [DOI] [PubMed] [Google Scholar]
- 2. Cheng AL, Kang YK, Chen Z, Tsao CJ, Qin S, Kim JS, et al. Efficacy and safety of sorafenib in patients in the Asia‐Pacific region with advanced hepatocellular carcinoma: a phase III randomised, double‐blind, placebo‐controlled trial. Lancet Oncol 2009;10:25‐34. [DOI] [PubMed] [Google Scholar]
- 3. Llovet JM, Ricci S, Mazzaferro V, Hilgard P, Gane E, Blanc JF, et al. Sorafenib in advanced hepatocellular carcinoma. N Engl J Med 2008;359:378‐390. [DOI] [PubMed] [Google Scholar]
- 4. Kudo M, Finn RS, Qin S, Han KH, Ikeda K, Piscaglia F, et al. Lenvatinib versus sorafenib in first‐line treatment of patients with unresectable hepatocellular carcinoma: a randomised phase 3 non‐inferiority trial. Lancet 2018;391:1163‐1173. [DOI] [PubMed] [Google Scholar]
- 5. Bruix J, Qin S, Merle P, Granito A, Huang YH, Bodoky G, et al. Regorafenib for patients with hepatocellular carcinoma who progressed on sorafenib treatment (RESORCE): a randomised, double‐blind, placebo‐controlled, phase 3 trial. Lancet 2017;389:56‐66. [DOI] [PubMed] [Google Scholar]
- 6. Abou‐Alfa GK, Meyer T, Cheng AL, El‐Khoueiry AB, Rimassa L, Ryoo BY, et al. Cabozantinib (C) versus placebo (P) in patients (pts) with advanced hepatocellular carcinoma (HCC) who have received prior sorafenib: results from the randomized phase III CELESTIAL trial. J Clin Oncol 2018;36(Suppl 4):207. [Google Scholar]
- 7. El Khoueiry AB, Sangro B, Yau T, Crocenzi TS, Kudo M, Hsu C, et al. Nivolumab in patients with advanced hepatocellular carcinoma (CheckMate 040): an open‐label, non‐comparative, phase 1/2 dose escalation and expansion trial. Lancet 2017;389:2492‐2502. [DOI] [PMC free article] [PubMed] [Google Scholar]
- 8. Harimoto N, Taguchi K, Shirabe K, Adachi E, Sakaguchi Y, Toh Y, et al. The significance of fibroblast growth factor receptor 2 expression in differentiation of hepatocellular carcinoma. Oncology 2010;78:361‐368. [DOI] [PubMed] [Google Scholar]
- 9. Paur J, Nika L, Maier C, Moscu‐Gregor A, Kostka J, Huber D, et al. Fibroblast growth factor receptor 3 isoforms: Novel therapeutic targets for hepatocellular carcinoma? Hepatology 2015;62:1767‐1778. [DOI] [PubMed] [Google Scholar]
- 10. Gauglhofer C, Sagmeister S, Schrottmaier W, Fischer C, Rodgarkia‐Dara C, Mohr T, et al. Up‐regulation of the fibroblast growth factor 8 subfamily in human hepatocellular carcinoma for cell survival and neoangiogenesis. Hepatology 2011;53:854‐864. [DOI] [PubMed] [Google Scholar]
- 11. Moscatelli D, Joseph‐Silverstein J, Presta M, Rifkin DB. Multiple forms of an angiogenesis factor: basic fibroblast growth factor. Biochimie 1988;70:83‐87. [DOI] [PubMed] [Google Scholar]
- 12. Kano MR, Morishita Y, Iwata C, Iwasaka S, Watabe T, Ouchi Y, et al. VEGF‐A and FGF‐2 synergistically promote neoangiogenesis through enhancement of endogenous PDGF‐B‐PDGFRbeta signaling. J Cell Sci 2005;118:3759‐3768. [DOI] [PubMed] [Google Scholar]
- 13. Bergers G, Hanahan D. Modes of resistance to anti‐angiogenic therapy. Nat Rev Cancer 2008;8:592‐603. [DOI] [PMC free article] [PubMed] [Google Scholar]
- 14. Guagnano V, Furet P, Spanka C, Bordas V, Le Douget M, Stamm C, et al. Discovery of 3‐(2,6‐Dichloro‐3,5‐dimethoxy‐phenyl)‐1‐{6‐[4‐(4‐ethyl‐piperazin‐1‐yl)‐phenylamino]‐pyrimidin‐4‐yl}‐1‐methyl‐urea (NVP‐BGJ398), a potent and selective inhibitor of the fibroblast growth factor receptor family of receptor tyrosine kinase. J Med Chem 2011;54:7066‐7083. [DOI] [PubMed] [Google Scholar]
- 15. Guagnano V, Kauffmann A, Wohrle S, Stamm C, Ito M, Barys L, et al. FGFR genetic alterations predict for sensitivity to NVP‐BGJ398, a selective pan‐FGFR inhibitor. Cancer Discov 2012;2:1118‐1133. [DOI] [PubMed] [Google Scholar]
- 16. Nogova L, Sequist LV, Perez Garcia JM, Andre F, Delord JP, Hidalgo M, et al. Evaluation of BGJ398, a fibroblast growth factor receptor 1‐3 kinase inhibitor, in patients with advanced solid tumors harboring genetic alterations in fibroblast growth factor receptors: results of a global phase i, dose‐escalation and dose‐expansion study. J Clin Oncol 2017;35:157‐165. [DOI] [PMC free article] [PubMed] [Google Scholar]
- 17. Javle M, Lowery M, Shroff RT, Weiss KH, Springfeld C, Borad MJ, et al. Phase II study of BGJ398 in patients with FGFR‐altered advanced cholangiocarcinoma. J Clin Oncol 2018;36:276‐282. [DOI] [PMC free article] [PubMed] [Google Scholar]
- 18. Huynh H, Soo KC, Chow PK, Panasci L, Tran E. Xenografts of human hepatocellular carcinoma: a useful model for testing drugs. Clin Cancer Res 2006;12:4306‐4314. [DOI] [PubMed] [Google Scholar]
- 19. Huynh H, Ngo VC, Koong HN, Poon D, Choo SP, Toh HC, et al. AZD6244 enhances the anti‐tumor activity of sorafenib in ectopic and orthotopic models of human hepatocellular carcinoma (HCC). J Hepatol 2010;52:79‐87. [DOI] [PubMed] [Google Scholar]
- 20. Affymetrix Power Tools Copy Number Workflow Manual (apt‐1.12.0) . http://www.affymetrix.com/support/developer/powertools/changelog/apt-copynumber-workflow.html. 2017. Accessed on June 24, 2018.
- 21. Eckel‐Passow JE, Atkinson EJ, Maharjan S, Kardia SL, de Andrade M. Software comparison for evaluating genomic copy number variation for Affymetrix 6.0 SNP array platform. BMC Bioinformatics 2011;12:220. [DOI] [PMC free article] [PubMed] [Google Scholar]
- 22. Turner N, Grose R. Fibroblast growth factor signalling: from development to cancer. Nat Rev Cancer 2010;10:116‐129. [DOI] [PubMed] [Google Scholar]
- 23. Haugsten EM, Wiedlocha A, Olsnes S, Wesche J. Roles of fibroblast growth factor receptors in carcinogenesis. Mol Cancer Res 2010;8:1439‐1452. [DOI] [PubMed] [Google Scholar]
- 24. Paez‐Ribes M, Allen E, Hudock J, Takeda T, Okuyama H, Vinals F, et al. Antiangiogenic therapy elicits malignant progression of tumors to increased local invasion and distant metastasis. Cancer Cell 2009;15:220‐231. [DOI] [PMC free article] [PubMed] [Google Scholar]
- 25. Calvani M, Rapisarda A, Uranchimeg B, Shoemaker RH, Melillo G. Hypoxic induction of an HIF‐1alpha‐dependent bFGF autocrine loop drives angiogenesis in human endothelial cells. Blood 2006;107:2705‐2712. [DOI] [PMC free article] [PubMed] [Google Scholar]
- 26. Park JS, Kim IK, Han S, Park I, Kim C, Bae J, et al. Normalization of tumor vessels by Tie2 activation and Ang2 inhibition enhances drug delivery and produces a favorable tumor microenvironment. Cancer Cell 2016;30:953‐967. [DOI] [PubMed] [Google Scholar]
- 27. Cantelmo AR, Conradi LC, Brajic A, Goveia J, Kalucka J, Pircher A, et al. Inhibition of the glycolytic activator PFKFB3 in endothelium induces tumor vessel normalization, impairs metastasis, and improves chemotherapy. Cancer Cell 2016;30:968‐985. [DOI] [PMC free article] [PubMed] [Google Scholar]
- 28. Mpekris F, Baish JW, Stylianopoulos T, Jain RK. Role of vascular normalization in benefit from metronomic chemotherapy. Proc Natl Acad Sci U S A 2017;114:1994‐1999. [DOI] [PMC free article] [PubMed] [Google Scholar]
- 29. Gonzalez‐Cid M, Larripa I, Slavutsky I. Vinorelbine: cell cycle kinetics and differential sensitivity of human lymphocyte subpopulations. Toxicol Lett 1997;93:171‐176. [DOI] [PubMed] [Google Scholar]
- 30. Tunissiolli NM, Castanhole‐Nunes MMU, Biselli‐Chicote PM, Pavarino EC, da Silva RF, da Silva RC, et al. Hepatocellular carcinoma: a comprehensive review of biomarkers, clinical aspects, and therapy. Asian Pac J Cancer Prev 2017;18:863‐872. [DOI] [PMC free article] [PubMed] [Google Scholar]
- 31. Zhao G, Li WY, Chen D, Henry JR, Li HY, Chen Z, et al. A novel, selective inhibitor of fibroblast growth factor receptors that shows a potent broad spectrum of antitumor activity in several tumor xenograft models. Mol Cancer Ther 2011;10:2200‐2210. [DOI] [PubMed] [Google Scholar]
- 32. Gozgit JM, Wong MJ, Moran L, Wardwell S, Mohemmad QK, Narasimhan NI, et al. Ponatinib (AP24534), a multitargeted pan‐FGFR inhibitor with activity in multiple FGFR‐amplified or mutated cancer models. Mol Cancer Ther 2012;11:690. [DOI] [PubMed] [Google Scholar]
- 33. Gavine PR, Mooney L, Kilgour E, Thomas AP, Al‐Kadhimi K, Beck S, et al. AZD4547: an orally bioavailable, potent, and selective inhibitor of the fibroblast growth factor receptor tyrosine kinase family. Cancer Res 2012;72:2045. [DOI] [PubMed] [Google Scholar]
- 34. Casanovas O, Hicklin DJ, Bergers G, Hanahan D. Drug resistance by evasion of antiangiogenic targeting of VEGF signaling in late‐stage pancreatic islet tumors. Cancer Cell 2005;8:299‐309. [DOI] [PubMed] [Google Scholar]
- 35. Yoshiji H, Kuriyama S, Yoshii J, Ikenaka Y, Noguchi R, Hicklin DJ, et al. Synergistic effect of basic fibroblast growth factor and vascular endothelial growth factor in murine hepatocellular carcinoma. Hepatology 2002;35:834‐842. [DOI] [PubMed] [Google Scholar]
- 36. Wiesenauer CA, Yip‐Schneider MT, Wang Y, Schmidt CM. Multiple anticancer effects of blocking MEK‐ERK signaling in hepatocellular carcinoma. J Am Coll Surg 2004;198:410‐421. [DOI] [PubMed] [Google Scholar]
- 37. Huynh H, Pierce Chow KH, Chee Soo Khee, Chong Toh Han, Pin Choo Su, Fong Foo Kian, et al. RAD001 (Everolimus) inhibits tumor growth in xenograft models of human hepatocellular carcinoma. J Cell Mol Med 2009;13:1371‐1380. [DOI] [PMC free article] [PubMed] [Google Scholar]
- 38. Steelman LS, Chappell WH, Abrams SL, Kempf RC, Long J, Laidler P, et al. Roles of the Raf/MEK/ERK and PI3K/PTEN/Akt/mTOR pathways in controlling growth and sensitivity to therapy‐implications for cancer and aging. Aging (Albany NY) 2011;3:192‐222. [DOI] [PMC free article] [PubMed] [Google Scholar]
- 39. Ozawa CR, Banfi A, Glazer NL, Thurston G, Springer ML, Kraft PE, et al. Microenvironmental VEGF concentration, not total dose, determines a threshold between normal and aberrant angiogenesis. J Clin Invest 2004;113:516‐527. [DOI] [PMC free article] [PubMed] [Google Scholar]
- 40. Lee CG, Heijn M, di Tomaso E, Griffon‐Etienne G, Ancukiewicz M, Koike C, et al. Anti‐vascular endothelial growth factor treatment augments tumor radiation response under normoxic or hypoxic conditions. Cancer Res 2000;60:5565‐5570. [PubMed] [Google Scholar]
- 41. Jain RK. Tumor angiogenesis and accessibility: role of vascular endothelial growth factor. Semin Oncol 2002;29:3‐9. [DOI] [PubMed] [Google Scholar]
- 42. Jain RK. Antiangiogenic therapy for cancer: current and emerging concepts. Oncology (Williston Park) 2005;19:7‐16. [PubMed] [Google Scholar]
- 43. Fukumura D, Kloepper J, Amoozgar Z, Duda DG, Jain RK. Enhancing cancer immunotherapy using antiangiogenics: opportunities and challenges. Nat Rev Clin Oncol 2018;15:325‐340. [DOI] [PMC free article] [PubMed] [Google Scholar]
- 44. Khan KA, Kerbel RS. Improving immunotherapy outcomes with anti‐angiogenic treatments and vice versa. Nat Rev Clin Oncol 2018;15:310‐324. [DOI] [PubMed] [Google Scholar]
- 45. Jain RK. Normalization of tumor vasculature: an emerging concept in antiangiogenic therapy. Science 2005;307:58‐62. [DOI] [PubMed] [Google Scholar]
- 46. Tian L, Goldstein A, Wang H, Ching Lo H, Sun Kim I, Welte T, et al. Mutual regulation of tumour vessel normalization and immunostimulatory reprogramming. Nature 2017;544:250‐254. [DOI] [PMC free article] [PubMed] [Google Scholar]
- 47. Batchelor TT, Sorensen AG, di Tomaso E, Zhang WT, Duda DG, Cohen KS, et al. AZD2171, a pan‐VEGF receptor tyrosine kinase inhibitor, normalizes tumor vasculature and alleviates edema in glioblastoma patients. Cancer Cell 2007;11:83‐95. [DOI] [PMC free article] [PubMed] [Google Scholar]
- 48. National Research Council Committee for the Update of the Guide for the Care and Use of Laboratory Animals . Guide for the Care and Use of Laboratory Animals, Eighth Edition Washington, DC: National Academies Press (US); 2011. [Google Scholar]
- 49. Tallarida RJ. Drug synergism: its detection and applications. J Pharmacol Exp Ther 2001;298:865‐872. [PubMed] [Google Scholar]
Associated Data
This section collects any data citations, data availability statements, or supplementary materials included in this article.
Supplementary Materials