

Abstract
Introduction and Aims
To investigate behaviours related to four alcohol policy variables (policy‐relevant behaviours) and demographic variables in relation to typical quantities of alcohol consumed on‐premise in six International Alcohol Control study countries.
Design and Methods
General population surveys with drinkers using a comparable survey instrument and data analysed using path analysis in an overall model and for each country. Measures: typical quantities per occasion consumed on‐premise; gender, age; years of education, prices paid, time of purchase, time to access alcohol and liking for alcohol advertisements.
Results
In the overall model younger people, males and those with fewer years of education consumed larger typical quantities. Overall lower prices paid, later time of purchase and liking for alcohol ads predicted consuming larger typical quantities; this was found in the high‐income countries, less consistently in the high‐middle‐income countries and not in the low middle‐income country. Three policy‐relevant behaviours (prices paid, time of purchase, liking for alcohol ads) mediated the relationships between age, gender, education and consumption in high‐income countries.
Discussion and Conclusions
International Alcohol Control survey data showed a relationship between policy‐relevant behaviours and typical quantities consumed and support the likely effect of policy change (trading hours, price and restrictions on marketing) on heavier drinking. The path analysis also revealed policy‐relevant behaviours were significant mediating variables between the effect of age, gender and educational status on consumption. However, this relationship is clearest in high‐income countries. Further research is required to understand better how circumstances in low‐middle‐income countries impact effects of policies.
Keywords: alcohol policy, alcohol consumption, age, socioeconomic status
Introduction
Policy impacts on alcohol consumption
Research, largely in high‐income countries, has demonstrated how specific alcohol policies impact on consumption or harm 1. Further, cross‐country comparisons show relationships between the extent of alcohol policies and consumption 2, 3, with the three ‘best buys’ for alcohol policy in reducing consumption and harm identified as restrictions on availability, increasing price and restrictions on marketing 4.
Less is known about the relationships between alcohol policy and consumption and harm in middle‐income countries. This is an urgent research need since the expansion of alcohol consumption, which is determined in part by distribution, prices and marketing, is now largely confined to the growing economies in which a large proportion of the population are younger and well connected to the global youth culture 5. In these countries, there is often an absence of alcohol policies in place and, and even when these are enacted, the implementation and enforcement of policies is weak or non‐existent 1.
In addition to differences between jurisdictions, there are other reasons why alcohol policies do not always have the expected effects 6. Alcohol consumption is complex with two somewhat independent dimensions of drinking: the quantity consumed in a drinking occasion and the frequency of drinking. Policies may affect these differently. Furthermore, beverage types and different locations for purchase and consumption may be affected differently. Sectors of the population have different drinking patterns and they may purchase and drink in different locations therefore being affected differently by policies.
Our study investigates the relationship between different demographic groups (defined in terms of age, gender and educational status), policy‐relevant behaviours related to what are believed to be the most effective alcohol policies (price, access and marketing), and how these are related to the quantities typically consumed in on‐premise locations. We examined these relationships in a pooled dataset from six countries of the International Alcohol Control (IAC) Study, allowing us to not only look at an overall effect but also effects observed within individual countries.
Demographic variables and consumption
Age is a variable of interest given that consumption, particularly the quantities consumed in a drinking occasion, tend to be higher among younger age groups; in many countries later teenage and early adult years are the heaviest drinking stages in life cycles 7, 8, while in others consumption increases with increasing age 9. Similarly males are, in most countries, heavier consumers than women and among younger adults, where most of the alcohol attributable burden falls, alcohol consumption was responsible for more than 10% of all burden of disease in men and 2–3% in women 10. Globally, in 2016, alcohol use in those between the ages of 15 years and 49 years of age was the leading risk factor in disability‐adjusted life years lost 11.
Educational status is an indicator of socio‐economic status 12 and further understanding of its relationship with alcohol consumption is important as part of a focus on reducing health inequities. Many of the chronic diseases shown to have a socio‐economic gradient, such as cancer and cardiovascular disease, along with injuries 13, 14 are partially attributable to alcohol 10. In a number of high‐income countries, it appears that better educated drinkers drink more frequently but in smaller quantities 15, 16. In middle‐income countries, the relationship between education and alcohol consumption may be more complex, particularly in relation to commercial alcohol, as it is the better educated who may find alcohol more affordable.
Typical quantities consumed on‐premise are likely to be affected by policy changes and also to be related to demographic variables, such as age, gender and education level. Our study specifically examines quantity consumed on a typical drinking occasion in on‐premise drinking locations as the outcome measure as this measure has been shown to reflect likelihood of acute harms particularly, violence and injury 17, 18.
International Alcohol Control study
This paper takes advantage of the availability of new data gathered in the first wave of data collection as part of the IAC study. The IAC study is an international collaborative project designed to collect data on alcohol consumption and policy‐relevant mediating behaviours in a comparable way in high‐ and middle‐/low‐income countries and to measure effects on any policy changes 19. It was developed with initial funding from New Zealand in collaboration between researchers from the initial participating countries: New Zealand, Thailand, Korea, Scotland and England 19. Countries are self‐selected and 16 countries have participated in some components of the IAC study 20 and data from 6 countries were available for this analysis.
Table 1 provides background information on the countries from which the samples were drawn (in the case of Peru, South Africa and Vietnam these were sub‐national samples). Prevalence of drinking alcohol is approximately related to per capita income but there are exceptions, for example, Thailand where the prevalent religion and the government's implementation of effective alcohol control policy have maintained lower prevalence. In middle‐income countries, lower levels of policy enforcement are common 21.
Table 1.
Population size, GDP per capita, prevalence of alcohol use and aggregate levels of alcohol consumption across countries
| Total population (millions) | GDP per capita PPPa (current international $) | Education Indexb | Prevalence (%) of alcohol use: percentage of people consuming alcohol in the past 12 months (2010 data)c | Total per capita (15+) consumption (L of pure alcohol) (2008–2010)c | |||||
|---|---|---|---|---|---|---|---|---|---|
| Female | Male | Both | Total | Unrecorded | |||||
| High income | |||||||||
| New Zealand | 2011 | 4.4 | $32 986 | 0.917 | 74.5 | 84.8 | 79.5 | 10.9 | 1.6 |
| Saint Kitts and Nevis | 2015 | 0.05 | $25 681 | 0.638 | 31.5 | 54 | 42.5 | 8.2 | 0.5 |
| Middle income | |||||||||
| Thailand | 2012 | 67.8 | $14 714 | 0.608 | 14.9 | 45.4 | 29.7 | 7.1 | 0.7 |
| South Africa | 2014 | 54.1 | $13 127 | 0.695 | 26.3 | 56.3 | 40.6 | 11 | 2.9 |
| Peru | 2015 | 31.4 | $12 529 | 0.664 | 44 | 66.9 | 55.4 | 8.1 | 2 |
| Vietnam | 2014 | 90.7 | $5657 | 0.513 | 28.6 | 48.5 | 38.3 | 6.6 | 4.6 |
Policy variables
The IAC is unique in that it brings together survey measures on four policy‐relevant variables that may mediate the relationship between alcohol consumption and demographic variables. These are: prices paid for alcohol, time taken to access alcohol, times of purchase and responses to marketing. The survey is unusual in that it also collects valid measures of consumption, frequency and typical occasion quantity, separately for off‐premise (take away) and on‐premise venues (including bars, nightclubs, restaurants and sports clubs) and relevant demographic variables, including age, gender and educational achievement 19. This paper reports data pertaining to on‐premise venues.
We have derived a theoretical model in which age, gender and education level have independent effects on policy‐relevant variables (time to access alcohol, purchase at later hours, prices paid and response to marketing); these also affect the typical quantities of alcohol consumed. The model also allows for determination of the indirect/mediating effects of these policy‐relevant variables on the relationship between age, gender, education and the typical quantities consumed. (Our model is similar to the model used in relation to New Zealand data only 22).
Methods
Design and sampling
This paper includes IAC survey data, collected 2011–2016, from two small high‐income countries (New Zealand: 2011 and St Kitts and Nevis: 2014–2016), three high‐middle‐income countries (Peru: 2015, South Africa: 2014 and Thailand: 2012–2013), and one low middle‐income country (Vietnam: 2014).
Each country used different methodologies designed to obtain random, representative samples, such as a multistage stratified cluster random sampling design in South Africa, St Kitts and Nevis, Thailand, Vietnam and Peru and a representative sample of published and unpublished residential landline numbers in New Zealand. For New Zealand and St Kitts and Nevis, respondents were sampled from the whole country, whereas for other countries the samples were sub‐national: the Los Olivos district in the city of Lima in Peru, Tshwane metro in South Africa, nine provinces in Thailand (including Bangkok), and three provinces in Vietnam. Eligible participants had consumed alcohol in the past 6 months and were aged 16–65 years.
Data collection
New Zealand used an in‐house, computer‐assisted telephone interviewing system, whereas the other countries interviewed participants face to face using android tablets (Peru, South Africa, St Kitts and Nevis, Thailand and Vietnam). Computer‐assisted surveys were used in all countries due to the complexity of the survey which has numerous skip patterns. Once a household was recognised as residential, numerous call backs were made at different times of the day and days of the week in order to attempt to reach the household. Once a household was contacted, a screening interview established eligibility for participation in the study (drinking in the last 6 months and age 16–65 years). Eligible individuals were enumerated, and one respondent was selected at random by the computer/tablet. Informed consent was then sought from the person identified before proceeding. Interviews took on average about 30 min to complete. In many of the countries (e.g. New Zealand, South Africa and Thailand) participants received a small gift (e.g. a modest shopping or a cellular telephone recharge voucher or a polo shirt) to acknowledge their participation. The studies were approved by their local ethics committees. Response rates varied from 60% in New Zealand and St Kitts and Nevis to 99% in Vietnam.
Measures
Consumption
The IAC questionnaire utilises a within‐location and beverage‐specific framework and allows for countries to adapt the consumption measurement framework to their context in terms of specific drinking locations and specific beverages. The framework asks for the frequency of drinking in all locations in which drinking occurs and then typical occasion quantity in each location. Study participants report their consumption of different beverages specific to their country (including unrecorded alcohol) in their own terms and interviewers code these using typical containers and glass sizes reported. Typical occasion quantity, the outcome measure in this analysis, is the weighted average across all on‐premise locations (on‐premise locations at which participants drink less frequently have less weight).
Policy‐relevant variables
Location of purchase
Respondents were asked to report where they purchased the alcohol beverages they consumed in the last 6 months.
Time taken to access alcohol
Respondents were asked to report how much time it took them to travel to the usual place where they purchased or from where they obtained alcohol: converted to a binary variable, 1 if 15 min or less, 0 if longer.
Time of purchase
Respondents reported when they had purchased alcohol. Countries differed in the time options offered (reflecting local investigators’ decisions) and therefore the cut off times for the late purchasing time indicator was determined separately for each country; it was based on approximately 15% of the sample being included in the late purchasing time period. The cut offs for each country are as follows, New Zealand—after 2 am, South Africa—after 4 am, Peru—after 3 am, St Kitts and Nevis—after 3 am, Thailand—after 5 pm and Vietnam after 9 pm. These variables were analysed as separate binary variables.
Price
Price paid was obtained by referring back to the beverage and by type of location in which respondents reported drinking. Respondents were asked what price they would usually pay for each drink for every beverage and location in which they reported drinking. Prices paid in on‐premise locations were averaged across the sample and made comparable across countries by conversion into international purchasing power parity dollars 23. These were then log‐transformed for the analysis. Analysis has shown these price data in New Zealand correspond well with estimates of expenditure 22.
Liking of alcohol ads
Respondents were asked about their feeling about alcohol ads overall and responded on a 10‐ or 11‐point scale, from dislike a lot to like a lot. It was recoded as low, 0/1 to 5 and high, 6 to 10. The variable ‘liking of alcohol ads’ is an indication of the extent to which the alcohol marketing to which the respondents have been exposed resonates with them.
Demographics
Demographic variables were collected, including age, gender and years of education (low: 10 years or fewer; medium: 11–13 years and high: more than 13 years).
Analysis
Survey design and analysis
The countries in our study had different sampling designs, ranging from a simple random to a stratified multistage sample. The process used to adjust for cross‐country sampling design was based on Kaminska and Lynn 24 which treats the individual countries as the top level strata. For countries (New Zealand, St Kitts and Nevis, South Africa, Thailand) which had already been stratified at the first stage, these strata became first‐stage strata of the combined survey. Countries (Vietnam) that did not have first‐stage stratification were treated as a single stratum. Checks were made so that stratum IDs were still unique after combining countries. Primary sampling units remained the same, again making sure that they were still unique after combining all countries. Weights were used where available and assumed to have a weight of one where they were not. Finite population correction was not used as this was incomplete for the majority of countries. As one person was selected per household, there was correction for unequal probability of respondent selection. A statistical process was used to deal with outliers whereby the right‐skewed distributions of consumption‐related variables were transformed to normalise them. The transforming function was logarithmic (for typical occasion quantity). The transformed series was then centred and scaled by subtracting the mean and dividing by the standard deviation and the 99th percentile of respondents were then removed.
Path analysis was used to investigate the direct and indirect relationships between the demographic, policy related and alcohol quantity variables. This was done separately by country so that the magnitude and direction of the estimates could be compared. An overall model was also constructed containing data from all countries. The models were fitted with the lavaan.survey library, which combines the lavaan and the survey packages, in R 3.3.0 25, 26, 27, 28. The library allows for the modelling of latent variables, as well as controlling for the survey design. The overall model used the methods presented in Kaminska and Lynn 24 to create an overall survey design structure that allows for the combination of different surveys, each with different designs. The price and typical occasion quantity variables were log‐transformed so that the distributions were approximately normal. New parameters were defined in the model so that indirect/total effects could be calculated with associated P‐values. Results were significant if the P‐value was less than 0.05.
Figure 1 shows the model predicting typical occasion quantity. The double‐ended arrows represent the covariance of the observed variables, while the straight single‐ended arrows represent linear dependencies.
Figure 1.
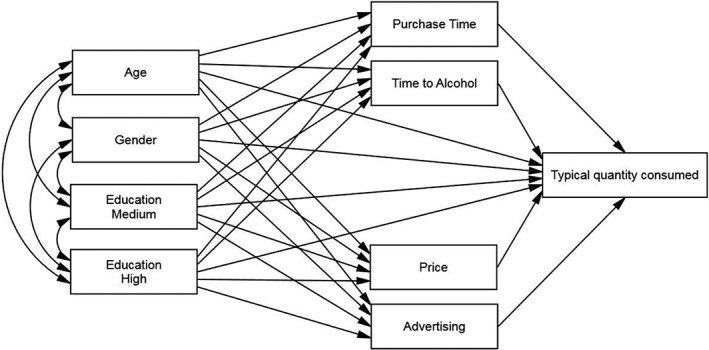
Model predicting typical on‐premise occasion quantity.
Results
Descriptive
Table 2 shows the demographic composition, responses to policy variables and mean typical occasion quantity in each country.
Table 2.
Demographic composition of the samples, policy variables and mean typical on‐premise occasion quantities consumed
| Characteristic | New Zealand n = 1437 | St Kitts/Nevis n = 738 | Thailand n = 426 | South Africa n = 280 | Peru n = 423 | Vietnam n = 777 |
|---|---|---|---|---|---|---|
| Age, years (mean) | 41.3 | 34.3 | 35.8 | 30.1 | 34.3 | 42.8 |
| Gender (%) | ||||||
| Female | 54.6 | 28.0 | 27.5 | 25.7 | 24.3 | 5.4 |
| Male | 45.4 | 72.0 | 72.5 | 74.3 | 75.7 | 94.6 |
| Education (%) | ||||||
| Low | 7.9 | 37.3 | 31.6 | 23.5 | 52.2 | 55.6 |
| Medium | 42.8 | 53.3 | 32.1 | 64.1 | 23.2 | 17.0 |
| High | 49.3 | 9.3 | 36.3 | 12.4 | 24.6 | 27.4 |
| Purchase late (%) | ||||||
| On‐licence | 12.7 | 10.4 | 12.0 | 9.0 | 22.0 | 12.0 |
| Time to alcohol | ||||||
| 15 min or less (%) | 77.1 | 66.2 | 93.7 | 57.6 | 89.6 | 73.7 |
| Price (US $ purchasing power parity per 15 mL drink), mean | 4.6 | 4.3 | 3.0 | 4.0 | 5.8 | 2.8 |
| Typical occasion quantity, mean mL | 47.7 | 85.8 | 90.3 | 234.3 | 65.7 | 77.3 |
Path analysis
Total effects
Table 3 shows the total standardised effects for typical quantities consumed when alcohol was purchased from on‐premises for each country and across all countries.
Table 3.
Standardised total effects: typical occasion quantities
| Total | New Zealand | St Kitts | Thailand | South Africa | Peru | Vietnam | All |
|---|---|---|---|---|---|---|---|
| Age | |||||||
| Age→Like alcohol adverts | −0.173* | 0.107* | −0.011 | −0.157* | −0.065 | −0.091 | −0.111* |
| Age→Price | −0.205* | −0.142* | −0.031 | −0.069 | −0.174* | −0.028 | −0.082* |
| Age→Purchasing later | −0.373* | −0.172* | −0.174* | −0.047 | −0.208* | −0.109* | −0.223* |
| Age→Time to access alcohol | −0.059* | 0.117* | −0.033 | 0.152 | 0.031 | 0.003 | 0.026 |
| Age→Typical occasion quantity | −0.220* | 0.054 | −0.064* | −0.254* | 0.083 | −0.142* | −0.175* |
| Gender | |||||||
| Gender→Like alcohol adverts | 0.165* | 0.053 | −0.054* | 0.001 | −0.090 | 0.012 | 0.057* |
| Gender→Price | −0.172* | −0.163* | −0.078 | 0.125* | −0.026 | −0.069* | −0.187* |
| Gender→Purchasing later | 0.092* | 0.116* | 0.037 | 0.164* | 0.053 | 0.069* | 0.080* |
| Gender→Time to access alcohol | 0.014 | 0.097* | 0.098 | 0.022 | 0.066 | −0.014 | 0.031 |
| Gender→Typical occasion quantity | 0.257* | 0.213* | 0.139* | 0.135 | 0.048 | 0.116* | 0.220* |
| Education | |||||||
| Education med→Like alcohol adverts | 0.064* | 0.009 | 0.019 | −0.054 | −0.116* | −0.046 | −0.024 |
| Education high→Like alcohol adverts | −0.018 | −0.020 | 0.040 | 0.026 | −0.228* | −0.023 | −0.078* |
| Education med→Price | 0.065* | 0.092* | −0.026 | 0.003 | 0.078 | 0.082* | 0.152* |
| Education high→Price | 0.144* | 0.201* | 0.031 | 0.192* | 0.285* | 0.053* | 0.199* |
| Education med→Purchasing later | 0.057* | 0.091* | 0.114* | 0.05 | 0.067 | −0.034* | 0.030 |
| Education high→Purchasing later | 0.027 | 0.025 | 0.029 | −0.036 | 0.072 | −0.041 | 0.022 |
| Education med→Time to Access Alcohol | 0.087* | −0.141* | −0.041 | 0.088 | −0.068 | 0.035 | −0.041* |
| Education high→Time to Access Alcohol | 0.002 | −0.211* | −0.127* | 0.094 | −0.082 | 0.021* | −0.038* |
| Education med→Typical occasion quantity | −0.036 | −0.126* | 0.045 | −0.016 | −0.133* | −0.064* | −0.033 |
| Education high→Typical occasion quantity | −0.107* | −0.185* | 0.023 | −0.188 | −0.268* | −0.041 | −0.079* |
| Price→Typical occasion quantity | −0.249* | −0.336* | −0.043 | −0.403* | −0.409* | −0.257 | −0.282* |
| Purchasing later→Typical occasion quantity | 0.187* | 0.119* | 0.116* | 0.026 | 0.293* | 0.093 | 0.087* |
| Time to access alcohol→Typical occasion quantity | 0.015 | 0.009 | 0.014 | 0.014 | 0.001 | 0.008 | −0.021 |
| Like alcohol adverts→Typical occasion quantity | 0.083* | 0.082* | 0.138* | 0.120* | 0.016 | −0.072 | 0.094* |
P < 0.05.
Demographic status and consumption
In the overall model, younger people, males and those with least education (compared with those with most education) reported larger typical quantities consumed on‐premise. Younger people drank larger typical occasion quantities on‐premise in New Zealand, Thailand, South Africa, and Vietnam. Males drank more in New Zealand, St Kitts and Nevis, Thailand and Vietnam. Fewer years of education compared with medium years predicted higher typical quantities consumed on‐premise in St Kitts and Nevis, Peru and Vietnam (but the overall model was not significant). Fewer years compared with the highest number of years of education predicted higher quantities consumed on‐premise in New Zealand, St Kitts and Nevis and Peru.
Relationship between policy variables and consumption
Lower prices paid, reports of purchasing later and liking alcohol ads all significantly predicted high typical quantities consumed on‐premise in the overall model. Price paid showed the strongest relationship. All of the countries showed a relationship in the same direction in relation to price and later purchase times. In New Zealand and St Kitts and Nevis lower price paid, later time of purchase and liking for alcohol ads all significantly predicted larger typical quantities consumed on‐premise. Lower price paid was also a significant predictor in South Africa and Peru; later time of purchase in Thailand and Peru and liking alcohol ads in Thailand and South Africa.
Demographic status and policy variables
Older participants, males and those with less education paid lower prices in the overall model. Younger participants and males purchased later. Older participants, females and those with the most years of education all reported least liking for alcohol ads.
While not all countries showed significant relationships identical to those in the overall model, there were very few variables in which countries’ significant relationships went in different directions. One such exception was gender's relationship with liking alcohol ads in which New Zealand men reported greater liking, whereas Thai women liked ads more than Thai men. The other analyses where there were significant relationships in different directions related to years of education.
Indirect effects
The mediating effects of the policy‐relevant variables investigated in this study are shown in Table 4.
Table 4.
Standardised indirect effects: typical occasion quantities
| Indirect | New Zealand | St Kitts | Thailand | South Africa | Peru | Vietnam | All |
|---|---|---|---|---|---|---|---|
| Age→Price→Typical occasion quantity | 0.051* | 0.048* | 0.001 | 0.028 | 0.071* | 0.007 | 0.023* |
| Age→Purchasing later→Typical occasion quantity | −0.040* | −0.014* | −0.024* | −0.006 | −0.003 | 0.008 | −0.021* |
| Age→Like alcohol adverts→Typical occasion quantity | −0.032* | 0.013* | −0.001 | −0.004 | −0.019 | −0.008 | −0.010* |
| Age→Time to Access Alcohol→Typical occasion quantity | −0.001 | 0.001 | 0.000 | 0.002 | 0.000 | 0.000 | −0.001 |
| Age total indirect | −0.022 | 0.047* | −0.024* | 0.020 | 0.049 | 0.007 | −0.008 |
| Gender→Price→Typical occasion quantity | 0.043* | 0.055* | 0.003 | −0.051* | 0.011 | 0.018* | 0.053* |
| Gender→Purchasing later→Typical occasion quantity | 0.010 | 0.010* | 0.005 | 0.020 | 0.001 | −0.005 | 0.007* |
| Gender→Like alcohol adverts→Typical occasion quantity | 0.031* | 0.006 | −0.006 | 0.000 | −0.026 | 0.001 | 0.005* |
| Gender→Time to Access Alcohol→Typical occasion quantity | 0.000 | 0.001 | 0.001 | 0.000 | 0.000 | 0.000 | −0.001 |
| Gender total indirect | 0.084* | 0.072* | 0.004 | −0.031 | −0.015 | 0.014* | 0.065* |
| Education med→Price→Typical occasion quantity | −0.016* | −0.031* | 0.001 | −0.001 | −0.032 | −0.021 | −0.043* |
| Education high→Price→Typical occasion quantity | −0.036* | −0.067* | −0.001 | −0.078* | −0.117* | −0.014 | −0.056* |
| Education med→Purchasing later→Typical occasion quantity | 0.006* | 0.008 | 0.016* | 0.006 | 0.001 | 0.002* | 0.003 |
| Education high→Purchasing later→Typical occasion quantity | 0.003 | 0.002 | 0.004 | −0.004 | 0.001 | 0.003 | 0.002 |
| Education med→Like alcohol adverts→Typical occasion quantity | 0.012* | 0.001 | 0.002 | −0.001 | −0.034* | −0.004 | −0.002 |
| Education high→Like alcohol adverts→Typical occasion quantity | −0.003 | −0.002 | 0.005 | 0.001 | −0.067* | −0.002 | −0.007* |
| Education med→Time to access alcohol→Typical occasion quantity | 0.001 | −0.001 | −0.001 | 0.001 | 0.000 | 0.000 | 0.001 |
| Education high→Time to access alcohol→Typical occasion quantity | 0.000 | −0.002 | −0.002 | 0.001 | 0.000 | 0.000 | 0.001 |
| Education med total indirect | 0.003 | −0.024 | 0.018* | 0.005 | −0.065* | −0.022* | −0.041* |
| Education high total indirect | −0.036* | −0.070* | 0.006 | −0.080 | −0.182* | −0.013* | −0.060* |
P < 0.05.
The relationship in which younger people drink higher quantities was found in the overall model to be mediated by younger people liking alcohol ads more and purchasing later. The liking alcohol mediator ads was found to be significant in New Zealand with younger people liking alcohol ads more, leading to an increase in consumption. In St Kitts and Nevis, the liking for alcohol ads mediation was in the opposite direction. The indirect effect of age on consumption through time of purchasing was significant in New Zealand, St Kitts and Nevis and Thailand (and in the overall model); younger people were associated with purchasing later which lead to larger typical occasion quantity consumed on‐premise. In the indirect effects model the effect of age on typical occasion quantity mediated by price was positive, meaning that as age increases, its effect of paying lower prices causes an increase in typical occasion quantity consumed on‐premise. The total indirect effect of age was not significant.
The relationship between gender and typical quantities consumed on‐premise in the overall model was mediated by men paying lower prices, purchasing later and liking ads more. The total indirect effect was significant. The effect of gender through price to typical quantities consumed on‐premise was significant and positive in New Zealand, St Kitts and Nevis and Vietnam, but South Africa showed an inverse relationship and it is possible South African women were choosing more expensive beverages (wine or spirits rather than beer) and this contributed to lower typical quantities consumed on‐premise. Time of purchase as mediator was significant in St Kitts and Nevis and liking alcohol ads as mediator in New Zealand.
The total indirect effects of both medium and high education were significant. The relationship between medium and high education level and quantities consumed was mediated by price with those with more education paying higher prices and consuming less. This was significant in New Zealand and St Kitts and Nevis in relation to medium education and in New Zealand, St Kitts and Nevis, South Africa and Peru in relation to high education.
The only other significant relationship in the overall model of indirect effects was in relation to higher educational status and liking alcohol ads. Higher education predicted less liking of alcohol ads which leads to less consumption. The only country which showed a significant relationship here was Peru.
Discussion
Our analysis uses survey data on key behaviours likely to be influenced by selected alcohol policies, and explores both the direct effects on typical quantities consumed on‐premise and also how these behaviours mediate differences in alcohol consumption between different demographic groups, specifically age, gender and educational status. The behaviours and influences are time of purchase, time to access alcohol, price paid and the liking of marketing. The data are drawn from six countries, including high‐income and middle‐income and allow for analysis in an overall model and also specific to each country.
Prices chosen
Price is known to be a significant driver of consumption and, therefore, the use of excise tax and, more recently, minimum unit price to increase prices is actively promoted as an effective policy to reduce alcohol‐related harm 29, 30 and as one of the ‘best buys’ for non‐communicable disease prevention 4. While most research evidence comes from high‐income countries, there is evidence of a relationship between price and consumption in low‐ and middle‐income countries 31.
In this study in the overall total effects model, those participants drinking larger quantities on‐premise chose lower prices. This effect was found in the high‐income countries of New Zealand and St Kitts and Nevis but also in South Africa and Peru. The effect was not significant in Thailand (where the proportion of drinkers consuming on‐premise is very low). It was also not significant in Vietnam which reported the lowest prices in any country and has a very high proportion of informal alcohol 32.
The results from the path analysis identifying indirect effects also showed the choice of lower prices mediated the larger typical quantity on‐premise drinking occasions reported by males and less well educated respondents in the sample. Both of these mediating effects were seen in the high‐income countries of New Zealand and St Kitts and Nevis and the mediation of the age/quantity relationship by price was also seen in Vietnam. However, in South Africa, women paid more so the effect was in the opposite direction with higher prices mediating the relationship between gender and typical quantities consumed on‐premise.
Alcohol marketing
The measure of liking for alcohol ads reflects the way alcohol marketing resonates with the respondent. 33. Advertising which is creative, perceived as meaningful and relevant, using elements such as characters, action, storyline, music and visuals is effective and persuasive with young people 33, 34. Liking has previously been found to be related to intentions to drink 33 and, in a longitudinal study, liking for advertising predicted heavier consumption several years later 34.
Reporting more liking for alcohol ads in the overall total effects model predicted drinking larger quantities on‐premise and the relationship was significant in the four highest income countries (New Zealand, St Kitts and Nevis, Thailand and South Africa). Liking for ads as a mediator was mainly seen in New Zealand, where it influenced the consumption of younger males. In Peru, those of higher educational status liked ads less and drank less.
Marketing is an under‐regulated area and the consistency of these (albeit cross‐sectional) relationships supports the need for policy attention. A change in alcohol marketing policy, such as that applied to tobacco in the Framework Convention on Tobacco Control in 2005, is likely to affect alcohol consumption. It should be noted these data largely preceded the explosion of the social media of which the alcohol corporations have taken advantage 35, 36.
Trading hours
Reductions in trading hours have been found to reduce alcohol‐related harm in a number of countries 37. Our overall model showed later purchasers were more likely to consume larger amounts on a typical on‐premise drinking occasion and time of purchase mediated younger people's consumption of larger typical quantities consumed on‐premise. These relationships were found in New Zealand, St Kitts and Nevis, Thailand and Peru, despite different cut off times for later purchase reflecting different country contexts.
Time to access alcohol
The evidence for an impact on consumption from proximity to alcohol outlets is mixed 38, 39, 40. In this study, no significant relationship with on‐premise typical quantity was found with time to access and nor were there any relationships found in each country analysis.
The analysis showed a clear relationship between behaviours related to the three ‘best buys’ of alcohol policy, price, marketing and availability (in relation to trading hours but not proximity) and the quantities being consumed in on‐premise drinking locations. However, the relationships were more consistent, being found in relation to all of the policy variables, in high‐income countries and less so in the high‐middle‐income countries. In Vietnam, a low middle‐income country, with high levels of informal alcohol use 32, there was no significant relationships with price, time of purchase or liking for ads.
The patterns of indirect effects found in the path analysis were, again, more consistent in showing a mediating effect of policy variables on the relationship between demographic variables and consumption in the two high‐income countries. They were not confined to high‐income countries, however, and, for example, in Thailand purchasing later mediated the higher quantities consumed on‐premise of younger and those with medium (11–13 years) education.
Limitations of the study include reliance on cross‐sectional data. The sub‐national samples in some countries and the limited number of countries involved are also limitations. Further research employing the IAC platform and with longitudinal analysis would increase our understanding of the relationships.
Conclusions
IAC survey data show a relationship between policy‐relevant behaviours and typical quantities consumed and support the likely effect of policy change (trading hours, price, and restrictions on marketing) on heavier drinking. The path analysis also revealed the policy‐relevant behaviours were significant mediating variables between the effect of age, gender and educational status on typical quantities consumed on‐premise. However, the relationship between policy‐related behaviours and consumption is more in evidence where per capita income and prevalence of drinking commercial alcohol is higher. Further research is required to understand better the policy circumstances in low middle income countries and the effect on policy‐relevant behaviours.
Conflict of Interest
The authors have no conflicts of interest.
Acknowledgements
The data used in this paper are from the International Alcohol Control Study, led by Professor Sally Casswell. The IAC core survey questionnaire was largely developed by researchers at the SHORE & Whāriki Research Centre, College of Health, Massey University, New Zealand, with funding from the Health Promotion Agency, New Zealand. Further development involved collaboration between UK, Thai, Korean and New Zealand researchers. The funding sources for data sets used in this article for each country are: Australia – Australian National Preventive Health Agency and the Foundation for Alcohol Research and Education; New Zealand – The Health Promotion Agency and Health Research Council of New Zealand; St Kitts/Nevis – International Development Research Centre, Canada; Peru – International Development Research Centre, Canada; Thailand – International Health Policy Program, Thai Health; South Africa – South African Medical Research Council and International Development Research Centre, Canada; Vietnam – International Development Research Centre, Canada. We would also like to acknowledge support from UK Centre for Tobacco and Alcohol Studies, the excellent work of the interviewers and their supervisors and the time given by the survey respondents.
Sally Casswell PhD, Director, Taisia Huckle PhD, Researcher, Martin Wall PhD, Researcher, Karl Parker MSc, Statistician, Surasak Chaiyasong PhD, Director, Charles D. H. Parry PhD, Director, Pham Viet Cuong PhD, Director, Gaile Gray‐Phillip MRes, Dean, Marina Piazza ScD, Researcher.
References
- 1. Babor T, Caetano R, Casswell S et al Alcohol: no ordinary commodity research and public policy, 2nd edn. Oxford: Oxford University Press, 2010. [Google Scholar]
- 2. Brand D, Saisana M, Rynn L, Pennoni F, Lowenfels A. Comparative analysis of alcohol control policies in 30 countries. PLoS Med 2007;4:752–9. [DOI] [PMC free article] [PubMed] [Google Scholar]
- 3. Carragher N, Byrnes J, Doran C, Shakeshaft A. Developing an alcohol policy assessment toolkit: application in the western Pacific. Bull World Health Organ 2014;92:726–33. [DOI] [PMC free article] [PubMed] [Google Scholar]
- 4. World Health Organization . From Burden to “Best Buys”: Reducing the Economic Impact of Non‐Communicable Diseases in Low and Middle‐Income Countries. 2011. (Archived by WebCite® at http://www.webcitation.org/6dgFv8xp7). Available at: http://apps.who.int/medicinedocs/en/d/Js18804en/ (accessed December 2015).
- 5. Casswell S. Current status of alcohol marketing policy – an urgent challenge for global governance. Addiction 2012;107:478–85. [DOI] [PubMed] [Google Scholar]
- 6. Livingston M, Chikritzhs T, Room R. Changing the density of alcohol outlets to reduce alcohol‐related problems. Drug Alcohol Rev 2007;26:557–66. [DOI] [PubMed] [Google Scholar]
- 7. Jernigan D. Global status report: alcohol and young people. Geneva: World Health Organization, 2001. [Google Scholar]
- 8. Kuntsche E, Rehm J, Gmel G. Characteristics of binge drinkers in Europe. Soc Sci Med 2004;59:113–27. [DOI] [PubMed] [Google Scholar]
- 9. Ahlstrom S. Alcohol use and problems among older women and men: a review. Nordic Stud Alcohol Drug 2008;25:154–61. [Google Scholar]
- 10. Rehm J, Mathers C, Popova S, Thavorncharoensap M, Teerawattananon Y, Patra J. Global burden of disease and injury and economic cost attributable to alcohol use and alcohol‐use disorders. Lancet (Series) 2009;373:2223–33. [DOI] [PubMed] [Google Scholar]
- 11. GBD 2016 Risk Factors Collaborators . Global, regional, and national comparative risk assessment of 84 behavioural, environmental and occupational, and metabolic risks or clusters of risks, 1990–2016: a systematic analysis for the Global Burden of Disease Study 2016. Lancet 2017;390:1345–422. [DOI] [PMC free article] [PubMed] [Google Scholar]
- 12. Kuntsche S, Knibbe R, Gmel G. Social roles and alcohol consumption: a study of 10 industrialised countries. Soc Sci Med 2009;68:1263–70. [DOI] [PMC free article] [PubMed] [Google Scholar]
- 13. Adler N, Newman K. Socioeconomic disparities in health: pathways and policies. Health Aff 2002;21:60–76. [DOI] [PubMed] [Google Scholar]
- 14. Gottfredson L. Intelligence: is it the epidemiologists' elusive "fundamental cause" of social class inequalities in health? J Pers Soc Psychol 2004;86:174–99. [DOI] [PubMed] [Google Scholar]
- 15. Casswell S, Huckle T, Wall M, Parker K. Policy relevant behaviours mediate the relationship between socio‐economic status and alcohol consumption – analysis from the International Alcohol Control (IAC) study. Alcohol Clin Exp Res 2016;40:385–92. [DOI] [PubMed] [Google Scholar]
- 16. Huckle T, You RQ, Casswell S. Socio‐economic status predicts drinking patterns but not alcohol‐related consequences independently. Addiction 2010;105:1192–202. [DOI] [PubMed] [Google Scholar]
- 17. Rossow I, Norström T. The impact of small changes in bar closing hours on violence. The Norwegian experience from 18 cities. Addiction 2012;107:530–7. [DOI] [PMC free article] [PubMed] [Google Scholar]
- 18. Liang W, Chikritzhs T. Revealing the link between licensed outlets and violence: counting venues versus measuring alcohol availability. Drug Alcohol Rev 2011;30:524–35. [DOI] [PubMed] [Google Scholar]
- 19. Casswell S, Meier P, MacKintosh A et al The international alcohol control (IAC) study—evaluating the impact of alcohol policies. Alcohol Clin Exp Res 2012;36:1462–7. [DOI] [PubMed] [Google Scholar]
- 20. International Alcohol Control Policy Evaluation Study . Welcome to the IAC study; 2017. Available at: http://www.iacstudy.org/ (accessed May 2017).
- 21. Casswell S, Morojele N, Petersen Williams P et al The Alcohol Environment Protocol: A new tool for alcohol policy. Drug Alcohol Rev 2018;37:S18–S26. [DOI] [PMC free article] [PubMed] [Google Scholar]
- 22. Casswell S, Huckle T, Wall M, Yeh L‐C. International Alcohol Control study: pricing data and hours of purchase predict heavier drinking. Alcohol Clin Exp Res 2014;38:1425–31. [DOI] [PubMed] [Google Scholar]
- 23. World Bank . Purchasing power parities and the real size of world economies: a comprehensive report of the 2011 International Comparison Program. Washington, DC: World Bank, 2015. [Google Scholar]
- 24. Kaminska O, Lynn P. Survey‐based cross‐country comparisons where countries vary in sample design: issues and solutions. J Off Stat 2017;33:123–36. [Google Scholar]
- 25. R Core Team . R: a language and environment for statistical computing. Vienna, Austria: R Foundation for Statistical Computing, 2016. [Google Scholar]
- 26. Lumley T. Analysis of complex survey samples. J Stat Softw 2004;9:1–19. [Google Scholar]
- 27. Yves R. Lavaan: an R package for structural equation modeling. J Stat Softw 2012;48:1–36. [Google Scholar]
- 28. Oberski D. Lavaan survey: an R package for complex survey analysis of structural equation models. J Stat Softw 2014;57:1–27.25400517 [Google Scholar]
- 29. Holmes J, Meng Y, Meier P et al Effects of minimum unit pricing for alcohol on different income and socioeconomic groups: a modelling study. Lancet 2014;383:1655–64. [DOI] [PMC free article] [PubMed] [Google Scholar]
- 30. World Health Organization . Global strategy to reduce the harmful use of alcohol. Geneva; 2010. Available at: http://www.who.int/substance_abuse/msbalcstragegy.pdf (accessed December 2015).
- 31. Sornpaisarn B, Shield K, Cohen J, Schwartz R, Rehm J. Elasticity of alcohol consumption, alcohol‐related harms, and drinking initiation in low‐ and middle‐income countries: a systematic review and meta‐analysis. Int J Alcohol Drug Res 2013;2:45–58. [Google Scholar]
- 32. World Health Organization . Global Information System on Alcohol and Health (GISAH). Geneva; 2016. Available at: http://www.who.int/gho/alcohol/en/ (accessed September 2017).
- 33. Chen M‐J, Grube J, Bersamin M, Waiters E, Keefe D. Alcohol advertising: what makes it attractive to youth? J Health Commun 2005;10:553–65. [DOI] [PubMed] [Google Scholar]
- 34. Casswell S, Zhang J. Impact of liking for advertising and brand allegiance on drinking and alcohol‐related aggression: a longitudinal study. Addiction 1998;93:1209–17. [DOI] [PubMed] [Google Scholar]
- 35. Woods A. Procter & Gamble, Heineken and Diageo: who wins and who loses in direct brand deals with Facebook? Marketing. 2012. (6 March). Available at: http://www.marketingmagazine.co.uk/article/1120503/procter---gamble-heineken-diageo-wins-loses-direct-brand-deals-facebook (accessed July 2014).
- 36. McCreanor T, Lyons A, Griffin C, Goodwin I, Moewaka Barnes H, Hutton F. Youth drinking cultures, social networking and alcohol marketing: implications for public health. Crit Public Health 2013;23:110–20. [Google Scholar]
- 37. Wilkinson C, Livingston M, Room R. Impacts of changes to trading hours of liquor licences on alcohol‐related harm: a systematic review 2005‐2015. Public Health Res Pract 2016;26:e2641644. [DOI] [PubMed] [Google Scholar]
- 38. Halonen J, Kivimäki M, Virtanen M et al Proximity of off‐premise alcohol outlets and heavy alcohol consumption: a cohort study. Drug Alcohol Depend 2013;132:295–300. [DOI] [PMC free article] [PubMed] [Google Scholar]
- 39. Kavanagh A, Kelly M, Krnjacki L et al Access to alcohol outlets and harmful alcohol consumption: a multi‐level study in Melbourne, Australia. Addiction 2011;106:1772–9. [DOI] [PubMed] [Google Scholar]
- 40. Young R, Macdonald L, Ellaway A. Associations between proximity and density of local alcohol outlets and alcohol use among Scottish adolescents. Health Place 2013;19:124–30. [DOI] [PMC free article] [PubMed] [Google Scholar]
- 41. World Bank . DataBank; 2017. Available at: http://databank.worldbank.org/data/home.aspx (accessed September 2017).
- 42. United Nations Development Programme . Human development report 2016: human development for everyone. New York, 2016. [Google Scholar]