

Summary
Aortic valve surgery is the definitive treatment for aortic stenosis (AS). No specific recommendation is available on how exercise training should be conducted and evaluated after aortic valve replacement (AVR). This study aimed to examine the effect of aerobic exercise training on exercise capacity following AVR. In addition to our primary outcome variable, peak oxygen uptake (peakVO 2), the effect on submaximal cardiopulmonary variables including oxygen uptake kinetics (tau), oxygen uptake efficiency slope (OUES) and ventilatory efficiency (VE/VCO 2 slope) was evaluated. Following AVR due to AS, 12 patients were randomized to either a group receiving 12 weeks of supervised aerobic exercise training (EX) or a control group (CON). Exercise capacity was assessed by a maximal cardiopulmonary exercise test (CPET). There was a significant increase in peak load (+28%, P = 0·031) and in peakVO 2 (+23%, P = 0·031) in EX, corresponding to an increase in achieved percentage of predicted peakVO 2 from 88 to 104% (P = 0·031). For submaximal variables, there were only non‐statistically significant trends in improvement between CPETs in EX. In CON, there were no significant differences in any maximal or submaximal variable between CPETs. We conclude that 12 weeks of supervised aerobic exercise training induces significant adaptations in cardiopulmonary function following AVR, especially in regard to maximal variables including peakVO 2. In addition, we provide novel data on the effect on several submaximal variables following exercise training in this group of patients.
Keywords: cardiac rehabilitation, exercise testing, heart valve surgery, peak oxygen uptake, physical fitness
Introduction
According to the most recent European position paper (Piepoli et al., 2010), cardiac rehabilitation including exercise training should be available for all patients undergoing heart valve surgery. However, no specific recommendation is available about how exercise training after aortic valve replacement (AVR) should be conducted (Sibilitz et al., 2016b) and few studies addressing cardiac rehabilitation following AVR present detailed training protocols (Ribeiro et al., 2017). Meanwhile, exercise capacity has been reported to be lower in patients following AVR for aortic stenosis (AS) than in age‐ and gender‐matched subjects (Zhao et al., 2012).
One way to assess exercise capacity is by cardiopulmonary exercise test (CPET), which provides a comprehensive assessment of the submaximal and maximal exercise responses (Guazzi et al., 2016). Current guidelines summarize the clinical value of CPET in offering diagnostic and prognostic information in a variety of conditions, especially concerning peak oxygen uptake (peakVO2) in patients with cardiac and pulmonary diseases (Arena et al., 2007; Balady et al., 2010). Previous studies have shown that a higher peakVO2 is associated with lower cardiac mortality and morbidity in healthy subjects (Laukkanen et al., 2004) as well as in patients with cardiovascular disease (Vanhees et al., 1995; Cicoira et al., 2004). In addition, there is increasing interest in submaximal CPET variables, in part due to evidence for an additive prognostic value in heart failure patients (Hollenberg & Tager, 2000; Van Laethem et al., 2005; Kunutsor et al., 2017), in part due to the fact that they hold independent physiological information.
The aim of this study was to investigate the effects of 12 weeks of supervised aerobic exercise training on maximal and submaximal measures of cardiopulmonary function as determined with CPET, in AS patients following AVR.
Methods
Study population
All adult patients undergoing AVR due to AS at the Department of Cardiothoracic Surgery, Linköping University Hospital, between August 2011 and December 2014 were reviewed for eligibility. Exclusion criteria were as follows: (i) any other concomitant cardiac disease, (ii) symptomatic lung disease or (iii) any mental or physical disability possibly limiting participation in the study. Patients were randomized to a supervised exercise training (EX) group or to a control group (CON). The study was approved by the regional ethical review board in Linköping, and all participants gave their written informed consent.
Cardiopulmonary exercise testing
Measurements took place at baseline five to six weeks postoperatively, at the end of the 12‐week intervention and one year hereafter. On each occasion, current medication, body weight, height and blood pressure at rest were recorded and a venous blood sample was drawn for analysis of haemoglobin (Hb) concentration.
During a maximal exercise test on a cycle ergometer (eBike Basic, GE Medical Systems, GmbH, Freiburg, Germany), gas exchange and ventilatory variables were analysed (Jaeger Oxycon Pro, Viasys Healthcare, Hoechberg, Germany). The system was calibrated prior to each test. In addition, patients were monitored with ECG (Marquette CASE 8000, GE Medical Systems, Milwaukee, WI, USA), systolic blood pressure, rated perceived exertion (Borg RPE scale), chest pain and dyspnoea (Borg CR‐10 scale) (Borg, 1982).
After a five‐minute steady state workload at 30, 50 or 100 Watts, the workload was increased continuously by 10, 15 or 20 Watts per minute. The steady state and incremental loads were chosen individually at baseline, aiming to reach exhaustion after 8 to 12 min of exercise, and were used consistently throughout the study. Each CPET was driven as far as possible, pursuing the oxygen uptake levelling off and a respiratory exchange ratio above 1·10.
Cardiopulmonary parameters and data analysis
Using commercially available software (JLab version 5.72.1, CareFusion GmbH, Heidelberg, Germany), oxygen uptake (VO2), carbon dioxide elimination (VCO2) and minute ventilation (VE) were measured on a breath‐by‐breath basis and presented numerically as 10‐s means, excluding breaths with the highest and lowest values.
PeakVO2 was defined as the average of the two highest consecutive 10‐s mean VO2 intervals at or close to the end of the exercise and was presented as absolute (ml min−1) and body mass indexed values (ml kg−1 min−1).
Two VE/VCO2 slopes were manually determined in the software: (A) the slope of the VE/VCO2 curve confined to the linear part up until the respiratory compensation point and (B) the slope of the whole curve (Mezzani et al., 2009).
The oxygen uptake efficiency slope (OUES) was determined using the following formula VO2 = a × log10 VE + b, in which the constant ‘a’ represents the rate of increase in VO2 in response to any increase in VE (Baba et al., 1996). OUES was indexed by body surface area (BSA), as calculated by Haycock's formula (Haycock et al., 1978), and was compared to predicted values from a healthy reference population, taking gender, age and BSA into consideration (Buys et al., 2015).
The VO2 on‐response kinetics were calculated as the time constant (tau), as described by the following formula: VO2 (time) = VO2 baseline × (1−e−time/tau) (Jones & Poole, 2005; Balady et al., 2010).
Exercise intervention
Exercise training protocol
Patients allocated to EX performed heart rate‐guided (Polar Watch, Polar FT1, Polar Electro, Kempele, Finland) supervised exercise training on a bicycle ergometer (Monark 828E, Monark Exercise AB, Stockholm, Sweden). The exercise training protocol was designed according to the most recent European position paper concerning exercise training in cardiac patients (Piepoli et al., 2010) in addition to being feasible over a large span of age and fitness. They had three sessions per week for 12 weeks, reaching a total number of 36 sessions (Figure 1). Heart rate, workload (Watts) and perceived exertion (Borg RPE scale) were recorded every five minutes, and the workload was adjusted to preserve HR within the given interval according to the protocol. After the 12 weeks, no further structured training was administered. Instead, patients in both groups were given general recommendations concerning aerobic physical activity for cardiac patients (Piepoli et al., 2010), briefly summarized as a minimum of 30 min of light to moderate physical activity at least five days per week. This could be replaced by a minimum of 20 min of vigorous aerobic activities at least three days per week.
Figure 1.
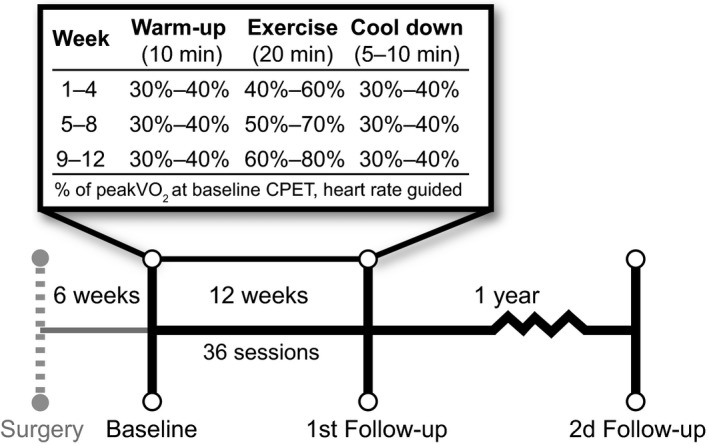
Exercise intervention protocol. PeakVO 2, peak oxygen uptake; CPET, cardiopulmonary exercise test.
Control group
Patients in CON received the same general physical activity recommendations as EX at discharge and were contacted on three occasions during the 12 weeks to encourage them to follow these recommendations and to give them the opportunity to ask any questions connected to recovery and physical activity.
Statistical analysis
Data are presented as median (min‐max) or as percent. Normality was assessed with Shapiro–Wilk's test. Statistical significance was tested two‐sidedly, and a P‐value ≤0·05 was considered statistically significant. For analyses, SPSS 23.0.0.2 (SPSS Inc., Chicago, IL, USA) was used. Differences between EX and CON were tested with Mann–Whitney U‐test (ordinal and continuous data) or chi‐square test (use of beta‐blockers).
Differences over time were tested using Friedman's ANOVA, McNemar's test or Cochrane Q test. When statistical significance was observed, post hoc comparisons were performed with Wilcoxon signed‐rank test.
Reproducibility
Interobserver variability and intra‐observer variability were tested in 24 randomly selected measurements by using the S‐method (Dahlberg, 1948) and presented as the coefficient of variation (%COV). Intra‐observer variability was assessed with a minimum of two months between measurements. Interobserver variability was tested against a second, experienced observer.
Results
Data quality and reproducibility
Measurements at peak exercise were unavailable at the second follow‐up in two patients (1 EX/1 CON) due to suspected mask leakage in one case and to a prematurely halted exercise test following a small drop in systolic blood pressure in another. All submaximal exercise measurements were available for analysis. Interobserver variability and intra‐observer variability were low for all tested variables (Table 1).
Table 1.
Intra‐observer variability and interobserver variability
| Median observer 1 | Median observer 2 | Intra‐observer COV (%) | Interobserver COV (%) | |
|---|---|---|---|---|
| VE/VCO2 slope A | 26·3 | 25·8 | 3·64 | 2·86 |
| VE/VCO2 slope B | 29·2 | 28·7 | 0 | 1·21 |
| Tau (s) | 53 | 54 | 2·26 | 1·79 |
| VO2@VT (ml) | 1657 | 1601 | 1·80 | 3·39 |
COV, coefficient of variation; for other abbreviations, see Table 3.
Patient characteristics
Twelve patients were recruited and randomized to either EX (n = 6) or CON (n = 6). All patients were discharged after standard post‐operative early mobilization and rehabilitation, with recommendations of gradually increasing physical activity for the first six post‐operative weeks. The observed post‐operative complications were three cases of re‐operation (all in CON) due to post‐operative bleeding within the first day after surgery. No haemodynamically significant post‐operative pericardial effusion was detected with echocardiography in any patient, and no one needed a pacemaker postoperatively. All patients completed the study protocol with no loss to follow‐up, and every patient in EX had completed 36 training sessions at 12 weeks.
Baseline characteristics were comparable between groups and are presented in Table 2. Patients in CON showed an increase in weight (+7%, P = 0·031) and consequently an increase in BSA (+3%, P = 0·031) between baseline and the second follow‐up. No significant change in weight occurred in EX.
Table 2.
Patient characteristics at baseline
| EX n = 6 | CON n = 6 | All patients n = 12 | P‐valuea | |
|---|---|---|---|---|
| Gender (male/female) | 5/1 | 4/2 | 9/3 | 0·375 |
| Age (years) | 58·5 (39–75) | 65·5 (60–71) | 62·5 (39–75) | 0·186 |
| Length (cm) | 187 (159–189) | 170 (164–183) | 178 (159–189) | 0·069 |
| Weight (kg) | 92·5 (70–109) | 73 (56–100) | 80·6 (56–109) | 0·167 |
| BSA (m2) | 2·19 (1·90–2·42) | 1·88 (1·61–2·28) | 1·94 (1·61–2·42) | 0·084 |
| HR at rest (beat min−1) | 79 (50–93) | 64 (48–91) | 73 (48–93) | 0·457 |
| SBP at rest (mmHg) | 130 (110–145) | 140 (110–170) | 140 (110–170) | 0·615 |
| DBP at rest (mmHg) | 70 (60–90) | 80 (70–95) | 70 (60–95) | 0·089 |
| Hb (g l−1) | 130 (125–138) | 128 (113–137) | 130 (113–138) | 0·699 |
BSA, body surface area; DBP, diastolic blood pressure; Hb, haemoglobin; HR, heart rate; SBP, systolic blood pressure.
Nonparametric comparison between EX and CON.
At baseline, 11 patients (6 EX/5 CON) regularly used beta‐blockers. At the first and second follow‐ups, nine (4 EX/5 CON) and five (2 EX/3 CON) patients, respectively, were still on beta‐blockers. For all participants, there was a decrease in the usage of beta‐blockers over time (P = 0·025), but when analysed group by group, no significant differences were found between the number of patients using beta‐blockers between CPETs for either EX (P = 1·000) or CON (P = 1·000).
Cardiopulmonary exercise testing
Cardiopulmonary exercise test data are presented in Table 3. Although the median peakVO2, percentage of predicted peakVO2 and the peak workload were lower in CON at baseline, statistical analysis showed no significant difference (P = 0·699, P = 0·59 and P = 0·065, respectively) compared to EX. There was no difference in the peak respiratory exchange ratio (RER) between the CPETs. The single lowest observed peak RER‐value in EX and CON at any CPET was 1·06 and 1·04, respectively, indicating that every CPET was driven beyond the ventilatory threshold. There were no statistically significant differences in CON in any maximal or submaximal CPET variable.
Table 3.
Cardiopulmonary exercise test at baseline and at 12‐week and 12‐month follow‐ups
| Supervised exercise training, EX (n = 6) | Control group, CON (n = 6) | |||||||
|---|---|---|---|---|---|---|---|---|
| Baseline | First follow‐up | Second follow‐up | P‐value | Baseline | First follow‐up | Second follow‐up | P‐value | |
| Peak load (Watt) | 171 (93–290) | 219 (114–336) | 180 (110–322) | 0·008 a | 132 (78–164) | 150 (106–207) | 141 (113–189) | 0·052 |
| PeakVO2 (ml min−1) | 1911 (1358–3304) | 2356 (1589–3670) | 2184 (1689–3823) | 0·008 a | 1465 (1098–2216) | 1717 (1369–2278) | 1587 (1316–2203) | 0·124 |
| PeakVO2 (ml min−1 kg−1) | 22 (17–35) | 26 (19–39) | 26 (20–40) | 0·008 a | 20 (15–27) | 25 (19–28) | 23 (20–29) | 0·124 |
| PeakVO2% of predicted | 88 (63–111) | 104 (84–123) | 108 (79–129) | 0·008 a | 77 (73–114) | 92 (80–117) | 101 (94–114) | 0·124 |
| VO2@VT (ml O2 min −1) | 1473 (989–2420) | 1555 (1381–2300) | 1691 (1331–2473) | 0·228 | 1014 (848–1574) | 1228 (1038–1741) | 1143 (955–1561) | 0·387 |
| VE/VCO2 slope A | 27·5 (25·9–28·8) | 25·5 (23·2–31·3) | 25·7 (24·1–25·8) | 0·194 | 27·5 (25·3–32·5) | 26·5 (22·6–28·2) | 26·9 (23·3–29·9) | 0·367 |
| VE/VCO2 slope B | 28·5 (25·5–35·6) | 27·6 (26·1–31·4) | 27·7 (24·5–32·5) | 0·956 | 29·9 (26·8–36·8) | 29·3 (25·4–33·3) | 29·3 (26·6–31) | 0·954 |
| Tau (s) | 57 (35–66) | 41 (35–62) | 48 (39–59) | 0·691 | 58 (36–73) | 52 (40–65) | 46 (44–75) | 0·194 |
| OUES (ml min−1) | 2534 (1297–3565) | 2793 (2074–3678) | 2741 (1764–4207) | 0·124 | 1474 (1147–2607) | 1856 (1529–2497) | 1932 (1210–2372) | 0·582 |
| OUES/BSA | 1104 (684–1595) | 1317 (1051–1548) | 1251 (888–1885) | 0·124 | 774 (610–1325) | 1000 (858–1269) | 978 (730–1177) | 0·691 |
| OUES % of predicted | 77 (62–97) | 93 (85–97) | 91 (80–115) | 0·124 | 60 (51–94) | 77 (63–101) | 75 (64–95) | 0·691 |
OUES, oxygen uptake efficiency slope; Tau, time constant; VO2, oxygen uptake; VE, ventilation; VCO2, carbon dioxide elimination; VO2@VT, oxygen uptake at ventilatory threshold.
Post hoc testing, P≤0·05 baseline to first follow‐up. There was no statistically significant difference between baseline and second follow‐up for any parameter. Bold styling denotes statistical significance with repeated measurements using Friedman's ANOVA. Values presented as median (min–max).
Patients in EX reached a higher maximal workload at the first follow‐up than at baseline (+28%, P = 0·031), as well as a higher peakVO2 (+23%, P = 0·031) and weight‐indexed peakVO2 (+18%, P = 0·031). Accordingly, the median percentage of predicted peakVO2 significantly increased from baseline (88%) to the first follow‐up (104%), P = 0·031. Both peakVO2 (+14%, P = 0·063) and weight‐indexed peakVO2 (+18%, P = 0·063) showed a non‐statistically significant trend of being higher at the second follow‐up than at baseline. How each patient performed in relation to the individual predicted peakVO2 is presented in Figure 2.
Figure 2.
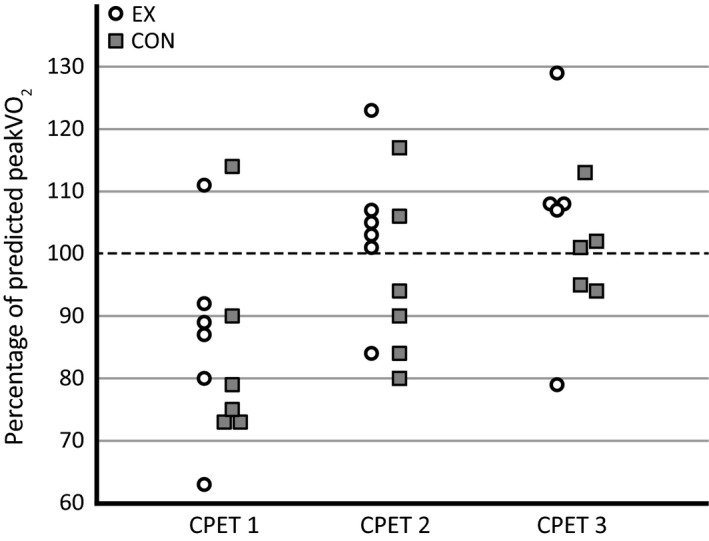
Measured peak oxygen uptake (peakVO 2) of patients in relation to predicted peakVO 2 in supervised exercise training (EX) and control (CON) groups. Predicted peakVO 2 based upon reference equations from Gläser et al. (2010).
Although VO2@VT was higher at both follow‐up measurements than at baseline in EX (+6% at first follow‐up and +15% at second follow‐up), no statistically significant difference could be found between CPETs (P = 0·228). For other variables measured at submaximal exercise, no statistically significant differences were found between CPETs.
VE/VCO2 slope calculations
In all but one case, the value of slope B was higher than that of slope A, indicating that the respiratory compensation point was surpassed. The median difference between slope A and slope B at baseline for all patients was 1·6 (P = 0·002), at the first follow‐up 2·4 (P<0·001) and at the second follow‐up 2·6 (P = 0·004). No statistically significant difference was seen over time in any group or in all patients, in either slope A or slope B. A total of five slope values were not measurable (slope A: 4, slope B: 1). Out of the remaining 67 slope values (12 patients, three CPETs, two methods), three abnormal values (i.e. >30) were found with slope A (in three patients) and 11 with slope B (in six patients).
Discussion
This study sought to explore the effect of supervised exercise training following AVR for AS, in regard to both maximal and submaximal cardiopulmonary variables. We found that peakVO2 as well as peak load increased significantly with supervised exercise training, indicating improved exercise capacity at the end of the intervention. No further increase was seen a year later, and there was no significant change in any submaximal variable in either group.
Peak oxygen uptake
Our finding of increased peakVO2 (+23%, P = 0·031) after a period of exercise training is in concordance with previous studies of exercise being beneficial for exercise capacity after heart valve surgery, regardless of underlying heart valve disease (Pardaens et al., 2014; Sibilitz et al., 2016a) and in patients following coronary artery bypass grafting (Savage et al., 2015). The reported increase in peakVO2 after a period of aerobic exercise training in healthy individuals ranges between 10% and 25% as compared to reported values between 7% and 54% for cardiac patients (Jones & Carter, 2000; Hansen et al., 2005). Jones & Carter (2000) suggest that the discrepancy between studies regarding peakVO2 may arise from differences in the study population, baseline exercise capacity or training intensity and/or duration (Jones & Carter, 2000). When analysing individual peakVO2 values in relation to predicted values from a healthy reference population (Gläser et al., 2010), one patient in EX and four patients in CON did not achieve their predicted peakVO2 at the first follow‐up. This could imply that three months of supervised exercise training promotes post‐operative recovery.
On the other hand, although no statistical differences between CPETs were found in CON, increases in both peakVO2 (+17%, P = 0·124) and peak load (+14%, P = 0·054) were seen between baseline and the first follow‐up. It is thus possible that increases in exercise capacity are part of the normal post‐operative recovery pattern following AVR. In one of the few available studies investigating the effects of exercise after heart valve surgery, a heterogeneous group of patients with a variety of heart valve diseases and surgeries showed similar increases in peakVO2 (+25%) following three months of supervised exercise training as in a control group (Jairath et al., 1995). This, in combination with our finding that both CON and EX achieved predicted peakVO2 at 12 months after surgery, may indicate that participation in supervised exercise rehabilitation may not be necessary to improve peakVO2 following AVR if a progressive increase in activity at home is achieved.
A possible explanation for this general increase could be that patients in CON gradually increased their daily activities and/or exercise, which improved their peakVO2. This study provides no data about the physical activity level of the patients. Further studies, preferably using accelerometry, could provide additional information on physical activity level and its impact on exercise capacity in patients following AVR.
Submaximal cardiopulmonary variables
In addition to peakVO2, we set out to study several submaximal exercise variables in order to detect relevant cardiopulmonary adaptations to exercise. As the effect of exercise training on submaximal variables has not previously been explored in AVR patients, we chose to explore changes in submaximal variables previously proven to be of prognostic value in heart failure patients (Davies et al., 2006; Mezzani et al., 2009) or to change following exercise training in these patients (Mezzani et al., 2013).
Oxygen uptake efficiency slope
There was no statistically significant change in OUES between CPETs in either group. However, there were notable increases in OUES (ml min−1) for both EX (+10%) and CON (+26%) between baseline and the first follow‐up, while median values were similar between the first and second follow‐ups. As both groups showed similar trends, it is possible that the increased OUES reflects a positive effect of the AVR per se on ventilatory efficiency in relation to oxygen uptake. This could theoretically be due to improved perfusion/ventilation matching, decreased myocardial oxygen demand, improved peripheral oxygen kinetics or a combination of factors.
In contrast to the lack of previous reports in AVR patients, OUES has been suggested to increase with exercise training (Van Laethem et al., 2007; Gademan et al., 2008) and has been used to evaluate the progression of exercise capacity in CHF patients (Van Laethem et al., 2007).
VE/VCO2 slope
Ventilatory efficiency, measured as the VE/VCO2 slope, was similar at all CPETs, in both groups. As median VE/VCO2 slope values were within the proposed normal range of 20–30 already as baseline (Mezzani et al., 2009), the possible effects of training‐induced changes are limited. This could be supported by a recent study evaluating exercise capacity following different types of heart valve surgeries, which found a small but statistically significant decrease in the VE/VCO2 slope only for patients in medium or high‐risk groups when stratified according to preoperative risk, and only for combined aortic valve surgery and coronary artery bypass graft surgery as compared to only aortic valve surgery (Pardaens et al., 2014). Furthermore, our results concur with those from another study investigating the effects of 12 weeks of cardiac rehabilitation in patients following heart valve surgery with no significant change in the VE/VCO2 slope in either the intervention or the control group (Sibilitz et al., 2016a). In conclusion, the VE/VCO2 slope does not seem optimal for evaluating the effects of exercise training in AVR patients.
There is still controversy about whether the VE/VCO2 slope should be calculated across the complete exercise data set or only up to the respiratory compensation point (Mezzani et al., 2009). In our study, we applied both methods and could not identify a statistically significant difference in any of the two calculated slope values between CPETs. Calculations based on data only up to the respiratory compensation point (slope A) yielded lower values, as expected. As a consequence, using slope B exceeded the proposed normal range to a higher extent. This underscores the importance of carefully choosing the method of the VE/VCO2 calculation, as this may influence the interpretation of CPET results. Current guidelines (Arena et al., 2007; Balady et al., 2010) recommend cut‐off values based on the slope A‐method. A possible limitation in using slope B is that well‐trained and well‐motivated patients may exert themselves to a higher extent and proceed well over the respiratory compensation point and thus get higher VE/VCO2 slope values, without necessarily having any pathology.
Tau
There was a notable 28% decrease in median tau (s) for EX between baseline and first follow‐up, but without statistical significance between CPETs (P = 0·691). CON showed a 10% decrease between baseline and first follow‐up (P = 0·194). The physiological interpretation of a decreased tau could be that patients had improved their ability to aerobically adapt to a change in metabolic demands, thus more quickly reaching a steady state. A prolongation of tau has been reported in cardiac patients, mainly caused by reduced O2 availability in exercising skeletal muscles (Mezzani et al., 2009), and a 30% longer tau has been observed in CHF patients compared with healthy subjects (Sietsema et al., 1994). Our results are similar to a study investigating training effects on CHF patients that showed a significant decrease in tau from 45 ± 14s to 35 ± 8s (−29%) following three months of exercise training compared with controls (Mezzani et al., 2013). To our best knowledge, our data on tau following AVR are novel.
Limitations
First, the small sample size restricts the possibility of broad generalization of our findings. We found several statistically non‐significant trends of improvement in submaximal variables, and one could speculate that with a larger sample size, they would reach statistical significance. On the other hand, despite the sample size, peakVO2 increased significantly in EX, indicating actual effect.
Secondly, selection bias should always be considered in intervention studies, especially when evaluating exercise training. The low number of patients included in our study could in part be explained by strict exclusion criteria (i.e. comorbidities), which could be considered a selection bias. Possibly, patients used to or interested in exercise training might agree to participate to a higher extent than patients more unfamiliar with training. In addition, supervised exercise training centralized to a single centre may have excluded patients living more remotely. This may be of importance when planning exercise training as part of cardiac rehabilitation in both research and clinical settings. In our study, however, the use of randomization minimized the effect of a possible selection bias between group comparisons.
Finally, our intervention protocol consisted of moderate‐intensity aerobic exercise, and it is possible that higher intensity exercise would have elicited greater differences between groups. However, the use of a progressive exercise protocol, individually tailored based upon baseline peakVO2, was a strength and decreased the risk of peakVO2 attenuation over time.
Conclusion
This randomized controlled trial showed that patients participating in 12 weeks of supervised aerobic exercise training following AVR significantly increased peakVO2, with accompanying trends of improvement in several submaximal variables. In addition, this study provides novel information on a number of submaximal variables in this group of patients.
Conflict of interest
The authors have no conflict of interest.
Acknowledgments
The study was supported by the Medical Research Council of Southeast Sweden (FORSS) and the ALF Grants, Region Östergötland.
References
- Arena R, Myers J, Williams MA, et al Assessment of functional capacity in clinical and research settings: a scientific statement from the American Heart Association committee on exercise, rehabilitation, and prevention of the council on clinical cardiology and the council on cardiovascular n. Circulation (2007); 116: 329–343. [DOI] [PubMed] [Google Scholar]
- Baba R, Nagashima M, Goto M, et al Oxygen uptake efficiency slope: a new index of cardiorespiratory functional reserve derived from the relation between oxygen uptake and minute ventilation during incremental exercise. J Am Coll Cardiol (1996); 28: 1567–1572. [DOI] [PubMed] [Google Scholar]
- Balady GJ, Arena R, Sietsema K, et al Clinician's guide to cardiopulmonary exercise testing in adults: a scientific statement from the American heart association. Circulation (2010); 122: 191–225. [DOI] [PubMed] [Google Scholar]
- Borg GA. Psychophysical bases of perceived exertion. Med Sci Sports Exerc (1982); 14: 377–381. [PubMed] [Google Scholar]
- Buys R, Coeckelberghs E, Vanhees L, et al The oxygen uptake efficiency slope in 1411 Caucasian healthy men and women aged 20–60 years: reference values. Eur J Prev Cardiol (2015); 22: 356–363. [DOI] [PubMed] [Google Scholar]
- Cicoira M, Davos CH, Francis DP, et al Prediction of mortality in chronic heart failure from peak oxygen consumption adjusted for either body weight or lean tissue. J Card Fail (2004); 10: 421–426. [DOI] [PubMed] [Google Scholar]
- Dahlberg G. Errors of estimation In: Statistical Methods for Medical and Biological Students, 2nd edn (ed. Dahlberg G.) (1948), pp. 122–132. Georg Allen & Unwin Ltd, London. [Google Scholar]
- Davies LC, Wensel R, Georgiadou P, et al Enhanced prognostic value from cardiopulmonary exercise testing in chronic heart failure by non‐linear analysis: oxygen uptake efficiency slope. Eur Heart J (2006); 27: 684–690. [DOI] [PubMed] [Google Scholar]
- Gademan MGJ, Swenne CA, Verwey HF, et al Exercise training increases oxygen uptake efficiency slope in chronic heart failure. Eur J Cardiovasc Prev Rehabil (2008); 15: 140–144. [DOI] [PubMed] [Google Scholar]
- Gläser S, Koch B, Ittermann T, et al Influence of age, sex, body size, smoking, and β blockade on key gas exchange exercise parameters in an adult population. Eur J Cardiovasc Prev Rehabil (2010); 17: 469–476. [DOI] [PubMed] [Google Scholar]
- Guazzi M, Arena R, Halle M, et al 2016 focused update: clinical recommendations for cardiopulmonary exercise testing data assessment in specific patient populations. Circulation (2016); 133: e694–e711. [DOI] [PubMed] [Google Scholar]
- Hansen D, Dendale P, Berger J, et al Rehabilitation in cardiac patients: what do we know about training modalities? Sports Med (2005); 35: 1063–1084. [DOI] [PubMed] [Google Scholar]
- Haycock GB, Schwartz GJ, Wisotsky DH. Geometric method for measuring body surface area: a height‐weight formula validated in infants, children, and adults. J Pediatr (1978); 93: 62–66. [DOI] [PubMed] [Google Scholar]
- Hollenberg M, Tager IB. Oxygen uptake efficiency slope: an index of exercise performance and cardiopulmonary reserve requiring only submaximal exercise. J Am Coll Cardiol (2000); 36: 194–201. [DOI] [PubMed] [Google Scholar]
- Jairath N, Salerno T, Chapman J, et al The effect of moderate exercise training on oxygen uptake post‐aortic/mitral valve surgery. J Cardiopulm Rehabil Prev (1995); 15: 424–430. [DOI] [PubMed] [Google Scholar]
- Jones AM, Carter H. The effect of endurance training on parameters of aerobic fitness. Sports Med (2000); 29: 373–386. [DOI] [PubMed] [Google Scholar]
- Jones AM, Poole DC. Oxygen uptake dynamics: from muscle to mouth ‐ An introduction to the symposium. Med Sci Sports Exerc (2005); 37: 1542–1550. [DOI] [PubMed] [Google Scholar]
- Kunutsor SK, Kurl S, Khan H, et al Associations of cardiovascular and all‐cause mortality events with oxygen uptake at ventilatory threshold. Int J Cardiol (2017); 236: 444–450. [DOI] [PubMed] [Google Scholar]
- Laukkanen JA, Kurl S, Riitta S, et al The predictive value of cardiorespiratory fitness for cardiovascular events in men with various risk profiles: a prospective population‐based cohort study. Eur Heart J (2004); 25: 1428–1437. [DOI] [PubMed] [Google Scholar]
- Mezzani A, Agostoni P, Cohen‐Solal A, et al Standards for the use of cardiopulmonary exercise testing for the functional evaluation of cardiac patients: a report from the Exercise Physiology Section of the European Association for Cardiovascular Prevention and Rehabilitation. Eur J Cardiovasc Prev Rehabil (2009); 16: 249–267. [DOI] [PubMed] [Google Scholar]
- Mezzani A, Grassi B, Jones AM, et al Speeding of pulmonary VO2 on‐kinetics by light‐to‐moderate‐ intensity aerobic exercise training in chronic heart failure: clinical and pathophysiological correlates. Int J Cardiol (2013); 167: 2189–2195. [DOI] [PubMed] [Google Scholar]
- Pardaens S, Moerman V, Willems AM, et al Impact of the preoperative risk and the type of surgery on exercise capacity and training after valvular surgery. Am J Cardiol (2014); 113: 1383–1389. [DOI] [PubMed] [Google Scholar]
- Piepoli MF, Corrà U, Benzer W, et al Secondary prevention through cardiac rehabilitation: from knowledge to implementation. A position paper from the cardiac rehabilitation section of the European association of cardiovascular prevention and rehabilitation. Eur J Cardiovasc Prev Rehabil (2010); 17: 1–17. [DOI] [PubMed] [Google Scholar]
- Ribeiro GS, Melo RD, Deresz LF, et al Cardiac rehabilitation programme after transcatheter aortic valve implantation versus surgical aortic valve replacement: systematic review and meta‐analysis. Eur J Prev Cardiol (2017); 24: 688–697. [DOI] [PubMed] [Google Scholar]
- Savage P, Rengo J, Menzies K, et al Cardiac rehabilitation after heart valve surgery: comparison with coronary artery bypass graft patients. J Cardiopulm Rehabil Prev (2015); 35: 231–237. [DOI] [PMC free article] [PubMed] [Google Scholar]
- Sibilitz KL, Berg SK, Rasmussen TB, et al Cardiac rehabilitation increases physical capacity but not mental health after heart valve surgery: a randomised clinical trial. Heart (2016a); 102: 1995–2003. [DOI] [PubMed] [Google Scholar]
- Sibilitz KL, Berg SK, Tang L, et al Exercise‐based cardiac rehabilitation for adults after heart valve surgery. Cochrane Database Syst Rev (2016b); 2016: CD010876. [DOI] [PubMed] [Google Scholar]
- Sietsema KE, Ben‐Dov I, Yu Zhang Y, et al Dynamics of oxygen uptake for submaximal exercise and recovery in patients with chronic heart failure. Chest (1994); 105: 1693–1700. [DOI] [PubMed] [Google Scholar]
- Van Laethem C, Bartunek J, Goethals M, et al Oxygen uptake efficiency slope, a new submaximal parameter in evaluating exercise capacity in chronic heart failure patients. Am Heart J (2005); 149: 175–180. [DOI] [PubMed] [Google Scholar]
- Van Laethem C, Van De Veire N, De Backer G, et al Response of the oxygen uptake efficiency slope to exercise training in patients with chronic heart failure. Eur J Heart Fail (2007); 9: 625–629. [DOI] [PubMed] [Google Scholar]
- Vanhees L, Fagard R, Thijs L, et al Prognostic value of training‐induced change in peak exercise capacity in patients with myocardial infarcts and patients with coronary bypass surgery. Am J Cardiol (1995); 76: 1014–1019. [DOI] [PubMed] [Google Scholar]
- Zhao Y, Henein MY, Mor̈ner S, et al Residual compromised myocardial contractile reserve after valve replacement for aortic stenosis. Eur Heart J Cardiovasc Imaging (2012); 13: 353–360. [DOI] [PubMed] [Google Scholar]