

ABSTRACT
Background
Low serum total 25-hydroxyvitamin D3 [25(OH)D3] concentrations have been associated with cognitive impairment. However, it is unclear if serum 25(OH)D3 concentrations are a valid indicator of the concentrations of vitamin D and its metabolites in human brain.
Objectives
The aim of this study was to develop and validate a method to quantify vitamin D3, 25(OH)D3, and 1,25-dihydroxyvitamin D3 [1,25(OH)2D3] in human brain.
Methods
The assay developments were performed using porcine brains. Liquid extraction was used in homogenized samples (∼0.1 g each) prior to analysis by LC-MS/MS with electrospray ionization following derivatization with 4-phenyl-1,2,4-triazoline-3,5-dione. This method was then applied to the determination of vitamin D and its metabolites in a whole human brain obtained from the National Development and Research Institutes.
Results
The method showed good linearity of vitamin D3, 25(OH)D3, and 1,25(OH)2D3 over the physiological range (R2 = 0.9995, 0.9968, and 0.9970, respectively). The lowest detection limit for vitamin D3, 25(OH)D3, and 1,25(OH)2D3 in porcine brain was 25, 50 and 25 pg/g, respectively. The method was successfully applied to the determination of vitamin D3 and its metabolites in the prefrontal cortex, middle frontal cortex, middle temporal cortex, cerebellum, corpus callosum, medulla, and pons of a human brain. All analyzed human brain regions contained 25(OH)D3, with corpus callosum containing 334 pg/g compared with 158 pg/g in cerebellum. 1,25(OH)2D3 was only detected in prefrontal and middle frontal cortices at a very low level. No vitamin D3 was detected in any examined areas of this single human brain.
Conclusions
To the best of our knowledge, this study is the first report of the measurement of concentrations of vitamin D metabolites in human brain. This validated method can be applied to postmortem studies to obtain accurate information about the presence and role of vitamin D and its metabolites in human brain and neurodegenerative diseases.
Keywords: vitamin D, brain, metabolites, quadrupole ion trap, dementia
Introduction
Serum total 25-hydroxyvitamin D3 [25(OH)D3] is the major form of vitamin D in circulation, and this measure is widely used as a biomarker of vitamin D status (1). Approximately two-thirds of the US population has vitamin D insufficiency, as defined by serum 25(OH)D3 levels ≤75 nmol/L (equivalent to <30 ng/mL) (2). Low serum total 25(OH)D3 levels have been associated with cognitive impairment (3, 4) and Alzheimer's disease (5, 6) in both cross-sectional and longitudinal analyses. However, the total 25(OH)D3 level in cerebrospinal fluid was not associated with neurologic diseases in the Korean population (7). For this reason, it is unclear whether relying on serum total 25(OH)D3 levels is a valid or optimal indicator of vitamin D status and function in the brain. It has been demonstrated in a rat model that serum and brain 25(OH)D3 levels are correlated (8). However, it is not known which forms of vitamin D are in the human brain. This gap in knowledge limits the ability to interpret the studies that correlate low circulating forms of 25(OH)D3 and onset of cognitive impairment.
Unlike the advances in measurement of serum 25(OH)D3 (9–11), the pace of developing and standardizing assays for measurement of vitamin D and its metabolites in tissues has lagged behind. Most existing detection methods for vitamin D and its metabolites in plasma or tissues have utilized LC-MS/MS, with ionization methods ranging from electrospray ionization (ESI) (8) to atmospheric pressure photoionization (12, 13) and atmospheric pressure chemical ionization (14). There is also variability in solvent extraction methods, including acetonitrile (8), acetone (12, 14), immunoaffinity extraction (15), and dichloromethane: methanol mixture (DCM: MeOH) (13, 16). Derivatization methods have been developed to augment the ionization efficiency of vitamin D3 and its metabolites in order to enhance detection (8, 11, 14). Despite these developments, most available assays have only been optimized for a single analyte. In contrast, simultaneous quantitation of vitamin D3, 25(OH)D3, and 1,25-dihydroxyvitamin D3 [1,25(OH)2D3] in a single extraction from human brain with minimal tissue required has proven difficult.
The objective of this study was to develop and validate a method to quantify vitamin D and its metabolites in human brain. The availability of this assay will enable research into the potential relationship between plasma vitamin D status and cognitive function, including potential linkages to Alzheimer's disease.
Methods
Chemicals, regents, and standards
Solvents used for sample extraction and chromatography were ultra-HPLC grade. Vitamin D3 (VD3) and vitamin D3-[23,24,25,26,27–13C5] [13C-VD3 as internal standard (IS)], 25-hydroxyvitamin D3 and 25-hydroxyvitamin D3-[23,24,25,26,27–13C5] [13C-25(OH)D3 as IS], and 1,25-dihydroxyvitamin D3 and 1,25-dihydroxyvitamin D3-[d6] [d6–1,25(OH)2D3 as IS] were purchased from IsoScience. The calibration standards were prepared at a concentration of 10 ng/mL in methanol. All the stock solutions and working standards were stored at −80°C. 4-Phenyl-1,2,4-triazoline-3,5-dione (PTAD; 0.25 mg/mL) in acetonitrile was used for derivatization.
Samples and clinical application
The validation experiments were performed using commercially obtained porcine brain (Pel-Freez Biologicals). The porcine brain was manually homogenized using mortar and pestle under liquid nitrogen, aliquoted, and stored at −80°C.
This method was used to characterize vitamin D and its metabolites in a whole human brain obtained from a 54-y-old woman donor through the National Development and Research Institutes. The fresh brain was collected and shipped to the Jean Mayer US Department of Agriculture Human Nutrition Research Center on Aging at Tufts University within 24 h after death. The brain was dissected into 8 different anatomical sections (cerebellum, medulla, pons, hypothalamus, prefrontal cortex, corpus callosum, middle frontal cortex, and middle temporal cortex) by a trained neuroscientist (TZ) and stored at −80°C until analysis. A single measure from each region was obtained. To verify that all 3 metabolites could be measured in human brain, this method was also applied to the prefrontal cortex of 1 postmortem brain sample (91-y-old man) obtained from a participant in the Rush Memory and Aging Project (MAP) (17) for measuring vitamin D and its metabolites.
This study was approved by the Institutional Review Board at Tufts University. The parent study (MAP) was approved by the Institutional Review Board of Rush University Medical Center.
Preparation of brain samples
Brain tissues were weighted to 0.1 g and 0.5 mL of DCM:MeOH (1:1, vol:vol) was added prior to homogenization using a benchtop PowerGen 125 Fisher Scientific homogenizer. The extraction procedure used was a modification of steps used to extract vitamin D3 from mouse brain (12). Twenty microliters of IS solution [containing 250 ng/mL 13C-25(OH)D3, 250 ng/mL d6–1,25(OH)2D3, and 500 ng/mL 13C-VD3 in methanol) and 0.5 mL DCM:MeOH (1:1, vol:vol) were added to the homogenized samples. After vortexing for 5 min, the samples were centrifuged at 4°C for 5 min at 13,200 rpm. The supernatant was then transferred to a glass tube. 0.5 mL methylene chloride:methanol mixture was added to resuspend the pellet, and the previous step was repeated. The supernatants were pooled together and subsequently dried under nitrogen gas (Organomation Multivap Nitrogen Evaporator) with heat (60°C). For derivatization, 200 μL of PTAD solution (0.25 mg/mL in acetonitrile) was added to the residue, followed by 10 s of vortex, and the samples were subsequently stored in a dark place (room temperature) for 1 h. The calibration standards and samples were dried under nitrogen gas again and then reconstituted in 100 µL of mobile phase (water:methanol: 1:1 vol: vol) with 20 mM methylamine and 0.1% formic acid, then centrifuged (at 13,200 rpm for 5 min), and the supernatants were pipetted into a vial with a glass insert before analysis.
Quadrupole ion trap instrumentation and conditions
The LC-MS/MS system included an Agilent series 1290 LC instrument (Agilent Technologies) coupled to a tandem quadrupole Sciex 5500 quadrupole ion trap (QTRAP) MS system. The chromatographic separation column was a C18 analytical column (Waters Cortecs; 2.7 μm, 50 mm × 2.0 mm). The injection volume was 20 μL. Mobile phase A was 4 mM methylamine in water with 0.1% formic acid, and mobile phase B was 4 mM methylamine in methanol with 0.1% formic acid. The gradient program operated with a flow of 0.1 mL/min: 0–2 min, 50% B; 2–4 min, gradient from 50% B to 100% B; 4–25 min, 100% B.
MSD (5500 QTRAP MS system) settings were as follows: ion source, positive ESI; temperature, 450°C; ion source gas 1: 50 psi; gas 2: 50 psi; curtain gas: 20 psi; collision gas: medium; ion spray voltage, 5500 V; declustering potential: 55 V; entrance potential: 4 V; collision energy: 20 V; collision cell exit potential: 10 V. The multiple reaction monitoring (MRM) transitions used are shown in Table 1. Data were collected using Analyst software.
TABLE 1.
MRM transitions used1
| Vitamin D | MW (mol) | MRM transition (m/z) |
|---|---|---|
| Cholecalciferol | ||
| VD3 | 384.64 | 591.2/298.1 |
| 13C-VD3 (IS) | 389.60 | 596.2/298.1 |
| Calcifediol | ||
| 25(OH)D3 | 400.65 | 607.2/298.1 |
| 13C-25(OH)2D3 (IS) | 405.59 | 612.2/298.1 |
| Calcitriol | ||
| 1,25(OH)2D3 | 416.64 | 623.4/314.1 |
| d6–1,25(OH)2D3 (IS) | 422.67 | 629.4/314.1 |
IS, internal standard; MRM, multiple reaction monitoring; MW, molecular weight; VD3, vitamin D3; 25(OH)D3, 25-hydroxyvitamin D3; 1,25(OH)2D3, 1,25-dihydroxyvitamin D3.
Validation experiments
Linearity was determined for vitamin D and its metabolites following serial dilution of a calibration standard to concentrations ranging from 5000 to 10 pg/mL. Regression coefficients were determined for each compound separately using linear regression.
The limit of detection (LOD) for vitamin D and its metabolites was determined by spiking porcine brain with serially diluted vitamin D standards (Table 2). The LOD was defined as the lowest analyte concentration statistically different from 0 with a relative SD (RSD) of ≤20% over triplicate measurements.
TABLE 2.
Detection limits and intra-assay, inter-assay, and recovery variability of QTRAP assay for vitamin D3, 25(OH)D3, and 1,25(OH)2D31
| Validation | VD3 | 25(OH)D3 | 1,25(OH)2D3 |
|---|---|---|---|
| LOD, pg/g | 25 | 50 | 25 |
| Recovery (n = 6), % | 99.5 | 99.4 | 104.3 |
| Interday precision RSD (n = 6), % | 9.0 | 6.9 | 10.7 |
| Intraday precision RSD (n = 6), % | 5 | 4.5 | 4.5 |
LOD, limit of detection; QTRAP, quadrupole ion trap; RSD, relative SD; VD3, vitamin D3; 25(OH)D3, 25-hydroxyvitamin D3; 1,25(OH)2D3, 1,25-dihydroxyvitamin D3.
Both intra-assay and inter-assay variability were determined for vitamin D3, 25(OH)D3, and 1,25(OH)2D3 in spiked porcine brain (n = 12). The precision was determined based on the coefficient of variation of vitamin D3, 25(OH)D3, and 1,25(OH)2D3 concentration in the samples spiked before extraction and purification. The inter-assay variability was determined by repeating the same procedure on 4 consecutive days.
Quantification
The response factor (RF) of the vitamin D3 was calculated by dividing the vitamin D3 peak area by the IS (13C-VD3) peak area, followed by multiplying by the amount of IS. Similarly, the RF of the vitamin D3 in samples was calculated by dividing the vitamin D3 peak area by the IS peak area, followed by multiplying by the amount of IS added. The quantification was obtained by dividing the sample RF by the standard RF and then multiplying by the total amount of vitamin D3 standard and the dilution factor. We applied the same quantification method for 25(OH)D3 and 1,25(OH)2D3 as well.
Statistical analysis
Linearity, slope, and regression coefficients were determined by linear regression. Student's paired t test was used for determination of LOD. All statistical analyses were performed using Microsoft Excel 2010. Results were considered statistically significant if the observed significance value was P < 0.05.
Results and Discussion
Optimization of extraction conditions
Lipids account for ∼60% of the brain's dry weight, and the composition of these lipids is very complex (15), so extraction of vitamin D3 and its metabolites from brain is challenging. Liquid–liquid extraction, solid-phase extraction, and lipase have been utilized for extraction of vitamin D or its metabolites in different matrices (8, 12, 18). Acetonitrile, DCM:MeOH (1:1, vol:vol), hexane, and acetone were compared to determine the best extraction solution. The DCM:MeOH (1:1, vol:vol) extraction method obtained the highest recovery for all 3 compounds. Furthermore, different concentrations of PTAD (0.1, 0.25, 0.5, 1.0, and 2.0 mg/mL) were also tested. PTAD at a concentration of 0.25 mg/mL was chosen for the maximum yield. This method required only 1 h of PTAD derivatization, which significantly decreased the sample preparation time, in contrast to an overnight step reported in prior studies (8).
The method showed good linearity of vitamin D3, 25(OH)D3, and 1,25(OH)2D3 over the physiological range (R2 = 0.9995, 0.9968, and 0.9970, respectively) (Figure 1).
FIGURE 1.
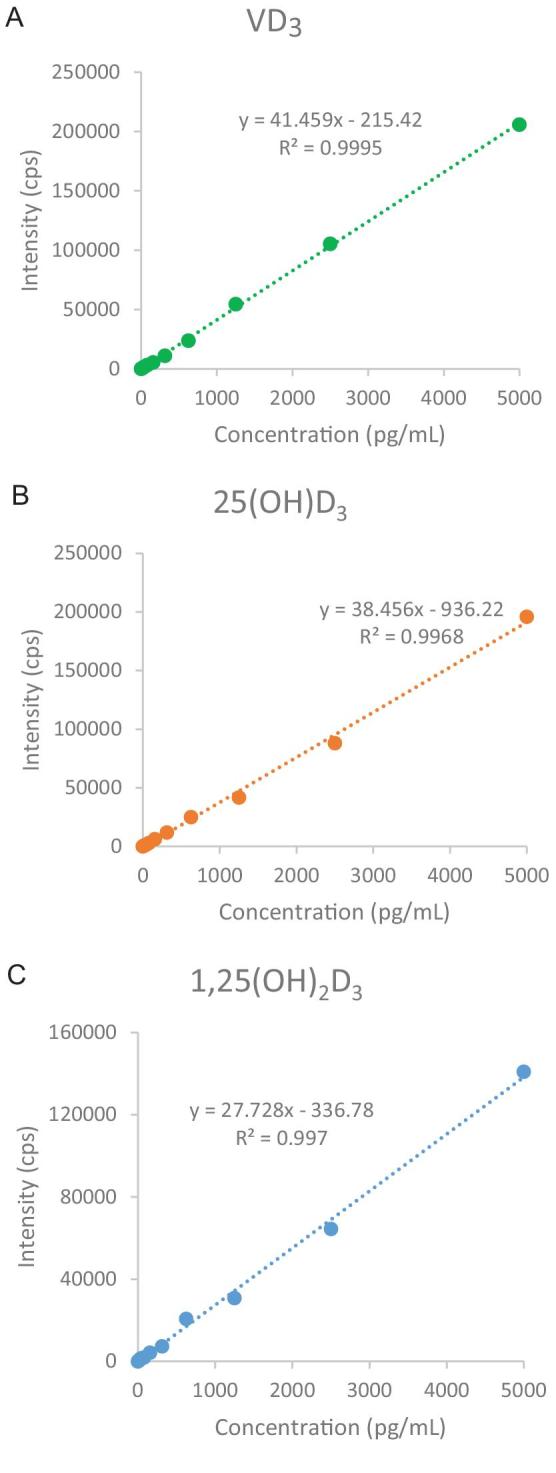
Linearity of vitamin D3, 25(OH)D3, and 1,25(OH)2D3 by UHPLC-QTRAP. QTRAP, quadrupole ion trap; UHPLC, ultra-HPLC; VD3, vitamin D3; 25(OH)D3, 25-hydroxyvitamin D3; 1,25(OH)2D3, 1,25-dihydroxyvitamin D3.
The LOD of vitamin D3 was 25 pg/g (Table 2). Compared with the few published methods measuring vitamin D3 in tissues (19–21), our method has a significant improvement of the LOD for vitamin D3. Jakobsen et al. (21) reported that the LOD of vitamin D3 was 30 ng/100 g for 50 g of meat sample by LC. Notably, a very small amount of sample was used in our experiments, whereas a high sensitivity was achieved. Usually, samples of up to 50 g are required to extract vitamin D3 in food or meat (21, 22). Because our method only required 0.1 g samples, it is well suited for analysis of vitamin D3 in small quantities of animal or human tissue. Blum et al. (23) reported a method to measure vitamin D3 in fat tissue using small quantities (0.2–0.25 g) of sample. The LOD of 25(OH)D3 and that of 1,25(OH)2D3 were 50 and 25 pg/g, respectively. Our method has much higher sensitivity for 25(OH)D3 in tissue samples compared with other methods (8, 18). There was only 1 method published for measuring 1,25(OH)2D3 in mouse brain (12). However, the limit of quantitation was 1000 pg/g in mouse brain, which is 20 times lower sensitivity than that of the current method.
Precision
The validation data are shown in Table 2. Precision was investigated using homogenized porcine brains. Intraday precision of vitamin D3, 25(OH)D3, and 1,25(OH)2D3 was characterized by an RSD of 5.0%, 4.5%, and 4.5%, respectively; interday precision was characterized by an RSD of 9.0%, 6.9%, and 10.7%, respectively.
Application to human brain
The method was successfully applied to the determination of vitamin D3 and its metabolites in the human brain (Table 3). No vitamin D3 was detected in any examined area of this single human brain. All analyzed human brain regions contained 25(OH)D3, with corpus callosum containing 334 pg/g compared with 158 pg/g in cerebellum. 1,25(OH)2D3 was detected only in prefrontal and middle frontal cortex, and at these sites, it was present at low levels of 30 and 35 pg/g, respectively. Figure 2 shows the representative MRM chromatograms for 1,25(OH)2D3–PTAD, d6–1,25(OH)2D3–PTAD, 25(OH)D3–PTAD, 13C-25(OH)D3–PTAD, vitamin D3–PTAD, and 13C-vitamin D3–PTAD (F) of prefrontal cortex of the 1 human brain obtained from the National Development and Research Institutes. 25(OH)D3–PTAD showed 2 peaks, which are 2 epimers. Recent studies using derivatization with a Cookson-type regent showed 6S and 6R epimers because the derivatization regents reacted with s-cis-diene moiety from both the α and β sides (8, 13). In this case, both of the peaks were integrated for quantification. This is the first report of low 1,25(OH)2D3 concentrations in human brain. The previous study did not report 1,25(OH)2D3 concentrations in mouse brain because the method was unable to detect it. This supports the need for an assay that can measure vitamin D metabolites with much lower limits of quantitation.
TABLE 3.
Vitamin D3 and its metabolite concentrations in 8 sections of 1 human brain as determined by QTRAP1
| Brian region | VD3 (pg/g) | 25(OH)D3 (pg/g) | 1,25(OH)2D3 (pg/g) |
|---|---|---|---|
| Corpus callosum | ND | 334 | ND |
| Hypothalamus | ND | 332 | ND |
| Middle temporal cortex | ND | 275 | ND |
| Medulla | ND | 265 | ND |
| Pons | ND | 250 | ND |
| Middle frontal cortex | ND | 238 | 35 |
| Prefrontal cortex | ND | 233 | 30 |
| Cerebellum | ND | 158 | ND |
LOD: VD3, 25 pg/g; 25(OH)D3, 50 pg/g; 1,25(OH)2D3, 25 pg/g. LOD, limit of detection; ND, nondetectable; QTRAP, quadrupole ion trap; 25(OH)D3, 25-hydroxyvitamin D3; 1,25(OH)2D3, 1,25-dihydroxyvitamin D3.
FIGURE 2.

The representative MRM chromatograms for 1,25(OH)2D3–PTAD (A), d6–1,25(OH)2D3–PTAD (B), 25(OH)D3–PTAD (C), 13C-25(OH)D3–PTAD (D), vitamin D3–PTAD (E), and 13C-vitamin D3–PTAD (F) of prefrontal cortex of the 1 human brain obtained from the National Development and Research Institutes. MRM, multiple reaction monitoring; PTAD, 4-phenyl-1,2,4-triazoline-3,5-dione; VD3, vitamin D3; 25(OH)D3, 25-hydroxyvitamin D3; 1,25(OH)2D3, 1,25-dihydroxyvitamin D3.
This method was also applied to the prefrontal cortex of a postmortem brain sample obtained from a participant in the Rush Memory and Aging Project (17). The representative MRM chromatograms of vitamin D and its metabolites are shown in Figure 3. Vitamin D3, 25(OH)D3, and 1,25(OH)2D3 were all detected in prefrontal cortex of this human brain. This demonstrated there is significant variability in the concentrations of vitamin D metabolites in human brain samples.
FIGURE 3.

The representative MRM chromatograms for 1,25(OH)2D3–PTAD (A), d6–1,25(OH)2D3–PTAD (B), 25(OH)D3–PTAD (C), 13C-25(OH)D3–PTAD (D), vitamin D3–PTAD (E), and 13C-vitamin D3–PTAD (F) of prefrontal cortex of a postmortem brain sample obtained from a participant (91-y–old man) in the Rush Memory and Aging Project. MRM, multiple reaction monitoring; PTAD, 4-phenyl-1,2,4-triazoline-3,5-dione; VD3, vitamin D3; 25(OH)D3, 25-hydroxyvitamin D3; 1,25(OH)2D3, 1,25-dihydroxyvitamin D3.
In conclusion, to the best of our knowledge, this study is the first report of the measurement of concentrations of vitamin D metabolites in human brain. This validated method can be applied to postmortem studies to obtain accurate information about the presence and role of vitamin D and metabolites in human brain and neurodegenerative diseases.
Acknowledgments
The authors’ responsibilities were as follows—XF and WBP: conducted the research; XF: analyzed the data; XF, WBP, and SLB; wrote the manuscript; GGD, BD-H, TZ, MCM, TMH, and SLB: reviewed the data, aided in interpretation of results, and reviewed the manuscript; XF: had primary responsibility for final content; and all authors: read and approved the final manuscript.
Notes
This study was supported by the National Institute on Aging (R01 AG051641) and the US Department of Agriculture, Agricultural Research Service, Cooperative Agreement (5819507707).
Authors disclosures: XF, GGD, WBP, BD-H, TZ, MCM, TMH, and SLB, no conflicts of interest.
Abbreviations used: IS, internal standard; LOD, limit of detection; RSD, relative SD; SPE, solid-phase extraction; QTRAP, quadrupole ion trap; PTAD, 4-phenyl-1,2,4-triazoline-3,5-dione; DCM:MeOH, dichloromethane:methanol; ESI, electrospray ionization; MAP, Memory and Aging Project; MRM, multiple reaction monitoring; RF, response factor; 25(OH)D3, 25-hydroxyvitamin D3; 1,25(OH)2D3, 1,25-dihydroxyvitamin D3.
References
- 1. Ross AC, Taylor CL, Yaktine AL, Del Valle HB; Institute of Medicine Committee to Review Dietary Reference Intakes for Vitamin D and Calcium. Dietary reference intakes for calcium and vitamin D. Washington (DC): National Academies Press; 2011. [PubMed] [Google Scholar]
- 2. Ginde AA, Liu MC, Camargo CA Jr.. Demographic differences and trends of vitamin D insufficiency in the US population, 1988–2004. Arch Intern Med 2009;169:626–32. [DOI] [PMC free article] [PubMed] [Google Scholar]
- 3. Annweiler C, Schott AM, Allali G, Bridenbaugh SA, Kressig RW, Allain P, Herrmann FR, Beauchet O. Association of vitamin D deficiency with cognitive impairment in older women: cross-sectional study. Neurology 2010;74:27–32. [DOI] [PubMed] [Google Scholar]
- 4. Slinin Y, Paudel ML, Taylor BC, Fink HA, Ishani A, Canales MT, Yaffe K, Barrett-Connor E, Orwoll ES, Shikany JM et al.. 25-Hydroxyvitamin D levels and cognitive performance and decline in elderly men. Neurology 2010;74:33–41. [DOI] [PMC free article] [PubMed] [Google Scholar]
- 5. Evatt ML, Delong MR, Khazai N, Rosen A, Triche S, Tangpricha V. Prevalence of vitamin D insufficiency in patients with Parkinson disease and Alzheimer disease. Arch Neurol 2008;65:1348–52. [DOI] [PMC free article] [PubMed] [Google Scholar]
- 6. Buell JS, Dawson-Hughes B, Scott TM, Weiner DE, Dallal GE, Qui WQ, Bergethon P, Rosenberg IH, Folstein MF, Patz S et al.. 25-Hydroxyvitamin D, dementia, and cerebrovascular pathology in elders receiving home services. Neurology 2010;74:18–26. [DOI] [PMC free article] [PubMed] [Google Scholar]
- 7. Lee DH, Kim JH, Jung MH, Cho MC. Total 25-hydroxy vitamin D level in cerebrospinal fluid correlates with serum total, bioavailable, and free 25-hydroxy vitamin D levels in Korean population. PLoS One 2019;14:e0213389. [DOI] [PMC free article] [PubMed] [Google Scholar]
- 8. Xue Y, He X, Li HD, Deng Y, Yan M, Cai HL, Tang MM, Dang RL, Jiang P. Simultaneous quantification of 25-hydroxyvitamin D3 and 24,25-dihydroxyvitamin D3 in rats shows strong correlations between serum and brain tissue levels. Int J Endocrinol 2015;2015:296531. [DOI] [PMC free article] [PubMed] [Google Scholar]
- 9. Annema W, Nowak A, von Eckardstein A, Saleh L. Evaluation of the new restandardized Abbott Architect 25-OH vitamin D assay in vitamin D-insufficient and vitamin D-supplemented individuals. J Clin Lab Anal 2018;32:e22328. [DOI] [PMC free article] [PubMed] [Google Scholar]
- 10. Denimal D, Roux S, Duvillard L. Evaluation of the new restandardized 25-hydroxyvitamin D assay on the iSYS platform. Clin Biochem 2018;52:156–60. [DOI] [PubMed] [Google Scholar]
- 11. Wan D, Yang J, Barnych B, Hwang SH, Lee KS, Cui Y, Niu J, Watsky MA, Hammock BD. A new sensitive LC/MS/MS analysis of vitamin D metabolites using a click derivatization reagent, 2-nitrosopyridine. J Lipid Res 2017;58:798–808. [DOI] [PMC free article] [PubMed] [Google Scholar]
- 12. Ahonen L, Maire FB, Savolainen M, Kopra J, Vreeken RJ, Hankemeier T, Myohanen T, Kylli P, Kostiainen R. Analysis of oxysterols and vitamin D metabolites in mouse brain and cell line samples by ultra-high-performance liquid chromatography–atmospheric pressure photoionization–mass spectrometry. J Chromatogr A 2014;1364:214–22. [DOI] [PubMed] [Google Scholar]
- 13. Higashi T, Awada D, Shimada K. Determination of 24,25-dihydroxyvitamin D(3) in human plasma using liquid chromatography–mass spectrometry after derivatization with a Cookson-type reagent. Biomed Chromatogr 2001;15:133–40. [DOI] [PubMed] [Google Scholar]
- 14. Aronov PA, Hall LM, Dettmer K, Stephensen CB, Hammock BD. Metabolic profiling of major vitamin D metabolites using Diels–Alder derivatization and ultra-performance liquid chromatography–tandem mass spectrometry. Anal Bioanal Chem 2008;391:1917–30. [DOI] [PMC free article] [PubMed] [Google Scholar]
- 15. Schmitt S, Castelvetri LC, Simons M. Metabolism and functions of lipids in myelin. Biochim Biophys Acta 2015;1851:999–1005. [DOI] [PubMed] [Google Scholar]
- 16. McDonald JG, Smith DD, Stiles AR, Russell DW. A comprehensive method for extraction and quantitative analysis of sterols and secosteroids from human plasma. J Lipid Res 2012;53:1399–409. [DOI] [PMC free article] [PubMed] [Google Scholar]
- 17. Bennett DA, Schneider JA, Buchman AS, Barnes LL, Boyle PA, Wilson RS. Overview and findings from the Rush Memory and Aging Project. Curr Alzheimer Res 2012;9:646–63. [DOI] [PMC free article] [PubMed] [Google Scholar]
- 18. Piccolo BD, Dolnikowski G, Seyoum E, Thomas AP, Gertz ER, Souza EC, Woodhouse LR, Newman JW, Keim NL, Adams SH et al.. Association between subcutaneous white adipose tissue and serum 25-hydroxyvitamin D in overweight and obese adults. Nutrients 2013;5:3352–66. [DOI] [PMC free article] [PubMed] [Google Scholar]
- 19. Lawson D, Douglas J, Lean M, Sedrani S. Estimation of vitamin D3 and 25-hydroxyvitamin D3 in muscle and adipose tissue of rats and man. Clin Chim Acta 1986;157:175–81. [DOI] [PubMed] [Google Scholar]
- 20. Trenerry VC, Plozza T, Caridi D, Murphy S. The determination of vitamin D3 in bovine milk by liquid chromatography mass spectrometry. Food Chem 2011;125:1314–9. [Google Scholar]
- 21. Jakobsen J, Clausen I, Leth T, Ovesen L. A new method for the determination of vitamin D3 and 25-hydroxyvitamin D3 in meat. J Food Comp Anal 2004;17:777–87. [Google Scholar]
- 22. Huang M, LaLuzerne P, Winters D, Sullivan D. Measurement of vitamin D in foods and nutritional supplements by liquid chromatography/tandem mass spectrometry. J AOAC Int 2009;92:1327–35. [PubMed] [Google Scholar]
- 23. Blum M, Dolnikowski G, Seyoum E, Harris SS, Booth SL, Peterson J, Saltzman E, Dawson-Hughes B. Vitamin D(3) in fat tissue. Endocrine 2008;33:90–4. [DOI] [PMC free article] [PubMed] [Google Scholar]