

Abstract
In 2013, Helicoverpa armigera (Hübner) (Lepidoptera: Noctuidae) was officially declared as present in Brazil and, after two years, the species was detected in the Caribbean and North America. Information on genetic features and accurate distribution of pests is the basis for agricultural protection policies. Furthermore, such knowledge is imperative to develop control strategies, understand the geographical range, and genetic patterns of this species in the Americas. Here, we carried out the widest sampling of H. armigera in the South American continent and Puerto Rico, after we estimated the diversity, demographic parameters, and genetic structure. The Internal Transcribed Spacer 1 (ITS1) nuclear marker was used to investigate the presence of putative hybrids between H. armigera and H. zea, and they were observed at a frequency of 1.5%. An ABC analysis, based in COI gene fragment, suggested Europe as the origin of South America specimens of H. armigeraand following a movement northward through the Caribbean. Three mtDNA genes and three nDNA markers revealed high genetic diversity distributed without the defined population structure of H. armigera in South America. Most of the genetic variation is within populations with a multidirectional expansion of H. armigera among morphoclimatic regions. High genetic diversity, rapid population expansion, and hybridization have implications for pest management since they suggest that adaptive alleles are spread through wide areas in South America that favor rapid local adaptation of H. armigera to new and disturbed environments (e.g., in agricultural areas).
Keywords: Americas, cotton bollworm, invasion route, invasive pest, putative hybrids
1. INTRODUCTION
The agribusiness sector accounts for more than 20% of the Brazilian gross domestic product (GDP) (IBGE, 2016). Nevertheless, this sector suffers economic losses of US$ 17.7 billion per year due to pest damage on 35 major crops (Oliveira, Auad, Mendes, & Frizzas, 2014). Plant protection policies to control insect pests are limited by lack of efficient management strategies and new population outbreaks caused by ecologic disturbances and invasive pests. The introduction of exotic pests has been an enduring problem in the world, causing large negative impacts over the past three decades (Lopes‐da‐Silva, Sanches, Stancioli, Alves, & Sugayama, 2014). This is the case of the phytosanitary crisis caused by the Old World cotton bollworm, Helicoverpa armigera (Hübner) (Lepidoptera: Noctuidae), in Brazil and its dispersion northward to the Americas.
After the first record of H. armigera in Brazil in January 2013 in Goiás, Mato Grosso, and Bahia States (red dots in Figure 1; Czepak, Albernaz, Vivan, Guimarães, & Carvalhais, 2013; Tay et al., 2013), H. armigera population outbreaks occurred in the same year in a wide geographical area, especially the row crop areas of the northeastern and central regions of the country and constantly associated with reports of control failures of pyrethroid pesticides (Durigan et al., 2017; EMBRAPA, 2013). Strategic control tactics to contain or eliminate invasive pests depend on an accurate spatial characterization of the invasion and dispersion processes of the species in its new territory. However, H. armigera is morphologically similar to the native pest H. zea (Boddie) (Lepidoptera: Noctuidae). In larval stages, they are morphologically indistinguishable, which made data collection concerning geographical distribution and dispersion of this pest in Brazil difficult (Pogue, 2004). Furthermore, hybridization events between H. armigera and H. zea are a real scenario under natural conditions (Anderson et al., 2018; Laster & Hardee, 1995; Laster & Sheng, 1995; Leite, Corrêa, et al., 2017).
Figure 1.
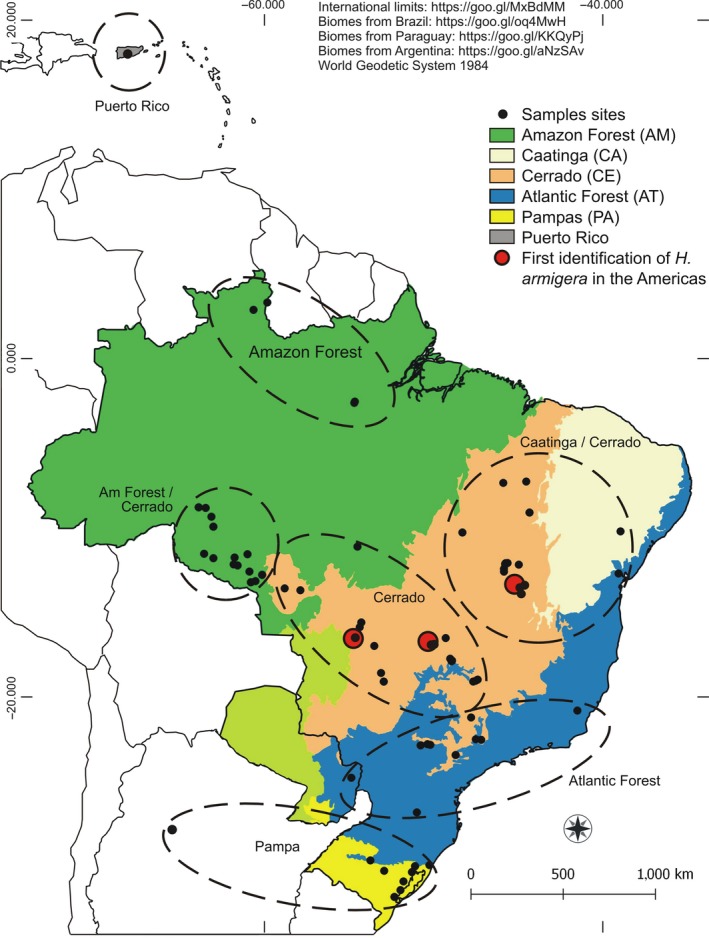
Collection points of Helicoverpa armigera sampled in South America and Puerto Rico showing the morphoclimatic regions where the samples were obtained. Dashed lines indicate the sites grouping used in the analyses. Red dots indicate the three farms where H. armigera was identified for the first time on the American continent by Czepak et al. (2013)
Despite the absence of an official record about specific invasion routes of H. armigera to Brazil, sequential investigations rapidly started, indicate new reports of H. armigera in the Americas. Initially, outbreaks began to be reported in other South American countries (Arnemann et al., 2016; Murúa et al., 2014), then to Caribbean (NAPPO, 2014) and, finally, Florida, USA, in 2015 (APHIS, 2015; Hayden & Brambila, 2015). Around three years after being officially reported, H. armigera had almost reached the entire American continent. Its rapid geographical expansion is favored by high dispersion capacity mediated by the wind, mild winter temperatures, and the intense cropping systems, which provide a wide availability of food and high reproductive rates during the four seasons of the year. All detections of H. armigera in Puerto Rico have been reported in the southern drier region of the island that concentrates on year‐round production of vegetable (i.e., tomato, peppers) and is one of the largest winter nursery breeding operations in the United States for major row crops (i.e., soybean, corn, cotton, and sorghum) (Gerrero, 2009).
Recent population studies revealed a high genetic diversity of H. armigera populations in Brazil and genetic similarity among Brazilian individuals with populations originating in Europe, Africa, and Asia (Anderson, Tay, McGaughran, Gordon, & Walsh, 2016; Leite, Alves‐Pereira, Corrêa, Zucchi, & Omoto, 2014; Mastrangelo et al., 2014; Tay et al., 2017). The high genetic diversity of H. armigera increases doubts surrounding an invasion process and population dynamics of H. armigera in Brazil, since high genetic diversity is not expected in invasive insects due to the founder effect of invasion processes.
Hybridization is an important event in the process of colonization of new ecosystems by invasive species because they may receive new and favorable alleles of a native species (Lewontin & Birch, 1966; Mesgaran et al., 2016). Fertile hybrids between H. armigera and H. zea, in laboratory conditions, were initially reported by Laster and Hardee (1995) and Laster and Sheng (1995). However, due to the reproductive isolation resulting from the large distance of occurrence between these two species, hybrids had never been observed under natural conditions. This recurrent question has now arisen after the H. armigera invasion in the Americas and the occurrence of these two species in the same geographical region with a huge impact on pest management.
Here, we present the largest temporal and geographical sampling of H. armigera made in the Americas since its invasion, providing an important dataset that allows new insights into little‐understood issues like geographical distribution, dispersive traits, and genetic source of this invasion in the American territory. Furthermore, we used different population genetic approach methods (ABC analysis, nDNA, mitochondrial, and ITS markers) still not used to reveal the demographic events that shaped the H. armigera populations in South America, which are still suffering from significant data scarcity at the broader geographical level. Thus, we used seven different nuclear and mitochondrial molecular markers in order to (a) elucidate the invasion routes of H. armigera populations in South America, (b) assess the demographic parameters and population structure of H. armigera populations from Brazil, its bordering countries, and Puerto Rico, (c) assess the gene flow among H. armigera population collected in different Brazilian regions, and finally, (d) investigate the presence of putative hybrids between H. armigera and H. zea in Brazil. Such information is important in helping to define immediate control strategies and long‐term solutions for Helicoverpa management in South America and providing substantial information to support prevention and preparedness for the imminent arrival of the pest in the main North America agricultural regions.
2. MATERIAL AND METHODS
2.1. Samples of Helicoverpa armigera and DNA extraction
Helicoverpaspp. individuals were collected at 69 geographical sites from Brazil, Paraguay, Argentina, and Puerto Rico (Caribbean) during the 2013–2016 harvests (Figure 1; a detailed list of collection sites is available on Dryad repository: https://doi.org/10.5061/dryad.rd1570s). Larvae collected directly from host plants and moths from delta sticky and bucket traps baited with pheromone lures were immediately preserved at −20°C in 100% ethanol until DNA extraction. Total DNA was extracted from the abdomen of the specimens using the standard phenol:chloroform method, adapted for microcentrifuge tubes (Lyra, Klaczko, & Azeredo‐Espin, 2009). The pellet was resuspended in 100 µl of TE buffer and stored at −20ºC.
2.2. Mitochondrial markers
We used three partial sequences of mitochondrial genes: cytochrome c oxidase subunit I (COI; COIF/COIR; Li et al., 2011), cytochrome c oxidase subunit II (COII; A‐tLEU/B‐tLYS; Liu & Beckenbach, 1992), and cytochrome b (Cyt b; Harm CB‐J‐10769/Harm CB‐N‐11325; primers designed in this study) (Appendix A). The PCR were conducted in a final volume of 25 μl for mtDNA with 25 ng of total DNA, 1.5 U of TaqDNA polymerase (Fermentas International Inc., Canada), 56 µM of dNTPs, 2.5 mM of MgCl2, 0.3 mg/ml of0020BSA, 10× TaqBuffer, and 0.16 µM of each primer. Successful amplifications were purified with the IllustraTMGFXTM kit (GE Healthcare, Bucks, UK), cycle sequencing reactions were completed using the BigDye® Terminator v3.1 kit (Thermo Fisher Scientific Inc., Waltham, EUA), and bidirectional sequenced by the ABI 3730xl DNA Analyzer sequencer (Applied Biosystems, Foster City, EUA).
Geneious 6.0.6 software package (Biomatters Ltd, Auckland, NZ) was used to assemble the nucleotide sequences into a contig for each specimen. The generated sequences were aligned employing the multiple sequences alignment algorithm implemented in Clustal Omega (Sievers et al., 2011), manually edited and the translated sequences were checked for the presence of premature stop codon in MEGA 5.1 (Tamura et al., 2011). Sequences were independently identified by BLAST 2.3.0 search (www.ncbi.nlm.nih.gov/BLAST/) against sequences stored in NCBI GenBank database (http://www.ncbi.nlm.nih.gov/genbank/). In this step, COI also were used to H. armigera species identification.
2.2.1. Inferring Brazilian H. armigera origin
In short, we used an Approximate Bayesian Computation (ABC) approach (Csilléry, Blum, Gaggiotti, & François, 2010), designed here for the first time for H. armigera, to investigate the origin of its invasion in South America. We designed demographic and coalescent models (see below) that were used to generate a simulated data distribution on which summary statistics were calculated. A rejection algorithm retained the statistics, among all the models, that have the smallest Euclidean distance to the empirical data, obtained from the COI dataset. Then, the model that best recovered the empirical data presented the highest Posterior Probability value (PP).
We used 36 COI mtDNA sequences from the Americas (the first two sequences obtained in each Brazilian state and in each South American country), 40 from Asia (28 from Li et al., 2011; one from Cho et al., 2008: EU768935, and unpublished: HM854928–HM854932, FN908003, FN908011, FN908013, FN908016, JX532104, AB620128), 11 from Europe (unpublished: GU686757, KJ460247, FN908014, FN908015, FN907996–FN908002), and five from Africa (unpublished: FN907995, FN908005, FN908006, FN908017, FN908018). We chose not to use all sequences obtained in our work in order to have a similar number of sequences among the continents.
Initially, three simple and specific scenarios were designed (independent ABC runs) testing three similar models in each as shown in Figure 2‐I. Each of the three scenarios simulates different hypotheses for the founder effect with individuals going to the American continent from (1) Asia, (2) Europe, and (3) Africa. The three models in each scenario assume very recent divergence between sequences from specimens collected in South America versus samples from one of the other three continents. The models differ in past demographic events, adding (a) a constant population size, (b) exponential population growth, and (c) very rapid population expansion before and after the divergence. We did not incorporate migration into our models even though we tested populations scattered on distant continents, but it is a question that could be explored in the future. The ABC approach is a robust method of analysis of situations with limited gene flow (Camargo, Morando, Avila, & Sites, 2012).
Figure 2.
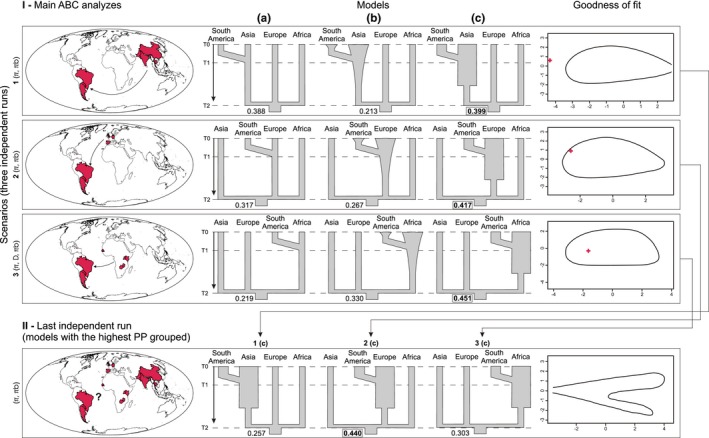
An ABC analysis performed to investigate founder effect in H. armigera samples from South America. I—In horizontal, three independent ABC runs of scenarios based in COI marker represent individuals coming from (1) Asia; (2) Europe, and (3) Africa. Arrows represent time into past, T0 = present, T1 = divergence time, and T2 = coalescent time. Summary statistics vector most informative for the data are between parentheses. In vertical and inside each scenario, three models illustrate (a) constant population size; (b) exponential population growth, and (c) very rapid population expansion. Numbers at the bottom of the graph correspond to posterior probabilities (PP) while bold numbers inside the rectangle represent the highest PP found in each scenario. The goodness of fit test of the scenarios is shown on the right; Red cross: observed SuSt. II—Last independent ABC run for the scenarios comparison containing the best models obtained before (1c, 2c, 3c)
The ABC analyses were performed separately for each scenario in the ms 20161016 coalescent sampler (Hudson, 2002) to construct a prior distribution of simulated datasets. For each scenario, a custom Python™ script was designed with 300,000 data simulations. All scripts used in the ABC analysis and mentioned below are deposited in the Dryad repository: https://doi.org/10.5061/dryad.rd1570s. For simulations of the models, the values of the parameters were sampled randomly within the intervals whose maximum limits were calculated as follows: Wang, Fan, Owada, Wang, and Nylin (2014) detected the rate of 0.0115 substitutions/site/million years for COI in Noctuidae, thus we considered 0.75 million years (divergence with H. zea was 1.5 million years ago; Mallet, Korman, Heckel, & King, 1993) as the maximum coalescence time of the sequences, five generations per year (Ge, Chen, Parajulee, & Yardim, 2005; Naseri, Fathipour, Moharramipour, & Hosseininaveh, 2011) and theta‐W = 4.123, which was obtained in DnaSp v5 (Librado & Rozas, 2009) from the 626bp COI dataset long with 92 sequences. The formula Theta = Neµ was calculated, that is, 4.123 = Ne (0.0115/106. 626 pb); 4.123 = Ne(7.199/106); Ne = 572,718.43, and tau was found as number of generations/2Ne; 3,750,000/1.145.436,86 = 3.274. The following observed Summary Statistics (SuSt) were calculated in DnaSp v5: nucleotide diversity (π), segregating sites (SS), Tajima's D (D), nucleotide diversity within each population (πw), and nucleotide diversity between each pair of populations (πb). For the simulated datasets, the same SuSt were calculated with the software Sample Stats (Hudson, 2002) and msSS.pl (a Perl script written by N. Takebayashi, available at: http://raven.iab.alaska.edu//ntakebay/teaching/programming/coalsim/scripts/msSS.pl).
After obtaining the prior distribution, the goodness of fit test was performed in the R package ABC (Csilléry, François, & Blum, 2012) with the gfitpca function to evaluate how well the simulated models fit the observed data. A good fit occurs when the observed SuSt is positioned within the simulated SuSt. Next, all possible combinations of two or more simulated SuSt were grouped into vectors. A rejection step was conducted with a Python script in the Euclidean distance C program msReject (http://msbayes.sourceforge.net/) using 10 simulations from the prior distribution of each model treated as empirical data to find the vector that best detects the true model (Tsai & Carstens, 2013). Then, these vectors were employed to find the 2.5% and 97.5% weighted values of each parameter in the R package ABC which were, respectively, the minimum and maximum new limits of these parameters in the main ABC analysis.
Therefore, the main ABC analysis was performed as described above, but now with 900,000 data simulations and restricted parameters. The model most supported by the data in each scenario was selected using msReject to retain the posterior distribution of 0.001 of the simulations closest to summary statistics from the empirical data. Again, only the vector selected previously was used. Lastly, the models with the highest PP values found in each of the three scenarios were carried out in a final independent run (Figure 2‐II), applying a hierarchical procedure similar to Fagundes et al. (2007), to infer the most likely model among the scenarios. This new ABC analysis and the rejection step were performed as described above, but with 3,000,000 data simulations and restricted parameters.
2.2.2. Genetic diversity, demography, and population structure in Brazil
A total of 303 H. armigera individuals were used in this population study. Mastrangelo et al. (2014) previously sequenced 65 individuals for COI and COII mtDNA genes and, here, we added Cyt b gene to these individuals. The other 238 H. armigera individuals were sequenced for three mtDNA genes: COI, COII, and Cyt b. We concatenated the three genes, COI (658 pb), COII (554 pb), and Cyt b (434 pb) in a 1,646 bp‐long sequence for each of the 303 individuals, generating a total of 54 mtDNA haplotypes. The genetic diversity, demography, and population structure indices were estimated according to the morphoclimatic regions of the individuals (Ab'Saber, 1967; IBGE, 2016): 1—Amazon Forest biome (AM); 2—Amazon Forest transition with Cerrado biome (AM/CE); 3—Cerrado biome (CE); 4—Cerrado transition with Caatinga biome (CE/CA); 5—Atlantic Forest biome (AT); 6—Pampas biome (PA); and 7 Puerto Rico (Figure 1).
We estimated the number of transitions and transversions and the nucleotide (π) and haplotype diversity (Ĥ) (Nei, 1987). The neutrality tests Tajima's D (Tajima, 1989), Fu's Fs (Fu, 1997) and the mismatch distribution (Rogers & Harpending, 1992) were performed to test the neutral hypothesis and investigate the demographic events. The neutrality tests were tested for significance by generating 1,000 random samples using coalescent simulations. Hierarchical analysis of molecular variance (AMOVA) was conducted to estimate the population genetic structure within and among morphoclimatic groupings with 10,000 permutations and gamma = 0. Pairwise comparisons of the fixation index, F ST, were used to determine the genetic differences among groupings with the significance assessed by 10,000 permutations for each pairwise comparison and the gamma α value set to zero. All analyses were carried out using Arlequin v.3.5 (Excoffier & Lischer, 2010).
2.2.3. Genealogical inferences
An unrooted statistical parsimony haplotype network (gene genealogies) was estimated with the default 95% plausible connection limit using the TCS 1.2.1 (Clement, Posada, & Crandall, 2000) to investigate genealogical relationships among haplotypes originating from the concatenated mtDNA sequences (COI, COII, and Cyt b). A second haplotype network of COI mtDNA was estimated with the dataset used in the ABC analysis (Americas, Asia, Europe and Africa) with 230 other sequences from this study, 65 from Mastrangelo et al. (2014), and 139 from Leite et al. (2014).
The Bayesian phylogenetic analysis was carried out using the 54 haplotypes (concatenated mtDNA sequences) of H. armigera and one mtDNA haplotype of H. zea as outgroup. The best substitution model of evolution selected by MrAIC v. 1.4.2 (Nylander, 2004) was HKY+I+G. Subsequently, the Bayesian phylogeny was performed in MrBAYES v3.1.2 (Ronquist & Huelsenbeck, 2003) using two simultaneous runs with four chains in each run for a total of 20 million generations. The first trees (25%) were discarded as burn‐in samples. The consensus tree was obtained with posterior probabilities > 0.50 and visualized in FigTree v.1.3.1 (Rambaut, 2009).
2.3. nDNA‐based structure in H. armigera in Brazil
Ninety‐six H. armigera individuals, representative of all geographical regions, were genotyped using three nDNA markers (Exon Primed Intron Crossing—EPIC): dopa decarboxylase (DDC; nDNA‐DDC‐F1/nDNA‐DDC‐R1), the ribosomal protein S6 (RpS6; nDNA‐RpS6‐F/nDNA‐RpS6‐R), and the ribosomal protein L11 (RpL11; nDNA‐RpL11‐F/nDNA‐RpL11‐R) (Tay, Behere, Heckel, Lee, & Batterham, 2008; Appendix A). Tay et al. (2013) used the same three markers to investigate samples collected in Brazil, in addition to other studies that used this approach, representing an accumulation of knowledge (Behere, Tay, Russell, Kranthi, & Batterham, 2013; Tay et al., 2008). We chose these markers because of the 12 nDNAs designed by Tay et al. (2008) specifically for H. armigera, in which only three had more than 10 alleles. All others had ≤four alleles and consequently low values of heterozygosity. Another option of fast‐evolving markers would be microsatellites, but several lepidopteran microsatellite markers presented amplification faults (Tay, Behere, Batterham, & Heckel, 2010), which can be softened when the primers are designed to anneal in the less variable regions of the exons, as in the case of nDNA‐EPIC (Behere et al., 2013).
The PCR was performed in a final volume of 15 μl with 25 ng of total DNA, 1.0 U of TaqDNA polymerase (Fermentas International Inc., Canada), 92 µM of dNTPs, 1.7 mM of MgCl2, 0.6 mg/ml of BSA, 10x TaqBuffer, and 0.23 µM of each primer. The forward primers were labeled with three different fluorescent dyes (Applied Biosystems, Foster City, CA) to evaluate size polymorphism: NED™ (yellow: DDC), VIC™ (green: RpS6), and 6‐FAM™ (blue: RpL11) (Appendix A). Negative controls were included in all amplifications to identify potential contamination. After amplification and electrophoresis, PCR products were multiplexed and characterized using a 3,500 Genetic Analyzer (Applied Biosystems, Foster City, EUA) with GeneScan™ 600 LIZ™ dye Size Standard v2.0. The result of the DNA fragment length was predicted to allele size using GeneMarker® (Version 2.4.2) (SoftGenetics, State College, PA, USA).
The inbreeding among individuals within subpopulations (F IS), pairwise F ST matrix for all pairs of morphoclimatic regions, and observed (H O) and expected (H E) heterozygosities for each nDNA marker (and combination of them) were calculated using Arlequin v.3.5. The F ST relations results were displayed as a heatmap using the pheatmap R package (https://cran.r-project.org/web/packages/pheatmap/index.html). Deviations from Hardy–Weinberg equilibrium (HWE) were tested in Genepop v.4.2 (Option 1) (Raymond & Rousset, 1995). p‐Values were obtained by the Markov Chain (MC) algorithm for each locus in each population (Guo & Thompson, 1992) using 10,000 dememorizations, 1,000 batches, and 10,000 iterations per batch to ensure a standard error <0.01. The global test across loci and locality was performed using Fisher's method once the linkage disequilibrium analyses (Slatkin, 1994) showed no linkage disequilibrium at significance level = 0.05, performed in Arlequin v.3.5 with 10,000 permutations for all pairs of loci. Allelic richness was calculated by Fstat 2.9.4 (Goudet, 1995).
2.4. Putative hybrids inference in Brazil
Three hundred thirty‐one H. armigera and 61 H. zea individuals, previously identified by the mtDNA COI marker, were genotyped to the Internal Transcribed Spacer 1 (ITS1) region of the nuclear ribosomal DNA (rDNA) using a Helicoverpa spp. forward primer (3373Ha_Hz_ITS1‐F) and two species‐specific reverse primers: for the H. armigera (3374Ha_ITS1‐R) and for H. zea (3377Hz_ITS1‐R) (Perera et al., 2015; Appendix A). The conditions for the PCR were as follows: 1.0 U of TaqDNA polymerase (Fermentas International Inc., Canada), 56 µM of dNTPs, 2.5 mM of MgCl2, 0.3 mg/ml of BSA, 10× TaqBuffer, 0.16 µM of each primer, and 25 ng of total DNA in a final volume of 25 μl.
This method produces PCR distinct product sizes between H. armigera (147 bp) and H. zea (334 bp), allowing the identification of putative hybrids when checked in agarose gel electrophoresis (Perera et al., 2015). H. armigera, H. zea, and one laboratory hybrid, previously confirmed by sequencing, were used as controls for PCR standardization and genotyping of field individuals. Furthermore, the Helicoverpa spp. individuals that exhibited two positive bands were re‐amplified in two separate PCRs using the primer set 3373Ha_Hz_ITS1‐F/3374Ha_ITS1‐R corresponding to the ITS1 from H. armigera and 3373Ha_Hz_ITS1‐F/3377Hz_ITS1‐R that corresponds to the ITS1 from H. zea. Once more, both amplicons were visualized on agarose gel electrophoresis, purified, sequenced, aligned, and identified following the same protocols described for the mitochondrial markers (Section 2.22.2).
3. RESULTS
3.1. Approximate Bayesian Computation
Overall, π and πb were the most informative summary statistics (also D for scenario 3) (Figure 2). Model c (very rapid population expansion) had the highest posterior probabilities in all tested scenarios (PP = 39.9, 41.7 and 45.1, respectively; Figure 2‐I), and then, they were grouped in one last run to compare the three scenarios together. Nonetheless, in this last independent run involving the models best fitted for each scenario (1c, 2c, and 3c), the rejection step revealed scenario 2 (44.0) as best supported by the data (Figure 2‐II). Scenario 2, model c, describes the hypothesis of South America samples originating through a founding effect whose origin populations came from Europe and had a rapid population expansion.
Observed SuSt appeared within the cloud of simulated SuSt in scenarios 2 and 3, which did not happen in scenario 1 and in the last run (Figure 2), being an outlier and suggesting an inadequate adjustment of the models. The time of divergence between the American populations and their source of introduction is very recent (around 60 generations, we believe, after its official identification), which should favor their identification through ABC analysis. However, the low PP value of the models found in all runs and the observed SuSt positioned out of the cloud of simulated SuSt in scenario 1 and in the last run may be a result of the large population size on all continents, the gene flow among populations and/or multiple introductions. Another ABC analysis performed as described above, but with 470 sequences from the Americas, also found scenario 2 with the highest PP value (data not shown). Many haplotypes are also shared between South America and Europe (Appendices B and C). Our study presents the first results obtained with this exploratory analysis, and we suggest that this is a powerful tool to boost the investigation of this recent invasion in the American continent, which can be intensely driven using a genomic approach.
3.2. Genetic diversity, demography, and population structure
The total haplotype and nucleotide diversity for COI, COII, and Cyt b concatenated genes were Hd = 0.926 ± 0.006 and π = 0.002 ± 0.001 (Table 1 and Appendix D). The region CE/CA shows a higher number of haplotypes (n = 33) and the region AM a lower number of haplotypes (n = 12). However, the haplotype and nucleotide diversity indicate similar diversity among Brazilian regions. The variation in sample size influenced the amount of haplotypes found in the regions (Table 1). GenBank accession numbers are on https://doi.org/10.5061/dryad.rd1570s.
Table 1.
Estimates of haplotype and nucleotide diversity from 303 H. armigera based on COI, COII, and Cyt b concatenated mtDNA
| Region | Sample size | # Haplotypes | Haplotypes | Hd | π |
|---|---|---|---|---|---|
| AM | 16 | 12 | H1(3); H2(2); H3; H4; H5(2); H7; H9; H10; H14; H17; H46; H47 | 0.958 ± 0.036 | 0.0026 ± 0.0015 |
| AM/CE | 22 | 15 | H1; H3(3); H4; H5(3); H7(3); H9(2); H10; H11; H13; H16; H17; H42‐H45 | 0.957 ± 0.026 | 0.0024 ± 0.0014 |
| CE/CA | 124 | 33 | H1(24); H2(17); H3(10); H4(12); H5(9); H6(12); H7(3); H8(5); H9(4); H10(2); H11; H12(2); H14(2); H16; H19; H20; H21(2); H22; H24‐H28; H32‐H41 | 0.915 ± 0.012 | 0.0020 ± 0.0012 |
| CE | 52 | 20 | H1(7); H2(11); H3(4); H4(2); H5(4); H6(5); H7; H8(3); H9; H10(3); H11‐H14; H17; H18(2); H19; H22; H29; H30 | 0.920 ± 0.021 | 0.0021 ± 0.0012 |
| AT | 56 | 20 | H1(8); H2(8); H3(8); H4(6); H5(3); H6(3); H7(2); H8; H9; H11; H12; H13(3); H15(3); H20; H23(2); H31; H51‐H54 | 0.927 ± 0.015 | 0.0022 ± 0.0013 |
| PA | 29 | 18 | H1(3); H2(4); H3(4); H4; H5; H6(2); H7(2); H8(2); H9‐H12; H14; H15; H17; H48‐H50 | 0.956 ± 0.021 | 0.0035 ± 0.0019 |
| Puerto Rico | 4 | 2 | H1(2); 16(2) | 0.667 ± 0.204 | 0.0016 ± 0.0013 |
| Total | 303 | 54 | H1(48); H2(42); H3(30); H4(23); H5(22); H6(22); H7(12); H8(11); H9(10); H10(8); H11(5)‐H14(5); H15(4)‐H17(4); H18(2)‐H23(2); H24‐H54 | 0.926 ± 0.006 | 0.0023 ± 0.0013 |
AM/CE: Amazon Forest transition with Cerrado; AM: Amazon Forest; AT: Atlantic Forest; CE/CA: Cerrado transition with Caatinga; CE: Cerrado; PA: Pampas.
Tajima's D value assumed −1.6326 (p = 0.019), while Fu's Fs assumed −25.5408 (p < 0.001), and both results showed a departure from mutation‐drift equilibrium, which usually indicates a sudden demographic expansion or purifying selection (Table 2). Likewise, the same result was verified in a mismatch distribution analysis, where the observed data distribution was clearly unimodal positioning out of the expected distribution and the raggedness index was small (r = 0.0235), which is to be expected in a population that has experienced recent expansion (Table 2).
Table 2.
Neutrality test statistics and mismatch distribution analysis from 303 H. armigera based on COI, COII, and Cyt b concatenated mtDNA
| Region | Sample size (n) | Tajima's D (p‐value) | Fu's Fs (p‐value) | τ (SD 95%) | SSD (p‐value) | r (p‐value) |
|---|---|---|---|---|---|---|
| AM | 16 | −1.573 (0.04) | −5.000 (0.00) | 3.5 (2.15–4.67) | 0.0102 (0.18) | 0.0308 (0.37) |
| AM/CE | 22 | −1.502 (0.05) | −7.181 (0.00) | 3.1 (2.47–6.45) | 0.0140 (0.04) | 0.0439 (0.10) |
| CE/CA | 124 | −1.642 (0.02) | −18.952 (0.00) | 3.1 (1.79–4.25) | 0.0030 (0.09) | 0.0236 (0.40) |
| CE | 52 | −1.836 (0.01) | −8.345 (0.00) | 3.2 (2.93–3.26) | 0.0170 (0.00) | 0.0535 (0.00) |
| AT | 56 | −1.559 (0.03) | −7.055 (0.01) | 3.8 (2.27–5.46) | 0.0045 (0.12) | 0.0210 (0.38) |
| PA | 29 | −1.020 (0.16) | −6.037 (0.01) | 3.9 (2.04–5.10) | 0.0195 (0.00) | 0.0315 (0.09) |
| Puerto Rico | 4 | 2.080 (0.98) | 2.719 (0.85) | 4.8 (1.92–57.79) | 0.3700 (0.02) | 1.0000 (0.16) |
| Total | 303 | −1.633 (0.02) | −25.541 (0.00) | 3.5 (1.96–4.58) | 0.0045 (0.02) | 0.0235 (0.21) |
AM/CE: Amazon Forest transition with Cerrado; AM: Amazon Forest; AT: Atlantic Forest; CE/CA: Cerrado transition with Caatinga; CE: Cerrado; PA: Pampas.
Additionally, little evidence of subdivision into genetically distinct populations was found by AMOVA, with a variation of 92.46% occurring within sites' level and only 7.54% among sites' level also indicating genetic homogeneity ƟST = 0.0754 and p‐value = 0.0074) (Table 3). For three hierarchical levels, where the differentiation was also tested among the morphoclimatic regions, the results were similar, with −0.67% of variation occurring among regions' level and 8.08% among sites within regions' level (Table 3).
Table 3.
Analysis of molecular variance (AMOVA) from 303 H. armigera based on COI, COII, and Cyt b concatenated mtDNA
| Source of variation | df | Variance components | Percentage variance | Fixation indices |
|---|---|---|---|---|
| Among sites | 68 | 0.141 | 7.54 | ΦST = 0.075 |
| Within sites | 234 | 1.733 | 92.46 | |
| Total | 302 | 1.875 | ||
| Among regions | 6 | −0.012 | −0.67 | ΦCT = −0.007 |
| Among sites within regions | 62 | 0.151 | 8.08 | ΦSC = 0.080 |
| Within sites | 234 | 1.733 | 92.59 | ΦST = 0.074 |
| Total | 302 | 1.872 |
3.3. Genealogic inferences
The 54 haplotypes showed a complex and diversified topology in the haplotype network (Figure 3a). Six haplotypes in the high frequency range (H1–H6) are centrally located in the network and accompanied by a large number of private haplotypes (n = 31; 57.4%). A haplogroup separated for 12 mutation steps is represented by haplotypes H49, H48, H46, H24, and H12. The Bayesian phylogenetic analyses show short branch and low supported nods (Figure 3b). Additionally, the phylogeny confirmed the presence of a more recent haplogroup supported for a posteriori probability of 0.84. Both, the haplotype network and the Bayesian tree do not suggest predominance of specific haplotypes among sites or morphoclimatic regions (Figure 3). The global network for the COI mtDNA showed 57 haplotypes with a complex genealogic relationship, which has two central and frequent haplotypes and others haplotypes surrounding them. The five sequences of Puerto Rico were organized into two haplotypes, the H2 shared with all regions of the world (includes Brazil) and a haplotype H9 shared only with the northwestern Brazil (Appendices B and C).
Figure 3.
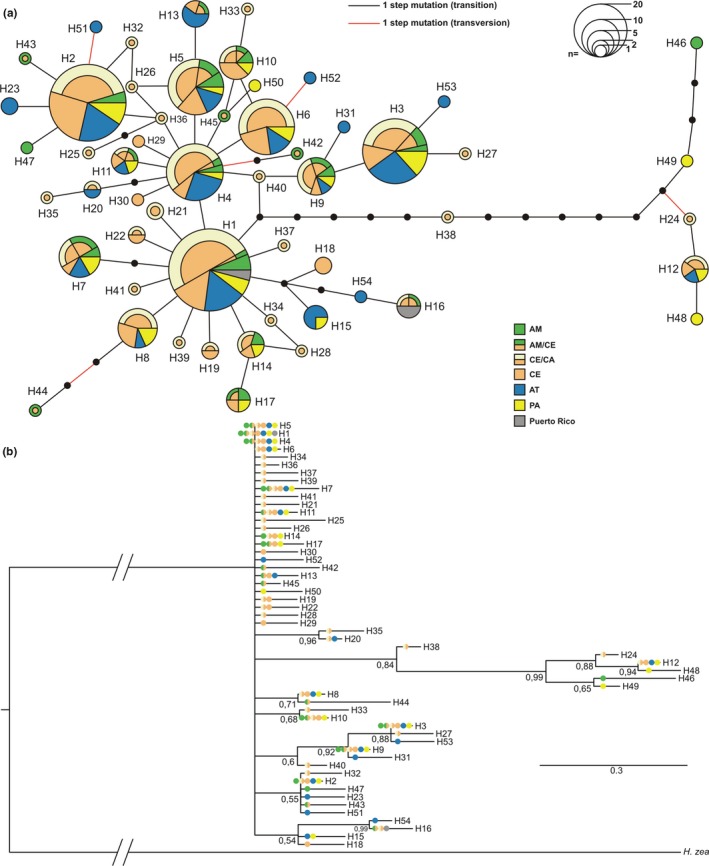
(a) Parsimony haplotype network of concatenated 1,646 bp‐long mtDNA from 303 H. armigera sampled in South America and Puerto Rico. Circles represent different haplotypes nominated in ascending order from most frequent to least frequent (H1‐H54). Circles area is proportional to the number of individuals carrying this haplotype as shown by the scale at the top. Colors in the circles indicate the proportional distribution of the morphoclimatic regions in each haplotype, small black dots represent presumed, but unsampled haplotypes and the connection lines are proportional to number of mutational steps between any two different haplotypes. AM: Amazon Forest; AM/CE: Amazon Forest transition with Cerrado; AT: Atlantic Forest; CE/CA: Cerrado transition with Caatinga; CE: Cerrado; PA: Pampas. (b) Phylogram of the Bayesian topology consensus tree based on the same COI mtDNA of 303 H. armigera sequences plus 12 H. zea sequences used here as outgroup. Numbers at forks represent the Posterior Probability and, like in the haplotype network, the circles colored indicate the same morphoclimatic regions where each haplotype was found
3.4. nDNA‐PCR‐based structure in H. armigera
A total of 92 samples were successfully predicted to allele size for all three nDNA‐PCR markers (data are available on Dryad: https://doi.org/10.5061/dryad.rd1570s). The remaining four samples, which had unspecific amplification for any nDNA marker, were discarded from the analysis. From those samples, 56 alleles were found in total for the three markers (Table 4). DDC and RpS6 had a large number of alleles (ranging from 170 to 354 bp and from 215 to 290 bp, respectively), higher values of allelic richness (from 3.0 to 6.3) and high expected (H E) and observed (H O) heterozygosities (0.913, 0.761 and 0.873, 0.760, respectively). Most of the localities were in HWE, except DDC marker from CE/CA and RpS6 marker from AM/CE, CE, and AT. All of them had a p‐value < 0.05. When all samples were joined and treated as one locality, both DDC and RpS6 were not in HWE. On the other hand, when the three markers were treated together, AM/CE, CE/CA, and CE were significantly out of HWE. Except for RpL11 marker, the F IS values in each locality ranged widely from −0.5 (RpS6 in Puerto Rico) to 0.493 (RpS6 in AM/CE). The AMOVA showed that only 1.31% of variation occurred among sites' level, and 98.69% within sites' level (global F ST = 0.0130 and p‐value = 0.1233). F statistics (Weir & Cockerham, 1984) were F ST = 0.0075 (p > 0.9), F IS = 0.1343 (p < 0.001), and F IT = 0.1408 (p < 0.001), respectively.
Table 4.
Estimates of population statistics based on DDC, RpL11, and RpS6 nDNA markers from 92 H. armigera individuals
| Region | N | DDC | RpL11 | RpS6 | H E Mean (SD) | H O Mean (SD) | HW‐p(all loci) | ||||||||||||
|---|---|---|---|---|---|---|---|---|---|---|---|---|---|---|---|---|---|---|---|
| Allelic Richness | H E | H O | HW‐p | F IS | Allelic Richness | H E | H O | HW‐p | F IS | Allelic Richness | H E | H O | HW‐p | F IS | |||||
| AM | 8 | 5.528 | 0.892 | 0.875 | 0.867 | 0.020 | 1.500 | 0.125 | 0.125 | — | — | 5.090 | 0.867 | 1.000 | 0.263 | −0.167 | 0.628 (0.436) | 0.667 (0.473) | 0.566 |
| AM/CE | 7 | 5.263 | 0.824 | 0.571 | 0.051 | 0.324 | 1.000 | — | — | — | — | 4.531 | 0.813 | 0.429 | 0.026 | 0.493 | 0.546 (0.473) | 0.500 (0.101) | 0.010 |
| CE/CA | 27 | 5.888 | 0.906 | 0.630 | 0.001 | 0.309 | 1.296 | 0.073 | 0.074 | 1.000 | −0.010 | 5.933 | 0.906 | 0.778 | 0.128 | 0.143 | 0.628 (0.481) | 0.494 (0.371) | 0.007 |
| CE | 15 | 6.327 | 0.931 | 0.867 | 0.622 | 0.071 | 1.533 | 0.131 | 0.133 | 1.000 | −0.018 | 5.866 | 0.906 | 0.667 | 0.000 | 0.279 | 0.656 (0.455) | 0.556 (0.379) | High. sign. |
| AT | 15 | 5.825 | 0.901 | 0.800 | 0.340 | 0.116 | 1.736 | 0.191 | 0.200 | 1.000 | −0.050 | 4.600 | 0.816 | 0.733 | 0.022 | 0.105 | 0.636 (0.388) | 0.578 (0.329) | 0.134 |
| PA | 16 | 5.793 | 0.895 | 0.938 | 0.782 | −0.049 | 1.250 | 0.063 | 0.063 | — | — | 5.767 | 0.897 | 0.813 | 0.231 | 0.097 | 0.618 (0.481) | 0.604 (0.473) | 0.490 |
| Puerto Rico | 4 | 3.000 | 0.714 | 0.500 | 0.086 | 0.333 | 1.000 | — | — | — | — | 3.000 | 0.714 | 1.000 | 0.543 | −0.500 | 0.476 (0.412) | 0.750 (0.354) | 0.190 |
| Total | 92 | 6.060 | 0.913 | 0.761 | 0.013 | 0.167 | 1.380 | 0.095 | 0.098 | 1.000 | −0.027 | 5.412 | 0.873 | 0.760 | High. sign. | 0.129 | 0.627 (0.461) | 0.540 (0.382) | High. sign. |
Expected (H E) and observed (H O) heterozygosities, Hardy–Weinberg equilibrium p‐values (HW‐p), inbreeding in absolute values for localities per polymorphic locus (F IS).
AM/CE: Amazon Forest transition with Cerrado; AM: Amazon Forest; AT: Atlantic Forest; CE/CA: Cerrado transition with Caatinga; CE: Cerrado; PA: Pampas.
Pairwise F ST values varied from −0.018 to 0.119 (Figure 4), and four comparisons involving Puerto Rico (with PA, AT, CE and CE/CA) had a p < 0.05, indicating population differentiation. The other two comparisons with Puerto Rico (AM and AM/CE) had a relatively high F ST value but were not significant. All other comparisons had low F ST values (−0.018 to 0.026) and were not significant showing greater homogeneity. The data also show, even subtly, that Puerto Rico is closer to the AM and AM/CE samples (also geographically closer) than to other morphoclimatic regions.
Figure 4.
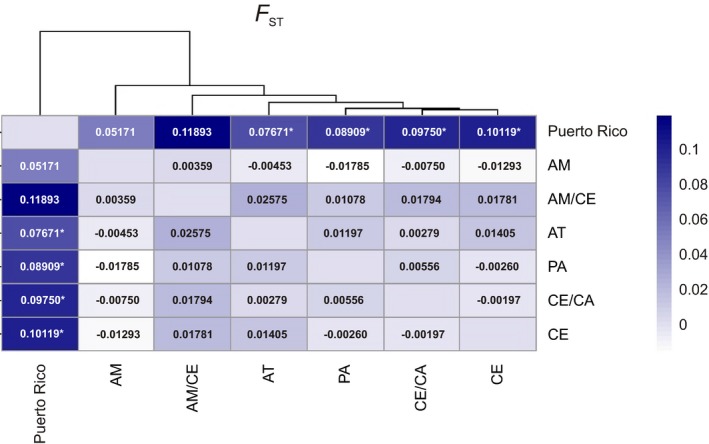
Heatmap of pairwise F ST distances ranging from low (white) to high (blue) between morphoclimatic regions estimated from nDNA markers of 92 H. armigera samples data. AM: Amazon Forest; AM/CE: Amazon Forest transition with Cerrado; AT: Atlantic Forest; CE/CA: Cerrado transition with Caatinga; CE: Cerrado; PA: Pampas. *p‐value < 0.05
3.5. Putative hybrids detection
Of 392 Helicoverpaspp. individuals tested, twelve samples (all of them initially identified as H. armigeraby mtDNA markers) exhibited two bands on agarose gel electrophoresis (~147 bp and ~334 bp). Thus, they could be hybrids between H. armigera and H. zea because these species‐specific sequences were found in a single individual. After the sequencing, alignment, and GenBank conference, only six individuals had their 147 bp‐long amplicons matched >98% with ITS1 from H. armigera and its 334 bp‐long amplicons matched > 98% with ITS1 from H. zea (Appendices E and F). Moreover, these sequences match the correspondent ones from a hybrid reared in laboratory. These individuals were classified as putative hybrids and originated from AM/CE (two individuals), CE/CA, AM, PA, and CE (one individual each) (GenBank accession numbers: MG893730‐MG893735). Both bands from another six samples only matched ITS1 from H. armigera, but in different sizes, which suggests a nonspecificity of the primers, mainly 3377Hz_ITS1‐R.
4. DISCUSSION
4.1. Inferring South America H. armigera origin
ABC is a powerful approach to investigate complex demographic events and biological invasion source that occurred in the past (Camargo et al., 2012; Tsai & Carstens, 2013). Here, we used ABC to investigate the H. armigera invasion source in the South American continent and it suggests Europe as its origin. After the rapid population expansion in South America, H. armigera would have dispersed from South America to the Caribbean region. European origin of the species in Brazil is supported by reports of human‐mediated dispersion via international trade of agricultural products between the Americas and Europe over the past 500 years, trade that has intensified over the last 100 years and much more over the last three decades of globalization (Barbosa et al., 2015; Biondi, Guedes, Wan, & Desneux, 2018; di Castri, 1989; Grapputo, Boman, Lindstroem, Lyytinen, & Mappes, 2005; Oliveira, Corrêa, Souza, Guedes, & Oliveira, 2013; Paini et al., 2016; Weintraub et al., 2017).
We found two haplotypes in Puerto Rico for the COI (Appendices B and C). One of them is the second most frequent haplotype in its world distribution. The other has only been found in the northwestern region of Brazil. Thus, we believe these are clues suggesting that individuals found in Puerto Rico should have originated in South America, through a process of population geographical expansion after the initial infestation, despite the high genetic differentiation found using nDNA markers.
Common mtDNA haplotypes are shared among the Americas, Europe, Africa, and Asia, including the sharing of alleles associated with pyrethroid resistance (Durigan et al., 2017; Tay et al., 2017). Furthermore, H. armigera populations show weak genetic structure and high gene flow in the Old World and Australia (Anderson et al., 2016; Behere et al., 2007; Endersby, Hoffmann, McKechnie, & Weeks, 2007; Li et al., 2011; Nibouche, Bues, Toubon, & Poitout, 1998; Tay et al., 2008; Vijaykumar, Krishnareddy, Kuruvinashetti, & Patil, 2008; Weeks et al., 2010). The high diversity and weak genetic structure in the Old World make it difficult to describe with accuracy the geographical origin, routes, and the number of invasion events of H. armigera to Brazil. However, they also reduce the impact of this information because there is a wide transference of alleles among geographical sites in the Old World (Anderson et al., 2016; Behere et al., 2007; Nibouche et al., 1998; Rasool et al., 2014; Stokes, Mckechnie, & Forrester, 1997). Finally, there is consensus that the invasion of South America by H. armigera was not originated from Oceania (Anderson et al., 2016; Durigan et al., 2017; Tay et al., 2017).
4.2. High genetic diversity and population expansion of H. armigera
Unexpected high genetic diversity was confirmed in H. armigera from Brazil what is not common in a recent invasive species (Handley et al., 2011). High population diversity and population admixture of H. armigera in the Old World are probably explanations for the high diversity of H. armigera in Brazil (Behere et al., 2007; Genton, Shykoff, & Giraud, 2005; Lombaert et al., 2010; Rius & Darling, 2014; Sosa‐Gomez et al., 2016). Mitochondrial and nuclear DNA diversity indices are similar among regions, revealing a wide distribution of H. armigera diversity in all Brazilian territory. The higher number of haplotypes found in CE/CA and CE morphoclimatic regions can be explained by a sampling disequilibrium of specimens among these regions.
The high number of private haplotypes (57%) separated for a single mutation step suggests that H. armigera populations are in demographic expansion in Brazil, which is also confirmed by the neutrality tests and the unimodal mismatch distribution analysis. Population expansion is a common fact in invasive species (Cesari et al., 2017; Lee, 2002; Sakai et al., 2001). However, H. armigera population expansion may also be justified by evolutionary forces resulting from agricultural management that promotes multiple events of colonization in the areas. This approach may be relevant to other insect pests since demographic expansion is commonly reported in native agricultural pests in Brazil (Albernaz, Silva‐Brandão, Fresia, Cônsoli, & Omoto, 2012; Fresia, Lyra, Coronado, & Azeredo‐Espin, 2011; Silva‐Brandão, Santos, Cônsoli, & Omoto, 2015; Soares, Cordeiro, Santos, Omoto, & Correa, 2018).
The genealogic relation among all 54 mtDNA haplotypes built a complex haplotype network, where the most frequent haplotypes are spread in all morphoclimatic regions of Brazil. The haplotype network does not show a star‐like standard, frequently reported in organisms of recent invasion, reinforcing the hypothesis of multiple (or a huge) invasion events in South America. A more recent haplogroup was identified in the analysis, probably associated with a vicariance/sympatric event among H. armigera populations on Old World continents. This haplogroup divergence event among haplotypes is not expected for H. armigera in South America due to its recent invasion, population expansion, and absence of genetic structure on the continent (Leite, Corrêa, et al., 2017; Tay et al., 2013, 2017).
4.3. No spatial structure of H. armigera in South America
nDNA‐PCR markers yielded concordant results with mtDNA sequences data revealing lack of population structure of H. armigera in the South America. The lack of genetic structure of H. armigera is consistent with traits of (a) a pest of recent invasion, (b) huge dispersion capacity of the moths carried by wind, and (c) a high polyphagia associated with uninterrupted and diversified crops during the entire year, stimulating a high reproductive rate of H. armigera in South America (Fitt, 1989; Hardwick, 1965; Nibouche et al., 1998). The genetic variation is primarily within populations with recent population expansion and multidirectional dispersion among sites and morphoclimatic regions. The weak geographical population structure detected at the regional level in South American populations of H. armigera was also described at continental and intercontinental levels in the Old World (Anderson et al., 2016; Behere et al., 2013; Nibouche et al., 1998; Scott et al., 2005; Song et al., 2018). High population admixture has serious implications for pest management, since alleles may spread to wide areas and promote an increase of genetic diversity and fitness in local populations of H. armigera (Fraimout et al., 2017; Lombaert et al., 2010; Rius & Darling, 2014; Seymour et al., 2016).
High genetic differentiation of H. armigera from South America and Puerto Rico show a limited gene flow between South and Central America. Low gene flow of Noctuidae pests between South and Central and North America was reported to Spodoptera frugiperda and H. zea (Leite, Corrêa, et al., 2017; Nagoshi et al., 2017). It is probably associated with contrary wind patterns between the South and North American continents that limit long‐distance dispersion of Noctuidae moths, providing few opportunities for gene flow. Of the 450 H. armigera male individuals trapped at 12 sites in Puerto Rico from 2016 to 2017, only five individuals were identified as H. armigera. This reinforces the low capacity of locomotion of H. armigera between South and North America and helps to explain the low population density and the nonestablishment of H. armigera populations in Central and North America even in the absence of wide ocean barriers separating the continent.
4.4. Presence of Helicoverpa putative hybrids in Brazil
We found a low number of putative hybrids between H. armigera and H. zea Brazilian strains under natural conditions. This result agrees with the previous studies that suggest low hibridization between H. armigera and H. zea in Brazil (Anderson et al., 2018, 2016; Leite, Pereira, et al., 2017. However, Brazilian agroecosystems show abrupt changes of cultivated area size, crop species, and pest management strategies (e.g., Bt crop events), which may rapidly modify the hybridization dynamic between H. armigera and H. zea. Thus, a constant monitoring of H. armigera and H. zea populations is recommended, since introgressions of adaptive genes/alleles between H. armigera and H. zea may have implications for the population management of these pests.
In conclusion, we found demographic signals of European origin of H. armigera in South America what could be supported by the history of invasion events between both continents. Like the European colonization after the great navigations, the invading H. armigera populations have established successfully on the South American continent, and their expansion north continues. The highly diverse genetic structure, recent expansion population, and multidirectional gene flow, plus the presence of putative hybrids, assumes a scenario of uncertainties for pest management of H. armigera. Alleles previously selected may spread long distances and, eventually, be transferred between the species, promoting a fitness increase in Helicoverpa local populations and the rapid evolution of resistance to pesticides and Bt crops in South America (Chakroun et al., 2016; Downes, Walsh, & Tay, 2016; Han et al., 2015; Joußen & Heckel, 2016).
CONFLICT OF INTEREST
We have no competing financial interests.
AUTHORS' CONTRIBUTION
RMG, TM, JCVR, DFP, and AMLAE conceived and designed the study. RMG collected the data. ASC, CO, and AMLAE provided reagents and analytical tools. RMG, TM, and ASC analyzed the data. RMG, TM, and ASC wrote the manuscript. All authors read, corrected, and approved the manuscript.
Supporting information
ACKNOWLEDGMENTS
We thank the following entities for their financial support: Fundação de Amparo à Pesquisa do Estado de São Paulo—FAPESP (grant #2014/11495‐3, #2015/02079‐9, #2018/04478‐6 and fellowship #2014/10504‐9 to RMG) and Conselho Nacional de Desenvolvimento Científico e Tecnológico—CNPq (fellowship #309167/2015‐9 to ASC and #140866/2016‐7 to RMG). This study was financed in part by the Coordenação de Aperfeiçoamento de Pessoal de Nível Superior—Brasil (CAPES)—Finance Code 001, and USDA‐APHIS AP17PPQS&T00C189 to UPR. Our thanks to Julia Barbosa de Paiva for assistance with the maps and to Elen Arroyo Peres and Manolo Perez for assistance with ABC analysis. We thank all collaborators who helped with insect sampling (Wanderlei Dias Guerra from MAPA, Marques José Naves from Sindicato dos Produtores Rurais de Iraí de Minas, Camila Vargas from UFRGS, Dirceu Pratissoli from UFES, Danielle Almeida from IRGA‐RS, Janaína Pereira dos Santos from Epagri, Janice Lopes from UFV and Dario Trujillo from UPR). To the Editorial UPR‐Experimental Agricultural System for revision.
APPENDIX A.
PRIMER SEQUENCE AND PCR CONDITIONS
| Primers | Primer sequence (5′ ‐> 3′) | PCR product size (bp) | PCR conditions (ºC/s) | ||||
|---|---|---|---|---|---|---|---|
| Initial Denat. | 35 cycles | Final Ext. | |||||
| Denat | Annel | Exten | |||||
| COIF (COI) | ATTCAACCAATCATAAAGATATTGG | 658 | 94/180 | 94/30 | 45/30 | 70/90 | 70/420 |
| COIR (COI) | TAAACTTCTGGATGTCCAAAAAATCA | ||||||
| A‐tLEU (COII) | ATGGCAGATTAGTGCAATGG | 687 | 94/180 | 94/30 | 55/30 | 72/60 | 72/480 |
| B‐tLYS (COII) | GTTTAAGAGACCAGTACTTG | ||||||
| Harm_CB_J (Cyt b) | CGTACCCTTCATGCTAACGGAGC | 557 | 94/180 | 94/30 | 55/30 | 72/60 | 72/480 |
| Harm_CB_N (Cyt b) | GGAGTTACTAATGGATTTGCTGGG | ||||||
| 3373Ha_Hz_ITS1‐F | GAGGAAGTAAAAGTCGTAACAAGGTTTCC | 147(Ha) e 334(Hz) | 95/180 | 95/30 | 60/30 | 72/60 | 72/300 |
| 3374Ha_ITS1‐R | CGTTCGACTCTGTGTCCTCTAGTGG | ||||||
| 3377Hz_ITS1‐R | TTGATTGTTAACGAACGCGCCG | ||||||
| nDNA‐DDC‐F1 | (NED)CGTCGAAGGCGCAAGATGATGTT | 206 | 95/180 | 95/60 | 53/60 | 72/60 | 72/600 |
| nDNA‐DDC‐R1 | GAGGAAGATATCCGCAATGGATTG | ||||||
| nDNA‐RpS6‐F | (VIC)AGCARGGCTTCCCSATGAARCAG | 274 | 95/180 | 95/60 | 55/60 | 72/60 | 72/600 |
| nDNA‐RpS6‐R | CTTTGACATCARCARACGAACACG | ||||||
| nDNA‐RpL11‐F | (6‐FAM)CTTTTTGAAAAGTTGTAATCATGG | 287 | 95/180 | 95/60 | 60/60 | 72/60 | 72/600 |
| nDNA‐RpL11‐R | CAACGCRGGCGGTKGTACACG | ||||||
Annel = annealing; Denat = denaturing; Exten = extension; Final Ext. = final extension; Initial Denat. = initial denaturing.
Fluorescent‐labeled forward primers. The NED™, VIC™ and 6‐FAM™ dye labels (Thermo Fisher Scientific Inc., Waltham, EUA) used are shown in the corresponding primer sequence at its 5′ end. Ha = H. armigera, Hz = H. zea.
APPENDIX B.
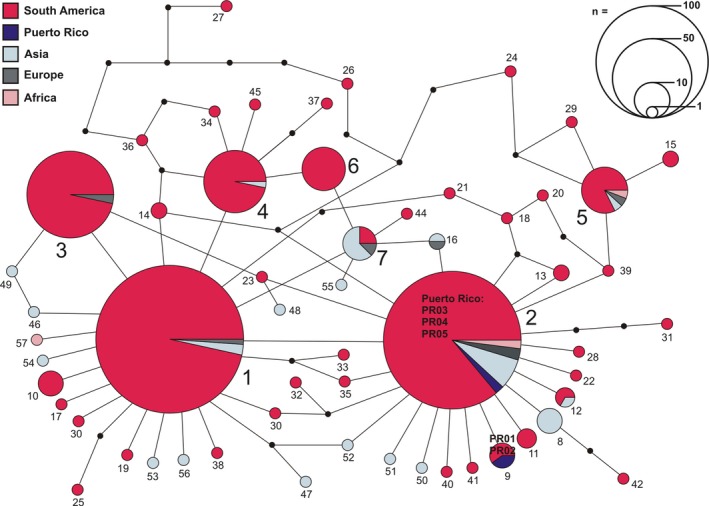
Parsimony haplotype network of COI 626 bp‐long mtDNA from 526 H. armigera sampled in the Americas (n = 470), Asia (n = 40), Europe (n = 11), and Africa (n = 5). Circles represent different haplotypes nominated in ascending order from most frequent to least frequent (1–57). Circles area is proportional to the number of individuals carrying this haplotype as shown by the scale at the top‐right. Colors in the circles indicate the proportional distribution of the continents in each haplotype, small black dots represent presumed, but unsampled haplotypes and the number of connection lines are proportional to number of mutational steps between any two different haplotypes. The five sequences found in Puerto Rico are indicated in the two corresponding haplotypes (2 and 9).
APPENDIX C.
Sharing of haplotypes based on cytochrome c oxidase subunit I (COI) among South America, Central America, Asia, Europe, and Africa continents.
| Haplotype (n) | Continent (n) | GenBank accession numbers | References |
|---|---|---|---|
| 1 (174) | South America (168) Asia (4) Europe (2) | AB620128, EU768935, FN907996, FN907997, GQ892847, GQ995232, KM274936, KM274939, KM274940, KM274958–KM274960, KM274964, KM274966–KM274969, KM274972, KM274975, KM274980, KM274981, KM274988, KM274989, KM274994, KM275046, KM275051, KM275052, KM275070, KM275073, KM275075, KM275078, KM275086, KM275088, KM275098, KM275099, KM275104, KM275106, KM275107, KM275108, KM275110, KM275111, KM275127, KM275134, KM275138, KM275140, KM275147, KM275148, KM275154, KM275156, KT828802–KT828827, KT828851–KT828889, KT828922–KT828929, KT828941–KT828943, KT828952, KT828953, KT828965, KT828966, KT828969, KT828971, KT828974, KT828975, KT828979, KT828985, KT828990, MG893742, MG893743, MG893746, MG893748, MG893750, MG893751, MG893754–MG893763, MG893778, MG893791, MG893792, MG893797, MG893798, MG893801, MG893803, MG893804, MG893812, MG893814, MG893815, MG893817–MG893819, MG893825, MG893831, MG893835, MG893836, MG893839, MG893840, MG893842, MG893752 | In this work, Leite et al. (2014), Li et al. (2011), Unpublished |
| 2 (151) | Central America (3) South America (130) Asia (11) Europe (4) Africa (3) | FN907995, FN908000, FN908003, FN908005, FN908011, FN908013–FN908015, FN908018, GQ892843, GQ892848, GQ892855, GQ995233–GQ995236, JX532104, KJ460247, KM274938, KM274943, KM274945, KM274946, KM274949, KM274950, KM274953, KM274961, KM274965, KM274970, KM274973, KM274974, KM274984–KM274987, KM274990, KM274992, KM274993, KM274995, KM274996, KM275040, KM275076, KM275081, KM275083, KM275084, KM275090, KM275091, KM275100, KM275103, KM275105, KM275152, KM275158, KT828763–KT828921, KT828937–KT828940, KT828947–KT828949, KT828958, KT828959, KT828968, KT828973, KT828976, KT828982, KT828991, MG893744, MG893745, MG893747, MG893753, MG893767, MG893777, MG893780, MG893782, MG893786, MG893788, MG893790, MG893795, MG893796, MG893800, MG893802, MG893805, MG893807, MG893821, MG893823, MG893824, MG893826, MG893827, MG893829, MG893834, MG893838, MG893843, MG893785 | In this work, Leite et al. (2014), Li et al. (2011), Unpublished |
| 3 (60) | South America (58) Europe (2) | FN908001, GU686757, KM274947, KM274957, KM274983, KM275039, KM275043, KM275047–KM275050, KM275072, KM275080, KM275085, KM275087, KM275089, KM275092, KM275097, KM275109, KM275137, KM275149, KM275150, KM275155, KM275157, KT828828‐KT828850, KT828967, KT828981, KT828989, MG893749, MG893776, MG893794, MG893799, MG893806, MG893809, MG893813, MG893822, MG893833, MG893841 | In this work, Leite et al. (2014), Unpublished |
| 4 (31) | South America (30) Asia (1) | GQ995242, KM274944, KM275202, KM275204–KM275206, KT828890–KT828901, MG893764–MG893766, MG893768–MG893772, MG893779, MG893781, MG893787, MG893816, MG893830 | In this work, Leite et al. (2014), Li et al. (2011) |
| 5 (17) | South America (14) Asia (1) Europe (1) Africa (1) | FN908002, FN908017, GQ892854, KM274963, KM274979, KM275074, KM275129, KM275130, KM275132, KT828944–KT828946, KT828964, KT828987, MG893793, MG893810, MG893811 | In this work, Leite et al. (2014), Li et al. (2011), Unpublished |
| 6 (15) | South America (15) | KM274971, KM275044, KM275071, KM275079, KT828930–KT828936, KT828972, MG893789, MG893832, MG893837 | In this work, Leite et al. (2014) |
| 7 (8) | South America (2) Asia (5) Europe (1) | FN907999, GQ892842, GQ995237, GQ995238, HM854928, HM854932, KM275112, KT828984 | In this work, Leite et al. (2014), Li et al. (2011), Unpublished |
| 8 (5) | Asia (5) | GQ892840, GQ892844, GQ892845, GQ892851, GQ892852 | Li et al. (2011) |
| 9 (5) | Central America (2) South America (3) | KT828956, KT828957, MG893783, MG893784, MG893820 | In this work |
| 10 (5) | South America (5) | KT828954, KT828955, MG893773–MG893775 | In this work |
| 11 (3) | South America (3) | KT828950, KT828951, MG893828 | In this work |
| 12 (3) | South America (2) Asia (1) | FN908016, KT828962, KT828963 | In this work, Unpublished |
| 13 (2) | South America (2) | KT828960, KT828961 | In this work |
| 14 (2) | South America (2) | KM274982, KM275153 | Leite et al. (2014) |
| 15 (2) | South America (2) | KM275128, KM275139 | Leite et al. (2014) |
| 16 (2) | Asia (1) Europe (1) | FN907998, HM854930 | Unpublished |
| 17 (1) | South America (1) | KM274937 | Leite et al. (2014) |
| 18 (1) | South America (1) | KM274941 | Leite et al. (2014) |
| 19 (1) | South America (1) | KM274948 | Leite et al. (2014) |
| 20 (1) | South America (1) | KM274951 | Leite et al. (2014) |
| 21 (1) | South America (1) | KM274952 | Leite et al. (2014) |
| 22 (1) | South America (1) | KM274962 | Leite et al. (2014) |
| 23 (1) | South America (1) | KM274991 | Leite et al. (2014) |
| 24 (1) | South America (1) | KM275038 | Leite et al. (2014) |
| 25 (1) | South America (1) | KM275041 | Leite et al. (2014) |
| 26 (1) | South America (1) | KM275042 | Leite et al. (2014) |
| 27 (1) | South America (1) | KM275045 | Leite et al. (2014) |
| 28 (1) | South America (1) | KM275077 | Leite et al. (2014) |
| 29 (1) | South America (1) | KM275082 | Leite et al. (2014) |
| 30 (1) | South America (1) | KM275101 | Leite et al. (2014) |
| 31 (1) | South America (1) | KM275102 | Leite et al. (2014) |
| 32 (1) | South America (1) | KM275131 | Leite et al. (2014) |
| 33 (1) | South America (1) | KM275133 | Leite et al. (2014) |
| 34 (1) | South America (1) | KM275135 | Leite et al. (2014) |
| 35 (1) | South America (1) | KM275136 | Leite et al. (2014) |
| 36 (1) | South America (1) | KM275151 | Leite et al. (2014) |
| 37 (1) | South America (1) | KM275203 | Leite et al. (2014) |
| 38 (1) | South America (1) | KT828970 | In this work |
| 39 (1) | South America (1) | KT828977 | In this work |
| 40 (1) | South America (1) | KT828978 | In this work |
| 41 (1) | South America (1) | KT828980 | In this work |
| 42 (1) | South America (1) | KT828983 | In this work |
| 43 (1) | South America (1) | KT828986 | In this work |
| 44 (1) | South America (1) | MG893808 | In this work |
| 45 (1) | South America (1) | KT828988 | In this work |
| 46 (1) | Asia (1) | GQ892846 | Li et al. (2011) |
| 47 (1) | Asia (1) | GQ892849 | Li et al. (2011) |
| 48 (1) | Asia (1) | GQ892850 | Li et al. (2011) |
| 49 (1) | Asia (1) | GQ892853 | Li et al. (2011) |
| 50 (1) | Asia (1) | GQ995239 | Li et al. (2011) |
| 51 (1) | Asia (1) | GQ995240 | Li et al. (2011) |
| 52 (1) | Asia (1) | GQ995241 | Li et al. (2011) |
| 53 (1) | Asia (1) | GQ995243 | Li et al. (2011) |
| 54 (1) | Asia (1) | GQ995244 | Li et al. (2011) |
| 55 (1) | Asia (1) | HM854929 | Unpublished |
| 56 (1) | Asia (1) | HM854931 | Unpublished |
| 57 (1) | Africa (1) | FN908006 | Unpublished |
APPENDIX D.
Estimates of haplotype and nucleotide diversity from 303 H. armigera based on COI, COII, and Cyt b concatenated mtDNA separated by collection sites.
| Region | Locality | N | Nhp | Hd | π | Transitions/transversions |
|---|---|---|---|---|---|---|
| AM | Santarém/PA | 1 | 1 | 1.000 ± 0.000 | 0.0000 ± 0.0000 | 0/0 |
| AM | Santarém/PA | 1 | 1 | 1.000 ± 0.000 | 0.0000 ± 0.0000 | 0/0 |
| AM | Boa Vista/RR | 11 | 8 | 0.927 ± 0.067 | 0.0019 ± 0.0012 | 13/1 |
| AM | Bonfim/RR | 3 | 2 | 0.667 ± 0.314 | 0.0045 ± 0.0036 | 10/1 |
| AM/CE | Vilhena/RO | 2 | 1 | 0.000 ± 0.000 | 0.0000 ± 0.0000 | 0/0 |
| AM/CE | Itapuã D'Oeste/RO | 2 | 2 | 1.000 ± 0.500 | 0.0030 ± 0.0033 | 5/0 |
| AM/CE | Porto Velho/RO | 3 | 3 | 1.000 ± 0.272 | 0.0024 ± 0.0021 | 4/2 |
| AM/CE | Seringueiras/RO | 1 | 1 | 1.000 ± 0.000 | 0.0000 ± 0.0000 | 0/0 |
| AM/CE | Rolim de Moura/RO | 2 | 2 | 1.000 ± 0.500 | 0.0024 ± 0.0027 | 4/0 |
| AM/CE | Ariquemes/RO | 1 | 1 | 1.000 ± 0.000 | 0.0000 ± 0.0000 | 0/0 |
| AM/CE | Parecis/RO | 1 | 1 | 1.000 ± 0.000 | 0.0000 ± 0.0000 | 0/0 |
| AM/CE | Cerejeiras/RO | 1 | 1 | 1.000 ± 0.000 | 0.0000 ± 0.0000 | 0/0 |
| AM/CE | Chupinguaia/RO | 3 | 3 | 1.000 ± 0.272 | 0.0024 ± 0.0021 | 6/0 |
| AM/CE | Espigão D'Oeste/RO | 3 | 3 | 1.000 ± 0.272 | 0.0020 ± 0.0018 | 5/0 |
| AM/CE | Alto Alegre dos Parecis/RO | 2 | 2 | 1.000 ± 0.500 | 0.0043 ± 0.0045 | 7/0 |
| AM/CE | Pimenteiras D'Oeste/RO | 1 | 1 | 1.000 ± 0.000 | 0.0000 ± 0.0000 | 0/0 |
| CE/CA | Cruz das Almas/BA | 2 | 2 | 1.000 ± 0.500 | 0.0024 ± 0.0027 | 4/0 |
| CE/CA | Balsas/MA | 28 | 16 | 0.913 ± 0.038 | 0.0023 ± 0.0013 | 31/2 |
| CE/CA | Riachão das Neves/BA | 5 | 4 | 0.900 ± 0.161 | 0.0013 ± 0.0010 | 5/0 |
| CE/CA | Luis Eduardo Magalhães/BA | 2 | 2 | 1.000 ± 0.500 | 0.0091 ± 0.0094 | 14/1 |
| CE/CA | Bom Jesus/PI | 11 | 6 | 0.873 ± 0.071 | 0.0015 ± 0.0010 | 8/0 |
| CE/CA | Luis Eduardo Magalhães/BA | 1 | 1 | 1.000 ± 0.000 | 0.0000 ± 0.0000 | 0/0 |
| CE/CA | Luis Eduardo Magalhães/BA | 2 | 2 | 1.000 ± 0.500 | 0.0024 ± 0.0027 | 4/0 |
| CE/CA | Luis Eduardo Magalhães/BA | 1 | 1 | 1.000 ± 0.000 | 0.0000 ± 0.0000 | 0/0 |
| CE/CA | Luis Eduardo Magalhães/BA | 1 | 1 | 1.000 ± 0.000 | 0.0000 ± 0.0000 | 0/0 |
| CE/CA | Luis Eduardo Magalhães/BA | 1 | 1 | 1.000 ± 0.000 | 0.0000 ± 0.0000 | 0/0 |
| CE/CA | Correntina/BA | 1 | 1 | 1.000 ± 0.000 | 0.0000 ± 0.0000 | 0/0 |
| CE/CA | Correntina/BA | 2 | 2 | 1.000 ± 0.500 | 0.0030 ± 0.0033 | 5/0 |
| CE/CA | Correntina/BA | 1 | 1 | 1.000 ± 0.000 | 0.0000 ± 0.0000 | 0/0 |
| CE/CA | Rosário/BA | 2 | 2 | 1.000 ± 0.500 | 0.0085 ± 0.0088 | 13/1 |
| CE/CA | Uruçuí/PI | 39 | 16 | 0.906 ± 0.027 | 0.0016 ± 0.0010 | 20/0 |
| CE/CA | Luis Eduardo Magalhães/BA | 19 | 3 | 0.573 ± 0.061 | 0.0010 ± 0.0007 | 4/0 |
| CE/CA | Palmas/TO | 6 | 4 | 0.800 ± 0.172 | 0.0010 ± 0.0008 | 5/0 |
| CE | Iraí de Minas/MG | 1 | 1 | 1.000 ± 0.000 | 0.0000 ± 0.0000 | 0/0 |
| CE | Monte Carmelo/MG | 12 | 8 | 0.924 ± 0.058 | 0.0020 ± 0.0012 | 11/0 |
| CE | Nova Ponte/MG | 4 | 4 | 1.000 ± 0.177 | 0.0022 ± 0.0017 | 7/0 |
| CE | Costa Rica/MS | 4 | 4 | 1.000 ± 0.177 | 0.0018 ± 0.0014 | 6/0 |
| CE | Paraíso das Águas/MS | 4 | 4 | 1.000 ± 0.177 | 0.0054 ± 0.0038 | 16/1 |
| CE | Rondonópolis/MT | 5 | 5 | 1.000 ± 0.127 | 0.0017 ± 0.0013 | 7/0 |
| CE | Palminópolis/GO | 1 | 1 | 1.000 ± 0.000 | 0.0000 ± 0.0000 | 0/0 |
| CE | Palmeiras de Goiás/GO | 1 | 1 | 1.000 ± 0.000 | 0.0000 ± 0.0000 | 0/0 |
| CE | Palmeiras de Goiás/GO | 1 | 1 | 1.000 ± 0.000 | 0.0000 ± 0.0000 | 0/0 |
| CE | Morrinhos/GO | 2 | 2 | 1.000 ± 0.500 | 0.0024 ± 0.0027 | 4/0 |
| CE | Morrinhos/GO | 1 | 1 | 1.000 ± 0.000 | 0.0000 ± 0.0000 | 0/0 |
| CE | Morrinhos/GO | 3 | 3 | 1.000 ± 0.272 | 0.0016 ± 0.0015 | 4/0 |
| CE | Morrinhos/GO | 1 | 1 | 1.000 ± 0.000 | 0.0000 ± 0.0000 | 0/0 |
| CE | Morrinhos/GO | 5 | 5 | 1.000 ± 0.127 | 0.0018 ± 0.0013 | 6/1 |
| CE | Santo Antônio de Goiás/GO | 1 | 1 | 1.000 ± 0.000 | 0.0000 ± 0.0000 | 0/0 |
| CE | Primavera do Leste/MT | 6 | 2 | 0.600 ± 0.129 | 0.0015 ± 0.0011 | 4/0 |
| AT | Santa Gertrudes/SP | 1 | 1 | 1.000 ± 0.000 | 0.0000 ± 0.0000 | 0/0 |
| AT | Engenheiro Coelho/SP | 1 | 1 | 1.000 ± 0.000 | 0.0000 ± 0.0000 | 0/0 |
| AT | Ribeirão Preto/SP | 12 | 7 | 0.909 ± 0.056 | 0.0013 ± 0.0008 | 6/1 |
| AT | Campos de Holambra/SP | 23 | 10 | 0.889 ± 0.037 | 0.0021 ± 0.0012 | 14/0 |
| AT | Pedrinhas Paulista/SP | 2 | 2 | 1.000 ± 0.500 | 0.0018 ± 0.0021 | 3/0 |
| AT | Cândido Mota/SP | 2 | 2 | 1.000 ± 0.500 | 0.0024 ± 0.0027 | 4/0 |
| AT | Palmital/SP | 1 | 1 | 1.000 ± 0.000 | 0.0000 ± 0.0000 | 0/0 |
| AT | Alegre/ES | 3 | 1 | 0.000 ± 0.000 | 0.0000 ± 0.0000 | 0/0 |
| AT | Alto Parana/Paraguay | 6 | 4 | 0.800 ± 0.172 | 0.0020 ± 0.0014 | 7/0 |
| AT | Caçador/SC | 5 | 5 | 1.000 ± 0.127 | 0.0050 ± 0.0033 | 18/1 |
| PA | Itaara/RS | 3 | 3 | 1.000 ± 0.272 | 0.0077 ± 0.0060 | 18/1 |
| PA | Cachoeirinha/RS | 1 | 1 | 1.000 ± 0.000 | 0.0000 ± 0.0000 | 0/0 |
| PA | Cachoeira do Sul/RS | 1 | 1 | 1.000 ± 0.000 | 0.0000 ± 0.0000 | 0/0 |
| PA | Pelotas/RS | 3 | 3 | 1.000 ± 0.272 | 0.0020 ± 0.0018 | 5/0 |
| PA | Barra do Ribeiro/RS | 6 | 6 | 1.000 ± 0.096 | 0.0047 ± 0.0029 | 20/1 |
| PA | Osório/RS | 2 | 2 | 1.000 ± 0.500 | 0.0030 ± 0.0033 | 5/0 |
| PA | Camaquã/RS | 9 | 9 | 1.000 ± 0.052 | 0.0019 ± 0.0012 | 12/0 |
| PA | São Lourenço do Sul/RS | 2 | 2 | 1.000 ± 0.500 | 0.0091 ± 0.0094 | 14/1 |
| PA | Monte Redondo/Tucuman/Argentina | 2 | 2 | 1.000 ± 0.500 | 0.0030 ± 0.0033 | 5/0 |
| Puerto Rico | Puerto Rico | 4 | 2 | 0.667 ± 0.204 | 0.0016 ± 0.0013 | 4/0 |
| Total | 303 | 54 | 0.926 ± 0.006 | 0.0023 ± 0.0013 | 49/6 |
Nhp = number of haplotypes; Hd = haplotype diversity; π = nucleotide diversity; Total groups all localities in one locality.
AM/CE: Amazon Forest transition with Cerrado; AM: Amazon Forest; AT: Atlantic Forest; CE/CA: Cerrado transition with Caatinga; CE: Cerrado; PA: Pampas.
APPENDIX E.
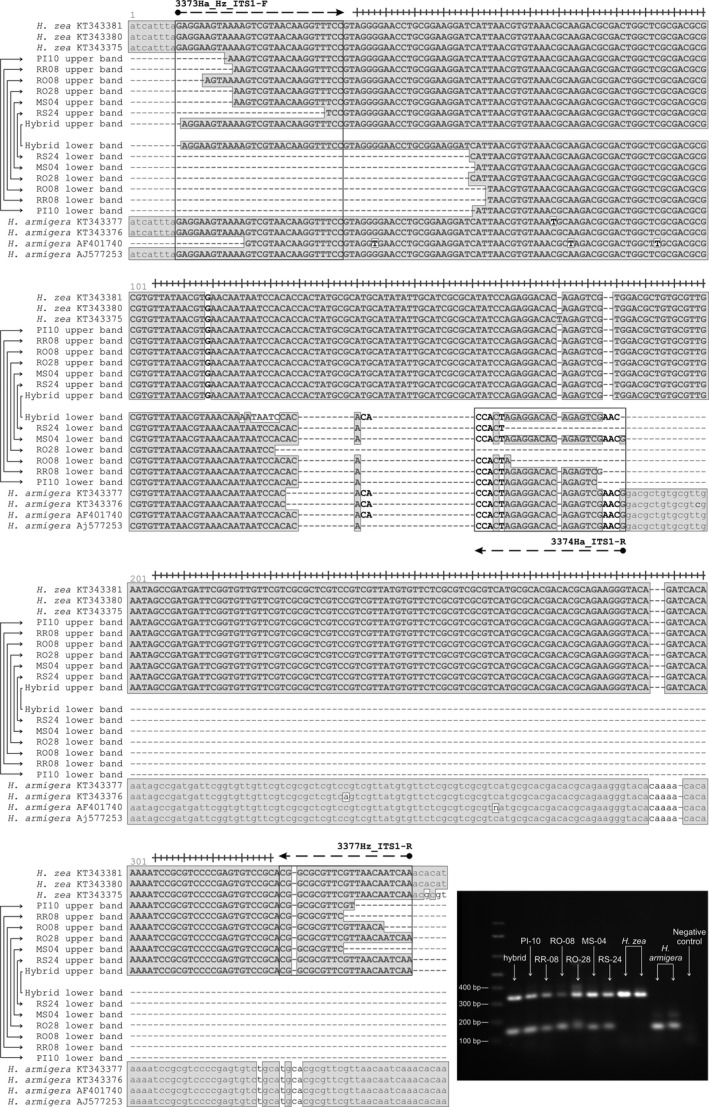
Putative hybrids. Alignment of two distinct sequences of ITS1 obtained from each of the six individuals previously identified by the sequencing of the mtDNA COI gene as H. armigera (GenBank accession numbers: MG893729–MG893735 and Appendix F). In the first 10 rows, six sequences of approximately 334 bp are aligned with three ITS1 of H. zea and one hybrid obtained in laboratory. In the next eleven lines, six sequences of approximately 147 bp amplified from the same individuals are aligned with ITS1 sequences of H. armigera and the same hybrid used above. The shaded area is where the bases are equal, in bold and upper case are the amplicons, hyphen are bases not sequenced or indels and squares with the dashed arrows represent the three primers used. Electrophoresis gel of ITS1 from putative hybrids between H. armigera and H. zea is shown on the bottom and right. The first sample is one hybrid obtained in laboratory (MG893729 and Appendix F), the next six samples are individuals collected in field that also presented the same two bands pattern relative to H. armigera and H. zea (confirmed by sequencing: MG893730–MG893735 and Appendix F). The following four samples refer to two H. zea and two H. armigera individuals which presented the expected band pattern for each species.
APPENDIX F.
Short sequences of six samples that matched >98% with H. armigera ITS1: PI10, RR08, RO08, RO28, MS04, RS24, two H. armigera from an electrophoresis gel (Appendix E) and one hybrid obtained in laboratory organized in a FASTA file format. Because the sequences are <200 bp, GenBank does not accept their submission. The accession numbers of the sequences that matched >98% with H. zea from these samples are MG893729–MG893735.
>Helicoverpa armigera/H. zea Hybrid born in laboratory, Internal transcribed spacer 1 (ITS1) lower band.
AGGAAGTAAAAGTCGTAACAAGGTTTCCGTAGGGGAACCTGCGGAAGGATCATTAACGTGTAAACGCAAGACGCGACTGGCTCGCGACGCGCGTGTTATAACGTAAACAAAATAATCCACACACCACTAGAGGACACAGAGTCGAAC
>Helicoverpa armigera/H. zea RO28 Internal transcribed spacer 1 (ITS1) lower band.
CATTAACGTGTAAACGCAAGACGCGACTGGCTCGCGACGCGCGTGTTATAACGTAAACAATAATCC
>Helicoverpa armigera/H. zea MS04 Internal transcribed spacer 1 (ITS1) lower band.
ATTAACGTGTAAACGCAAGACGCGACTGGCTCGCGACGCGCGTGTTATAACGTAAACAATAATCCACACACCACTAGAGGACACAGAGTCGAACG
>Helicoverpa armigera/H. zea PI10 Internal transcribed spacer 1 (ITS1) lower band.
ATTAACGTGTAAACGCAAGACGCGACTGGCTCGCGACGCGCGTGTTATAACGTAAACAATAATCCACACACCACTAGAGGACACAGAGTC
>Helicoverpa armigera/H. zea RR08 Internal transcribed spacer 1 (ITS1) lower band.
TAACGTGTAAACGCAAGACGCGACTGGCTCGCGACGCGCGTGTTATAACGTAAACAATAATCCACACACCACTAGAGGACACAGAGTCG
>Helicoverpa armigera/H. zea RS24 Internal transcribed spacer 1 (ITS1) lower band.
CATTAACGTGTAAACGCAAGACGCGACTGGCTCGCGACGCGCGTGTTATAACGTAAACAATAATCCACACACCACT
>Helicoverpa armigera/H. zea RO08 Internal transcribed spacer 1 (ITS1) lower band.
TAACGTGTAAACGCAAGACGCGACTGGCTCGCGACGCGCGTGTTATAACGTAAACAATAATCCACACACCACTA
>H.armigera_gel_ITS1_Hsp1
AAGTAAAAGTCGTAACAAGGTTTCCGTAGGGGAACCTGCGGAAGGATCATTAACGTGTAAACGCAAGACGCGACTGGCTCGCGACGCGCGTGTTATAACGTAAACAATAATCCACACACCACTAGAGGACACAGAGTCGAACGA
>H.armigera_gel_ITS1_Hs75
TAACGTGTAAACGCAAGACGCGACTGGCTCGCGACGCGCGTGTTATAACGTAAACAATAATCCACACAC
Gonçalves RM, Mastrangelo T, Rodrigues JCV, et al. Invasion origin, rapid population expansion, and the lack of genetic structure of cotton bollworm (Helicoverpa armigera) in the Americas. Ecol Evol. 2019;9:7378–7401. 10.1002/ece3.5123
DATA ACCESSIBILITY
All COI, COII, Cyt b, and ITS1 sequences used in this study were deposited in the NCBI database under accession number (KT828763–KT829449 and MG893581–MG893843). The detailed information about the sequences and all scripts used in ABC analysis are available at the public Dryad Digital Repository: https://doi.org/10.5061/dryad.rd1570s.
REFERENCES
- Ab'Saber, A. N. (1967). Domínios morfoclimáticos e províncias fitogeográficas no Brasil. Orientação, 3, 45–48. [Google Scholar]
- Albernaz, K. C. , Silva‐Brandão, K. L. , Fresia, P. , Cônsoli, F. L. , & Omoto, C. (2012). Genetic variability and demographic history of Heliothis virescens (Lepidoptera: Noctuidae) populations from Brazil inferred by mtDNA sequences. Bulletin of Entomological Research, 102, 333–343. 10.1017/S0007485311000678 [DOI] [PubMed] [Google Scholar]
- Anderson, C. J. , Oakeshott, J. G. , Tay, W. T. , Gordon, K. H. , Zwick, A. , & Walsh, T. K. (2018). Hybridization and gene flow in the mega‐pest lineage of moth, Helicoverpa . Proceedings of the National Academy of Sciences of the United States of America, 115, 5034–5039. 10.1073/pnas.1718831115 [DOI] [PMC free article] [PubMed] [Google Scholar]
- Anderson, C. J. , Tay, W. T. , McGaughran, A. , Gordon, K. , & Walsh, T. K. (2016). Population structure and gene flow in the global pest, Helicoverpa armigera . Molecular Ecology, 25, 5296–5311. 10.1111/mec.13841 [DOI] [PubMed] [Google Scholar]
- APHIS (Animal and Plant Health Inspection Service), USDA . (2015). Detection of old world bollworm (Helicoverpa armigera) in Florida. Retrieved from https://www.aphis.usda.gov/plant_health/plant_pest_info/owb/downloads/DA-2015-43.pdf. Accessed 20 July 2016. [Google Scholar]
- Arnemann, J. A. , James, W. J. , Walsh, T. K. , Guedes, J. V. C. , Smagghe, G. , Castiglioni, E. , & Tay, W. T. (2016). Mitochondrial DNA COI characterization of Helicoverpa armigera (Lepidoptera: Noctuidae) from Paraguay and Uruguay. Genetics and Molecular Research, 15, gmr.15028292. 10.4238/gmr.15028292 [DOI] [PubMed] [Google Scholar]
- Barbosa, L. D. F. , Yuki, V. A. , Marubayashi, J. M. , De Marchi, B. R. , Perini, F. L. , Pavan, M. A. , … Krause‐Sakate, R. (2015). First report of Bemisia tabaci Mediterranean (Q biotype) species in Brazil. Pest Management Science, 71, 501–504. 10.1002/ps.3909 [DOI] [PubMed] [Google Scholar]
- Behere, G. T. , Tay, W. T. , Russell, D. A. , Heckel, D. G. , Appleton, B. R. , Kranthi, K. R. , & Batterham, P. (2007). Mitochondrial DNA analysis of field populations of Helicoverpa armigera (Lepidoptera: Noctuidae) and of its relationship to H. zea . BMC Evolutionary Biology, 7, 117 10.1186/1471-2148-7-117 [DOI] [PMC free article] [PubMed] [Google Scholar]
- Behere, G. T. , Tay, W. T. , Russell, D. A. , Kranthi, K. R. , & Batterham, P. (2013). Population genetic structure of the cotton bollworm Helicoverpa armigera (Hubner) (Lepidoptera: Noctuidae) in India as inferred from EPCI‐PCR DNA markers. PLoS ONE, 8, e53448 10.1371/journal.pone.0053448 [DOI] [PMC free article] [PubMed] [Google Scholar]
- Biondi, A. , Guedes, R. N. C. , Wan, F. H. , & Desneux, N. (2018). Ecology, worldwide spread, and management of the invasive South American tomato pinworm, Tuta absoluta: Past, present, and future. Annual Review of Entomology, 63, 239–258. 10.1146/annurev-ento-031616-034933 [DOI] [PubMed] [Google Scholar]
- Camargo, A. , Morando, M. , Avila, L. J. , & Sites, J. W. Jr (2012). Species delimitation with ABC and other coalescent‐based methods: A test of accuracy with simulations and an empirical example with lizards of the Liolaemus darwinii complex (Squamata: Liolaemidae). Evolution, 66, 2834–2849. 10.1111/j.1558-5646.2012.01640.x [DOI] [PubMed] [Google Scholar]
- Cesari, M. , Maistrello, L. , Piemontese, L. , Bonini, R. , Dioli, P. , Lee, W. , … Guidetti, R. (2017). Genetic diversity of the brown marmorated stink bug Halyomorpha halys in the invaded territories of Europe and its patterns of diffusion in Italy. Biological Invasions, 20, 1073–1092. 10.1007/s10530-017-1611-1 [DOI] [Google Scholar]
- Chakroun, M. , Banyuls, N. , Walsh, T. , Downes, S. , James, B. , & Ferré, J. (2016). Characterization of the resistance to Vip3Aa in Helicoverpa armigera from Australia and the role of midgut processing and receptor binding. Scientific Reports, 6, 24311 10.1038/srep24311 [DOI] [PMC free article] [PubMed] [Google Scholar]
- Cho, S. , Mitchell, A. , Mitter, C. , Regier, J. , Matthews, M. , & Robertson, R. (2008). Molecular phylogenetics of heliothine moths (Lepidoptera: Noctuidae: Heliothinae), with comments on the evolution of host range and pest status. Systematic Entomology, 33, 581–594. 10.1111/j.1365-3113.2008.00427.x [DOI] [Google Scholar]
- Clement, M. , Posada, D. C. K. A. , & Crandall, K. A. (2000). TCS: A computer program to estimate gene genealogies. Molecular Ecology, 9, 1657–1659. 10.1046/j.1365-294x.2000.01020.x [DOI] [PubMed] [Google Scholar]
- Csilléry, K. , Blum, M. G. B. , Gaggiotti, O. E. , & François, O. (2010). Approximate Bayesian Computation (ABC) in practice. Trends in Ecology & Evolution, 25, 410–418. 10.1016/j.tree.2010.04.001 [DOI] [PubMed] [Google Scholar]
- Csilléry, K. , François, O. , & Blum, M. G. (2012). abc: An R package for approximate Bayesian computation (ABC). Methods in Ecology and Evolution, 3, 475–479. 10.1111/j.2041-210X.2011.00179.x [DOI] [PubMed] [Google Scholar]
- Czepak, C. , Albernaz, K. C. , Vivan, L. M. , Guimarães, H. O. , & Carvalhais, T. (2013). First reported occurrence of Helicoverpa armigera (Hübner) (Lepidoptera: Noctuidae) in Brazil. Pesquisa Agropecuária Tropical, 43, 110–113. 10.1590/S1983-40632013000100015 [DOI] [Google Scholar]
- di Castri, F. (1989). History of biological invasions with emphasis on the Old World In Drake J., di Castri F., Groves R., Kruger F., Mooney H. A., Rejmanek M., & Williamson M. (Eds.), Biological invasions: A global perspective (pp. 1–30). New York, NY: Wiley. [Google Scholar]
- Downes, S. , Walsh, T. , & Tay, W. T. (2016). Bt resistance in Australian insect pest species. Current Opinion in Insect Science, 15, 78–83. 10.1016/j.cois.2016.04.002 [DOI] [PubMed] [Google Scholar]
- Durigan, M. R. , Corrêa, A. S. , Pereira, R. M. , Leite, N. A. , Amado, D. , de Sousa, D. R. , & Omoto, C. (2017). High frequency of CYP337B3 gene associated with control failures of Helicoverpa armigera with pyrethroid insecticides in Brazil. Pesticide Biochemistry and Physiology, 143, 73–80. 10.1016/j.pestbp.2017.09.005 [DOI] [PubMed] [Google Scholar]
- EMBRAPA (Empresa Brasileira de Pesquisa Agropecuária) (2013). Ações emergenciais propostas pela Embrapa para o manejo integrado de Helicoverpa spp. em áreas agrícolas. Brasília, DF, Brazil, 19 pp. [Google Scholar]
- Endersby, N. M. , Hoffmann, A. A. , McKechnie, S. W. , & Weeks, A. R. (2007). Is there genetic structure in populations of Helicoverpa armigera from Australia? Entomologia Experimentalis et Applicata, 122, 253–263. 10.1111/j.1570-7458.2006.00515.x [DOI] [Google Scholar]
- Excoffier, L. , & Lischer, H. E. L. (2010). Arlequin suite ver 3.5: A new series of programs to perform population genetics analyses under Linux and Windows. Molecular Ecology Resources, 10, 564–567. 10.1111/j.1755-0998.2010.02847.x [DOI] [PubMed] [Google Scholar]
- Fagundes, N. J. R. , Ray, N. , Beaumont, M. , Neuenschwander, S. , Salzano, F. M. , Bonatto, S. L. , & Excoffier, L. (2007). Statistical evaluation of alternative models of human evolution. Proceedings of the National Academy of Sciences of the United States of America, 104, 17614–17619. 10.1073/pnas.0708280104 [DOI] [PMC free article] [PubMed] [Google Scholar]
- Fitt, G. P. (1989). The ecology of Heliothis species in relation to agroecosystems. Annual Review of Entomology, 34, 17–52. 10.1146/annurev.en.34.010189.000313 [DOI] [Google Scholar]
- Fraimout, A. , Debat, V. , Fellous, S. , Hufbauer, R. A. , Foucaud, J. , Pudlo, P. , … Estoup, A. (2017). Deciphering the Routes of invasion of Drosophila suzukii by Means of ABC Random Forest. Molecular Biology and Evolution, 34, 980–996. 10.1093/molbev/msx050 [DOI] [PMC free article] [PubMed] [Google Scholar]
- Fresia, P. , Lyra, M. L. , Coronado, A. , & Azeredo‐Espin, A. M. L. (2011). Genetic structure and demographic history of new world screwworm across its current geographic range. Journal of Medical Entomology, 48, 280–290. 10.1603/ME10153 [DOI] [PubMed] [Google Scholar]
- Fu, Y. X. (1997). Statistical tests of neutrality of mutations against population growth, hitchhiking and background selection. Genetics, 147, 915–925. [DOI] [PMC free article] [PubMed] [Google Scholar]
- Ge, F. , Chen, F. , Parajulee, M. N. , & Yardim, E. N. (2005). Quantification of diapausing fourth generation and suicidal fifth generation cotton bollworm, Helicoverpa armigera, in cotton and corn in northern China. Entomologia Experimentalis et Applicata, 116, 1–7. 10.1111/j.1570-7458.2005.00305.x [DOI] [Google Scholar]
- Genton, B. J. , Shykoff, J. A. , & Giraud, T. (2005). High genetic diversity in French invasive populations of common ragweed, Ambrosia artemisiifolia, as a result of multiple sources of introduction. Molecular Ecology, 14, 4275–4285. 10.1111/j.1365-294X.2005.02750.x [DOI] [PubMed] [Google Scholar]
- Gerrero, V. (2009). Puerto Rico GM crop haven. Nature Biotechnology, 27, 970 10.1038/nbt1109-970a [DOI] [Google Scholar]
- Goudet, J. (1995). FSTAT (version 1.2): A computer program to calculate F‐statistics. Journal of Heredity, 86, 485–486. 10.1093/oxfordjournals.jhered.a111627 [DOI] [Google Scholar]
- Grapputo, A. , Boman, S. , Lindstroem, L. , Lyytinen, A. , & Mappes, J. (2005). The voyage of an invasive species across continents: Genetic diversity of North American and European Colorado potato beetle populations. Molecular Ecology, 14, 4207–4219. 10.1111/j.1365-294X.2005.02740.x [DOI] [PubMed] [Google Scholar]
- Guo, S. W. , & Thompson, E. A. (1992). Performing the exact test of Hardy‐Weinberg proportion for multiple alleles. Biometrics, 48, 361–372. 10.2307/2532296 [DOI] [PubMed] [Google Scholar]
- Han, Y. , Yu, W. , Zhang, W. , Yang, Y. , Walsh, T. , Oakeshott, J. G. , & Wu, Y. (2015). Variation in P450‐mediated fenvalerate resistance levels is not correlated with CYP337B3 genotype in Chinese populations of Helicoverpa armigera . Pesticide Biochemistry and Physiology, 121, 129–135. 10.1016/j.pestbp.2014.12.004 [DOI] [PubMed] [Google Scholar]
- Hardwick, D. F. (1965). The corn earworm complex. The Memoirs of the Entomological Society of Canada, 97, 5–247. 10.4039/entm9740fv [DOI] [Google Scholar]
- Hayden, J. E. , & Brambila, J . (2015). Helicoverpa armigera (Lepidoptera: Noctuidae), the old world bollworm. Pest alert, Florida Department of Agriculture and Consumer Services, division of plant industry; Jun. Report No.: FDACS‐02039. Retrieved from http://www.freshfromflorida.com/Divisions-Offices/Plant-Industry/Plant-Industry-Publications/Pest-Alerts/Pest-Alert-The-Old-World-Bollworm. Accessed 15 June 2016.
- Hudson, R. R. (2002). Generating samples under a Wright‐Fisher neutral model. Bioinformatics, 18, 337–338. 10.1093/bioinformatics/18.2.337 [DOI] [PubMed] [Google Scholar]
- IBGE (Instituto Brasileiro de Geografia e Estatística). (2016). Retrieved from ftp://geoftp.ibge.gov.br/informacoes_ambientais/vegetacao/mapas/brasil/biomas.pdf. Accessed 07 July 2016. [Google Scholar]
- Joußen, N. , & Heckel, D. G. (2016). Resistance mechanisms of Helicoverpa armigera In Horowitz A. R., & Ishaaya I. (Eds.), Advances in insect control and resistance management (pp. 241–261). Berlin, Germany: Springer. [Google Scholar]
- Laster, M. L. , & Hardee, D. D. (1995). Intermating compatibility between North American Helicoverpa zea and Heliothis armigera (Lepidoptera: Noctuidae) from Russia. Journal of Economic Entomology, 88, 77–80. 10.1093/jee/88.1.77 [DOI] [Google Scholar]
- Laster, M. L. , & Sheng, C. F. (1995). Search for hybrid sterility for Helicoverpa zea in crosses between the North American H. zea and H. armigera (Lepidoptera: Noctuidae) from China. Journal of Economic Entomology, 88, 1288–1291. 10.1093/jee/88.5.1288 [DOI] [Google Scholar]
- Lawson Handley, L.‐J. , Estoup, A. , Evans, D. M. , Thomas, C. E. , Lombaert, E. , Facon, B. , … Roy, H. E. (2011). Ecological genetics of invasive alien species. BioControl, 56, 409–428. 10.1007/s10526-011-9386-2 [DOI] [Google Scholar]
- Lee, C. E. (2002). Evolutionary genetics of invasive species. Trends in Ecology & Evolution, 17, 386–391. 10.1016/S0169-5347(02)02554-5 [DOI] [Google Scholar]
- Leite, N. A. , Alves‐Pereira, A. , Corrêa, A. S. , Zucchi, M. I. , & Omoto, C. (2014). Demographics and genetic variability of the new world bollworm (Helicoverpa zea) and the old world bollworm (Helicoverpa armigera) in Brazil. PloS ONE, 9, e113286 10.1371/journal.pone.0113286 [DOI] [PMC free article] [PubMed] [Google Scholar]
- Leite, N. A. , Corrêa, A. S. , Michel, A. P. , Alves‐Pereira, A. , Pavinato, P. V. A. , Zucchi, M. I. , & Omoto, C. (2017). Pan‐American similarities in genetic structures of Helicoverpa armigera and Helicoverpa zea with implications for hybridization. Environmental Entomology, 46, 1024–1034. 10.1093/ee/nvx088 [DOI] [PubMed] [Google Scholar]
- Leite, N. A. , Pereira, R. M. , Durigan, M. R. , Amado, D. , Fatoretto, J. , Medeiros, F. C. L. , & Omoto, C. (2017). Susceptibility of Brazilian populations of Helicoverpa armigera and Helicoverpa zea (Lepidoptera: Noctuidae) to Vip3Aa20. Journal of Economic Entomology, 111, 399–404. 10.1093/jee/tox336 [DOI] [PubMed] [Google Scholar]
- Lewontin, R. C. , & Birch, L. C. (1966). Hybridization as a source of variation for adaptation to new environments. Evolution, 20, 315–336. 10.2307/2406633 [DOI] [PubMed] [Google Scholar]
- Li, Q. Q. , Li, D. Y. , Ye, H. , Liu, X. F. , Shi, W. , Cao, N. , & Duan, Y. Q. (2011). Using COI gene sequence to barcode two morphologically alike species: The cotton bollworm and the oriental tobacco budworm (Lepidoptera: Noctuidae). Molecular Biology Reports, 38, 5107–5113. 10.1007/s11033-010-0658-1 [DOI] [PubMed] [Google Scholar]
- Librado, P. , & Rozas, J. (2009). DnaSP v5: A software for comprehensive analysis of DNA polymorphism data. Bioinformatics, 25, 1451–1452. 10.1093/bioinformatics/btp187 [DOI] [PubMed] [Google Scholar]
- Liu, H. , & Beckenbach, A. T. (1992). Evolution of the mitochondrial cytochrome oxidase II gene among 10 orders of insects. Molecular Phylogenetics and Evolution, 1, 41–52. 10.1016/1055-7903(92)90034-E [DOI] [PubMed] [Google Scholar]
- Lombaert, E. , Guillemaud, T. , Cornuet, J. M. , Malausa, T. , Facon, B. , & Estoup, A. (2010). Bridgehead effect in the worldwide invasion of the biocontrol Harlequin ladybird. PLoS ONE, 5, e9743 10.1371/journal.pone.0009743 [DOI] [PMC free article] [PubMed] [Google Scholar]
- Lopes‐da‐Silva, M. , Sanches, M. M. , Stancioli, A. R. , Alves, G. , & Sugayama, R. (2014). The role of natural and human‐mediated pathways for invasive agricultural pests: A historical analysis of cases from Brazil. Agricultural Sciences, 5, 634–646. 10.4236/as.2014.57067 [DOI] [Google Scholar]
- Lyra, M. L. , Klaczko, L. B. , & Azeredo‐Espin, A. M. L. (2009). Complex patterns of genetic variability in populations of the new world screwworm fly revealed by mitochondrial DNA markers. Medical and Veterinary Entomology, 23, 32–42. 10.1111/j.1365-2915.2008.00776.x [DOI] [PubMed] [Google Scholar]
- Mallet, J. , Korman, A. , Heckel, D. , & King, P. (1993). Biochemical genetics of Heliothis and Helicoverpa (Lepidoptera: Noctuidae) and evidence for a founder event in Helicoverpa zea . Annals of the Entomological Society of America, 86, 189–197. 10.1093/aesa/86.2.189 [DOI] [Google Scholar]
- Mastrangelo, T. , Paulo, D. F. , Bergamo, L. W. , Morais, E. G. F. , Silva, M. , Bezerra‐Silva, A. G. , & Azeredo‐Espin, A. M. L. (2014). Detection and genetic diversity of a heliothine invader from North and Northeast of Brazil. Journal of Economic Entomology, 107, 970–980. 10.1603/EC13403 [DOI] [PubMed] [Google Scholar]
- Mesgaran, M. B. , Lewis, M. A. , Ades, P. K. , Donohue, K. , Ohadi, S. , Li, C. , & Cousens, R. D. (2016). Hybridization can facilitate species invasions, even without enhancing local adaptation. Proceedings of the National Academy of Sciences of the United States of America, 113, 10210–10214. 10.1073/pnas.1605626113 [DOI] [PMC free article] [PubMed] [Google Scholar]
- Murúa, M. G. , Scalora, F. S. , Navarro, F. R. , Cazado, L. E. , Casmuz, A. , Villagrán, M. E. , … Gastaminza, G. (2014). First record of Helicoverpa armigera (Lepidoptera: Noctuidae) in Argentina. Florida Entomologist, 97, 854–856. 10.1653/024.097.0279 [DOI] [Google Scholar]
- Nagoshi, R. N. , Fleischer, S. , Meagher, R. L. , Hay‐Roe, M. , Khan, A. , Murúa, M. G. , … Westbrook, J. (2017). Fall armyworm migration across the Lesser Antilles and the potential for genetic exchanges between North and South American populations. PloS ONE, 12, e0171743 10.1371/journal.pone.0171743 [DOI] [PMC free article] [PubMed] [Google Scholar]
- NAPPO (North American Plant Protection Organization) (2014). Detection of old world bollworm (Helicoverpa armigera) in Puerto Rico. NAPPO Phytosanitary Alert System. Retrieved fromhttp://www.pestalert.org/oprDetail.cfm?oprID%C2%BC600
- Naseri, B. , Fathipour, Y. , Moharramipour, S. , & Hosseininaveh, V. (2011). Comparative reproductive performance of Helicoverpa armigera (Hübner) (Lepidoptera: Noctuidae) reared on thirteen soybean varieties. Journal of Agricultural Science and Technology, 13, 17–26. [Google Scholar]
- Nei, M. (1987). Molecular evolutionary genetics. New York, NY: Columbia University Press. [Google Scholar]
- Nibouche, S. , Bues, R. , Toubon, J. F. , & Poitout, S. (1998). Allozyme polymorphisms in the cotton bollworm Helicoverpa armigera (Lepidoptera: Noctuidae): Comparison of African and European populations. Heredity, 80, 438–445. 10.1046/j.1365-2540.1998.00273.x [DOI] [Google Scholar]
- Nylander, J. A. A. (2004). MrAIC.pl. Program distributed by the author. Evolutionary Biology Centre, Uppsala University. Retrieved from https://github.com/nylander/MrAIC [Google Scholar]
- Oliveira, C. M. , Auad, A. M. , Mendes, S. M. , & Frizzas, M. R. (2014). Crop losses and the economic impact of insect pests on Brazilian agriculture. Crop Protection, 56, 50–54. 10.1016/j.cropro.2013.10.022 [DOI] [Google Scholar]
- Oliveira, M. R. C. , Corrêa, A. S. , de Souza, G. A. , Guedes, R. N. C. , & de Oliveira, L. O. (2013). Mesoamerican origin and pre‐ and post‐Columbian expansions of the ranges of Acanthoscelides obtectus Say, a cosmopolitan insect pest of the common bean. PloS ONE, 8, e70039 10.1371/journal.pone.0070039 [DOI] [PMC free article] [PubMed] [Google Scholar]
- Paini, D. R. , Sheppard, A. W. , Cook, D. C. , de Barro, P. J. , Worner, S. P. , & Thomas, M. B. (2016). Global threat to agriculture from invasive species. Proceedings of the National Academy of Sciences of the United States of America, 113, 7575–7579. 10.1073/pnas.1602205113 [DOI] [PMC free article] [PubMed] [Google Scholar]
- Perera, O. P. , Allen, K. C. , Jain, D. , Purcell, M. , Little, N. S. , & Luttrell, R. G. (2015). Rapid identification of Helicoverpa armigera and Helicoverpa zea (Lepidoptera: Noctuidae) using ribosomal RNA internal transcribed spacer 1. Journal of Insect Science, 15, 155 10.1093/jisesa/iev137 [DOI] [PMC free article] [PubMed] [Google Scholar]
- Pogue, M. G. (2004). A new synonym of Helicoverpa zea (Boddie) and differentiation of adult males of H. zea and H. armigera (Hübner) (Lepidoptera: Noctuidae: Heliothinae). Annals of the Entomological Society of America, 97, 1222–1226. 10.1603/0013-8746(2004)097\1222:ANSOHZ]2.0.CO;2 [DOI] [Google Scholar]
- Rambaut, A. (2009). FigTree Retrieved from http://tree.bio.ed.ac.uk/software/figtree/. Accessed 12 January 2018.
- Rasool, A. , Joußen, N. , Lorenz, S. , Ellinger, R. , Schneider, B. , Khan, S. A. , … Heckel, D. G. (2014). An independent occurrence of the chimeric P450 enzyme CYP337B3 of Helicoverpa armigera confers cypermethrin resistance in Pakistan. Insect Biochemistry and Molecular Biology, 53, 54–65. 10.1016/j.ibmb.2014.07.006 [DOI] [PubMed] [Google Scholar]
- Raymond, M. , & Rousset, F. (1995). GENEPOP (version 1.2): Population genetics software for exact tests and ecumenicism. Journal of Heredity, 86, 248–249. 10.1093/oxfordjournals.jhered.a111573 [DOI] [Google Scholar]
- Rius, M. , & Darling, J. A. (2014). How important is intraspecific genetic admixture to the success of colonising populations? Trends in Ecology & Evolution, 29, 233–242. 10.1016/j.tree.2014.02.003 [DOI] [PubMed] [Google Scholar]
- Rogers, A. R. , & Harpending, H. (1992). Population growth makes waves in the distribution of pairwise genetic differences. Molecular Biology and Evolution, 9, 552–569. 10.1093/oxfordjournals.molbev.a040727 [DOI] [PubMed] [Google Scholar]
- Ronquist, F. , & Huelsenbeck, J. P. (2003). MrBayes 3: Bayesian phylogenetic inference under mixed models. Bioinformatics, 19, 1572–1574. 10.1093/bioinformatics/btg180 [DOI] [PubMed] [Google Scholar]
- Sakai, A. K. , Allendorf, F. W. , Holt, J. S. , Lodge, D. M. , Molofsky, J. , With, K. A. , … Weller, S. G. (2001). The population biology of invasive species. Annual Review of Ecology and Systematics, 32, 305–332. 10.1146/annurev.ecolsys.32.081501.114037 [DOI] [Google Scholar]
- Scott, K. D. , Lawrence, N. , Lange, C. L. , Scott, L. J. , Wilkinson, K. S. , Merritt, M. A. , … Graham, G. C. (2005). Assessing moth migration and population structuring in Helicoverpa armigera (Lepidoptera: Noctuidae) at the regional scale: Example from the Darling Downs, Australia. Journal of Economic Entomology, 98, 2210–2219. 10.1603/0022-0493-98.6.2210 [DOI] [PubMed] [Google Scholar]
- Seymour, M. , Perera, O. P. , Fescemyer, H. W. , Jackson, R. E. , Fleischer, S. J. , & Abel, C. A. (2016). Peripheral genetic structure of Helicoverpa zea indicates asymmetrical panmixia. Ecology and Evolution, 6, 3198–3207. 10.1002/ece3.2106 [DOI] [PMC free article] [PubMed] [Google Scholar]
- Sievers, F. , Wilm, A. , Dineen, D. , Gibson, T. j. , Karplus, K. , Li, W. , … Higgins, D. g. (2011). Fast, scalable generation of high‐quality protein multiple sequence alignments using Clustal Omega. Molecular Systems Biology, 11(7), 539 10.1038/msb.2011.75 [DOI] [PMC free article] [PubMed] [Google Scholar]
- Silva‐Brandão, K. L. , Santos, T. V. , Cônsoli, F. L. , & Omoto, C. (2015). Genetic diversity and structure of Brazilian populations of Diatraea saccharalis (Lepidoptera: Crambidae): Implications for pest management. Journal of Economic Entomology, 108, 307–316. 10.1093/jee/tou040 [DOI] [PubMed] [Google Scholar]
- Slatkin, M. (1994). Linkage disequilibrium in growing and stable populations. Genetics, 137, 331–336. [DOI] [PMC free article] [PubMed] [Google Scholar]
- Soares, P. L. , Cordeiro, E. M. , Santos, F. N. , Omoto, C. , & Correa, A. S. (2018). The reunion of two lineages of the Neotropical brown stink bug on soybean lands in the heart of Brazil. Scientific Reports, 8, 2496 10.1038/s41598-018-20187-6 [DOI] [PMC free article] [PubMed] [Google Scholar]
- Song, S. V. , Anderson, C. , Good, R. T. , Leslie, S. , Wu, Y. , Oakeshott, J. G. , & Robin, C. (2018). Population differentiation between Australian and Chinese Helicoverpa armigera occurs in distinct blocks on the Z‐chromosome. Bulletin of Entomological Research, 108, 817–830. 10.1017/S0007485318000081 [DOI] [PubMed] [Google Scholar]
- Sosa‐Gómez, D. R. , Specht, A. , Paula‐Moraes, S. V. , Lopes‐Lima, A. , Yano, S. A. C. , Micheli, A. , … Azevedo‐Filho, W. S. (2016). Timeline and geographical distribution of Helicoverpa armigera (Hübner) (Lepidoptera, Noctuidae: Heliothinae) in Brazil. Revista Brasileira de Entomologia, 60, 101–104. 10.1016/j.rbe.2015.09.008 [DOI] [Google Scholar]
- Stokes, N. H. , Mckechnie, S. W. , & Forrester, N. W. (1997). Multiple allelic variation in a sodium channel gene from populations of Australian Helicoverpa armigera (Hübner) (Lepidoptera: Noctuidae) detected via temperature gradient gel electrophoresis. Australian Journal of Entomology, 36, 191–196. 10.1111/j.1440-6055.1997.tb01454.x [DOI] [Google Scholar]
- Tajima, F. (1989). The effect of change in population size on DNA polymorphism. Genetics, 123, 597–601. [DOI] [PMC free article] [PubMed] [Google Scholar]
- Tamura, K. , Peterson, D. , Peterson, N. , Stecher, G. , Nei, M. , & Kumar, S. (2011). MEGA5: Molecular evolutionary genetics analysis using maximum likelihood, evolutionary distance, and maximum parsimony methods. Molecular Biology and Evolution, 28, 2731–2739. 10.1093/molbev/msr121 [DOI] [PMC free article] [PubMed] [Google Scholar]
- Tay, W. T. , Behere, G. T. , Batterham, P. , & Heckel, D. G. (2010). Generation of microsatellite repeat families by RTE retrotransposons in lepidopteran genomes. BMC Evolutionary Biology, 10, 144 10.1186/1471-2148-10-144 [DOI] [PMC free article] [PubMed] [Google Scholar]
- Tay, W. T. , Behere, G. T. , Heckel, D. G. , Lee, S. F. , & Batterham, P. (2008). Exon‐primed intron‐crossing (EPIC) PCR markers of Helicoverpa armigera (Lepidoptera: Noctuidae). Bulletin of Entomological Research, 98, 509–518. 10.1017/S000748530800583X [DOI] [PubMed] [Google Scholar]
- Tay, W. T. , Soria, M. F. , Walsh, T. , Thomazoni, D. , Silvie, P. , Behere, G. T. , … Downes, S. (2013). A brave new world for an old world pest: Helicoverpa armigera (Lepidoptera: Noctuidae) in Brazil. PloS ONE, 8, e80134 10.1371/journal.pone.0080134 [DOI] [PMC free article] [PubMed] [Google Scholar]
- Tay, W. T. , Walsh, T. K. , Downes, S. , Anderson, C. , Jermiin, L. S. , Wong, T. K. F. , … Gordon, K. H. J. (2017). Mitochondrial DNA and trade data support multiple origins of Helicoverpa armigera (Lepidoptera, Noctuidae) in Brazil. Scientific Reports, 7, 45302 10.1038/srep45302 [DOI] [PMC free article] [PubMed] [Google Scholar]
- Tsai, Y. H. E. , & Carstens, B. C. (2013). Assessing model fit in phylogeographical investigations: An example from the North American sandbar willow Salix melanopsis . Journal of Biogeography, 40, 131–141. 10.1111/j.1365-2699.2012.02775.x [DOI] [Google Scholar]
- Vijaykumar, B. F. , Krishnareddy, K. B. , Kuruvinashetti, M. S. , & Patil, B. V. (2008). Genetic differentiation among cotton bollworm, Helicoverpa armigera (Hubner) populations of South Indian cotton ecosystems using mitochondrial DNA markers. Italian Journal of Zoology, 75, 437–443. 10.1080/11250000801933734 [DOI] [Google Scholar]
- Wang, H. , Fan, X. , Owada, M. , Wang, M. , & Nylin, S. (2014). Phylogeny, systematics and biogeography of the genus Panolis (Lepidoptera: Noctuidae) based on morphological and molecular evidence. PLoS ONE, 9, e90598 10.1371/journal.pone.0090598 [DOI] [PMC free article] [PubMed] [Google Scholar]
- Weeks, A. R. , Endersby, N. M. , Lange, C. L. , Lowe, A. , Zalucki, M. P. , & Hoffmann, A. A. (2010). Genetic variation among Helicoverpa armigera populations as assessed by microsatellites: A cautionary tale about accurate allele scoring. Bulletin of Entomological Research, 100, 445–450. 10.1017/S0007485309990460 [DOI] [PubMed] [Google Scholar]
- Weintraub, P. G. , Scheffer, S. J. , Visser, D. , Valladares, G. , Soares Correa, A. , Shepard, B. M. , … Metzler, H. B. (2017). The invasive Liriomyza huidobrensis (Diptera: Agromyzidae): Understanding its pest status and management globally. Journal of Insect Science, 17, 1–27. 10.1093/jisesa/iew121 [DOI] [PMC free article] [PubMed] [Google Scholar]
- Weir, B. S. , & Cockerham, C. C. (1984). Estimating F‐statistics for the analyses of population structure. Evolution, 38, 1358–1370. 10.1111/j.1558-5646.1984.tb05657.x [DOI] [PubMed] [Google Scholar]
Associated Data
This section collects any data citations, data availability statements, or supplementary materials included in this article.
Supplementary Materials
Data Availability Statement
All COI, COII, Cyt b, and ITS1 sequences used in this study were deposited in the NCBI database under accession number (KT828763–KT829449 and MG893581–MG893843). The detailed information about the sequences and all scripts used in ABC analysis are available at the public Dryad Digital Repository: https://doi.org/10.5061/dryad.rd1570s.