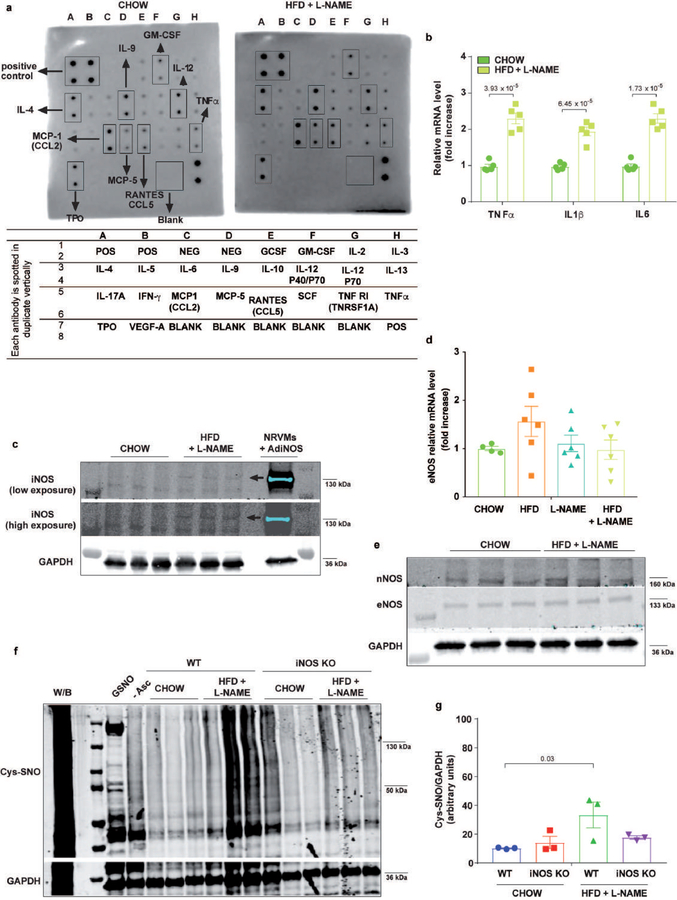
Extended Data Figure 7. Myocardial nitrosative stress and inflammatory markers in mice after five weeks of different dietary regimens.
a, Top: Cytokines/chemokines antibody array in plasma samples from CHOW and HFD+L-NAME mice with visual estimation of differently abundant cytokines. Each Images are representative of two independently performed experiments with similar results. Bottom: List of cytokines and chemokines represented by the antibody array membrane. b, Left ventricular (LV) TNFα, IL1β and IL6 mRNA levels of CHOW and HFD+L-NAME mice (n=5 mice per group). c, iNOS and GAPDH in LV samples of CHOW and HFD+L-NAME mice. Neonatal rat ventricular myocytes infected with mouse iNOS adenovirus (AdiNOS; 100 multiplicity of infection) were used as positive controls for iNOS bands. Arrow indicates the regulated band (n=3 mice per group). d, LV mRNA levels of eNOS of different experimental groups of mice (n=4 mice per CHOW group; n=6 mice per HFD, L-NAME and HFD+L-NAME groups). e, Immunoblot images of nNOS, eNOS and GAPDH proteins of different experimental groups of mice (n=3 mice per group). f, Immunoblot images of nitrosylated cysteines (Cys-SNO) and GAPDH proteins in LV samples of wild type (WT) and iNOS knock out (iNOS KO) mice after five weeks of CHOW and HFD+L-NAME diet (W/B: without blocking. - Asc: without ascorbate. GSNO: S-Nitrosoglutathione) (n=3 mice per group). g, Densitometric analysis ratio between Cys-SNO/GAPDH proteins (n=3 mice per group). Results are presented as mean±S.E.M. b, Two-tailed unpaired Student’s t-test. d One-way ANOVA followed by Sidak’s multiple comparisons test. g, Two-way ANOVA followed by Sidak’s multiple comparisons test. Numbers above square brackets show significant P values. For gel source data, see Supplementary Fig. 1.

