

Abstract
Animal studies have shown that the striatal cholinergic system plays a role in behavioral flexibility but, until recently, this system could not be studied in humans due to a lack of appropriate noninvasive techniques. Using proton magnetic resonance spectroscopy, we recently showed that the concentration of dorsal striatal choline (an acetylcholine precursor) changes during reversal learning (a measure of behavioral flexibility) in humans. The aim of the present study was to examine whether regional average striatal choline was associated with reversal learning. A total of 22 participants (mean age = 25.2 years, range = 18–32 years, 13 female) reached learning criterion in a probabilistic learning task with a reversal component. We measured choline at rest in both the dorsal and ventral striatum using magnetic resonance spectroscopy. Task performance was described using a simple reinforcement learning model that dissociates the contributions of positive and negative prediction errors to learning. Average levels of choline in the dorsal striatum were associated with performance during reversal, but not during initial learning. Specifically, lower levels of choline in the dorsal striatum were associated with a lower number of perseverative trials. Moreover, choline levels explained interindividual variance in perseveration over and above that explained by learning from negative prediction errors. These findings suggest that the dorsal striatal cholinergic system plays an important role in behavioral flexibility, in line with evidence from the animal literature and our previous work in humans. Additionally, this work provides further support for the idea of measuring choline with magnetic resonance spectroscopy as a noninvasive way of studying human cholinergic neurochemistry.
SIGNIFICANCE STATEMENT Behavioral flexibility is a crucial component of adaptation and survival. Evidence from the animal literature shows that the striatal cholinergic system is fundamental to reversal learning, a key paradigm for studying behavioral flexibility, but this system remains understudied in humans. Using proton magnetic resonance spectroscopy, we showed that choline levels at rest in the dorsal striatum are associated with performance specifically during reversal learning. These novel findings help to bridge the gap between animal and human studies by demonstrating the importance of cholinergic function in the dorsal striatum in human behavioral flexibility. Importantly, the methods described here cannot only be applied to furthering our understanding of healthy human neurochemistry, but also to extending our understanding of cholinergic disorders.
Keywords: choline, cognitive flexibility, magnetic resonance spectroscopy, reversal learning, striatum
Introduction
Acetylcholine (ACh) plays an important role in adaptive behavior and has been implicated in disorders of cognitive flexibility, such as Parkinson's disease (Tanimura et al., 2018; Zucca et al., 2018). Studies in rodents have repeatedly demonstrated that ACh transmission, determined by the activity and regulation of cholinergic interneurons in the dorsal striatum, is involved in reversal learning and similar forms of behavioral flexibility (Ragozzino et al., 2002, 2009; Tzavos et al., 2004; McCool et al., 2008; Brown et al., 2010; Bradfield et al., 2013; Aoki et al., 2018; Okada et al., 2018). Further, ACh efflux has been shown to increase specifically during reversal learning (but not during initial learning), and this effect is specific to the dorsomedial striatum (with no changes in ACh levels in either the dorsolateral striatum or the ventral striatum) (Ragozzino et al., 2009). It is clear then that cholinergic activity in the dorsal striatum plays an important role in reversal learning but, despite the importance of understanding this system, there remain important challenges in probing ACh function in humans due to a lack of appropriate noninvasive techniques.
Proton magnetic resonance spectroscopy (MRS) is a noninvasive method for measuring brain metabolites in vivo (Puts and Edden, 2012). Although it cannot be used to study ACh directly due to its low concentration (Hoover et al., 1978), MRS can be used to measure levels of certain choline-containing compounds (CCCs) involved in the ACh cycle, including choline (CHO). CHO is the product of ACh hydrolysis, and its uptake in cholinergic terminals is the rate-limiting step in ACh biosynthesis (Lockman and Allen, 2002). Using functional MRS, we previously demonstrated task-driven changes in the concentration of CHO in the human dorsal striatum during reversal learning (Bell et al., 2018). Although MRS studies typically model CCCs as a single peak due to their proximity on the spectrum, we showed that using this method may mask CHO-specific effects. Therefore, in the context of studying ACh function, it is necessary to separate the metabolites when measuring individual differences in CHO levels (Lindner et al., 2017; Bell et al., 2018).
Among the many open questions around this approach is the nature of the relationship between baseline levels of CHO availability and function-relevant ACh activity. Animal studies have shown that ACh synthesis is tightly coupled to CHO availability. For example, depletion of CHO has been shown to reduce ACh synthesis (Jope, 1979), and administration of CHO has been shown to increase it (Koshimura et al., 1990). Further, overexpression (Holmstrand et al., 2014) and underexpression (Parikh et al., 2013) of presynaptic CHO uptake transporters have been shown to increase and decrease ACh levels, respectively. It is possible, therefore, that baseline CHO availability may modulate ACh activity, leading to effects on behavioral flexibility. In this study, we used MRS to test whether baseline levels of dorsal striatal CHO are related to individual differences in reversal learning performance. Because of limitations of spectroscopy voxel sizes, it is not possible to precisely target the human homolog of the rodent dorsomedial striatum; therefore we obtained average measures of CHO from the dorsal striatum overall. To test the hypothesized regional striatal specificity, we also measured CHO levels from the ventral striatum. Finally, we also measured CHO levels from the cerebellum as a further, more general control. In line with the animal literature and our previous findings in humans (Bell et al., 2018), we predicted that average levels of CHO in the dorsal, but not the ventral, striatum would be associated with performance during reversal, but not initial, learning.
Materials and Methods
Participants
The study was approved by the University of Reading Research Ethics Committee (UREC reference 13/15). Thirty-six volunteers (20 female) between the ages of 18.3 and 32.8 years (mean ± SD, 24.8 ± 3.5 years) were recruited from the University of Reading and surrounding areas. All participants were healthy, right handed nonsmokers, and written informed consent was taken before participation. Two participants were excluded from analyses due to a high proportion of missed responses (participant 14: 35% during initial learning and 39% during reversal learning; participant 31: 27% during initial learning, 54% during reversal learning). One participant was excluded from spectroscopy analysis due to issues with segmentation of the structural scan. Data from the ventral striatum of two participants were excluded from analysis due to poor data quality.
Behavioral data collection
Learning task.
The task used was a probabilistic multialternative learning task previously described (Bell et al., 2018) and was programmed using MATLAB (2014a, The MathWorks) and Psychtoolbox (Brainard, 1997).
First, participants were presented with a fixation cross displayed in the center of the visual display. Participants were then presented with four decks of cards. Each deck contained a mixture of winning and losing cards, corresponding, respectively, to a gain or loss of 50 points. The probability of getting a winning card differed for each deck (75%, 60%, 40%, and 25%), and the probabilities were randomly assigned across the four decks for each participant. Participants indicated their choice of deck using a computer keyboard. Outcomes were pseudo-randomized so that the assigned probability was true over every 20 times that deck was selected. Additionally, no more than 4 cards of the same result (win/lose) were presented consecutively in the 75% and 25% decks, and no more than 3 cards of the same result in the 60% and 40% decks. A cumulative points total was displayed in the bottom right-hand corner throughout the session and in the center of the visual display at the end of each trial (Fig. 1). Participants were instructed that some decks may be better than others, they are free to switch between decks as often as they wish, and they should aim to win as many points as possible.
Figure 1.
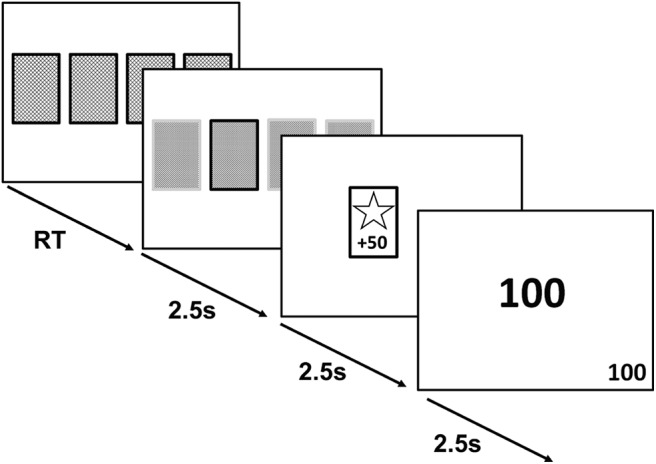
General outline of learning task trials. Participants were instructed to choose between four decks of cards. Each deck had a different probability of generating wins:losses (75:25, 60:40, 40:60, 25:75). Once the learning criterion had been reached, the deck probabilities were reversed so that high probability decks became low probability decks and vice versa. Participants were not informed of this in advance and were simply instructed to gain as many points as possible. Each screen was shown for 2.5 s. RT, Reaction time.
The learning criterion was set at selection of either of the two highest decks (60% or 75%) on at least 80% of the time over 10 consecutive trials. Although the optimal strategy is to repeatedly choose the 75% deck, pilot testing revealed that the participants were not always able to distinguish between the 75% and 60% decks. Therefore, as both decks generate an overall gain in points and choice of either deck could be considered a good strategy, both decks are included in the learning criterion.
The initial learning phase (round 1 [R1]) was completed when either the learning criterion was reached, or the participant completed 100 trials. The deck probabilities were then reversed so that the high probability decks became low probability (75% to 25%, and 60% to 40%) and vice versa. Participants were not informed of the reversal. The task ended either after the learning criterion was reached following the reversal (round 2 [R2]), or after another 100 trials (Fig. 2).
Figure 2.

General overview of learning task structure. Participants completed the initial learning phase (R1) by reaching the predefined accuracy criterion or after 100 trials. Upon completion of the initial learning phase, the deck probabilities were reversed. Participants then completed a reversal learning phase (R2). For behavioral analysis, this was subdivided into perseverative trials (PER) and a postreversal learning period. The number of perseverative trials was defined as the number of trials after reversal until the probability of selecting the previously favored card reached chance level (0.25). The postreversal learning period was the number of trials to reach criterion in R2, minus the number of perseverative trials. The number of regressive errors was defined as the number of times the previously favored deck was selected during the postreversal learning period. The task ended once participants either reached the same accuracy criterion in R2 or after 100 R2 trials.
Impulsivity.
Previous research has shown that trait levels of impulsivity can influence decision making (Bayard et al., 2011). Individuals with higher levels of impulsivity have been shown to demonstrate suboptimal performance on decision making tasks, displaying a decreased ability to learn reward and punishment associations and implement these to make appropriate decisions. For instance, individuals with high levels of impulsivity were relatively impaired in adapting their behavior during a reversal learning task (Franken et al., 2008). Other tasks of cognitive flexibility have also been shown to be influenced by trait impulsivity levels (e.g., Müller et al., 2015). Therefore, all participants completed the Barratt Impulsiveness Scale (BIS-11) (Patton et al., 1995), and their total score was used as a trait measure of impulsivity. This was included in the analysis to account for effects driven by individual differences in impulsivity.
Data analysis.
Participants were split into two groups based on performance. Those who learned both rounds (i.e., reached criterion both during initial learning and after reversal) were classified as learners, and those who did not learn both rounds were classified as nonlearners.
Behavior was analyzed for learners only. The task stops at 100 trials in each round if the criterion is not met. Therefore, participants who did not reach criterion in either one round or both rounds were excluded from behavior analysis.
Performance was measured using the number of trials taken to reach criterion in R1 (initial learning) and in R2 (reversal learning). R2 was subdivided into perseverative trials and postreversal learning (Fig. 2). The number of perseverative trials was defined as the number of trials after reversal until the probability of selecting the previously favored deck reached chance level (0.25) (i.e., the number of trials taken to identify the reversal and switch behavior). Postreversal learning was defined as the number of trials taken to reach criterion in R2, minus the number of perseverative trials (i.e., the number of trials to reach criterion after the reversal had been detected). In other words, postreversal learning is measured by the number of trials the participant took to learn the contingencies once they had realized the deck probabilities had reversed. Additionally, the postreversal learning period included a measure of regressive errors. The number of regressive errors was defined as the number of times the previously favored deck was selected during the postreversal learning period (i.e., after the perseverative period had ended).
Temporal difference reinforcement learning model.
We modeled participants' choice behavior as a function of their previous choices and rewards using a temporal difference reinforcement learning algorithm (Sutton and Barto, 1998). This allows us to track trial-and-error learning for each participant, during each task stage, in terms of a subjective expected value for each deck. On each trial t, the probability that deck c was chosen was given by a soft-max probability distribution as follows:
where mt(c) is the preference for the chosen deck and j indexes the four possible decks. The preference for the chosen deck was comprised of the participant's expected value of that deck on that trial, Vt(c), multiplied by the participant's individual value impact parameter β (equivalent to the inverse temperature) as follows:
The parameter β describes the extent to which trial-by-trial choices follow the distribution of the expected values of the decks: a low β indicates that choices are not strongly modulated by expected value, being effectively random with respect to this quantity (i.e., participants are not choosing based exclusively on value, and are effectively exploring all options); conversely, a high β indicates that choices largely follow expected value (i.e., participants choose the deck with the highest expected value; exploitation).
To update the subjective value of each deck, a prediction error was generated on each trial, pet based on whether participants experienced a reward or a loss (rewardt = 1 or −1, respectively). The expected value of the chosen deck was subtracted from the actual trial reward to give the prediction error as follows:
Studies have shown that individuals differ in the degree to which they learn from better than expected outcomes (positive prediction errors) and worse than expected outcomes (negative prediction errors) (Gray, 1970; Niv et al., 2012; Christakou et al., 2013; Bull et al., 2015). To account for this, two learning rate parameters were used to model sensitivity to prediction errors in updating the expected values: the weight of learning from better than expected outcomes (learning rate from positive prediction errors: η+) and the weight of learning from worse than expected outcomes (learning rate from negative prediction errors: η−). For example, individuals who are reward seeking will place a high weight on the former, whereas those who are loss-aversive will place a high weight on the latter. The prediction error on each trial was multiplied by either the positive (η+) or negative (η−) learning rate and used to update the value of the chosen deck as follows:
Thus, the model has three parameters of interest (β, η+, and η−). In psychological terms, β captures the degree to which the subjective value of the chosen deck influenced decisions, whereas the learning rates capture the individual's preference for learning from positive (η+) or negative (η−) prediction errors to guide choice behavior during this task.
Model fitting.
The model was fit per participant to provide parameters that maximized the likelihood of the observed choices given the model (individual maximum likelihood fit) (Daw, 2011). The reward value was updated as 1 (win) or −1 (loss). Subjective value was initialized at zero for all decks, and the initial parameter values were randomized. To ensure the model produced consistent, interpretable parameter estimates, η was limited to between 0 and 1 and β was assumed positive. The parameters were constrained by the following distributions based on Christakou et al. (2013) as follows:
The model was fit separately over the trials encompassing R1 (initial learning) and R2 (perseverative trials and postreversal learning, denoted as reversal learning). This was done to capture the change in influence of the model parameters from initial learning to reversal learning. The model was not fit over the perseverative trials separately as the average number of perseverative trials was too small to generate a stable model fit.
Traditionally, to investigate the fit of a temporal difference reinforcement learning model, the Bayesian information criterion (BIC) is used. The BIC is a post hoc fit criterion that looks at the adequacy of a model while penalizing the number of parameters used. A lower number indicates a better fit (Steingroever et al., 2016). However, the BIC is generally used to compare different models, rather than model fits over different sets of data, and will penalize different sized datasets. Alternatively, the corrected likelihood per trial (CLPT) can be used. The CLPT is a more intuitive measure of fit that takes into account the number of trials completed without penalizing different sized datasets. The CLPT varies between 0 and 1, with higher values indicating a better fit (Leong and Niv, 2013; Niv et al., 2015).
Wilcoxon signed-rank tests showed that there was no significant difference between the CLPT values for the model fit over R1 (median = 0.23) and R2 (median = 0.23; Z = −1.308, p = 0.191). Additionally, there was no significant difference between the BIC values for the model fit over R1 (mean ± SD, 75.7 ± 45.5) and R2 (90.9 ± 43.6; t(33) = −1.533, p = 0.135, r = 0.26).
To summarize, the model fit equally well across rounds. Therefore, differences in parameter estimates across the task can be examined.
MRS
Data acquisition.
Data were collected at the University of Reading on a Siemens Trio 3 T MRI scanner using a transmit-receive head coil. A high-resolution whole-brain T1 structural image was acquired for voxel placement using an MPRAGE sequence parallel to the anteroposterior commissure line (176 × 1 mm slices; TR = 2020 ms; TE = 2.9 ms; FOV = 256 × 256 mm2, flip angle = 9°, voxel size 1 × 1 × 1 mm3).
Voxels were placed in the left or right dorsal striatum, ventral striatum, and the cerebellum, with hemisphere placement and order of measurements counterbalanced across participants (Fig. 3). Anatomy was used to guide voxel positioning. The top of the dorsal striatum was identified by slice-by-slice examination of the structural scan. The slice below the slice where the top of the striatum was no longer visible was selected, and the top of the voxel was aligned with this slice. The slice above the slice where the bottom of the striatum could no longer be seen was selected and used for alignment of the ventral striatum voxel. The cerebellum voxel was placed as high in the superior cerebellar vermis as possible while ensuring only cerebellar tissue was contained in the voxel. The superior cerebellar vermis was chosen as it has been shown to have the lowest variability in both intersubject and intrasubject metabolite ratios as measured with MRS at rest (Currie et al., 2013). All voxels were visually inspected to ensure minimal CSF was included in the voxels.
Figure 3.

Location of voxels and example spectra. Heat maps showing the sum of the MRS voxels over all subjects in MNI space, along with a voxel and a representative spectrum from a single subject. A, Dorsal striatum, MNI coordinates: −3.41, 2.37, 11.16. B, Ventral striatum, MNI coordinates: −2.99, 5.92, −3.93. C, Cerebellum, MNI coordinates: −2.10, −61.03, 19.20.
A PRESS sequence was used to acquire data from the three separate voxel positions (voxel size = 10 × 15 × 15 mm3; TR = 2000 ms; TE = 30 ms); 128 spectra were collected and averaged for each area. A water-unsuppressed spectrum was also obtained from each area for data processing, which consisted of an average of 15 spectra. The SIEMENS Auto Align Scout was used in between each scan to adjust the voxel position based on the actual head position of the participant. This was used to correct for participant motion and minimize the variability of the voxel position.
Structural segmentation.
Structural scans were processed using FSL version 5.0.8 (Smith et al., 2004; Jenkinson et al., 2012). First, the skull was removed using the brain extraction tool (Smith, 2002). Images were segmented into three separate tissue types: gray matter, white matter, and CSF using the FAST tool (Zhang et al., 2001). The coordinates and dimensions of the voxel were then superimposed on these images, and the proportion of each of the three tissue types contained within the voxel was calculated.
Quantitation.
Data were processed in the time domain using Java-Based Magnetic Resonance User Interface (jMRUI software version 5.0; http://www.mrui.uab.es/mrui) (Naressi et al., 2001). Phase correction was performed using the corresponding water spectrum from each area. Each spectrum was then apodized using a Gaussian filter of 3 Hz to improve signal quality, reduce noise, and reduce effects of signal truncation (Jiru, 2008). The residual water peak was removed using the Hankel-Lanczos Singular Value Decomposition filter tool.
Metabolite models were generated using the software Versatile Simulation, Pulses and Analysis (VeSPA; https://scion.duhs.duke.edu/vespa/project) (Soher et al., 2010). Fourteen typical brain metabolites (acetate, aspartate, CHO, creatine, GABA, glucose, glutamate, glutamine, lactate, myo-inositol, N-acetyl aspartate [NAA], phosphocreatine, PC and GPC, scyllo-inositol, succinate, taurine) were simulated at a field strength of 3 T using a PRESS pulse sequence (TE1 = 20 ms, TE2 = 10 ms, main field = 123.25 MHz). For initial analyses, CHO was modeled separately from PC+GPC based on the method described by Bell et al. (2018). Additionally, the sum of the three peaks (total choline [tCHO]) was included in the analyses for comparison. If tCHO produced similar results to CHO, it would potentially suggest that there may not be a need to separate the three peaks, or that the quantitation method is not separating CHO effectively.
The jMRUI tool Accurate Quantification of Short Echo time domain Signals (AQSES) was used for automatic quantification of spectra signals. AQSES was applied using the method described by Minati et al. (2010). To correct for any chemical shift displacement, the spectrum was shifted so that the peak for NAA was at 2.02 ppm. The frequency range selected for processing was limited to 0–8.6 ppm: equal phase for all metabolites, begin time fixed, δ damping (−10 to 25 Hz), δ frequency (−5 to 5 Hz), no background handling, 0 truncated points, 2048 points in AQSES, and normalization on. Based on common practice in the field, values with a Cramér-Rao Bound (CRB) >30% were excluded on a case-by-case basis.
Metabolite concentrations were calculated for CHO, PC+GPC, tCHO, NAA, and total creatine (tCR, creatine + phosphocreatine), correcting for partial-volume and relaxation effects, using the formula described by Gasparovic et al. (2006).
Experimental design and statistical analysis
Statistical analysis was performed using SPSS (IBM Corp. Released 2013. IBM SPSS Statistics for Windows, Version 22.0. Armonk, NY: IBM Corp).
The relationships between model parameters and behavior, along with model parameters and metabolite levels, and behavior and metabolite levels were assessed using correlation analysis. The distribution of the data was analyzed using measures of skewness and kurtosis, along with the Shapiro–Wilk test. When the assumptions of normality and homogeneity were met, Pearson's correlation (r) was used to assess correlations. When assumptions of normality were not met, Kendall's tau (rτ) was used to assess correlations, as it provides a better estimation of the correlation in a small sample size compared with other nonparametric methods (Field, 2009). Both the behavioral and MRS data reported satisfy false discovery correction using the Benjamini–Hochberg procedure at a reasonably conservative 10% false discovery rate (Benjamini and Hochberg, 1995). We report the false discovery rate correction because of our strong a priori prediction and the high cost of false negatives. Further, in the case of model-behavior correlations, the false discovery rate correction is more appropriate than a family-wise error rate correction for multiple comparisons (e.g., the Bonferroni method) because of the high correlation rate expected in the data, given that model parameters were estimated from behavior itself. We included a bootstrap approach (1000 iterations) to calculate bias-corrected 95% CIs. Where appropriate, hierarchical multiple regression analysis was used to assess the variance in behavior explained by metabolite levels, after the model parameters were accounted for.
Confounding variables.
There were no significant differences in metabolite levels between hemispheres; therefore, the results were combined across hemisphere of acquisition.
To examine whether variations in the metabolite values might be caused by differing proportions of tissue composition, correlations were performed between CCC levels and proportion of gray and white matter present in the voxel. Additionally, metabolite values were checked against the water signal for the same reason. No significant correlations were found between CCCs and gray/white matter content, indicating that any variance seen is generated by differing metabolite levels. The water signal significantly correlated with dorsal striatum tCHO (rτ(34) = −0.348, p = 0.003) and ventral striatum PC+GPC (rτ(31) = −0.270, p = 0.001). Therefore, analyses involving dorsal striatum tCHO or ventral striatum PC+GPC were corrected for this source of variance using partial correlations. No other significant correlations were seen between the water signal and metabolite levels of interest.
There is evidence that metabolite levels in the brain can vary based on time of day (Soreni et al., 2006) and age (Pfefferbaum et al., 1999; Reyngoudt et al., 2012). Therefore, all metabolites were checked against these two variables to ensure this was not a source of variance. Time of day significantly correlated with dorsal striatum tCHO (rτ(34) = 0.249, p = 0.038) and cerebellum tCHO (rτ(30) = 0.285, p = 0.026). Therefore, analyses involving dorsal striatum tCHO or cerebellum tCHO were corrected for this source of variance using partial correlations. No other significant correlations were seen between metabolite levels and time of day or age of participant.
Controls.
The cerebellum was used as a control to demonstrate the regional specificity of results. None of the effects was present in the cerebellum; therefore, these results are not reported further. NAA and tCR were used as controls to demonstrate the neurochemical specificity of the results (i.e., that the relevant individual differences were specific to choline and not to spectrum-wide interindividual differences). None of the effects was present in either NAA or tCR; therefore, these results are not reported further. Furthermore, none of the reported effects was found when using tCHO as a measure of cholinergic availability; therefore, these results are not reported further.
Results
Behavioral results
Twenty-two participants reached criterion during both rounds (i.e., they reached criterion both during initial learning and after the reversal) and were included in the analysis. Table 1 shows the average number of trials taken to complete each component.
Table 1.
Performance variables
| Average no. of trials | SD | |
|---|---|---|
| Initial learning | 44 | 28 |
| Reversal learning | 47 | 23 |
| Perseveration period | 12 | 8 |
| Postreversal learning | 35 | 22 |
| Regressive errors | 7 | 6 |
Model parameters and performance
A reinforcement-learning model was used to disentangle components of learning that contribute to overall behavior. We looked at three parameters of interest: the learning rates from positive (η+) and negative (η−) prediction errors, and the overall impact of subjective value of the deck on the participants choice (value impact parameter, β). Table 2 shows the mean of the model parameters for both rounds. Outlier analysis resulted in the exclusion of the value impact parameter (β) during initial learning for one participant (Z = 3.12).
Table 2.
Estimates of model parametersa
| η+ | η− | β | |
|---|---|---|---|
| Initial learning | 0.37 | 0.42 | 1.44 |
| (0.30) | (0.31) | (0.56) | |
| Reversal learning | 0.24 | 0.31 | 1.37 |
| (0.35) | (0.27) | (0.97) |
aData are mean (SD).
To explore how the contribution of the model parameters to behavior changes over time, we looked at correlations between behavior (as measured by trials to criterion, number of perseverative trials, and number of regressive errors) and the corresponding model parameters separately (i.e., behavior during initial learning was correlated with model parameters fit over the initial learning period), and likewise for the reversal learning period.
Table 3 shows the correlation coefficients for the relationships between model parameters and behavior. Faster initial learning (low number of trials to criterion) was associated with a higher learning rate from positive prediction errors (r(21) = −0.439, p = 0.041) and a higher value impact parameter (r(20) = −0.536, p = 0.012). A lower number of perseverative trials was associated with a higher learning rate from negative prediction errors (r(21) = −0.527, p = 0.012). As was the case during initial learning, during postreversal learning (after the reversal has been identified), a lower number of trials taken to reach criterion was associated with a higher learning rate from positive prediction errors (rτ(21) = −0.335, p = 0.03), and a higher value impact parameter (rτ(21) = −0.352, p = 0.022). Additionally, during postreversal learning, a lower number of regressive errors was associated with a higher learning rate from positive prediction errors (rτ(21) = −0.355, p = 0.023) and a higher value impact parameter (rτ(21) = −0.337, p = 0.031).
Table 3.
Correlation coefficients for relationships between model parameters and behaviora
| η+ | η− | β | |
|---|---|---|---|
| Initial learning (TTC) | −0.439 [−0.710, −0.066] | −0.218 [−0.307, −0.680] | −0.536* [−0.808, −0.248] |
| Reversal learning | |||
| Perseverative errors | −0.176 [−0.516, 0.233] | −0.527* [−0.754, −0.285] | 0.132 [−0.117, 0.403] |
| Postreversal learning (TTC) | −0.335* [−0.593, −0.014] | 0.322 [−0.164, 0.673] | −0.352* [−0.674, −0.051] |
| Regressive errors | −0.355* [−0.612, −0.047] | 0.292 [−0.174, 0.649] | −0.337* [−0.639, −0.054] |
aRanges in brackets indicate bias-corrected 95% CIs.
*p < 0.05.
Effects of trait impulsivity on performance
To investigate the influence of impulsivity on decision making, we looked at correlations between impulsivity (total BIS-11 score) and measures of behavior (including model parameters) in learners. Higher impulsivity levels were associated with a lower number of perseverative errors (r(21) = −0.470, p = 0.027). No other measures of behavior correlated with impulsivity.
Summary
The contribution of learning parameters to performance changes over the learning period. Faster initial learning was indexed by both higher learning rates from positive prediction errors (R1η+) and higher value impact parameters (R1β). However, reduced numbers of perseverative trials were associated with higher learning rates from negative prediction errors (R2η−) and higher impulsivity levels. Similar to initial learning, faster postreversal learning was associated with higher learning rates from positive prediction errors (R2η+) and higher value impact parameters (R2β). Additionally, during postreversal learning, lower numbers of regressive errors were associated with higher learning rates from positive prediction errors (R2η+) and higher value impact parameters (R2β).
Spectroscopy results
One participant was excluded from spectroscopy analysis due to issues with segmentation of the structural scan. All metabolite values had Cramér-Rao Bound (CRB) < 30% and were all included in the analysis.
Association of reversal learning with dorsal striatal choline
Table 4 shows the average metabolite levels in the dorsal striatum. To test the hypothesis that reversal learning performance is associated with dorsal striatal CHO levels, we looked at the correlation between measures of reversal learning performance (number of perseverative trials and learning rate from negative prediction errors; R2η−) and levels of CHO in the dorsal striatum in learners (n = 21).
Table 4.
Average metabolite levels in the dorsal striatuma
| CHO | PC + GPC | tCHO | NAA | tCR | |
|---|---|---|---|---|---|
| Learners | 0.15 | 0.27 | 0.42 | 8.73 | 11.58 |
| (0.20) | (0.10) | (0.12) | (0.77) | (1.74) | |
| Nonlearners | 0.11 | 0.36 | 0.46 | 8.83 | 11.80 |
| (0.16) | (0.14) | (0.10) | (2.37) | (2.31) |
aData are mean (SD).
A lower number of perseverative trials was associated with lower levels of dorsal striatum CHO (rτ(20) = 0.367, p = 0.021; 95% CI [0.081, 0.669]; Fig. 4A). The opposite effect was seen with dorsal striatum PC+GPC (r(20) = −0.447, p = 0.042; 95% CI [−0.779, 0.004]). Additionally, higher learning rates from negative prediction errors were associated with lower dorsal striatum CHO levels (rτ(20) = −0.371, p = 0.019; 95% CI [−0.258, −0.025]; Fig. 4B). This result is specific to dorsal striatum CHO, with no other dorsal striatum metabolites found to correlate with learning rates from negative prediction errors.
Figure 4.

Correlations between dorsal striatum CHO levels and performance during reversal. A, Positive correlation between the number of perseverative trials and levels of CHO in the dorsal striatum (rτ(21) = 0.367, p = 0.021). B, Negative correlation between the learning rate based on negative prediction errors derived from R2 (R2η−) and levels of CHO in the dorsal striatum (rτ (21) = −0.371, p = 0.019). DS, Dorsal striatum.
After establishing an association between CHO levels and reversal performance, we wanted to examine whether CHO contributed to reversal efficiency over and above behavioral and personality variables. Using a hierarchical multiple regression, we first modeled the contribution of variance from learning rates from negative prediction errors and total BIS scores to the variance in the number of perseverative trials (Model 1; F(2,18) = 9.460, p = 0.002, R2 = 0.512; Table 5). The second model looked at whether the addition of dorsal striatum CHO would explain significantly more variance, over and above that explained by learning rates from negative prediction errors and total BIS score (Model 2; F(3,17) = 9.574, p = 0.001, R2 = 0.628; Table 5).
Table 5.
Summary of hierarchical regression analyses for variables predicting perseverationa
| B | SE B | β | R2 | ΔR2 | p | |
|---|---|---|---|---|---|---|
| Model 1 | 0.512 | 0.002 | ||||
| R2η− | −14.476 | 4.858 | −0.493 | 0.008 | ||
| BIS total | −0.504 | 0.176 | −0.472 | 0.011 | ||
| Model 2 | 0.628 | 0.116 | 0.034 | |||
| R2η− | −12.619 | 4.439 | −0.430 | 0.011 | ||
| BIS total | −0.447 | 0.160 | −0.419 | 0.013 | ||
| DS CHO | 5.306 | 2.307 | 0.351 | 0.034 |
aFor ΔR2 = 0.139, p = 0.037. B, Unstandardized coefficient; β, standardized coefficient.
The amount of variance in the number of perseverative trials explained by learning rates from negative prediction errors was significant in both Model 1 (β = −0.493, t(18) = −2.980, p = 0.008; Table 5) and Model 2 (β = −0.430, t(17) = −2.843, p = 0.011; Table 5). Additionally, total BIS score also explained a significant amount of variance in both Model 1 (β = −0.472, t(18) = −2.855, p = 0.011; Table 5) and Model 2 (β = −0.419, t(17) = −2.787, p = 0.013; Table 5).
In Model 2, dorsal striatum CHO also explained a significant amount of variance in the number of perseverative trials (β = 0.351, t(17) = 2.300, p = 0.034; Table 5). The addition of dorsal striatum CHO to the model increased R2 by 0.116, and this increase was statistically significant (F(1,23) = 5.291, p = 0.034; Table 5).
To assess the specificity of this result, dorsal striatum PC+GPC was also included in the model. However, analysis of multicollinearity diagnostics showed a tolerance of 0.175, which is below the acceptable value of 0.2. This is due to the strong significant correlation between dorsal striatum CHO and dorsal striatum PC+GPC (rτ(20) = −0.667, p < 0.001). As a result, including the two variables in the same regression model would violate the assumption of multicollinearity and the regression model would not be able to provide unique estimates of the regression coefficients, as each will account for overlapping variance (Field, 2009). Therefore, we instead repeated the hierarchical regression with dorsal striatum PC+GPC in place of dorsal striatum CHO. The amount of variance explained by dorsal striatum PC+GPC was not significant (β = −0.301, t(17) = −1.900, p = 0.075). The addition of dorsal striatum PC+GPC to the model increased R2 by 0.085, and this increase was not statistically significant (F(1,23) = 3.611, p = 0.075). This indicates that dorsal striatum CHO levels can explain part of the variance in the number of perseverative trials; however, dorsal striatum PC+GPC levels cannot.
Association of other learning parameters with dorsal striatal choline
No significant correlations were seen with measures of performance in R1 (trials to criterion, R1η+ or R1β) and average levels of CHO in the dorsal striatum.
No significant correlations were seen with dorsal striatal CHO levels and measures of performance during postreversal learning (trials to criterion, R2η+ or R2β). Additionally, there were no significant correlations between dorsal striatal CHO levels and the number of regressive errors.
Association of learning parameters with ventral striatal choline
Two participants were excluded from analysis due to poor data quality of the ventral striatal spectra. Table 6 shows the average metabolite levels in the ventral striatum. To test the hypothesis that associations between dorsal striatal CHO levels are region-specific and not from the striatum as a whole, we looked at the correlation between measures of learning performance and levels of CHO in the ventral striatum in learners (n = 20).
Table 6.
Average metabolite levels in the ventral striatuma
| CHO | PC+GPC | tCHO | NAA | tCR | |
|---|---|---|---|---|---|
| Learners | 0.24 | 0.27 | 0.5 | 5.39 | 12.02 |
| (0.17) | (0.12) | (0.17) | (1.97) | (2.26) | |
| Nonlearners | 0.23 | 0.25 | 0.48 | 5.45 | 11.13 |
| (0.17) | (0.14) | (0.16) | (1.54) | (3.95) |
aData are mean (SD).
Ventral striatal CHO did not correlate with trials to criterion in R1. However, low levels of CHO in the ventral striatum were associated with higher learning rates from positive prediction errors during initial (but not reversal) learning (r(19) = −0.625, p = 0.003; 95% CI [−0.873, −0.363]; Fig. 5A) and lower value impact parameters during initial (but not reversal) learning (r(18) = 0.555, p = 0.014; 95% CI [0.312, 0.874]; Fig. 5B).
Figure 5.

Correlations between ventral striatum CHO levels and performance during initial learning. A, Negative correlation between learning rate based on positive prediction errors derived from R1 (R1η+) and levels of CHO in the ventral striatum (r(19) = −0.625, p = 0.003). B, Positive correlation between impact of participant's subjective value on their future choice derived from R1 (R1β) and levels of CHO in the ventral striatum (r(18) = 0.555, p = 0.014). VS, Ventral striatum.
Ventral striatal CHO was not found to correlate with either the number of perseverative trials or learning rates from negative prediction errors.
No significant correlations were seen with ventral striatal CHO levels and measures of performance during postreversal learning (trials to criterion, R2η+ or R2β). Additionally, there were no significant correlations between ventral striatal CHO levels and the number of regressive errors.
Group comparisons
To investigate whether average levels of CHO in the striatum relate to learning ability, the average levels were compared between learners and nonlearners. There was no significant difference in CHO levels between learners and nonlearners in either the dorsal striatum or the ventral striatum.
Summary
In the dorsal striatum, average CHO levels were associated with performance during reversal, but not during initial learning. There was a significant positive correlation between dorsal striatal CHO levels and the number of perseverative trials, and a significant negative correlation between dorsal striatal CHO levels and learning rates from negative prediction errors (R2η−). Additionally, dorsal striatal CHO levels explained variance in the number of perseverative trials over and above that explained by learning rates from negative prediction errors.
In the ventral striatum, average CHO levels were not associated with performance during reversal learning. Although ventral striatal CHO levels were not associated with the speed of initial learning, there was a significant positive correlation between ventral striatal CHO levels and learning rates from positive prediction errors, and a significant negative correlation between ventral striatal CHO levels and the value impact parameter during initial learning.
Discussion
We used MRS to investigate the relationship between average CHO levels in the human striatum (at rest) and probabilistic reversal learning. We show that baseline levels of CHO in the human dorsal striatum are associated specifically with individual differences in reversal learning efficiency, but not in initial learning, and that this effect is specific to the dorsal, but not the ventral striatum.
Behaviorally, we show that faster initial learning is indexed by a higher learning rate from positive prediction errors (η+) and a higher value impact parameter (β). Therefore, during this period, participants are using wins and expected value to guide their choices. This is also seen during the postreversal learning period, in which faster postreversal learning is indexed by higher learning rates from positive prediction errors (η+) and higher value impact parameters (β). Faster reversal (less perseveration), however, was indexed by higher learning rates from negative prediction errors (η−) only. During this period (i.e., after the reversal has been implemented), participants must now pay increased attention to worse than expected outcomes to identify the change in contingencies. Therefore, to adapt to changes in task structure, participants adapt their strategy by altering the weight of learning from prediction errors based on reward history.
The learning rate for negative prediction errors, even after accounting for trait impulsivity, explained a significant amount of variance in perseveration, providing a simple mechanism to explain reversal efficiency. Average dorsal striatum CHO levels explained variance in perseveration over and above this original model. This suggests a more complex mechanism in which perseveration is influenced, in part, by the learning rate from negative prediction errors (which can change due to task demand) and by resting levels of dorsal striatum CHO. Indeed, Franklin and Frank (2015) showed that a model that takes into account cholinergic activity performs better on a reversal learning task than a model based solely on dopamine prediction error signaling.
Our results indicate that participants who were quicker to reverse had lower average levels of dorsal striatum CHO, suggesting that low trait levels of dorsal striatum CHO are beneficial for reversal learning. Based on evidence that ACh efflux increases during reversal learning (Ragozzino et al., 2009; Brown et al., 2010), this suggests two potential mechanisms. First, lower levels of dorsal striatum CHO at rest could reflect lower levels of ACh at rest. This is also supported by evidence from the animal literature, which has shown a positive correlation between ACh levels at rest as measured by microdialysis and average CCCs as measured by MRS (Wang et al., 2008). Additionally, higher levels of CHO availability have been shown to lead to higher levels of ACh release, implying a positive correlation between the two metabolites (Koshimura et al., 1990). Based on this notion, the findings here suggest that lower levels of ACh at rest may be beneficial for reversal learning because they enable a higher contrast between ACh levels at rest and during reversal learning. However, it is important to note that Wang et al. (2008) modeled all three CCCs as a single peak. It is likely that the relationship between CHO levels as measured by spectroscopy and ACh levels in the brain is not straightforward, and this interpretation should be considered with caution. Indeed, animal studies have shown the relationship between CHO and ACh can change based on neuronal firing and ACh requirement (Löffelholz, 1998; Klein et al., 2002). Furthermore, we have previously demonstrated a drop in CHO levels in the human dorsal striatum during reversal learning, thought to reflect the sustained increase in ACh release seen in animal studies (e.g., Ragozzino et al., 2009). This drop is thought to be due to an increase in translocation of CHO uptake receptors in response to sustained neural firing (Bell et al., 2018). Although we have described the measurements in this study as “at rest,” cholinergic interneurons are tonically active, and therefore the relationship between CHO and ACh levels in the striatum will likely reflect a more complex dynamical relationship between the two.
The second potential mechanism supported by our findings is that lower levels of dorsal striatum CHO at rest may result from a more efficient CHO uptake system. Mice carrying mutations in the gene coding for CHO uptake transporters have reduced neuronal capacity to both clear CHO and release ACh. Moreover, performance on an attention task was impaired in these mice (Parikh et al., 2013). Additionally, in a study of frontal cortex cholinergic modulation during attention, humans with a gene polymorphism, which reduces CHO transport capacity, showed reduced activation in the prefrontal cortex during an attentional task. Furthermore, the pattern of activation predicted CHO genotype (Berry et al., 2015). Although our findings are in line with biochemical and functional evidence in various models, it is clear that further work is needed to determine the relationship between CHO uptake, ACh release, and reversal learning.
With regard to performance, disruption of cholinergic signaling in rodents typically results in an increase in regressive errors (Brown et al., 2010; Bradfield et al., 2013). However, here we found no association between dorsal striatum CHO levels and the number of regressive errors. In humans, measures of individual differences in perseverative and regressive errors are likely to be confounded by individual differences in representation of the task structure. Rather than making perseverative and regressive errors based solely on feedback, the ability to flexibly alter response depends in part on a higher-level representation of the task, which is thought to be maintained in frontal areas of the cortex (Armbruster et al., 2012). It should be noted that the basal ganglia-thalamo-cortical system has been shown to be modulated by the maintenance of task rules, with individuals with stronger representation of the task structure showing higher activation in the caudate and thalamus during a behavior switch (Ueltzhöffer et al., 2015), indicating that representation of task structure likely modulates dorsal striatum activity in response to the need for behavioral flexibility. Inevitably, caution is needed when translating evidence from rodent studies of learning to human studies. This emphasizes the need to further develop noninvasive techniques for studying human neurochemistry in vivo.
As predicted, and in line with evidence from the animal literature (Ragozzino et al., 2009), levels of CHO in the ventral striatum were not associated with reversal learning. However, ventral striatum CHO levels were associated with model parameters that contributed to initial learning. Although Ragozzino et al. (2009) demonstrated that ACh levels in the rat ventral striatum did not change during reversal learning, they did not test whether they changed during initial learning. Successful learning requires the ability to learn from feedback, which is encoded through dopaminergic prediction error signaling in the ventral striatum (Schultz et al., 1997). The rodent ventral striatum has a higher density of cholinergic interneurons than the dorsal striatum (Matamales et al., 2016), and changes in cholinergic activity are time-locked to changes in dopaminergic activity, which is thought to enhance the contrast of prediction error signaling (Aosaki et al., 2010). Indeed, cholinergic activity in the ventral striatum has been linked with effective learning of a stimulus-outcome association (Brown et al., 2012); therefore, it is likely that cholinergic activity in the ventral striatum is involved in some aspect with goal-directed learning, and further studies should explore this contribution.
Due to our specific a priori hypotheses and novel MRS application, we used several controls to demonstrate that these effects are specific to CHO levels in the striatum. We acquired data from a voxel in the cerebellum, geometrically identical to the striatal voxels. No learning effects were present in the cerebellum, demonstrating that our findings are specific to the striatum. Additionally, we also quantified two control metabolites (NAA and tCR) to ensure that the results were specific to the metabolite of interest, rather than a general measurement or region effect. None of the effects were seen in levels of NAA and tCR in the dorsal striatum or ventral striatum. Importantly, none of the effects were seen when modeling all three peaks together (tCHO), highlighting once more the importance of separating CHO when using MRS to investigate individual differences in CCC levels.
As is common with learning tasks, a significant proportion of our sample did not reach criterion, leaving a smaller sample for analysis. This proportion is similar to that reported in previous studies using this task (i.e., Schönberg et al., 2007); and although the final sample size was reduced by this effect, it is in line with the size of typically published MRS/MRI samples. This observation notwithstanding, the novelty of the approach presented here naturally warrants further validation of both the method and the findings.
In conclusion, we used MRS to demonstrate that average levels of CHO in the human dorsal striatum are associated with performance during probabilistic reversal, but not during initial learning. This is in line with evidence from the animal literature and our own prior work with humans, which suggests a specific role for cholinergic activity in the dorsal striatum during reversal learning. These results provide evidence for the role of the human cholinergic striatum in reversal learning and behavioral flexibility more generally. Additionally, these findings further support the idea of using CHO levels as measured by MRS as a tool for noninvasive in vivo monitoring of both healthy human neurochemistry, as well as disorders of the human cholinergic system.
Footnotes
This work was supported by Human Frontier Science Program Grant RGP0048/2012, and Engineering and Physical Sciences Research Council Doctoral Training Grant EP/L505043/1. We thank Rosie Gillespie and Emma Davis for assistance with data collection.
The authors declare no competing financial interests.
References
- Aoki S, Liu AW, Akamine Y, Zucca A, Zucca S, Wickens JR (2018) Cholinergic interneurons in the rat striatum modulate substitution of habits. Eur J Neurosci 47:1194–1205. 10.1111/ejn.13820 [DOI] [PMC free article] [PubMed] [Google Scholar]
- Aosaki T, Miura M, Suzuki T, Nishimura K, Masuda M (2010) Acetylcholine-dopamine balance hypothesis in the striatum: an update. Geriatr Gerontol Int 10:S148–S157. 10.1111/j.1447-0594.2010.00588.x [DOI] [PubMed] [Google Scholar]
- Armbruster DJ, Ueltzhöffer K, Basten U, Fiebach CJ (2012) Prefrontal cortical mechanisms underlying individual differences in cognitive flexibility and stability. J Cogn Neurosci 24:2385–2399. 10.1162/jocn_a_00286 [DOI] [PubMed] [Google Scholar]
- Bayard S, Raffard S, Gely-Nargeot MC (2011) Do facets of self-reported impulsivity predict decision-making under ambiguity and risk? Evidence from a community sample. Psychiatry Res 190:322–326. 10.1016/j.psychres.2011.06.013 [DOI] [PubMed] [Google Scholar]
- Bell T, Lindner M, Mullins PG, Christakou A (2018) Functional neurochemical imaging of the human striatal cholinergic system during reversal learning. Eur J Neurosci 47:1184–1193. 10.1111/ejn.13803 [DOI] [PubMed] [Google Scholar]
- Benjamini Y, Hochberg Y (1995) Controlling the false discovery rate: a practical and powerful approach to multiple testing. J R Stat Soc B 57:289–300. [Google Scholar]
- Berry AS, Blakely RD, Sarter M, Lustig C (2015) Cholinergic capacity mediates prefrontal engagement during challenges to attention: evidence from imaging genetics. Neuroimage 108:386–395. 10.1016/j.neuroimage.2014.12.036 [DOI] [PMC free article] [PubMed] [Google Scholar]
- Bradfield LA, Bertran-Gonzalez J, Chieng B, Balleine BW (2013) The thalamostriatal pathway and cholinergic control of goal-directed action: interlacing new with existing learning in the striatum. Neuron 79:153–166. 10.1016/j.neuron.2013.04.039 [DOI] [PMC free article] [PubMed] [Google Scholar]
- Brainard DH. (1997) The psychophysics toolbox. Spat Vis 10:433–436. 10.1163/156856897X00357 [DOI] [PubMed] [Google Scholar]
- Brown HD, Baker PM, Ragozzino ME (2010) The parafascicular thalamic nucleus concomitantly influences behavioral flexibility and dorsomedial striatal acetylcholine output in rats. J Neurosci 30:14390–14398. 10.1523/JNEUROSCI.2167-10.2010 [DOI] [PMC free article] [PubMed] [Google Scholar]
- Brown MT, Tan KR, O'Connor EC, Nikonenko I, Muller D, Lüscher C (2012) Ventral tegmental area GABA projections pause accumbal cholinergic interneurons to enhance associative learning. Nature 492:452–456. 10.1038/nature11657 [DOI] [PubMed] [Google Scholar]
- Bull PN, Tippett LJ, Addis DR (2015) Decision making in healthy participants on the Iowa Gambling Task: new insights from an operant approach. Front Psychol 6:391. 10.3389/fpsyg.2015.00391 [DOI] [PMC free article] [PubMed] [Google Scholar]
- Christakou A, Gershman SJ, Niv Y, Simmons A, Brammer M, Rubia K (2013) Neural and psychological maturation of decision-making in adolescence and young adulthood. J Cogn Neurosci 25:1807–1823. 10.1162/jocn_a_00447 [DOI] [PubMed] [Google Scholar]
- Currie S, Hadjivassiliou M, Wilkinson ID, Griffiths PD, Hoggard N (2013) Magnetic resonance spectroscopy of the normal cerebellum: what degree of variability can be expected? Cerebellum 12:205–211. 10.1007/s12311-012-0415-1 [DOI] [PubMed] [Google Scholar]
- Daw ND. (2011) Trial-by-trial data analysis using computational models. In: Decision making, affect, and learning: attention and performance, Vol 23 (Delgado MR, Phelps EA, Robbins TW, eds). Oxford: Oxford UP. [Google Scholar]
- Field A. (2009) Discovering statistics using SPSS, Ed 3 London: Sage. [Google Scholar]
- Franken IH, van Strien JW, Nijs I, Muris P (2008) Impulsivity is associated with behavioral decision-making deficits. Psychiatry Res 158:155–163. 10.1016/j.psychres.2007.06.002 [DOI] [PubMed] [Google Scholar]
- Franklin NT, Frank MJ (2015) A cholinergic feedback circuit to regulate striatal population uncertainty and optimize reinforcement learning. Elife 4:e12029. 10.7554/eLife.12029 [DOI] [PMC free article] [PubMed] [Google Scholar]
- Gasparovic C, Song T, Devier D, Bockholt HJ, Caprihan A, Mullins PG, Posse S, Jung RE, Morrison LA (2006) Use of tissue water as a concentration reference for proton spectroscopic imaging. Magn Reson Med 55:1219–1226. 10.1002/mrm.20901 [DOI] [PubMed] [Google Scholar]
- Gray JA. (1970) The psychophysiological basis of introversion-extraversion. Behav Res Ther 8:249–266. 10.1016/0005-7967(70)90069-0 [DOI] [PubMed] [Google Scholar]
- Holmstrand EC, Lund D, Cherian AK, Wright J, Martin RF, Ennis EA, Stanwood GD, Sarter M, Blakely RD (2014) Transgenic overexpression of the presynaptic choline transporter elevates acetylcholine levels and augments motor endurance. Neurochem Int 73:217–228. 10.1016/j.neuint.2013.11.008 [DOI] [PMC free article] [PubMed] [Google Scholar]
- Hoover DB, Muth EA, Jacobowitz DM (1978) A mapping of the distribution of acetycholine, choline acetyltransferase and acetylcholinesterase in discrete areas of rat brain. Brain Res 153:295–306. 10.1016/0006-8993(78)90408-0 [DOI] [PubMed] [Google Scholar]
- Jenkinson M, Beckmann CF, Behrens TE, Woolrich MW, Smith SM (2012) FSL. Neuroimage:782–790. [DOI] [PubMed] [Google Scholar]
- Jiru F. (2008) Introduction to post-processing techniques. Eur J Radiol 67:202–217. 10.1016/j.ejrad.2008.03.005 [DOI] [PubMed] [Google Scholar]
- Jope RS. (1979) High affinity choline transport and AcetylCoA production in brain and their roles in the regulation of acetyl-choline synthesis. Brain Res Rev 1:313–344. 10.1016/0165-0173(79)90009-2 [DOI] [PubMed] [Google Scholar]
- Klein J, Weichel O, Ruhr J, Dvorak C, Löffelholz K (2002) A homeostatic mechanism counteracting K+-evoked choline release in adult brain. J Neurochem 80:843–849. 10.1046/j.0022-3042.2001.00754.x [DOI] [PubMed] [Google Scholar]
- Koshimura K, Miwa S, Lee K, Hayashi Y, Hasegawa H, Hamahata K, Fujiwara M, Kimura M, Itokawa Y (1990) Effects of choline administration on in vivo release and biosynthesis of acetylcholine in the rat striatum as studied by in vivo brain microdialysis. J Neurochem 54:533–539. 10.1111/j.1471-4159.1990.tb01904.x [DOI] [PubMed] [Google Scholar]
- Leong YC, Niv Y (2013) Human reinforcement learning processes act on learned attentionally-filtered representations of the world. Reinf Learn Decis Conf 43:43–47. [Google Scholar]
- Lindner M, Bell T, Iqbal S, Mullins PG, Christakou A (2017) In vivo functional neurochemistry of human cortical cholinergic function during visuospatial attention. PLoS One 12:e0171338. 10.1371/journal.pone.0171338 [DOI] [PMC free article] [PubMed] [Google Scholar]
- Lockman PR, Allen DD (2002) The transport of choline. Drug Dev Ind Pharm 28:749–771. 10.1081/DDC-120005622 [DOI] [PubMed] [Google Scholar]
- Löffelholz K. (1998) Brain choline has a typical precursor profile. J Physiol Paris 92:235–239. 10.1016/S0928-4257(98)80025-9 [DOI] [PubMed] [Google Scholar]
- Matamales M, Götz J, Bertran-Gonzalez J (2016) Quantitative imaging of cholinergic interneurons reveals a distinctive spatial organization and a functional gradient across the mouse striatum. PLoS One 11:e0157682. 10.1371/journal.pone.0157682 [DOI] [PMC free article] [PubMed] [Google Scholar]
- McCool MF, Patel S, Talati R, Ragozzino ME (2008) Differential involvement of M1-type and M4-type muscarinic cholinergic receptors in the dorsomedial striatum in task switching. Neurobiol Learn Mem 89:114–124. 10.1016/j.nlm.2007.06.005 [DOI] [PMC free article] [PubMed] [Google Scholar]
- Minati L, Aquino D, Bruzzone MG, Erbetta A (2010) Quantitation of normal metabolite concentrations in six brain regions by in-vivo 1 H-MR spectroscopy. J Med Phys 35:154–163. 10.4103/0971-6203.62128 [DOI] [PMC free article] [PubMed] [Google Scholar]
- Müller VI, Langner R, Cieslik EC, Rottschy C, Eickhoff SB (2015) Interindividual differences in cognitive flexibility: influence of gray matter volume, functional connectivity and trait impulsivity. Brain Struct Funct 220:2401–2414. 10.1007/s00429-014-0797-6 [DOI] [PMC free article] [PubMed] [Google Scholar]
- Naressi A, Couturier C, Devos JM, Janssen M, Mangeat C, de Beer R, Graveron-Demilly D (2001) Java-based graphical user interface for the MRUI quantitation package. MAGMA 12:141–152. 10.1007/BF02668096 [DOI] [PubMed] [Google Scholar]
- Niv Y, Edlund JA, Dayan P, O'Doherty JP (2012) Neural prediction errors reveal a risk-sensitive reinforcement-learning process in the human brain. J Neurosci 32:551–562. 10.1523/JNEUROSCI.5498-10.2012 [DOI] [PMC free article] [PubMed] [Google Scholar]
- Niv Y, Daniel R, Geana A, Gershman SJ, Leong YC, Radulescu A, Wilson RC (2015) Reinforcement learning in multidimensional environments relies on attention mechanisms. J Neurosci 35:8145–8157. 10.1523/JNEUROSCI.2978-14.2015 [DOI] [PMC free article] [PubMed] [Google Scholar]
- Okada K, Nishizawa K, Setogawa S, Hashimoto K, Kobayashi K (2018) Task-dependent function of striatal cholinergic interneurons in behavioural flexibility. Eur J Neurosci 47:1174–1183. 10.1111/ejn.13768 [DOI] [PubMed] [Google Scholar]
- Parikh V, St Peters M, Blakely RD, Sarter M (2013) The presynaptic choline transporter imposes limits on sustained cortical acetylcholine release and attention. J Neurosci 33:2326–2337. 10.1523/JNEUROSCI.4993-12.2013 [DOI] [PMC free article] [PubMed] [Google Scholar]
- Patton JH, Stanford MS, Barratt ES (1995) Factor structure of the Barratt Impulsiveness Scale. J Clin Psychol 51:768–774. 10.1002/1097-4679(199511)51:6<768::AID-JCLP2270510607>3.0.CO;2-1 [DOI] [PubMed] [Google Scholar]
- Pfefferbaum A, Adalsteinsson E, Spielman D, Sullivan EV, Lim KO (1999) In vivo spectroscopic quantification of the N-acetyl moiety, creatine, and choline from large volumes of brain gray and white matter: effects of normal aging. Magn Reson Med 41:276–284. 10.1002/(SICI)1522-2594(199902)41:2<276::AID-MRM10>3.0.CO;2-8 [DOI] [PubMed] [Google Scholar]
- Puts NA, Edden RA (2012) In vivo magnetic resonance spectroscopy of GABA: a methodological review. Prog Nucl Magn Reson Spectrosc 60:29–41. 10.1016/j.pnmrs.2011.06.001 [DOI] [PMC free article] [PubMed] [Google Scholar]
- Ragozzino ME, Jih J, Tzavos A (2002) Involvement of the dorsomedial striatum in behavioral flexibility: role of muscarinic cholinergic receptors. Brain Res 953:205–214. 10.1016/S0006-8993(02)03287-0 [DOI] [PubMed] [Google Scholar]
- Ragozzino ME, Mohler EG, Prior M, Palencia CA, Rozman S (2009) Acetylcholine activity in selective striatal regions supports behavioral flexibility. Neurobiol Learn Mem 91:13–22. 10.1016/j.nlm.2008.09.008 [DOI] [PMC free article] [PubMed] [Google Scholar]
- Reyngoudt H, Claeys T, Vlerick L, Verleden S, Acou M, Deblaere K, De Deene Y, Audenaert K, Goethals I, Achten E (2012) Age-related differences in metabolites in the posterior cingulate cortex and hippocampus of normal ageing brain: a 1H-MRS study. Eur J Radiol 81:e223–e231. 10.1016/j.ejrad.2011.01.106 [DOI] [PubMed] [Google Scholar]
- Schönberg T, Daw ND, Joel D, O'Doherty JP (2007) Reinforcement learning signals in the human striatum distinguish learners from nonlearners during reward-based decision making. J Neurosci 27:12860–12867. 10.1523/JNEUROSCI.2496-07.2007 [DOI] [PMC free article] [PubMed] [Google Scholar]
- Schultz W, Dayan P, Montague PR (1997) A neural substrate of prediction and reward. Science 275:1593–1599. 10.1126/science.275.5306.1593 [DOI] [PubMed] [Google Scholar]
- Smith SM. (2002) Fast robust automated brain extraction. Hum Brain Mapp 17:143–155. 10.1002/hbm.10062 [DOI] [PMC free article] [PubMed] [Google Scholar]
- Smith SM, Jenkinson M, Woolrich MW, Beckmann CF, Behrens TE, Johansen-Berg H, Bannister PR, De Luca M, Drobnjak I, Flitney DE, Niazy R, Saunders J, Vickers J, Zhang Y, De Stefano N, Brady JM, Matthews PM (2004) Advances in functional and structural MR image analysis and implementation as FSL. Neuroimage 23:208–219. 10.1016/j.neuroimage.2004.07.051 [DOI] [PubMed] [Google Scholar]
- Soher BJ, Semanchuk P, Todd D, Steinberg J, Young K (2010) Vespa: integrated applications for RF pulse design, spectral simulation and MRS data analysis, p 3169 Stockholm: ISMRM. [DOI] [PMC free article] [PubMed] [Google Scholar]
- Soreni N, Noseworthy MD, Cormier T, Oakden WK, Bells S, Schachar R (2006) Intraindividual variability of striatal (1)H-MRS brain metabolite measurements at 3 T. Magn Reson Imaging 24:187–194. 10.1016/j.mri.2005.10.027 [DOI] [PubMed] [Google Scholar]
- Steingroever H, Wetzels R, Wagenmakers E (2016) Bayes factors for reinforcement-learning models of the Iowa Gambling Task. Decision 3:115–131. 10.1037/dec0000040 [DOI] [Google Scholar]
- Sutton RS, Barto AG (1998) Reinforcement learning: an introduction (Books PB, ed). Cambridge, MA: Massachusetts Institute of Technology. [Google Scholar]
- Tanimura A, Pancani T, Lim SA, Tubert C, Melendez AE, Shen W, Surmeier DJ (2018) Striatal cholinergic interneurons and Parkinson's disease. Eur J Neurosci 47:1148–1158. 10.1111/ejn.13638 [DOI] [PMC free article] [PubMed] [Google Scholar]
- Tzavos A, Jih J, Ragozzino ME (2004) Differential effects of M1 muscarinic receptor blockade and nicotinic receptor blockade in the dorsomedial striatum on response reversal learning. Behav Brain Res 154:245–253. 10.1016/j.bbr.2004.02.011 [DOI] [PMC free article] [PubMed] [Google Scholar]
- Ueltzhöffer K, Armbruster-Genç DJ, Fiebach CJ (2015) Stochastic dynamics underlying cognitive stability and flexibility. PLoS Comput Biol 11:e1004331. 10.1371/journal.pcbi.1004331 [DOI] [PMC free article] [PubMed] [Google Scholar]
- Wang XC, Du XX, Tian Q, Wang JZ (2008) Correlation between choline signal intensity and acetylcholine level in different brain regions of rat. Neurochem Res 33:814–819. 10.1007/s11064-007-9509-4 [DOI] [PubMed] [Google Scholar]
- Zhang Y, Brady M, Smith S (2001) Segmentation of brain MR images through a hidden Markov random field model and the expectation-maximization algorithm. IEEE Trans Med Imaging 20:45–57. 10.1109/42.906424 [DOI] [PubMed] [Google Scholar]
- Zucca A, Zucca S, Wickens J (2018) Cholinergic mechanisms in adaptive behaviour. Eur J Neurosci 47:1146–1147. 10.1111/ejn.13926 [DOI] [PubMed] [Google Scholar]