Abstract
Objective:
The study was conducted to study the role of strain wave elastography in evaluating the response to neo-adjuvant chemotherapy (NACT) in patients with locally advanced breast cancer (LABC).
Methods:
In this Institutional review board approved study, 86 patients of LABC were investigated with strain wave elastography. Females receiving NACT had the affected breast scanned by strain wave elastography before each cycle of chemotherapy and immediately before surgery by two independent observers. Changes in elastographic parameters (size ratio, strain ratio) were documented and then compared to clinical and pathologic tumor response as evaluated after mastectomy.
Results:
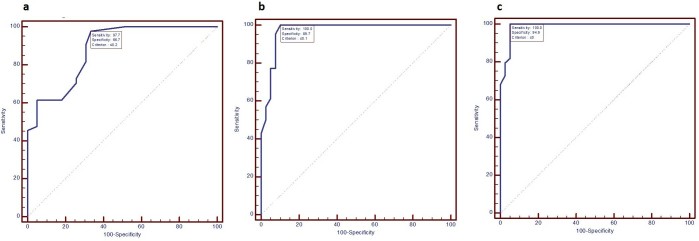
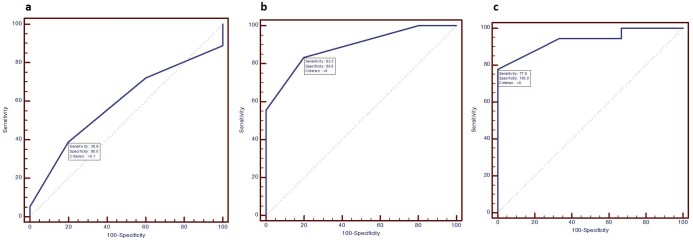
Elastographic strain ratio parameters demonstrated high sensitivity and moderate specificity for determining response even after the first cycle of neo-adjuvant chemotherapy [97.7% sensitivity (Sn), 68.7% specificity (Sp)]. Elastographic size ratio parameters showed moderate sensitivity and specificity for response detection after second and third cycle of neo-adjuvant chemotherapy (Sn, Sp: after second cycle of NACT Sn 83.3% Sp 80%; after third cycle of NACT Sn 77.8% Sp 100%).
Conclusion:
Strain ratio is the earliest predictor of treatment response in patients of LABC. Serial imaging with elastography has the potential to predict treatment response early during the course of NACT, which may prove vital in management of patients with breast cancer.
Advances in knowledge:
Strain wave elastography is a powerful tool to predict chemoresponse early during the course of management, thereby providing an optimal window to change treatment protocols.
Introduction
Breast cancer is the most common malignancy in females globally and the second most common cause of cancer-related mortality.1 Locally advanced breast cancer (LABC) refers to TNM Stage III and a subset of Stage IIB (T3NO). Breast cancer patients with tumor size more than 5 cm or skin or chest wall involvement or fixed axillary lymphadenopathy or metastatic ipsilateral internal mammary or supraclavicular lymphadenopathy, are included in this category. LABC is associated with a poor prognosis owing to the high rate of locoregional recurrence and distant metastasis.2,3
Present standard of care for LABC patients includes neo-adjuvant chemotherapy (NACT) followed by mastectomy and axillary nodal clearance, which can be further substantiated with radiation and hormonal therapy. NACT is provided to LABC patients with the intent of downstaging the tumor and combating micro-metastasis. This helps in maximizing surgical clearance, increased chances of breast conserving surgeries, reducing the need of axillary nodal clearance in addition to NACT acting as an in vivo chemosensitivity test. Initially, NACT alters neo-angiogenesis and bio-mechanical properties in tumor tissue. Morphological changes in tumor tissue as seen on imaging occur late during the course of NACT. Response to a particular chemotherapeutic regimen is only detected at the time of surgery by conventional imaging methods (clinical examination, mammography, B mode ultrasound). Hence, providing personalized cancer therapy and optimizing chemotherapeutic regimens in LABC patients is not possible by using these methods for response assessment.4–10
Ultrasound elastography is an unique dynamic technique which has the capability to measure tissue stiffness. It has been widely studied in the breast, prostate, liver, kidney, lymph nodes, thyroid and is being investigated in a variety of musculoskeletal applications.11–16 Elastography works by the principle of Young’s modulus and purports to measure the change in strain in a particular tissue on application of stress. Manual compression applied by the ultrasound equipment operator acts as “stress” in strain wave elastography and the degree of strain induced between consecutive ultrasound frames is projected as “elastograms”. Semi-quantitative parameters (strain ratio and size ratio) are obtained which depicts the stiffness in the abnormal tissue as compared to the normal tissue. This unique modality is cost-effective, does not involve the need of extrinsic contrast and enjoys all the advantages of conventional ultrasound.8,17,18 Newer imaging modalities (dynamic contrast enhanced-MRI, contrast enhanced ultrasound, diffuse optical spectroscopy, PET CT, technetium 99-sestamibi scinti-mammography) have been tried in early response assessment and predicting pathological response in patients with breast cancer. However, factors like unavailability of dedicated centers, high cost of contrast agents and limited expertise have restricted widespread use of such modalities.19–24
It has also been well known that malignant breast tissue is generally harder than the normal breast when subjected to clinical palpation. Elastography has been successfully used in the differentiation of benign and malignant breast lesions.25 Neo-adjuvant chemotherapy causes microscopic changes like fibrosis and inflammation, which alters the bio-mechanical properties of tumor tissue. Based on these observations, elastography can be employed in the assessment of tumor response. Initial studies have shown that strain wave elastographic parameters can be used in the early differentiation of patients responding and not responding to NACT, and in predicting pathological response.8 Our study was, therefore, an endeavor to further assess whether changes in tumor stiffness parameters is associated with response to NACT in patients with locally advanced breast cancer.
methods and materials
92 consecutive consenting female patients with newly diagnosed LABC participated in the study from September 2016 to March 2018. Inclusion criteria was defined as TNM stage III and T3NO subset of stage IIb breast cancer. Exclusion criteria included any contraindication to chemotherapy (poor clinical status, pregnant females) or prior administration of chemotherapy. A written consent form was obtained from each participant and the study was conducted in accordance with institutional research ethic guidelines. A detailed performa listing the patient’s demographic data, detailed clinical history and examination, investigations and treatment details was obtained from each participant. All patients received Cyclophosphamide, Anthracycline and 5 Flurouracil based chemotherapeutic regimen.
Out of these 92 patients enrolled in the study, 2 patients experienced discomfort and complained of a feeling of confinement during MR imaging leading to abandoning of the study. These patients were excluded from the study. Four patients succumbed to the disease during the study and these patients were also excluded as three cycles of neo-adjuvant chemotherapy could not be administered. Therefore, out of the 92 patients who initially participated in the study, only 86 patients were finally included in the study for data analysis.
Strain wave elastography was performed by two independent investigators by using an US scanner Philips iU22 equipped with linear-array transducer of frequency 5–17 MHz Both the investigators were radiologists with the first investigator having 2 years of experience in breast imaging and the second investigator having more than 20 years of experience in breast imaging. Both the observers were blinded to the clinical and treatment details of the patient during the examination. Strain wave elastography was performed by the same radiologist throughout the study. A pre-treatment MRI was performed for each patient using a 1.5 T Philips Healthcare MRI scanner and baseline tumor size measurements were documented by the first investigator.
Strain wave elastography
Upon activating the elastography mode in the ultrasound equipment, a dual screen appeared which showed grayscale image on one side and elastography color coding on the other side. All elastographic analysis was performed using a specific color-coding map for determining stiffness in the tissue (color blue, soft; color red, hard). Compression bar displayed on the equipment screen was used for checking quality of elastographic data. The ultrasound transducer focus was kept constant at the center of tumor under study.
For obtaining size ratio measurements, a region of interest (ROI) was selected which included the entire tumor. Size ratio was obtained by measuring diameter of the tumor in the elastography screen to the diameter of tumor on the grayscale screen.
Strain ratio measurements were obtained by selecting an area which had a portion of the tumor and surrounding normal appearing tissue. On the elastographic image, two similar sized ROI were kept at the same level in the normal and the abnormal tissue respectively. Strain ratios were obtained by dividing the normal tissue strain by the tumor strain.
Strain wave elastography assessment was performed before first, second and third cycle of neo-adjuvant chemotherapy and just before surgery. Elastography parameters obtained before the first cycle of NACT were regarded as “pre-treatment values”. Strain and size ratio differences were calculated by comparing the change in mean elastographic measurements obtained after first, second and third cycle of chemotherapy to the pre-treatment values (before first cycle of NACT). Strain and size ratio differences obtained before second cycle of NACT detected the response to first cycle of chemotherapy. Similarly, differences in elastographic parameters obtained before third cycle of NACT and just before surgery detected tumor response to second and third cycle of NACT respectively.
Mastectomy pathological specimens were examined by a pathology department for response evaluation. Histological grading of invasive ductal cancer was based on tubular structure, nuclear pleomorphism and mitotic count as pe the Modified criteria of Bloom and Richardson. All patients received Cyclophosphamide, Anthracycline and 5-Flurouracil-based chemotherapeutic regimen. After three cycles of chemotherapy, all patients underwent modified radical mastectomy and specimens were sent for histopathological examination. The pathological diagnosis and chemoresponse assessment were performed using the Miller-Payne system of 5 grades. The grades are as follows: 1:no change or some alteration in individual malignant cells but no change in tumor cellularity; 2: minor loss of tumor cells but overall cellularity still high, up to 30% decrease; 3: 30–90% decrease in malignant cells;4: more than 90% decrease in malignant cells; 5: no malignant cells identifiable with or without ductal carcinoma in situ. A grade score of 4 or 5 was categorized as good responder and a grade score of 1, 2, 3 was labeled as poor responder. A patient was considered as a “good responder” if there was a 50% or more decrease in the tumor size as compared to the pre-treatment size. A poor responder would mean less than 50% reduction in tumor size or unchanged disease or an enlargement in tumor size compared to the size before treatment. These criteria were defined based on previous studies.8 All the observations were recorded and analyzed later.
Statistical analysis
Categorical variables were presented in number and percentage (%) and continuous variables were presented as mean ± SD and median. Normality of data was tested by using Kolmogorov–Smirnov test. If the normality was rejected, then non-parametric test was used.
Statistical tests were applied as follows
Quantitative variables were compared using Unpaired t-test/Mann–Whitney Test (when the data sets were not normally distributed) between the two groups.
Receiver operating characteristic curve was used to find out cut-off point of change in size in ultrasound, strain ratio and size ratio for predicting responders.
A p -value of <0.05 was considered statistically significant.
The data were entered in MS EXCEL spreadsheet and analysis was performed using Statistical Package for Social Sciences (SPSS) v. 21.0.
Blands–Altman plot was used to assess the difference in measurements between the two observers. Intraclass coefficient was used to find out the strength of agreement between measurements of various parameters by the two observers. An intraclass correlation coefficient of less than 0.40, 0.40–0.59, 0.60–0.74 and more than 0.74 was regarded as poor, fair, good and excellent interobserver agreement respectively.
Results
All 86 patients included in the study were diagnosed to have infiltrating ductal carcinoma on tissue biopsy. Maximum patients (55.8%, 48/86 patients) belonged to the age group of more than 50 years of age. 87.2% of females (75/86 patients) were post-menopausal while the rest were pre-menopausal (12.7%, 11/86 patients). 38.37% (33/86) patients had ER negative, PR negative and Her-2-neu positive breast cancer. 27.9% (24/86) of patients had ER positive, PR positive and Her-2—neu negative breast cancer while 24.41% (21/86) of patients had triple negative breast cancer.
52.32% (45 out of 86) of patients were classified as “good responders” and 47.68% of patients were classified as “poor responders”. 62.2% (28/45) of good responders had metastatic axillary lymphadenopathy (as diagnosed on fine-needle aspiration cytology) before the onset of chemotherapy. Approximately 61% (17/28) of good responders having axillary lymph nodal metastasis showed complete disappearance of axillary lymph node metastasis. 39% (11/28) of good responders having axillary lymph node metastasis showed no change after three cycles of NACT. 70% (29/41) of poor responders showed metastatic axillary lymphadenopathy (as diagnosed on fine-needle aspiration cytology) before the onset of chemotherapy. 82% of the poor responders (34/41) showed axillary lymph nodal metastasis at the end of three cycles of chemotherapy.
Tumor response assessment by strain ratio
Strain ratio measurements were obtained in all patients. Mean strain ratio measurements between good responders and poor responders before administration of first cycle of NACT were found to be 6.75 ± 0.81 and 6.28 ± 1 respectively. No statistically significant change was observed in pre-NACT mean strain ratio measurements of good responders and poor responders. The average of the difference of measurements of strain ratio before first cycle of chemotherapy between the two observers was −0.03488 with limit of agreement of −0.2634 to 0.1936. Statistically significant results in mean strain ratio measurements between good responders and poor responders were observed before second and third cycle of NACT and just before surgery [good responder vs poor responder (p-value); before second cycle 6.32 ± 0.9 vs 6.77 ± 0.75 (0.017); before third cycle 5.71 ± 0.98 vs 7.41 ± 0.84 (<0.0001); before surgery 5.06 ± 0.94 vs 7.76 ± 0.67 (<0.0001)]. Change in mean strain ratio measurements was found to be statistically significant after first, second and third cycle of chemotherapy as compared to pre-treatment values [good responders vs poor responders (p-value): after first cycle 0.43 ± 0.43 vs 0.49 ± 0.62 (<0.0001); after second cycle 1.04 ± 0.69 vs 1.13 ± 0.79 (<0.0001); after third cycle1.69 ± 0.72 vs 1.48 ± 0.95 (<0.0001)] Figures 1–10. ROC analysis was performed and area under the curve were calculated with a confidence interval of 95% [Sensitivity(Sn), Specificity(Sp): after first cycle of NACT Sn 97.7%, Sp 68.7%, (cut-off <0.2); after second cycle of NACT Sn100% Sp 89.7%, cut-off <0.1; after third cycle of NACT Sn 100% Sp 94.9%, cut-off <0] Figure 11) (Table 1) The average of the difference of measurements of strain ratio after first, second and third cycle of chemotherapy between the two observers yielded negligible interoperator variance [cycle; mean; limit of agreement: first cycle; −0.05465; −0.2665 to 0.1572, second cycle; −0.02907; −0.2927 to 0.2345, third cycle; −0.06279; −0.06279 to 0.1582]. Intraclass correlation coefficient for both single and average measurements of strain ratio before and after each cycle of neo-adjuvant chemotherapy was more than 0.85, suggesting excellent agreement between the readings of the two observers.
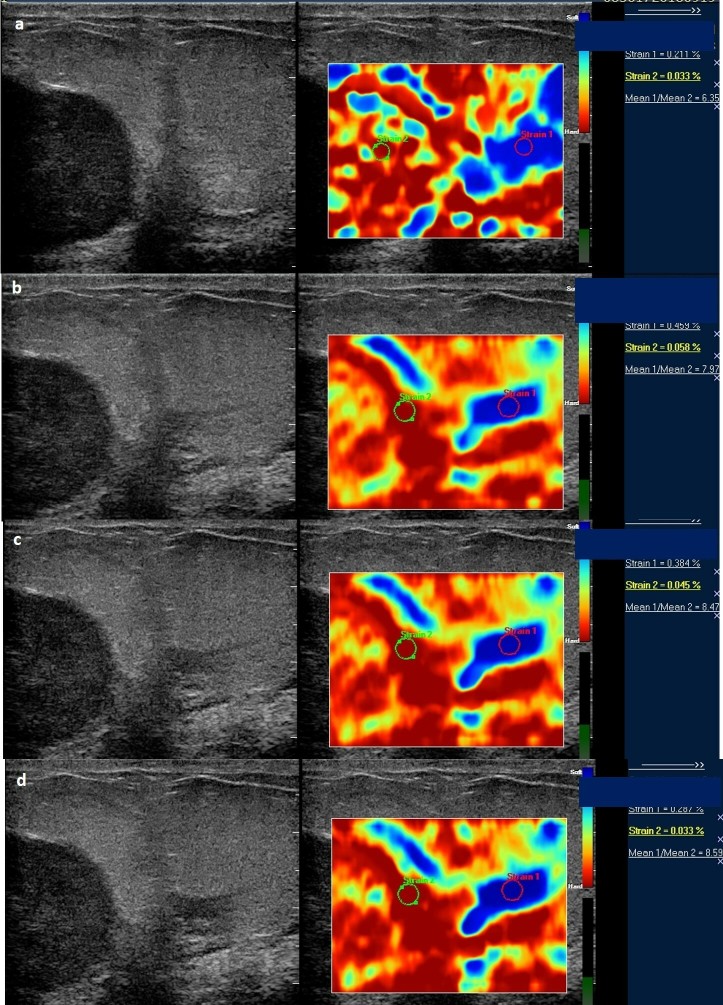
Figure 1. .
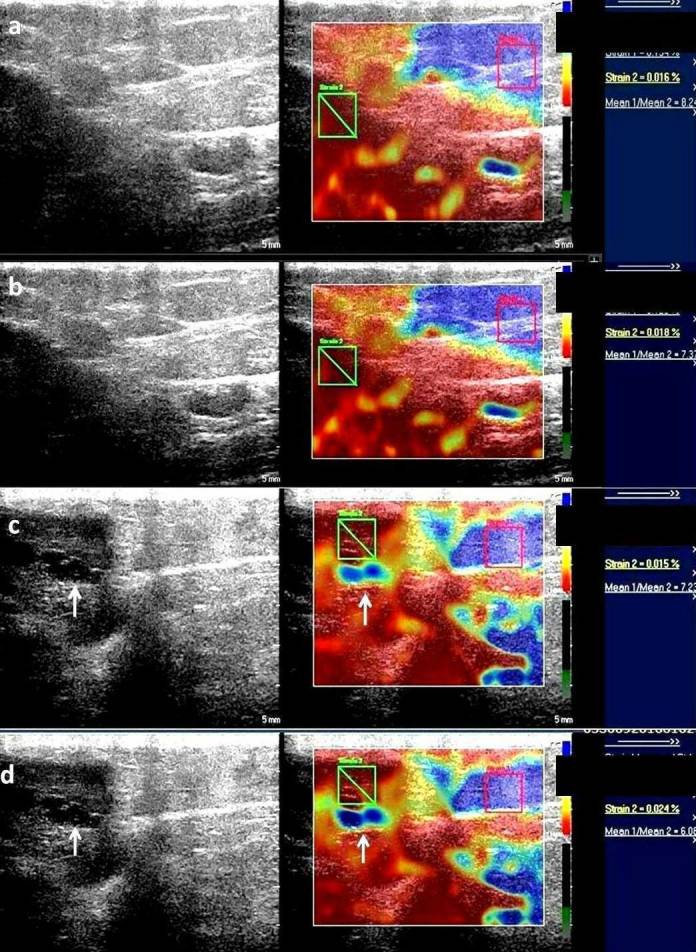
Serial elastographic analyses before treatment (a) and after first (b), second (c) and third cycle (d) of chemotherapy. There is a decrease in strain ratio from 8.2 before treatment initiation to 6.08 after third cycle of chemotherapy. This patient was classified as a "responder" on histopathology. Additionally, a hypoechoic area (white arrow) is seen to have appeared within the tumor after second and third cycle of chemotherapy which is seen as soft (blue) as compared to the rest of the tumor strain (red). These findings were suggestive of necrotic area within the tumor.
Figure 2. .
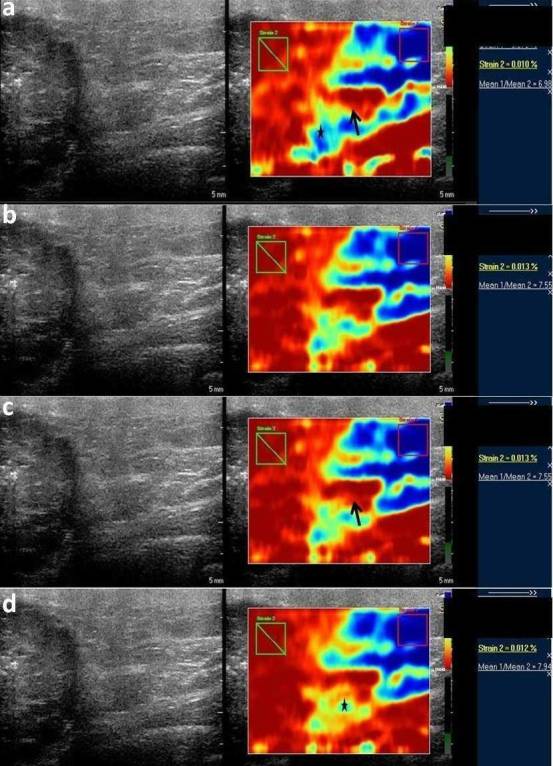
Serial elastographic analyses before treatment (a) and after first (b), second (c) and third (d) cycle of NACT in a locally advanced tumor showing clustered pleomorphic microcalcifications. Mild increase in strain ratio is seen after three cycles of chemotherapy (strain ratio 7.9) as compared to the baseline values (strain 6.9). No decrease in strain ratio is seen at any point during the course of chemotherapy. Peritumoral area appears hard (red) suggestive of tumor desmoplasia (black arrows) with mild increase in peritumoral stiffness (*). NACT, neo-adjuvant chemotherapy.
Figure 3. .
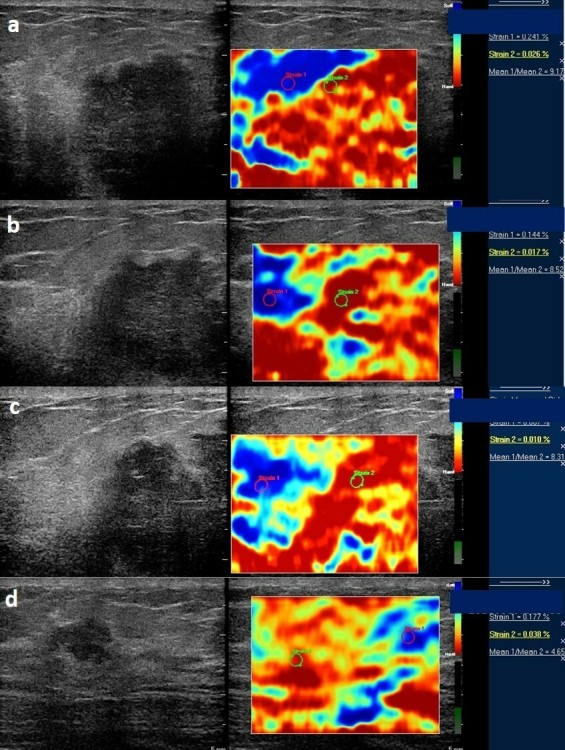
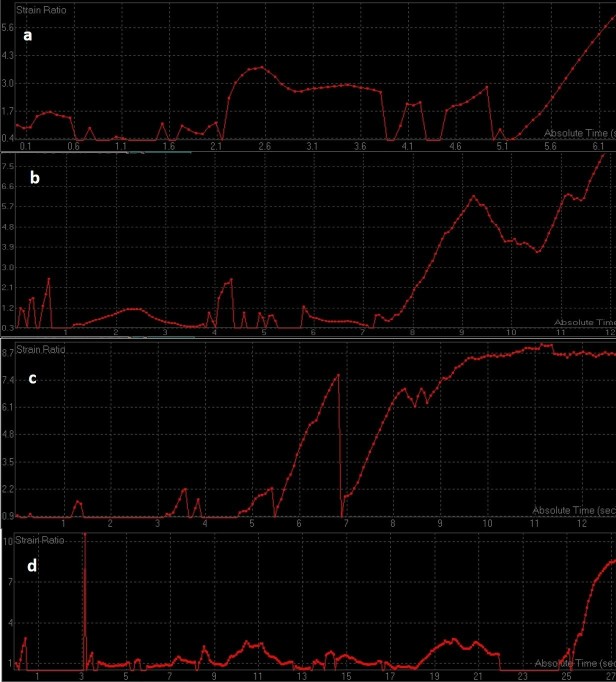
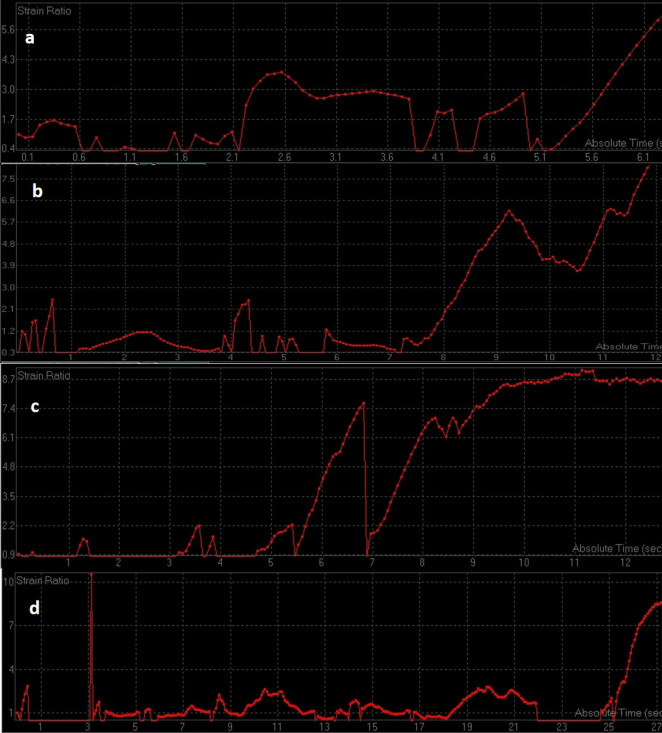
Serial strain ratio assessment of a 49-year-old-female with biopsy proven carcinoma seen in upper outer quadrant of the left breast obtained before (a) and after first (b), second (c), and third cycle of NACT (d). Strain ratio showed serial decline with respect to baseline values after all cycles of NACT. However, there was significant (>50%) decrease in tumor size post-NACT administration and patient was denoted as a “good responder” after pathological assessment. Strain ratio analysis was concordant with pathological response in this patient. NACT, neo-adjuvant chemotherapy.
Figure 4. .
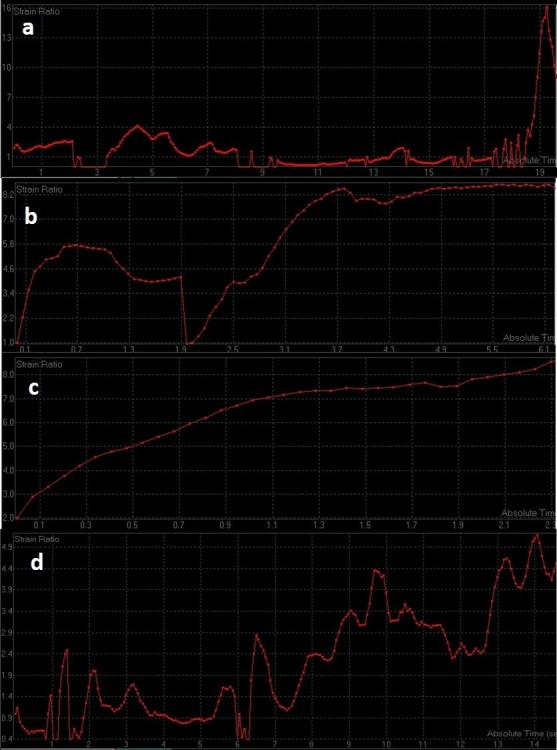
Serial strain ratio elastograms of the same patient as in Figure 3 obtained before (a) and after first (b), second (c), and third cycle of NACT (d). NACT, neo-adjuvant chemotherapy.
Figure 5. .
Serial strain ratio assessment of a 57-year-old-female with biopsy proven carcinoma seen in upper inner quadrant of the left breast obtained before (a) and after first (b), second (c), and third cycle of NACT (d). Strain ratio showed serial increase with respect to baseline values after all cycles of NACT. However, there was no significant change in tumor size post-NACT administration and patient was denoted as a “poor responder” after pathological assessment. Strain ratio analysis was concordant with pathological poor response in this patient. NACT, neo-adjuvant chemotherapy.
Figure 6. .
Serial strain ratio elastograms of the same patient as in Figure 5 obtained before (a) and after first (b), second (c), and third cycle of NACT (d). NACT, neo-adjuvant chemotherapy.
Figure 7. .
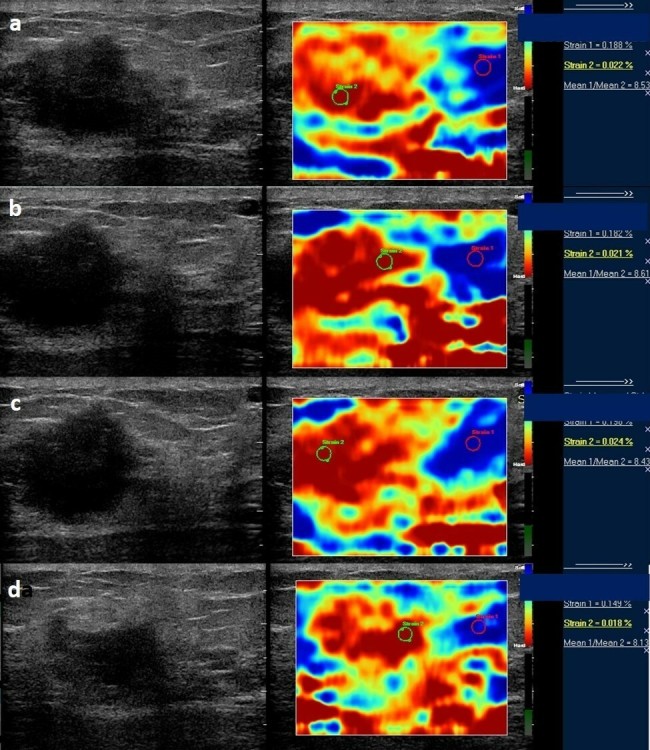
Serial strain ratio assessment of a 52-year-old-female with biopsy proven carcinoma seen in lower outer quadrant of the right breast obtained before (a) and after first (b), second (c), and third cycle of NACT (d). Strain ratio showed serial decline with respect to baseline values after all cycles of NACT. However, there was no change in tumor size post-NACT administration and patient was denoted as a “poor responder” after pathological assessment. Strain ratio analysis showed a false negative result in this patient. NACT, neo-adjuvant chemotherapy.
Figure 8. .
Serial strain ratio elastograms of the same patient as in Figure 7 obtained before (a) and after first (b), second (c), and third cycle of NACT (d). NACT, neo-adjuvant chemotherapy.
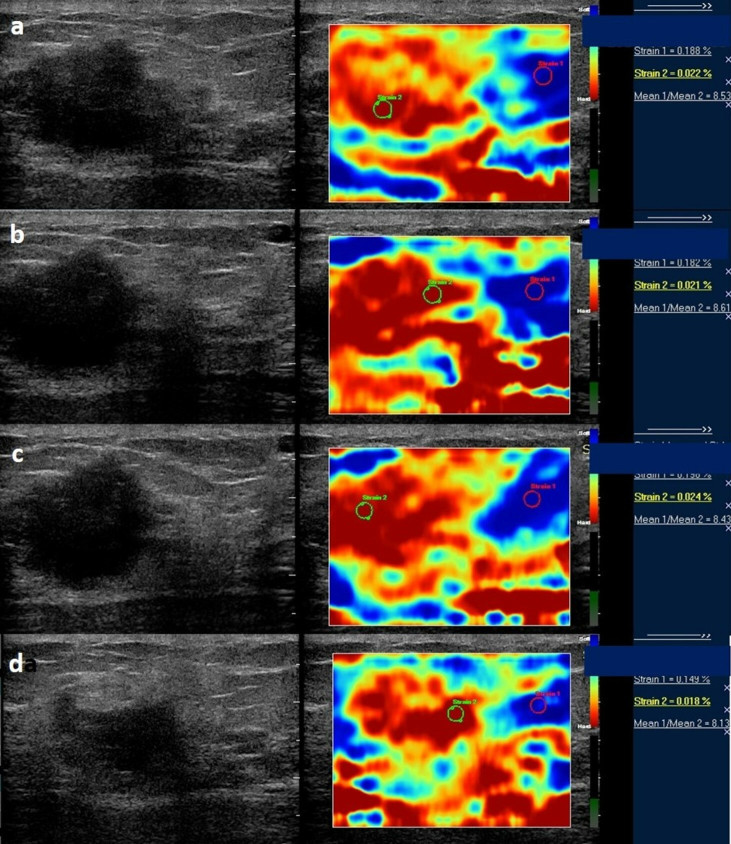
Figure 9. .
Serial strain ratio assessment of a 45-year-old-female with biopsy proven carcinoma seen in upper outer quadrant of the right breast obtained before (a) and after first (b), second (c), and third cycle of NACT (d). Strain ratio remains relatively constant with respect to baseline values after first and second cycle of NACT and shows slight decrease after third cycle of NACT. However, there was gross decrease in tumor size post-NACT administration and patient was denoted as a “good responder” after pathological assessment. Strain ratio analysis showed a false-positive result in this patient. NACT, neo-adjuvant chemotherapy.
Figure 10. .
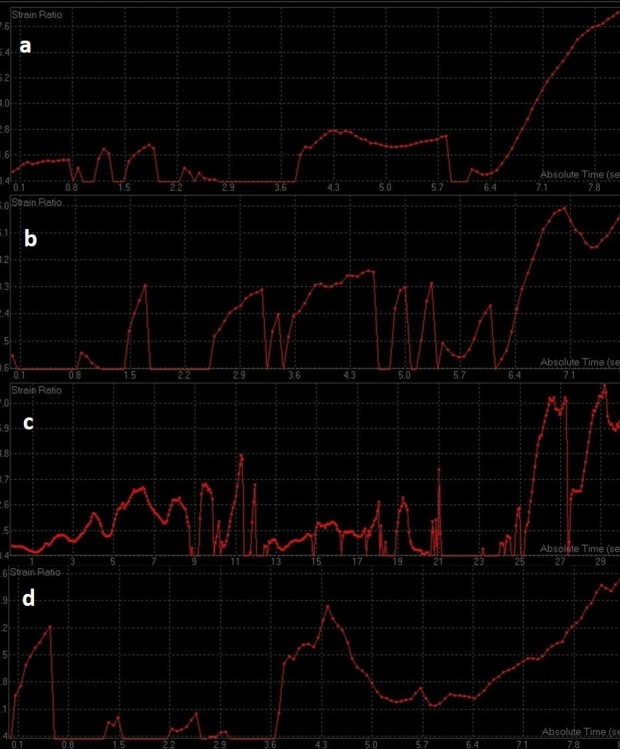
Serial strain ratio elastograms of the same patient as in Figure 9 obtained before (a) and after first (b), second (c), and third cycle of NACT (d). NACT, neo-adjuvant chemotherapy.
Figure 11. .
ROC curves of change in strain ratio after first (a), second (b) and third (c) cycle of chemotherapy. ROC, receiver operating characteristic.
Table 1.
ROC analysis of elastographic parameters after three cycles of neo-adjuvant chemotherapy
| Area under the ROC curve (AUC) | Standard Error | 95% Confidence interval | P value | Cut off | Sensitivity | Specificity | |
| Change in strain ratio after first cycle of NACT | 0.889973 | 0.0335 | 0.804081 to 0.947251 | <0.0001 | ≤0.2 | 97.78 | 68.7 |
| Change in strain ratio after second cycle of NACT | 0.971545 | 0.0172 | 0.910742 to 0.995370 | <0.0001 | ≤0.1 | 100 | 89.7 |
| Change in strain ratio after third cycle of NACT | 0.988347 | 0.0088 | 0.936867 to 0.999703 | <0.0001 | ≤0 | 100 | 94.9 |
| Change in size ratio after first cycle of NACT | 0.589474 | 0.134 | 0.372171 to 0.783867 | 0.5047 | >0.1 | 38.9 | 80 |
| Change in size ratio after second cycle of NACT | 0.868421 | 0.0728 | 0.668259 to 0.970412 | <0.0001 | >0 | 83.3 | 80 |
| Change in size ratio after third cycle of NACT | 0.938596 | 0.0529 | 0.748549 to 0.996467 | <0.0001 | >0 | 77.8 | 100 |
NACT, neo-adjuvant chemotherapy; ROC, receiver operating characteristic.
Tumor response assessment by size ratio
Size ratio measurements could only be obtained in 24 patients (good responders: 19, poor responders: 5) before first cycle of NACT and therefore, comparative assessment of mean size ratio measurements was performed for only 24 patients. No statistically significant change was observed in pre-NACT mean size ratio measurements of good responders and poor responders [good responders vs poor responders (p-value): 1.18 ± 0.11 vs 1.32 ± 0.16 (0.072)]. The average of the difference of measurements of size ratio before first cycle of chemotherapy between the two observers was −0.008333 with limit of agreement of −0.08835 to 0.07168. Statistically significant results in mean size ratio measurements between good responders and poor responders were observed before second and third cycle of NACT and just before surgery [good responder vs poor responder (p-value); before second cycle 1.08 ± 0.15 vs 1.24 ± 0.11 (0.043); before third cycle 1 ± 0.17 vs 1.36 ± 0.19 (0.0003); before surgery 1.04 ± 0.15 vs 1.43 ± 0.21 (0.01)]. Change in mean size ratio measurements were found to be statistically insignificant after first cycle of NACT as compared to pre-treatment values [good responders vs poor responders (p-value): after first cycle 0.1 ± 0.12 vs 0.08 ± 0.08 (0.528)]. Change in mean size ratio measurements were found to be statistically significant after second and third cycle of chemotherapy as compared to pre-treatment values [good responders vs poor responders (p-value): after second cycle 0.19 ± 0.16 vs 0.04 ± 0.15 (0.009); after third cycle 0.13 ± 0.13 vs 0.13 ± 0.15 (0.014)]. ROC analysis was performed and area under the curve were calculated with a confidence interval of 95% [Sensitivity(Sn), Specificity(Sp): after second cycle of NACT Sn 83.3% Sp 80% cut off >0; after third cycle of NACT Sn 77.8% Sp 100% cut off >0] (Figure 12) (Table 1). The average of the difference of measurements of size ratio after first, second and third cycle of chemotherapy between the two observers yielded negligible inter operator variance [cycle; mean; limit of agreement: first cycle; 0.008333; −0.047 to 0.06367, second cycle; −0.03214; −0.1521 to 0.08778, third cycle; −0.006897; −0.07969 to 0.0659]. Intraclass correlation coefficient for both single and average measurements of size ratio before and after each cycle of neo-adjuvant chemotherapy was more than 0.85, suggesting excellent agreement between the readings of the two observers.
Figure 12. .
ROC curves of change in size ratio after first (a), second (b) and third (c) cycle of chemotherapy. ROC, receiver operatingcharacteristic.
Discussion
Response assessment to NACT is presently determined by monitoring changes in clinical and imaging measurements of morphological tumor size. These methods detect response at the time of surgery, leaving no scope to alter chemotherapeutic regimen protocols. Early detection of tumor response has the potential to predict pathological complete response, identify patients who may or may not benefit from a change in treatment regimen and determine long-term prognosis. It can also guide an operating surgeon to personalize timing and degree of surgical intervention.4,5,8,9
Our study showed that change in mean strain ratio measurements as compared to pre-treatment values, at each cycle of NACT declined more in good responders in contrast to poor responders. This observation can be attributed to NACT-induced changes in biomechanical properties of a tumor.8 NACT causes fibrosis within the responding tumor tissue, thereby leading to a decrease in tissue stiffness and an increase in tumor strain. Rise in tumor strain is reflected as a decline in strain ratio on elastography analysis. In a study of 15 patients of LABC by Falou et al, strain ratio was found to be the best and earliest predictor of tumor response.8 Hayashi et al evaluated tumor stiffness using Tsukuba scoring system in 55 patients of breast cancer receiving NACT and found similar results.26
Serial assessment of mean size ratio measurements was possible in only 27.90 percent of cases (24 out of 86 cases). This was due to a technical reason wherein size ratio measurements could not be obtained in most patients of LABC as the tumor size exceeded the footprint of the transducer. Most patients had a tumor size of more than 5 cm which made it technically infeasible to obtain tumor diameter measurements using a high frequency transducer (5–17 MHz). In 24 patients of LABC who underwent tumor response monitoring using size ratio as a predictor, decline in mean size ratio measurements after second and third cycle of NACT was seen in good responders in contrast to poor responders. These results were found to be statistically significant. Decline in mean size ratio measurements as compared to pre-treatment values after first cycle of chemotherapy in good responders and poor responders were found to be statistically insignificant. Peri-tumoral stiffness has been found to be due to stromal collagen cross-linking and derangement in extracellular matrix enzyme lysyl oxidase, fibronectin and stromal caveolin 1. These molecular biomarkers play an important role in the progression and severity of disease. Reduction in tumor desmoplasia in patients responding to NACT is observed as a decline in size ratio on elastography.27
Strain wave elastography is an ideal investigative modality for the serial assessments at each cycle of chemotherapy as it is devoid of external contrast agent and shares all the advantages of ultrasound. Chemotherapy induced alterations in molecular, vascular and biomechanical properties of tumor tissue precede gross morphological changes in tumor size. As alterations in stiffness parameters in responding LABC patients (good responders) directly reflect the microscopic alterations (fibrosis) in the tumor tissue, strain wave elastography provides a stark contrast between patients responding well (good responders) and responding poorly to neo-adjuvant chemotherapy.8,10,17,19,20,26,27 In our experience, this is the only study of LABC patients receiving a single chemotherapeutic regimen in which strain wave elastographic measurements were employed as a predictor of chemo response.
Other newer elastographic techniques like shear wave elastography have also been used in predicting response to NACT in breast cancer patients. Strain and shear wave elastography are different from each other with respect to the “stress” applied during elastographic analysis. In strain wave elastography, the “stress” is produced by manual compression of the tissue under study. A quantitative analysis of the tissue elasticity is precluded as the stress applied by the operator cannot be measured. Therefore, semi-quantitative parameters have been developed namely strain and size ratio which provide an indirect assessment of tissue elasticity. The stress applied during shear wave elastography is generated by “shear waves” which are generated when a focused ultrasound beam is applied to a tissue. The velocities of these “shear waves” are proportional to the square root of shear elastic modulus of the tissue. Since both the stress applied and strain induced can be easily measured in shear wave elastography, it provides a more quantitative assessment of stiffness as compared to strain wave elastography. Theoretically, shear wave elastography may seem to be a better modality than strain wave elastography. However, recent studies comparing strain and shear wave elastography have shown that both ultrasound techniques showed similar diagnostic performances in differentiating between benign and malignant breast lesions and in predicting the response to NACT in patients with breast cancer.28,29 Serial dynamic contrast enhanced MRI is currently considered as the modality of choice to assess tumor response to chemotherapy. The response assessment is based on enhancement characteristics of the tumor which in turn, are dependent on tumor angiogenesis. Change in largest diameter of late enhancement has been found to be the single most predictive factor of response in a study conducted by Loo et al. Another study reports a decrease in Ktrans in patients responding well to chemotherapy. Serial contrast enhanced MRI is disadvantaged by high cost of repeated examinations and lack of expertise. Deranged kidney function tests is also a major contraindication of contrast enhanced MRI.30,31
The major limitation of elastography is its dependence on the expertise of the operator. In order to obtain accurate measurements, it is imperative to ensure adequate compression and accurate positioning of the ROI and avoiding necrotic components of the tumor. Further studies are required to test the interobserver variability. The same area of tumor is supposed to be assessed ideally at each cycle of neo-adjuvant chemotherapy. However, follow up assessment of the area studied previously was not possible in some “good” responding patients, where the tumor was reduced into multiple small foci or where the area of malignant tissue was replaced by necrotic tissue. In such cases, area with the maximum strain ratio was taken into consideration. Certain rare histopathological varieties of breast cancer; namely mucinous carcinoma may give false positive results on elastographic assessment. However, most of the patients of breast cancer are of invasive ductal variety as in our study. Another limitation of the study is the lack of comparison with response assessed with other available imaging modalities.19–24 A study comprising of comprehensive multimodality response evaluation in a large number of patients before and after each cycle of chemotherapy may provide a better clue to a single or a group of imaging modalities with the best diagnostic performance.
In conclusion, our study showed that serial decline in strain ratio measurements correlated well with pathological tumor response in LABC patients. Furthermore, obtaining size ratio measurements may be technically difficult in patients with large tumor size. Serial size ratio measurements detected pathological response only after administration of second cycle of NACT as compared to strain ratio which can detect tumor response even after first cycle of NACT. A large study population is required to ensure repeatability and validation of this technique and to determine its relationship with other prognostic immunohistochemical and other molecular biomarkers.
Contributor Information
Amit Katyan, Email: akatyan9@gmail.com;amitkatyan@icloud.com.
Mahesh Kumar Mittal, Email: drmkmittal@rediffmail.com.
Chinta Mani, Email: chintamani7@rediffmail.com.
Ashish Kumar Mandal, Email: ashish_mandal@hotmail.com.
REFERENCES
- 1. Jemal A , Bray F , Center MM , Ferlay J , Ward E , Forman D . Global cancer statistics . 61 . a cancer journal for clinicians: : The British Institute of Radiology. ; 2011. . . 69 – 90 . [DOI] [PubMed] [Google Scholar]
- 2. Raina V , Kunjahari M , Shukla NK , Deo SVS , Sharma A , Mohanti BK , et al. . Outcome of combined modality treatment including neoadjuvant chemotherapy of 128 cases of locally advanced breast cancer: data from a tertiary cancer center in northern India . Indian J Cancer 2011. ; 48 : 80 – 5 . doi: 10.4103/0019-509X.75838 [DOI] [PubMed] [Google Scholar]
- 3. Giordano SH . Update on locally advanced breast cancer . Oncologist 2003. ; 8 : 521 – 30 . doi: 10.1634/theoncologist.8-6-521 [DOI] [PubMed] [Google Scholar]
- 4. Hortobagyi GN . Comprehensive management of locally advanced breast cancer . Cancer 1990. ; 66 ( S14 ): 1387 – 91 . doi: [DOI] [PubMed] [Google Scholar]
- 5. Untch M , Minckwitz GV . Neo-adjuvant chemotherapy: early response as a guide for further treatment: clinical, radiological and biological . J Natl Cancer Inst Monogr 2011. ; 43 : 138 – 41 . [DOI] [PubMed] [Google Scholar]
- 6. Wang M , Hou L , Chen M , Zhou Y , Liang Y , Wang S , et al. . Neoadjuvant chemotherapy creates surgery opportunities for inoperable locally advanced breast cancer . Sci Rep 2017. ; 7 : 44673 . doi: 10.1038/srep44673 [DOI] [PMC free article] [PubMed] [Google Scholar]
- 7. Pilewskie M , Morrow M . Axillary nodal management following neoadjuvant chemotherapy: a review . JAMA Oncol 2017. ; 3 : 549 – 55 . doi: 10.1001/jamaoncol.2016.4163 [DOI] [PMC free article] [PubMed] [Google Scholar]
- 8. Falou O , Naini AS , Prematilake S , Sofron E , Papanicolau N , Iradji S , et al. . Evaluation of NACT response in women with LABC by ultrasound elastography . Transl Oncol 2013. ; 6 : 17 – 24 . [DOI] [PMC free article] [PubMed] [Google Scholar]
- 9. Peintinger F , Kuerer HM , Anderson K , Boughey JC , Meric-Bernstam F , Singletary SE , et al. . Accuracy of the combination of mammography and sonography in predicting tumor response in breast cancer patients after neoadjuvant chemotherapy . Ann Surg Oncol 2006. ; 13 : 1443 – 9 . doi: 10.1245/s10434-006-9086-9 [DOI] [PubMed] [Google Scholar]
- 10. Baumgartner A , Tausch C , Hosch S , Papassotiropoulos B , Varga Z , Rageth C , et al. . Ultrasound-based prediction of pathologic response to neoadjuvant chemotherapy in breast cancer patients . Breast 2018. ; 39 : 19 – 23 . doi: 10.1016/j.breast.2018.02.028 [DOI] [PubMed] [Google Scholar]
- 11. Correas J-M , Tissier A-M , Khairoune A , Khoury G , Eiss D , Hélénon O . Ultrasound elastography of the prostate: state of the art . Diagn Interv Imaging 2013. ; 94 : 551 – 60 . doi: 10.1016/j.diii.2013.01.017 [DOI] [PubMed] [Google Scholar]
- 12. Frulio N , Trillaud H . Ultrasound elastography in liver . Diagn Interv Imaging 2013. ; 94 : 515 – 34 . doi: 10.1016/j.diii.2013.02.005 [DOI] [PubMed] [Google Scholar]
- 13. Wang Z , Yang H , Suo C , Wei J , Tan R , Gu M . Application of ultrasound elastography for chronic allograft dysfunction in kidney transplantation . J Ultrasound Med 2017. ; 36 : 1759 – 69 . doi: 10.1002/jum.14221 [DOI] [PubMed] [Google Scholar]
- 14. Kwak JY , Kim E-K . Ultrasound elastography for thyroid nodules: recent advances . Ultrasonography 2014. ; 33 : 75 – 82 . doi: 10.14366/usg.13025 [DOI] [PMC free article] [PubMed] [Google Scholar]
- 15. Alam F , Naito K , Horiguchi J , Fukuda H , Tachikake T , Ito K . Accuracy of sonographic elastography in the differential diagnosis of enlarged cervical lymph nodes: comparison with conventional B-mode sonography . AJR Am J Roentgenol 2008. ; 191 : 604 – 10 . doi: 10.2214/AJR.07.3401 [DOI] [PubMed] [Google Scholar]
- 16. Drakonaki EE , Allen GM , Wilson DJ . Ultrasound elastography for musculoskeletal applications . Br J Radiol 2012. ; 85 : 1435 – 45 . doi: 10.1259/bjr/93042867 [DOI] [PMC free article] [PubMed] [Google Scholar]
- 17. Sigrist RMS , Liau J , Kaffas AE , Chammas MC , Willmann JK . Ultrasound elastography: review of techniques and clinical applications . Theranostics 2017. ; 7 : 1303 – 29 . doi: 10.7150/thno.18650 [DOI] [PMC free article] [PubMed] [Google Scholar]
- 18. Gennisson J-L , Deffieux T , Fink M , Tanter M . Ultrasound elastography: principles and techniques . Diagn Interv Imaging 2013. ; 94 : 487 – 95 . doi: 10.1016/j.diii.2013.01.022 [DOI] [PubMed] [Google Scholar]
- 19. Gezer NS , Orbay O , Balci P , Durak MG , Demirkan B , Saydam S . Evaluation of neoadjuvant chemotherapy response with dynamic contrast enhanced breast magnetic resonance imaging in locally advanced invasive breast cancer . J Breasth Health 2014. ; 10 : 111 – 8 . doi: 10.5152/tjbh.2014.2035 [DOI] [PMC free article] [PubMed] [Google Scholar]
- 20. Lee SC , Grant E , Sheth P , Garcia AA , Desai B , Ji L , et al. . Accuracy of contrast-enhanced ultrasound compared with magnetic resonance imaging in assessing the tumor response after neoadjuvant chemotherapy for breast cancer . J Ultrasound Med 2017. ; 36 : 901 – 11 . doi: 10.7863/ultra.16.05060 [DOI] [PMC free article] [PubMed] [Google Scholar]
- 21. Cerussi A , Hsiang D , Shah N , Mehta R , Durkin A . John Butler,and Bruce J. Tromberg. Predicting response to breast cancer neo-adjuvant chemotherapy using diffuse optical spectroscopy . Philos Trans A Math Phys Eng Sci 2011. ; 369 : 4512 – 30 . [DOI] [PMC free article] [PubMed] [Google Scholar]
- 22. Ogino K , Nakajima M , Kakuta M , Hayashi M , Yamaguchi S , Tsuchioka T , et al. . Utility of FDG-PET/CT in the evaluation of the response of locally . Advanced Breast Cancer to Neoadjuvant Chemotherapy 2014. ; 99 : 309 – 18 . [DOI] [PMC free article] [PubMed] [Google Scholar]
- 23. Mankoff DA , Dunnwald LK , Gralow JR , Ellis GK , Drucker MJ , Livingston RB . Monitoring the response of patients with locally advanced breast carcinoma to neoadjuvant chemotherapy using [technetium 99m]-sestamibi scintimammography . Cancer 1999. ; 85 : 2410 – 23 . doi: [DOI] [PubMed] [Google Scholar]
- 24. An YY , Kim SH , Kang BJ , Lee AW . Treatment response evaluation of breast cancer after neoadjuvant chemotherapy and usefulness of the imaging parameters of MRI and PET/CT . J Korean Med Sci 2015. ; 30 : 808 – 15 . doi: 10.3346/jkms.2015.30.6.808 [DOI] [PMC free article] [PubMed] [Google Scholar]
- 25. Cho N , Moon WK , Kim HY , Chang JM , Park SH , Lyou CY . Sonoelastographic strain index for differentiation of benign and malignant nonpalpable breast masses . AIUM 2010. ; 29 : 1 – 7 . doi: 10.7863/jum.2010.29.1.1 [DOI] [PubMed] [Google Scholar]
- 26. Hayashi M , Yamamoto Y , Ibusuki M , Fujiwara S , Yamamoto S , Tomita S , et al. . Evaluation of tumor stiffness by elastography is predictive for pathologic complete response to neoadjuvant chemotherapy in patients with breast cancer . Ann Surg Oncol 2012. ; 19 : 3042 – 9 . doi: 10.1245/s10434-012-2343-1 [DOI] [PubMed] [Google Scholar]
- 27. Evans A , Armstrong S , Whelehan P , Thomson K , Rauchhaus P , Purdie C , et al. . Can shear-wave elastography predict response to neoadjuvant chemotherapy in women with invasive breast cancer? Br J Cancer 2013. ; 109 : 2798 – 802 . doi: 10.1038/bjc.2013.660 [DOI] [PMC free article] [PubMed] [Google Scholar]
- 28. pp Ma Y , Zhang S , Li J , Li J , Kang Y , Ren W . Comparison of strain and shear-wave ultrasounic elastography in predicting the pathological response to neoadjuvant chemotherapy in breast cancers . Eur Radiol 2017. ; 27 : 2282 – 91 . doi: 10.1007/s00330-016-4619-5 [DOI] [PubMed] [Google Scholar]
- 29. Chang JM , Won J-K , Lee K-B , Park IA , Yi A , Moon WK . Comparison of shear-wave and strain ultrasound elastography in the differentiation of benign and malignant breast lesions . AJR Am J Roentgenol 2013. ; 201 : W347 – W356 . doi: 10.2214/AJR.12.10416 [DOI] [PubMed] [Google Scholar]
- 30. Loo CE , Teertstra HJ , Rodenhuis S , van de Vijver MJ , Hannemann J , Muller SH , et al. . Dynamic contrast-enhanced MRI for prediction of breast cancer response to neoadjuvant chemotherapy: initial results . American Journal of Roentgenology 2008. ; 191 : 1331 – 8 . doi: 10.2214/AJR.07.3567 [DOI] [PubMed] [Google Scholar]
- 31. Pickles MD , Lowry M , Manton DJ , Gibbs P , Turnbull LW . Role of dynamic contrast enhanced MRI in monitoring early response of locally advanced breast cancer to neoadjuvant chemotherapy . Breast Cancer Res Treat 2005. ; 91 : 1 – 10 . doi: 10.1007/s10549-004-5819-2 [DOI] [PubMed] [Google Scholar]


