

Abstract
Objective:
To determine whether dose painting with volumetric modulated arc therapy for high-grade gliomas using 3,4-dihydroxy-6-[18F]fluoro-l-phenylalanine (18F-FDOPA) positron emission tomography (PET) could achieve dose-escalated coverage of biological target volumes (BTVs) without increasing the dose to cranial organs at risk (OARs).
Methods:
10 patients with high-grade gliomas underwent CT, MRI, and 18F-FDOPA PET/CT images for post-operative radiation therapy planning. Two volumetric modulated arc therapy plans were retrospectively generated for each patient: a conventional plan with 60 Gy in 30 fractions to the planning target volume delineated on MRI and a dose-escalated plan with a maximum dose of 80 Gy in 30 fractions to BTVs. BTVs were created by thresholding 18F-FDOPA PET/CT uptake using a linear quadratic model that assumed tracer uptake was linearly related to tumour cell density. The maximum doses and equivalent uniform doses of OARs were compared.
Results:
The median volume of the planning target volume receiving at least 95% of the prescribed dose (V 95%) was 99.6% with and 99.5% without dose painting. The median V 95% was >99.2% for BTVs. The maximum doses and equivalent uniform doses to the OARs did not differ significantly between the conventional and dose-painted plans.
Conclusion:
Using commercially available treatment planning software, dose painting for high-grade gliomas was feasible with good BTV coverage and no significant change in the dose to OARs.
Advances in knowledge:
A novel treatment planning strategy was used to achieve dose painting for gliomas with BTVs obtained from 18F-FDOPA PET/CT using a radiobiological model.
Introduction
Glioblastoma is the most common primary brain malignancy.1 Despite aggressive multimodality management, the prognosis is poor, with median survival ranging from 15 to 21 months.2–4 The current treatment paradigm for glioblastoma consists of maximal safe resection, followed by radiation therapy with concurrent and adjuvant temozolimide (TMZ). Emerging data also support the use of tumour treating fields in selected patients.4 The standard radiation dose for non-elderly patients with glioblastoma, 60 Gy in 30 fractions, was established in the 1990s, when a randomized controlled trial demonstrated improved survival in comparison to 45 Gy in 20 fractions.5 Since then, a number of strategies have been tested to further escalate the prescription dose in glioblastoma, including brachytherapy,6 stereotactic radiosurgery,7 and altered fractionation using conventional MRI.8 Performed in the pre-TMZ era, these trials consistently found an increase in the risk of radionecrosis, and despite a reduction in the risk of central relapse, there was no survival advantage with dose escalation. However, in the TMZ era, there is renewed optimism that dose escalation using a simultaneous integrated boost may improve outcomes9 and this strategy is being formally tested in the ongoing NRG Oncology BN001 trial.10
Another approach to dose escalation is to selectively target residual macroscopic or biologically aggressive disease. Positron emission tomography (PET) with amino acid tracers, such as 11C-methionine (11C-MET), 18F-fluoroethyltyrosine (18F-FET) and 3,4-dihydroxy-6-[18F]fluoro-l-phenylalanine (18F-FDOPA), can identify macroscopic residual disease because these tracers are taken up by cells using a specific amino acid transport system. Increased protein synthesis and upregulation of the amino acid transporter in the supporting vasculature of brain tumour tissue is responsible for increased amino acid transport into tumour cells. PET imaging with amino acid tracers can visualize disease that is not clearly identified on T 1 weighted MRI with gadolinium contrast enhancement and may be able to distinguish between viable tumour and oedema in regions of high signal on T 2 weighted MRI.11,12 It may also identify regions of elevated cellular density and higher-grade disease, which can be used to delineate a high-risk subvolume for dose escalation.13
With accruing evidence to suggest that PET imaging provides complementary, additional information to MRI, there has been recent interest in using a PET-guided dose escalation approach in gliomas. For example, a previous clinical trial in high-grade gliomas14 investigated dose escalation with an integrated boost to 72 Gy in 30 fractions to a target defined by a single 18F-FET PET threshold. The study did not demonstrate a therapeutic benefit in comparison to historical outcomes, but it did not employ dose painting. A subsequent analysis showed that the original 18F-FET PET defined tumour volume with an additional margin of 7 mm covered recurrent 18F-FET PET tumour volumes.15 Other studies investigating patterns of failure in glioma also suggest that local recurrences may preferentially occur in areas of high amino acid tracer uptake.16
While clinical outcomes with uniform dose escalation in high-grade gliomas have been disappointing because of non-central relapses and radionecrosis, dose painting17 may provide an opportunity to maximize disease control, while minimizing the risk of radionecrosis. A voxel-by-voxel prescription of dose according to radiotracer uptake (dose painting by numbers)18–21 is an attractive method to achieve dose escalation with strong biological rationale. In this study, we investigate whether dose painting with volumetric modulated arc therapy (VMAT) for high-grade gliomas using 18F-FDOPA PET can achieve dose-escalated coverage to biological tumour volumes (BTVs) without increasing the dose to cranial organs at risk (OARs) using commercially available treatment planning software.
Methods and materials
Patients and imaging
This study recruited 10 patients with histologically confirmed, newly diagnosed glioma. Patients were at least 18 years of age, had a contrast-enhancing mass on diagnostic brain CT or MRI that strongly suggested a diagnosis of World Health Organization Grade III or IV glioma prior to surgery, had a Karnofsky Performance Status of 70 or greater, and had a glomerular filtration rate of 60 mL/min or greater. The study excluded subjects who had indication for urgent craniotomy to relieve mass effect, had gadolinium enhancement or T 2 signal that involved the basal ganglia, had previous intracranial malignancy or any invasive malignancy unless free of disease for at least 5 years, prior cranial irradiation, were taking medication for the treatment of Parkinson’s disease, or had allergies or contraindications to contrast MRI or radiation therapy. The National Institutes of Health clinical trial identifier for this study was NCT01248754.22
Each patient underwent CT (3 mm slice thickness), MRI and 18F-FDOPA PET/CT imaging prior to post-operative radiation therapy. MRI consisted of gadolinium-enhanced T 1 weighted images with the turbo spin-echo sequence [echo time (TE) = 14 ms, pixel resolution = 1 mm, slice thickness = 3 mm] and T 2 weighted fluid attenuated inversion recovery images (TE = 97 ms, pixel resolution = 0.5 mm, slice thickness = 3 mm) obtained with a 1.5 T Siemens MAGNETOM Symphony Tim system (Siemens Healthcare, Erlangen, Germany). 18F-FDOPA PET/CT images were obtained with a Siemens Biograph-16 Hi-Rez PET/CT system (Knoxville, TN). 18F-FDOPA was synthesized by use of a previously published procedure.23 Non-contrast CT and 15 min three-dimensional PET images were obtained of the brain 40 min following injection. The attenuation-corrected PET data were reconstructed using an iterative ordered-subset expectation maximization algorithm (matrix = 336×336, brain mode, zoom = 2.5, subsets = 8, iterations = 6, gaussian filter = 2 mm).
All images (planning CT, MRI, and PET/CT) were imported into Eclipse treatment planning system (Varian Medical Systems, Palo Alto, CA) and fused using the auto-matching registration algorithm. Image fusion details were described in a previous study.11 The planning CT images were fused both to the MRI and the CT images PET/CT image set.
Volume delineation
Target volume and OAR delineations were imported from each patient’s treated radiation therapy plan. The gross tumour volume (GTV) was the contrast-enhancing tumour on T 1 weighted MRI. The clinical target volume (CTV) was a 2 cm expansion of the union of the GTV and the surgical cavity, expanded, if necessary, to include all increased signal on T 2 weighted MRI. The planning target volume (PTV) was a 0.5 cm expansion of the CTV; it was prescribed a dose of 60 Gy in 30 fractions. The OARs used for treatment planning were: brainstem, optics_PRV [the optics planning organ at risk (OAR) volume was a 5 mm expansion of a continuous segmentation of the optic nerves and chiasm], anterior chambers, and retinas. The normal brain volume excluding the GTV (brain–GTV), the normal brain volume excluding the PTV (brain–PTV), and contralateral hippocampus contour were also generated. The following non-overlapping volumes were also defined: PTV60, the portion of the PTV that did not overlap with OARs; PTV54, the portion of the PTV that overlapped with the optics_PRV; PTV60b, the portion of the PTV that overlapped with the brainstem; and brainstem_opti and optics_opti, the portions of the brainstem and optics_PRV that did not overlap the PTV.
The 18F-FDOPA PET uptake was used to generate simultaneous integrated boost volumes. A radiation oncologist delineated a dose-painting volume of interest on the 18F-FDOPA PET images in consultation with a functional imaging specialist. Seven dose-painting biological target volumes (BTVs), BTV62.5, BTV65, BTV67.5, BTV70, BTV72.5, BTV75, and BTV77.5, were delineated inside this volume by using thresholds of 18F-FDOPA uptake. These volumes corresponded to discrete dose boosts of 62.5 to 77.5 Gy, in steps of 2.5 Gy. To calculate the image intensity threshold used to delineate a BTV, we used the linear quadratic model for cell survival. If an image voxel with intensity I and tumour cell density ρ receives a total dose D in nf = 30 fractions, the tumour cell density ρ′ that remains following irradiation is . If we assume that image intensity and tumour cell density were linearly related (), then:
where b 0 and b 1 are constants.
The radiobiologic parameters for glioma were α = 0.06 Gy–1 and β = 0.006 Gy–2 (α/β = 10 Gy).24 If a minimum dose 60 Gy is prescribed to an image intensity I min, a maximum dose 80 Gy is prescribed to an image intensity I max, and we required the number of surviving number of tumour cells in each voxel to be the same (ρ′ is constant), then the equation for image intensity threshold was:
Previous studies using directed brain biopsies have consistently detected glioma cells in brain regions that exhibit 18F-FDOPA tracer uptake larger than the uptake of the contralateral basal ganglia.25,26 Thus, we chose to biologically escalate dose in the subvolumes of the dose-painting region of interest where the PET image intensity was higher than the PET image intensity at the anatomic border of the basal ganglia, as determined from the fused planning MRI. Figure 1 shows the target volumes delineated for a glioblastoma patient.
Figure 1.
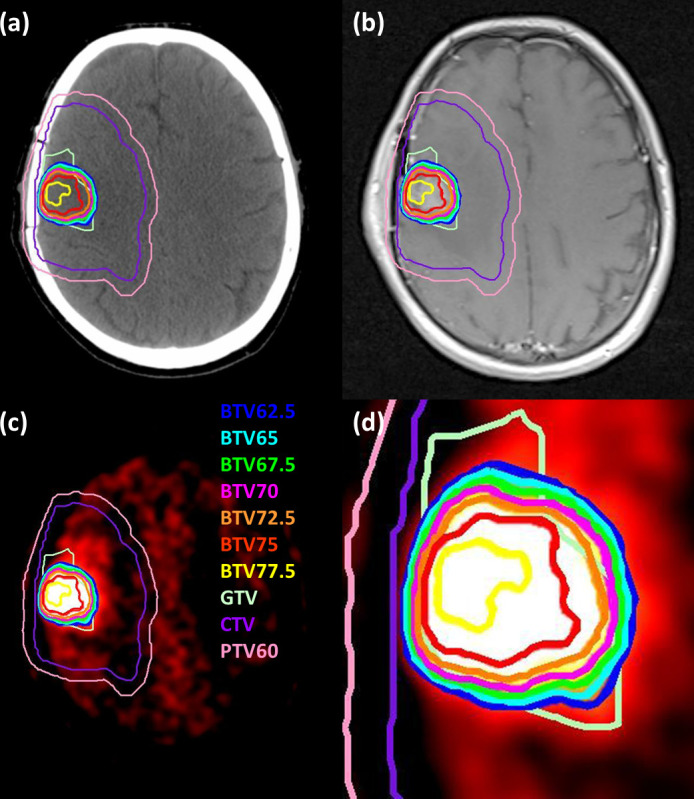
Target volumes shown on (a) CT, (b) T 1 weighted MRI, and (c) 18F-FDOPA PET for a patient with a glioblastoma. The window and level of the PET image are chosen to highlight the BTVs. Panel (d) shows a close up of panel (c). 18F-FDOPA, 3,4-dihydroxy-6-[18F]fluoro-l-phenylalanine;BTVs, biological target volumes.
Radiation therapy planning
Two VMAT plans were generated for each patient: a conventional plan without dose escalation delivering 95–110% of 60 Gy in 30 fractions to the PTV and a plan with dose escalation up to a maximum dose of 80 Gy. Plans were generated with the Eclipse (Varian Medical Systems Inc. Palo Alto, CA) treatment planning software using the Anisotropic Analytical Algorithm (v. 11.031) for dose calculations and Progressive Resolution Optimization for VMAT optimization. Plans were obtained using two 360° arcs of a 6 MV photon beam from a Varian TrueBeam linear accelerator with High Definition 120-leaf multileaf collimator. The plans were generated using the objectives shown in Table 1.
Table 1.
Dose–volume histogram constraints used for volumetric modulated arc therapy.
| Structure | Constraint | |
| Conventional plan | Dose painting plan | |
| PTV54 | V 51.3 Gy ≥98% and V 54 Gy ≤1% | V 51.3 Gy ≥98% and V 54 Gy ≤1% |
| PTV60 | V 95% ≥ 98% and D max ≤110% | V 95% ≥ 98% and D max ≤110% for PTV60 outside of BTVs |
| PTV60b | V 95% ≥ 98% and D max ≤ 60 Gy | V 95% ≥ 98% and D max ≤ 60 Gy |
| Optics_PRV | V 54 Gy ≤1% | V 54 Gy ≤1% |
| Brainstem | D max ≤ 60 Gy | D max ≤ 60 Gy |
| Retina | D max ≤ 45 Gy | D max ≤ 45 Gy |
| Anterior chamber | D max ≤ 10 Gy | D max ≤ 10 Gy |
| BTV62.5 | — | V 59.3 Gy ≥95% |
| BTV65 | — | V 61.8 Gy ≥95% |
| BTV67.5 | — | V 64.1 Gy ≥95% |
| BTV70 | — | V 66.5 Gy ≥95% |
| BTV72.5 | — | V 68.9 Gy ≥95% |
| BTV75 | — | V 71.3 Gy ≥95% |
| BTV77.5 | — | V 73.6 Gy ≥95% and D max ≤ 80 Gy |
Vx is the percentage volume of a structure that received a dose of x or greater.BTV, biological target volumes; D max = maximum dose;PTV, planning target volume.
Evaluation of treatment plans
Cumulative dose–volume histograms (DVHs) were calculated for all target volumes and OARs for both plans for all patients. The volume of each target volume that received a dose of at least 95% of its prescribed dose (V 95%) was recorded. For each OAR in each plan, the maximum dose and the equivalent uniform dose (EUD) were calculated. The EUD was calculated using the equation27:
where n was the volume dependence parameter,28–30 vi is the relative volume of a structure that receives a normalized total dose of NTDi, and the normalized total dose was calculated using the equation:
with α/β = 2 Gy for all OARs.31 Statistical comparisons were performed using the two-sided paired Wilcoxon sign-rank test (α = 0.05).
Results
Table 2 shows patient characteristics for this study. The median PTV60 volume was 391 cm3 (range, 251–651 cm3) and the median dose escalation volume was 25 cm3 (7–110 cm3). The PTV overlapped with the brainstem in one patient and optics_PRV in four patients. It was possible to produce dose-painted plans for all cases without sacrificing target coverage (Table 3). The median volume of the PTV60 receiving 95% of the prescribed dose (V95%) was 99.5% (94.9–99.9%) for conventional plans and 99.6% (95.0–100.0%) for dose-painted plans (p = 0.5). Figure 2 shows an example of the dose distribution for the conventional and dose-painted plans for a sample patient. Figure 3(a) shows sample target volume DVHs.
Table 2.
Patient characteristics
| Number of patients | 10 |
| Sex | |
| Female | 4 (40%) |
| Male | 6 (60%) |
| Age, median (range) | 56 (19–80) |
| Histology | |
| Anaplastic astrocytoma | 1 (10%) |
| Anaplastic oligodendroglioma | 1 (10%) |
| Glioblastoma | 8 (80%) |
| Extent of resection a | |
| Gross total resection | 4 (40%) |
| Partial resection | 4 (40%) |
| Biopsy only | 2 (20%) |
| Time, median (range) | |
| Surgery to MRI | 19 (2–35) |
| Pre-op PET/CT to surgery | 7 (5–7) |
| Surgery to post-op PET/CT | 31 (18–41) |
PET, positron emission tomography.
Extent of resection was judged with gadolinium contrast on T 1 weighted MRI.
Table 3.
V 95% and mean dose for target volumes for conventional VMAT plans and dose-painted plans
| Structure | V95% (%) | Mean dose (Gy) | ||||
| Conventional | Dose painting | p | Conventional | Dose painting | p | |
| PTV60 | 99.5 (94.9–99.9) | 99.6 (95.0–100.0) | 0.5 | 60.0 (59.8–61.5) | 60.0 (59.6–61.3) | 0.5 |
| BTV62.5 | — | 100.0 (98.2–100.0) | — | — | 62.7 (61.8–63.6) | — |
| BTV65 | — | 99.9 (89.6–100.0) | — | — | 64.4 (63.6–64.9) | — |
| BTV67.5 | — | 99.8 (74.7–100.0) | — | — | 66.4 (65.1–67.2) | — |
| BTV70 | — | 99.2 (61.0–100.0) | — | — | 68.7 (66.9–69.3) | — |
| BTV72.5 | — | 99.7 (61.5–100.0) | — | — | 71.1 (69.4–72.2) | — |
| BTV75 | — | 99.7 (83.2–100.0) | — | — | 74.1 (72.6–75.2) | — |
| BTV77.5 | — | 99.9 (98.8–100.0) | — | — | 76.3 (75.4–77.7) | — |
BTV, biological target volume; PTV, planning target volume; VMAT, volumetric modulated arc therapy.
Median values are shown with the range in parentheses.
Figure 2.

Isodose lines are shown for (a–c) conventional volumetric modulated arc therapy plans and (d–f) dose-painted plans on transverse, coronal, and sagittal CT images.
Figure 3.

Panel (a) shows the DVHs for the PTV without dose escalation (solid lines) and the PTV and BTVs with dose painting (dashed lines) for a sample patient. Panel (b) shows DVHs for organs at risk for plans without dose escalation (solid lines) and with dose painting (dashed lines) for the same sample patient. BTVs, biological target volumes; DVH, dose–volume histogram; PTV, planning target volume.
Table 4 shows the comparison of maximum dose and EUD of each OAR for conventional plans and dose-painted plans. In all plans, there was no statistically significant difference in the maximum dose or EUD for the optics, brainstem, retina, and anterior chamber. Similar DVHs were obtained for all OARs for both conventional and dose-painted plans (Figure 3(b)). The maximum dose in the brain–PTV and contralateral hippocampus was not statistically different between conventional and dose painting plans. While dose escalation led to a small, but statically significant increase of the brain–PTV and brain–GTV EUD, the contralateral hippocampus EUD was not significantly different between plans.
Table 4.
Dosimetric comparison of organs at risk for conventional volumetric modulated arc therapy plans and dose-painted plans
| Structure | Maximum dose (Gy) | EUD (Gy) | |||||
| Conventional | Dose painting | p | Conventional | Dose painting | p | n | |
| Optics_PRV | 16.7 (5.2–53.6) | 14.2 (5.3–53.7) | 0.9 | 5.6 (1.5–35.0) | 5.4 (1.6–33.8) | 0.6 | 0.25 |
| Brainstem | 53.4 (13.1–59.8) | 53.1 (12.9–59.4) | 0.05 | 31.6 (2.9–46.2) | 31.8 (2.9–46.6) | 0.9 | 0.16 |
| Retina | 7.8 (2.0–34.8) | 6.9 (1.9–32.6) | 0.05 | 2.7 (0.7–12.1) | 2.7 (0.7–11.8) | 0.14 | 0.2 |
| Anterior chamber | 6.2 (1.6–8.9) | 6.1 (1.5–9.5) | 0.14 | 2.0 (0.7–3.4) | 2.1 (0.7–3.3) | 0.6 | 0.3 |
| Brain–GTV | 62.7 (62.6–64.5) | 76.9 (66.8–79.0) | 0.002 | 44.1 (37.0–48.9) | 44.2 (36.5–49.1) | 0.03 | 0.25 |
| Brain–PTV | 61.1 (59.2–62.3) | 61.6 (59.7–62.7) | 0.10 | 31.9 (25.8–35.3) | 33.3 (26.9–36.6) | 0.006 | 0.25 |
| Contralateral hippocampus | 51.8 (10.5–61.6) | 50.9 (10.2–62.2) | 0.7 | 30.8 (2.7–54.1) | 31.5 (2.6–54.5) | 0.4 | 0.25 |
GTV, gross tumour volume; PTV, planning target volume.
Median values are shown with the range in parentheses. n is the volume dependence parameter used for EUD calculations.
Discussion
This study has shown that dose painting with 18F-FDOPA PET-defined BTV contours was feasible using commercially available planning software without increasing the dose delivered to cranial OARs. By delivering higher doses to regions with a greater burden of disease, as identified with the 18F-FDOPA tracer, we expect that this technique would offer better disease control than conventional radiotherapy for high-grade gliomas.
This dose painting method relied on experimentally derived radiobiological parameters for the assignment of dose painting thresholds. Qi et al24 reported large variations in the radiosensitivity and repair parameters for gliomas: α = 0.06±0.05 Gy−1 and α/β = 10.0±15.1 Gy. The choice of these values is important in optimizing the therapeutic ratio and further research is needed to determine the appropriate parameters to use in this model. A subsequent analysis is warranted to determine how variation of α and β in the range reported by Qi et al24 may affect boost volumes. In the future, genomic assays of radiosensitivity may provide the necessary radiobiological data for optimal dose escalation of individual gliomas.32 Previous planning studies33,34 reported dose painting by numbers for gliomas using linear models to map image intensity or standardized uptake value to dose. Our model improved on this approach by mapping image intensity to dose by using a radiobiological model.
This study has a few limitations, such as the small number of patients (n = 10). In addition, it did not include patients with tumours near the basal ganglia since there is intense normal uptake of 18F-FDOPA in these structures, which decreases the contrast ratio that required for robust dose painting techniques. While other amino acid tracers (11C-MET and 18F-FET) do not have this limitation, 18F-FDOPA has its own advantages including a longer half-life compared to 11C-MET and superior contrast ratios outside the striatum compared to 18F-FET, and is felt to perform comparably to other radiotracers in imaging malignant gliomas.35–37 In addition, post-surgical changes around the resection cavity can exhibit tracer uptake because of high levels of amino acid transport by activated macrophages or 18F-FDOPA leakage due to disruption of the blood–brain barrier.26 This challenge was partially mitigated by having a radiation oncologist, with experience in contouring on 18F-FDOPA PET images, delineate volumes of interest for dose escalation in consultation with a functional imaging specialist. Another issue is that our radiobiological modelling was informed by limited knowledge about the precise relationship between 18F-FDOPA tracer uptake and tumour cell density.38,39 Greater knowledge about the relationship between 18F-FDOPA tracer standardized uptake values and tumour cell density for high-grade gliomas might justify maximum dose escalation over 80 Gy in some patients and less than 80 Gy in other patients. The current study utilized an 80 Gy maximum dose escalation threshold in keeping with the maximum dose criterion in the experimental arm of the NRG BN001 trial (D0.03cc ≤80 Gy). This maximum dose was chosen to not increase the risk of radionecrosis compared to previous clinical trials.40–42
This study assumed that the efficacy of radiotherapy is only correlated with the density of glioma cells. It is known that other biological parameters such as hypoxia affect radiotherapy efficacy and it is not always correlated to cell density. This is particularly of importance in glioblastoma, where hypoxia has well-established role in radioresistance and tumour progression.43,44 Imaging biomarkers able to evaluate the level of hypoxia such as 18F-fluoromisonidazole and 18F-flortanidazole PET may be useful for dose escalation.45,46 In addition, 18F-fluorothymidine PET has been correlated to cellular markers of cell proliferation in glioma47 and may translate clinically into individualized treatments for glioma.48
The impact of PET image acquisition parameters and reconstruction algorithms on dose painting by contours also needs to be established. Correction of the partial volume effect is important. The prescribed dose escalation in this study could occur over small distances (Figure 1(d)) and the partial volume effect could greatly impact delineation of the dose escalation contours. BTVs generated with the radiobiological model used in this study could result in small boost volumes with high dose gradients that are not necessarily physically achievable.
This dosimetric planning study includes no clinical outcomes or toxicity data and a prospective clinical trial is required to demonstrate the efficacy and safety of the dose painting method investigated in this study. While dose escalation volumes can be delineated manually in commercial treatment planning software, scripts that automatically delineate BTVs would be beneficial for standardizing delineations if multiple centers are involved. A dose-exploration trial could test different levels of dose escalation for different levels of PET uptake across multiple patients. On-treatment and post-treatment PET/CT imaging could be obtained to assess the change of PET tracer uptake at various dose levels. The changes in uptake between the pre-treatment, on-treatment and post-treatment PET scans could be compared to provide three-dimensional dose-response information in high-grade gliomas. This information would be valuable for further optimization of the dose painting algorithm.
Conclusions
Using a commercially available VMAT treatment planning system, it was feasible to generate dose painted-by-contour plans for BTV contours that were generated by thresholding 18F-FDOPA PET images of high-grade gliomas. Further study is planned to investigate the clinical impact of the proposed dose-painting technique.
Footnotes
Funding: This work was funded in part by a Natural Sciences and Engineering Research Council of Canada Alexander Graham Bell Canada Graduate Scholarship (to RK), the Brain Tumour Foundation of Canada, and the BC Cancer Foundation - Hershey and Yvette Porte Neuro-Oncology Endowment Fund.
Contributor Information
Robert Kosztyla, Email: rkosztyla@bccancer.bc.ca.
Srinivas Raman, Email: srinivas.raman@bccancer.bc.ca.
Vitali Moiseenko, Email: vmoiseenko@ucsd.edu.
Stefan A Reinsberg, Email: reinsberg@phas.ubc.ca.
Brian Toyota, Email: btoyota@telus.net.
Alan Nichol, Email: anichol@bccancer.bc.ca.
REFERENCES
- 1. Ostrom QT , Gittleman H , Xu J , Kromer C , Wolinsky Y , Kruchko C , et al. . CBTRUS statistical report: primary brain and other central nervous system tumors diagnosed in the United States in 2009-2013 . Neuro Oncol 2016. ; 18 ( Suppl 5 ): v1 – 75 . doi: 10.1093/neuonc/now207 [DOI] [PMC free article] [PubMed] [Google Scholar]
- 2. Stupp R , Mason WP , van den Bent MJ , Weller M , Fisher B , Taphoorn MJB , et al. . Radiotherapy plus concomitant and adjuvant temozolomide for glioblastoma . N Engl J Med 2005. ; 352 : 987 – 96 . doi: 10.1056/NEJMoa043330 [DOI] [PubMed] [Google Scholar]
- 3. Pan I-W , Ferguson SD , Lam S . Patient and treatment factors associated with survival among adult glioblastoma patients: a USA population-based study from 2000-2010 . J Clin Neurosci 2015. ; 22 : 1575 – 81 . doi: 10.1016/j.jocn.2015.03.032 [DOI] [PubMed] [Google Scholar]
- 4. Stupp R , Taillibert S , Kanner A , Read W , Steinberg D , Lhermitte B , et al. . Effect of tumor-treating fields plus maintenance temozolomide vs maintenance temozolomide alone on survival in patients with glioblastoma: a randomized clinical trial . JAMA 2017. ; 318 : 2306 – 16 . doi: 10.1001/jama.2017.18718 [DOI] [PMC free article] [PubMed] [Google Scholar]
- 5. Bleehen NM , Stenning SP . A medical Research Council trial of two radiotherapy doses in the treatment of grades 3 and 4 astrocytoma. The medical Research Council Brain Tumour Working Party . Br J Cancer 1991. ; 64 : 769 – 74 . [DOI] [PMC free article] [PubMed] [Google Scholar]
- 6. Barbarite E , Sick JT , Berchmans E , Bregy A , Shah AH , Elsayyad N , et al. . The role of brachytherapy in the treatment of glioblastoma multiforme . Neurosurg Rev 2017. ; 40 : 195 – 211 . doi: 10.1007/s10143-016-0727-6 [DOI] [PubMed] [Google Scholar]
- 7. Shah JL , Li G , Shaffer JL , Azoulay MI , Gibbs IC , Nagpal S , et al. . Stereotactic radiosurgery and hypofractionated radiotherapy for glioblastoma . Neurosurgery 2018. ; 82 : 24 – 34 . doi: 10.1093/neuros/nyx115 [DOI] [PubMed] [Google Scholar]
- 8. Nieder C , Andratschke N , Wiedenmann N , Busch R , Grosu AL , Molls M . Radiotherapy for high-grade gliomas. does altered fractionation improve the outcome? Strahlenther Onkol 2004. ; 180 : 401 – 7 . doi: 10.1007/s00066-004-1220-7 [DOI] [PubMed] [Google Scholar]
- 9. Tsien CI , Brown D , Normolle D , Schipper M , Piert M , Junck L , et al. . Concurrent temozolomide and dose-escalated intensity-modulated radiation therapy in newly diagnosed glioblastoma . Clin Cancer Res 2012. ; 18 : 273 – 9 . doi: 10.1158/1078-0432.CCR-11-2073 [DOI] [PMC free article] [PubMed] [Google Scholar]
- 10. NRG Oncology . Dose-Escalated Photon IMRT or Proton Beam Radiation Therapy Versus Standard-Dose Radiation Therapy and Temozolomide in Treating Patients With Newly Diagnosed Glioblastoma . In : ClinicalTrials.gov ; 2018. . https://clinicaltrials.gov/ct2/show/NCT02179086 . [Google Scholar]
- 11. Kosztyla R , Chan EK , Hsu F , Wilson D , Ma R , Cheung A , et al. . High-grade glioma radiation therapy target volumes and patterns of failure obtained from magnetic resonance imaging and 18F-FDOPA positron emission tomography delineations from multiple observers . Int J Radiat Oncol Biol Phys 2013. ; 87 : 1100 – 6 . doi: 10.1016/j.ijrobp.2013.09.008 [DOI] [PubMed] [Google Scholar]
- 12. Albert NL , Weller M , Suchorska B , Galldiks N , Soffietti R , Kim MM , et al. . Response assessment in neuro-oncology Working group and European association for neuro-oncology recommendations for the clinical use of PET imaging in gliomas . Neuro Oncol 2016. ; 18 : 1199 – 208 . doi: 10.1093/neuonc/now058 [DOI] [PMC free article] [PubMed] [Google Scholar]
- 13. Pafundi DH , Laack NN , Youland RS , Parney IF , Lowe VJ , Giannini C , et al. . Biopsy validation of 18F-dopa PET and biodistribution in gliomas for neurosurgical planning and radiotherapy target delineation: results of a prospective pilot study . Neuro Oncol 2013. ; 15 : 1058 – 67 . doi: 10.1093/neuonc/not002 [DOI] [PMC free article] [PubMed] [Google Scholar]
- 14. Piroth MD , Pinkawa M , Holy R , Klotz J , Schaar S , Stoffels G , et al. . Integrated boost IMRT with FET-PET-adapted local dose escalation in glioblastomas. Results of a prospective phase II study . Strahlenther Onkol 2012. ; 188 : 334 – 9 . doi: 10.1007/s00066-011-0060-5 [DOI] [PubMed] [Google Scholar]
- 15. Piroth MD , Galldiks N , Pinkawa M , Holy R , Stoffels G , Ermert J , et al. . Relapse patterns after radiochemotherapy of glioblastoma with FET PET-guided boost irradiation and simulation to optimize radiation target volume . Radiat Oncol 2016. ; 11 : 87 . doi: 10.1186/s13014-016-0665-z [DOI] [PMC free article] [PubMed] [Google Scholar]
- 16. Lundemann M , Costa JC , Law I , Engelholm SA , Muhic A , Poulsen HS , et al. . Patterns of failure for patients with glioblastoma following O-(2-[18F]fluoroethyl)-L-tyrosine PET- and MRI-guided radiotherapy . Radiother Oncol 2017. ; 122 : 380 – 6 . doi: 10.1016/j.radonc.2017.01.002 [DOI] [PubMed] [Google Scholar]
- 17. Ling CC , Humm J , Larson S , Amols H , Fuks Z , Leibel S , et al. . Towards multidimensional radiotherapy (MD-CRT): biological imaging and biological conformality . Int J Radiat Oncol Biol Phys 2000. ; 47 : 551 – 60 . doi: 10.1016/S0360-3016(00)00467-3 [DOI] [PubMed] [Google Scholar]
- 18. Bentzen SM . Theragnostic imaging for radiation oncology: dose-painting by numbers . Lancet Oncol 2005. ; 6 : 112 – 7 . doi: 10.1016/S1470-2045(05)01737-7 [DOI] [PubMed] [Google Scholar]
- 19. Bentzen SM , Gregoire V . Molecular imaging-based dose painting: a novel paradigm for radiation therapy prescription . Semin Radiat Oncol 2011. ; 21 : 101 – 10 . doi: 10.1016/j.semradonc.2010.10.001 [DOI] [PMC free article] [PubMed] [Google Scholar]
- 20. Rasmussen JH , Håkansson K , Vogelius IR , Aznar MC , Fischer BM , Friborg J , et al. . Phase I trial of 18F-Fludeoxyglucose based radiation dose painting with concomitant cisplatin in head and neck cancer . Radiother Oncol 2016. ; 120 : 76 – 80 . doi: 10.1016/j.radonc.2016.03.005 [DOI] [PubMed] [Google Scholar]
- 21. Grönlund E , Johansson S , Montelius A , Ahnesjö A . Dose painting by numbers based on retrospectively determined recurrence probabilities . Radiother Oncol 2017. ; 122 : 236 – 41 . doi: 10.1016/j.radonc.2016.09.007 [DOI] [PubMed] [Google Scholar]
- 22. Nichol A . Positron emission tomography (PET) with 3,4-dihydroxy-6-18F-fluoro-L-enylalanine (18F-FDOPA) study . In : ClinicalTrials.gov ; 2018. . https://clinicaltrials.gov/ct2/show/NCT01248754 . [Google Scholar]
- 23. Namavari M , Bishop A , Satyamurthy N , Bida G , Barrio JR . Regioselective radiofluorodestannylation with [18F]F2 and [18F]CH3COOF: a high yield synthesis of 6-[18F]Fluoro-L-dopa . Int J Rad Appl Instrum A 1992. ; 43 : 989 – 96 . doi: 10.1016/0883-2889(92)90217-3 [DOI] [PubMed] [Google Scholar]
- 24. Qi XS , Schultz CJ , Li XA . An estimation of radiobiologic parameters from clinical outcomes for radiation treatment planning of brain tumor . Int J Radiat Oncol Biol Phys 2006. ; 64 : 1570 – 80 . doi: 10.1016/j.ijrobp.2005.12.022 [DOI] [PubMed] [Google Scholar]
- 25. Walter F , Cloughesy T , Walter MA , Lai A , Nghiemphu P , Wagle N , et al. . Impact of 3,4-dihydroxy-6-18F-fluoro-L-phenylalanine PET/CT on managing patients with brain tumors: the referring physician's perspective . J Nucl Med 2012. ; 53 : 393 – 8 . doi: 10.2967/jnumed.111.095711 [DOI] [PubMed] [Google Scholar]
- 26. Chen W , Silverman DHS , Delaloye S , Czernin J , Kamdar N , Pope W , et al. . 18F-FDOPA PET imaging of brain tumors: comparison study with 18F-FDG PET and evaluation of diagnostic accuracy . J Nucl Med 2006. ; 47 : 904 – 11 . [PubMed] [Google Scholar]
- 27. Allen Li X , Alber M , Deasy JO , Jackson A , Ken Jee K-W , Marks LB , et al. . The use and QA of biologically related models for treatment planning: short report of the TG-166 of the therapy physics Committee of the AAPM . Med Phys 2012. ; 39 : 1386 – 409 . doi: 10.1118/1.3685447 [DOI] [PubMed] [Google Scholar]
- 28. Mayo C , Yorke E , Merchant TE . Radiation associated brainstem injury . Int J Radiat Oncol Biol Phys 2010. ; 76 ( 3 Suppl ): S36 – S41 . doi: 10.1016/j.ijrobp.2009.08.078 [DOI] [PMC free article] [PubMed] [Google Scholar]
- 29. Mayo C , Martel MK , Marks LB , Flickinger J , Nam J , Kirkpatrick J . Radiation dose-volume effects of optic nerves and chiasm . Int J Radiat Oncol Biol Phys 2010. ; 76 ( 3 Suppl ): S28 – S35 . doi: 10.1016/j.ijrobp.2009.07.1753 [DOI] [PubMed] [Google Scholar]
- 30. Burman C , Kutcher GJ , Emami B , Goitein M . Fitting of normal tissue tolerance data to an analytic function . Int J Radiat Oncol Biol Phys 1991. ; 21 : 123 – 35 . doi: 10.1016/0360-3016(91)90172-Z [DOI] [PubMed] [Google Scholar]
- 31. Wigg D . Applied Radiobiology and Bioeffect Planning . Madison, WI: : The British Institute of Radiology. ; 2001. . [Google Scholar]
- 32. Scott JG , Berglund A , Schell MJ , Mihaylov I , Fulp WJ , Yue B , et al. . A genome-based model for adjusting radiotherapy dose (GARD): a retrospective, cohort-based study . Lancet Oncol 2017. ; 18 : 202 – 11 . doi: 10.1016/S1470-2045(16)30648-9 [DOI] [PMC free article] [PubMed] [Google Scholar]
- 33. Rickhey M , Morávek Z , Eilles C , Koelbl O , Bogner L . 18F-FET-PET-based dose painting by numbers with protons . Strahlenther Onkol 2010. ; 186 : 320 – 6 . doi: 10.1007/s00066-010-2014-8 [DOI] [PubMed] [Google Scholar]
- 34. Rickhey M , Koelbl O , Eilles C , Bogner L . A biologically adapted dose-escalation approach, demonstrated for 18F-FET-PET in brain tumors . Strahlenther Onkol 2008. ; 184 : 536 – 42 . doi: 10.1007/s00066-008-1883-6 [DOI] [PubMed] [Google Scholar]
- 35. Kratochwil C , Combs SE , Leotta K , Afshar-Oromieh A , Rieken S , Debus J , et al. . Intra-individual comparison of ¹⁸F-FET and ¹⁸F-DOPA in PET imaging of recurrent brain tumors . Neuro Oncol 2014. ; 16 : 434 – 40 . doi: 10.1093/neuonc/not199 [DOI] [PMC free article] [PubMed] [Google Scholar]
- 36. Becherer A , Karanikas G , Szabó M , Zettinig G , Asenbaum S , Marosi C , et al. . Brain tumour imaging with PET: a comparison between [18F]fluorodopa and [11C]methionine . Eur J Nucl Med Mol Imaging 2003. ; 30 : 1561 – 7 . doi: 10.1007/s00259-003-1259-1 [DOI] [PubMed] [Google Scholar]
- 37. Bell C , Dowson N , Puttick S , Gal Y , Thomas P , Fay M , et al. . Increasing feasibility and utility of (18)F-FDOPA PET for the management of glioma . Nucl Med Biol 2015. ; 42 : 788 – 95 . doi: 10.1016/j.nucmedbio.2015.06.001 [DOI] [PubMed] [Google Scholar]
- 38. Jung T-Y , Jung S , Kim I-Y , Moon K-S , Jang W-Y , Park S-J , et al. . Pathologic analysis of glioblastoma via multiple stereotactic biopsies of active tumor and necrosis . Oncol Rep 2012. ; 27 : 707 – 13 . doi: 10.3892/or.2011.1522 [DOI] [PubMed] [Google Scholar]
- 39. Valentini MC , Mellai M , Annovazzi L , Melcarne A , Denysenko T , Cassoni P , et al. . Comparison among conventional and advanced MRI, 18F-FDG PET/CT, phenotype and genotype in glioblastoma . Oncotarget 2017. ; 8 : 91636 – 53 . doi: 10.18632/oncotarget.21482 [DOI] [PMC free article] [PubMed] [Google Scholar]
- 40. Souhami L , Seiferheld W , Brachman D , Podgorsak EB , Werner-Wasik M , Lustig R , et al. . Randomized comparison of stereotactic radiosurgery followed by conventional radiotherapy with carmustine to conventional radiotherapy with carmustine for patients with glioblastoma multiforme: report of radiation therapy Oncology Group 93-05 protocol . Int J Radiat Oncol Biol Phys 2004. ; 60 : 853 – 60 . doi: 10.1016/j.ijrobp.2004.04.011 [DOI] [PubMed] [Google Scholar]
- 41. Pollom EL , Fujimoto D , Wynne J , Seiger K , Modlin LA , Jacobs LR , et al. . Phase 1/2 Trial of 5-Fraction Stereotactic Radiosurgery With 5-mm Margins With Concurrent and Adjuvant Temozolomide in Newly Diagnosed Supratentorial Glioblastoma: Health-Related Quality of Life Results . Int J Radiat Oncol Biol Phys 2017. ; 98 : 123 – 30 . doi: 10.1016/j.ijrobp.2017.01.242 [DOI] [PMC free article] [PubMed] [Google Scholar]
- 42. Tsien C , Moughan J , Michalski JM , Gilbert MR , Purdy J , Simpson J , et al. . Phase I three-dimensional conformal radiation dose escalation study in newly diagnosed glioblastoma: radiation therapy Oncology Group trial 98-03 . Int J Radiat Oncol Biol Phys 2009. ; 73 : 699 – 708 . doi: 10.1016/j.ijrobp.2008.05.034 [DOI] [PMC free article] [PubMed] [Google Scholar]
- 43. Sheehan JP , Shaffrey ME , Gupta B , Larner J , Rich JN , Park DM , et al. . Improving the radiosensitivity of radioresistant and hypoxic glioblastoma . Future Oncol 2010. ; 6 : 1591 – 601 . doi: 10.2217/fon.10.123 [DOI] [PubMed] [Google Scholar]
- 44. Bar EE . Glioblastoma, cancer stem cells and hypoxia . Brain Pathol 2011. ; 21 : 119 – 29 . doi: 10.1111/j.1750-3639.2010.00460.x [DOI] [PMC free article] [PubMed] [Google Scholar]
- 45. Lindblom E , Dasu A , Uhrdin J , Even A , van Elmpt W , Lambin P , et al. . Defining the hypoxic target volume based on positron emission tomography for image guided radiotherapy - the influence of the choice of the reference region and conversion function . Acta Oncol 2017. ; 56 : 819 – 25 . doi: 10.1080/0284186X.2017.1293289 [DOI] [PubMed] [Google Scholar]
- 46. Bekaert L , Valable S , Lechapt-Zalcman E , Ponte K , Collet S , Constans J-M , et al. . 18F]-FMISO PET study of hypoxia in gliomas before surgery: correlation with molecular markers of hypoxia and angiogenesis . Eur J Nucl Med Mol Imaging 2017. ; 44 : 1383 – 92 . doi: 10.1007/s00259-017-3677-5 [DOI] [PubMed] [Google Scholar]
- 47. Muzi M , Spence AM , O'Sullivan F , Mankoff DA , Wells JM , Grierson JR , et al. . Kinetic analysis of 3'-deoxy-3'-18F-fluorothymidine in patients with gliomas . J Nucl Med 2006. ; 47 : 1612 – 21 . [PubMed] [Google Scholar]
- 48. Corroyer-Dulmont A , Pérès EA , Gérault AN , Savina A , Bouquet F , Divoux D , et al. . Multimodal imaging based on MRI and PET reveals [(18)F]FLT PET as a specific and early indicator of treatment efficacy in a preclinical model of recurrent glioblastoma . Eur J Nucl Med Mol Imaging 2016. ; 43 : 682 – 94 . doi: 10.1007/s00259-015-3225-0 [DOI] [PubMed] [Google Scholar]