
Figure 3. Nav1.5-driven INa in normal conditions.
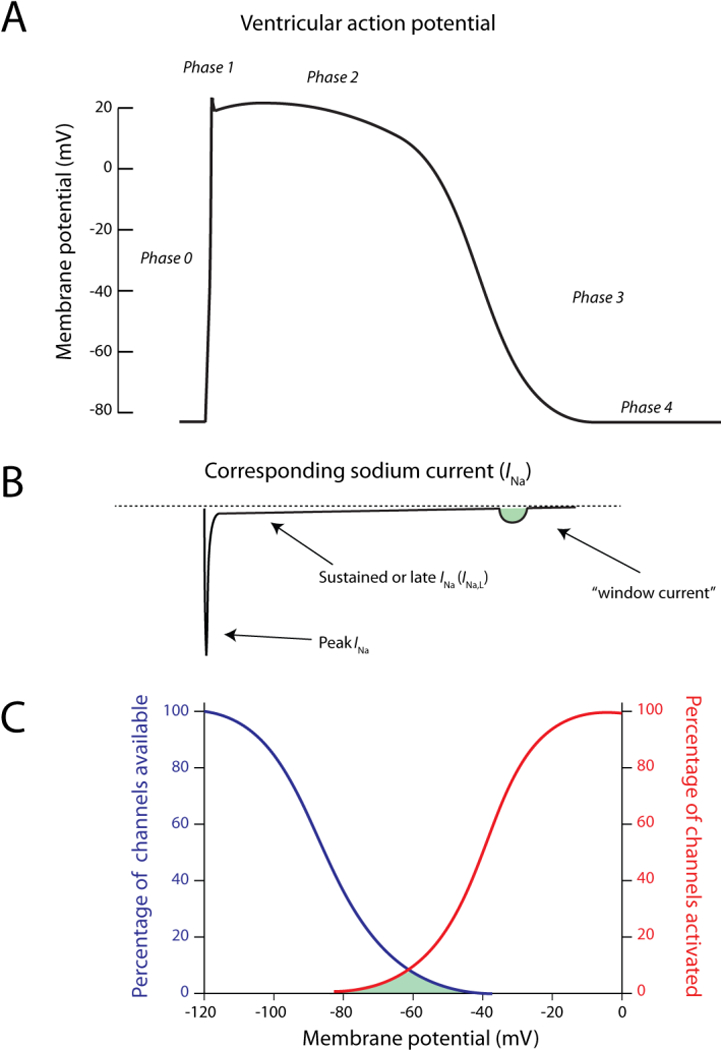
A) The ventricular action potential as a function of time and B) the corresponding INa in the physiological situation. The window current is depicted in green C) Illustration of the percentage of available (blue) and activated (red) channels as a function of the membrane potential. The window current (indicated in green) is formed at potentials in which inactivation and activation are overlapping.