Abstract
The success of dental implant treatment is related to the complex 3-dimensional (3D) biomechanics of the implant-bone interaction. In this work, 3D numerical models are built based on micro X-ray computed tomography (micro-CT) images of a cadaveric mandible specimen with implants placed in it. The simulation results show that the computed strain values in bone are sensitive to the uncertainties in trabecular tissue modulus and fairly insensitive to the modulus of implants and teeth and the detailed geometry of the fixed boundary condition. A bone-volume-fraction (BV/TV) based method is proposed to assign the tissue moduli of bone elements based on their BV/TV to increase the connectivity of the mesh and to improve the accuracy of the models. These models are potentially powerful for calculating the 3D full-field bone strain under implant loading, enabling in silico testing of different implant designs, but demand validation of the models. The computed results reveal high strain concentration at bone-implant contact areas and, more importantly, in the buccal (lip-side) bone that is not making contact with the implant. The computed strain concentration patterns are found to be in good agreement with the observations from our prior experiments using 3D full-field mechanical testing coupled with micro-CT and digital volume correlation. The buccal bone is thinner and less stiff than other areas of bone and is also the commonly observed area of bone resorption after dental implant treatment.
Keywords: finite element method, dental implant, bone volume fraction, micro-CT
1. Introduction
According to the American Academy of Implant Dentistry (AAID), 3 million Americans have dental implants and that number is growing by 0.5 million a year [1]. In a recent study, patients with a combination of risk factors have long-term implant success rate of 65% [2]. Implant failure is associated with bone resorption in the mid-buccal (lip-side) plate, of which the mechanism is still unclear [3]–[5]. Bone is a living tissue and adapts to changes in mechanical loads [6]–[8]. The mechanics of implant-bone structures has been shown to affect the early stages of healing at bone-implant interfaces in mice tibiae [9]. There is a need to study 3-dimensional (3D) implant-bone mechanics as it relates to human dental anatomy and long-term implant success.
A combination of experiments and numerical models, especially finite element models, has been used to study bone and implant mechanics. In one study, 3D strain in trabecular bone blocks with no implants was calculated and validated using digital volume correlation [10]. In another study, the 2-dimensional (2D) strain on the surface of epoxy resin with implant installed in it was computed and validated using experimental results from digital image correlation [11]. In a recent work, 2D strain around implant in mice tibia was predicted using axisymmetric finite element models and validated by the experimental measurements using machine vision photogrammetry [9]. To the best of our knowledge, the 3D bone-implant finite element simulation as related to human anatomy hasn’t been validated using 3D strain mapping experiments.
In our prior work, the 3D implant-bone biomechanics in a human cadaveric mandible was studied using mechanical testing coupled with micro X-ray computed tomography (micro-CT) [12]. 3D strain contours in bone surrounding dental implants were mapped through digital volume correlation (DVC) on micro-CT images of no-load and loaded specimens. Our results revealed high strain concentrations located not only at the implant-bone contact areas, but also in the buccal bone which is not in contact with the implants. In this work, numerical models are built to compute the 3D strain distribution in the implant-bone structures and to be validated with these experimental measurements.
The finite element method has been used extensively in the study of mechanics for bone and bone-implant constructs. The trabecular bone was modeled either as a continuum with no explicit microscopic trabecular structures [13]–[18] or as a spongy structure with the micro-scale trabeculae [19]–[25]. When there were no micro-scale trabecular structures in the models, the Young’s modulus of bone was modeled as a constant [13], [14], [18] or was modeled according to the local CT number or Hounsfield unit from the CT images [15]–[17] in an attempt to increase the accuracy of the models. In those models with micro-scale trabecular structures, the trabecular bone can be meshed using a geometry-based method [18], [22] or voxel-based method [18]–[21], [23]–[25]. The voxel-based method has shown to be a straightforward method to mesh the complex trabecular structures. The results from voxel-based method also highly correlate with those from the geometry-based method and experimental measurements [18]. However, a primary disadvantage of the voxel-based method is that it often generates disconnected regions in the mesh. Tetrahedron elements were used in the voxel-based method to improve the connectivity of the mesh [20], [21]. Another technique to improve connectivity is mass-compensated meshing [20].
In this paper, micro-CT scans of a cadaveric mandible with dental implants in it were converted to voxel-based finite element models with detailed micro-scale geometry for the trabecular structures. The strain distribution in bone under implant loading was computed and compared with our prior experimental discoveries. Parametric sensitivity analyses were conducted for critical model parameters. To increase the connectivity of the mesh and to improve the accuracy of the models, a novel method of assigning Young’s moduli of trabecular bone elements based on their bone-volume-fraction values was compared to the standard approach.
2. Materials and Methods
2.1. Micro-CT Imaging and Image Processing
In our prior work [12], micro-CT images were obtained for two dental implants. They were implanted in a human cadaver mandible to replace the two lateral incisors (teeth number 23 and 26 in the universal numbering system). Hence, the two implants were referred to as implant 23 and implant 26.
The micro-CT images were processed in a 3D image analysis software (AVIZO, FEI Visualization Sciences Group, Burlington, MA). They were cropped, resized and segmented into four parts: implant, bone, tooth and background. The images were then processed by our custom-written MATLAB code (MathWorks, Inc., Natick, MA) to generate 3D finite element models of implant-bone structures. The periodontal ligaments connecting teeth and bone were neglected. The teeth and implants were fully bonded to bone in the models.
2.2. Voxel-based Micro-finite Element (micro-FE) Modeling
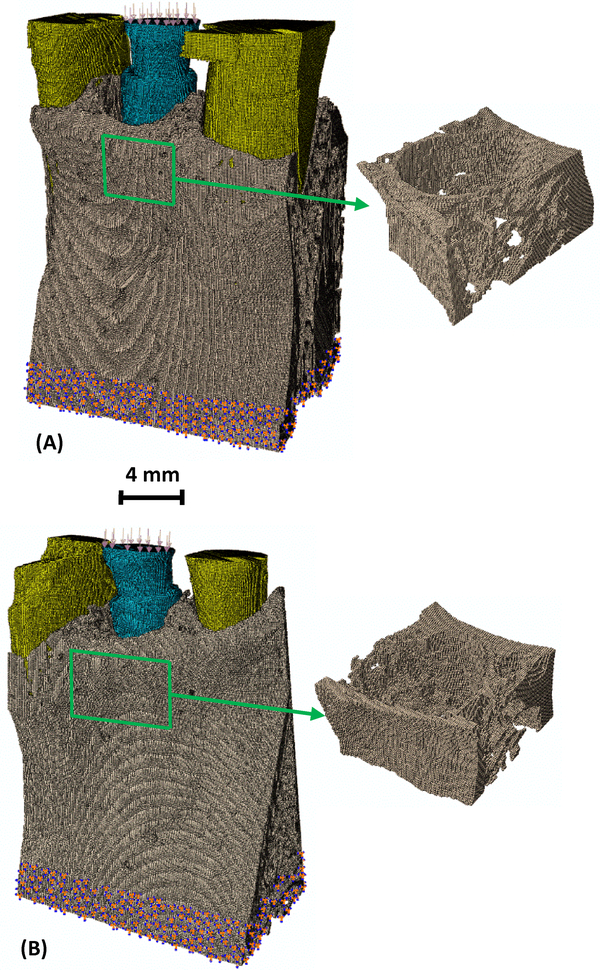
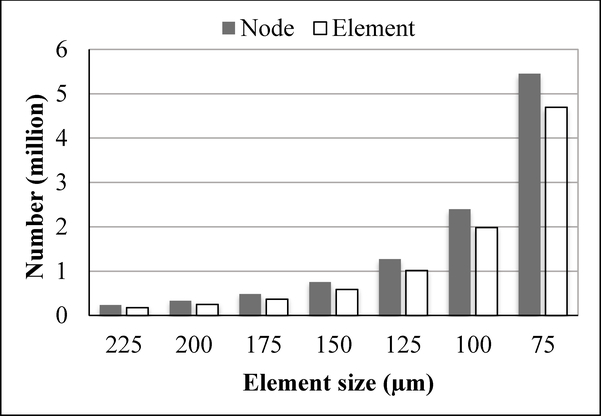
Seven different meshes with increasing mesh density were created. Adjacent image voxels (9×9×9, 8×8×8, 7×7×7 … or 3×3×3, respectively) were combined together to form one hexahedron element. The micro-CT images had isometric voxels with dimensions of 25 μm. Hence, the finite element models had elements with isometric sizes of either 225, 200, 175, 150, 125, 100 or 75 μm, respectively. Figure 1 shows the models for the two implant-bone structures with the finest mesh (75 μm). As expected, the number of elements and the number of nodes increased rapidly and nonlinearly with decreasing element sizes (Fig. 2). For example, in the implant 26 models with the smallest element size of 75 μm, there were ~5.5 million nodes and ~4.7 million elements in one model.
Fig. 1.
The voxel-based finite element model for (A) implant 23 in bone and (B) implant 26 in bone, with inset images showing the detailed 3D trabecular structures in the model. The element size is 75 μm. Blue – implant; Grey- bone; and Yellow – teeth.
Fig. 2.
Number of elements and number of nodes for several implant 26 models with decreasing element size.
All materials were assumed to be linear elastic and isotropic. The anisotropic properties of trabecular bone were reflected in its anisotropic geometries in the models. A range of Young’s modulus was used to study the effects of tissue-level material properties on the results. The intrinsic tissue moduli for trabecular and cortical bone were shown to be comparable by previous nanoindentation experiments [26]. Thus, the Young’s moduli for cortical and trabecular bone in the models were modeled to be the same, ranging from 13 to 25 GPa [26]–[28], with increments of 2 GPa. For simplicity, the Young’s modulus of dentin was used for the whole teeth, ranging from 12 to 18.6 GPa [29], with increments of ~2 GPa. The exact composition and Young’s modulus of the Ti-Zr alloy implants in this work is company proprietary. The Young’s modulus of one type of Ti-Zr implant was measured to be 103 GPa [30]. The moduli for Ti and Zr are 116 and 96 GPa, respectively [31]. Hence, the Young’s modulus of the implants were modeled to be from 100 to 116 GPa, with increments of 4 GPa. The Poisson’s ratios were chosen to be 0.3, 0.31 and 0.34 for bone, tooth and implant, respectively.
The finite element models were then imported into Abaqus software (Dassault Systèmes Simulia Corporation, Providence, RI) to apply boundary conditions. In our prior experiments [12], the bottoms of the specimens were embedded in polymeric materials. Hence, the bottom part of the models were fully constrained to have no displacement or rotation. A static load of 150 N was uniformly distributed on the top surface of the implant to press it downward, reflecting the loading condition used in our experiments [12]. Finite element simulations were carried out in Abaqus software to compute the strain in bone under implant loading.
2.3. Tissue Modulus Based on Bone Volume Fraction (BV/TV)
Trabecular bone is porous with its bone volume fraction (BV/TV) defined as the volume of mineralized bone per unit volume of interest. In this work, we propose a new method to model the bone elements in the voxel-based micro-FE modeling. The bone volume fraction for each element was calculated by dividing the number of voxels in the element that were labeled as bone in the segmentation process in section 2.1, by the total number of voxels in the element. The Young’s modulus of a bone element is a function of its bone volume fraction, given by [32], [33]
| (1) |
where E is the Young’s modulus in the unit of GPa and BV/TV is the bone volume divided by total volume, i.e. bone volume fraction, ranged from 0 to 1. The Young’s moduli were assigned to each bone element using our custom-written Python code. The Young’s modulus of 15 GPa was assigned to the nonporous cortical bone elements which had a BV/TV of 1.
3. Results
3.1. Strain Distribution
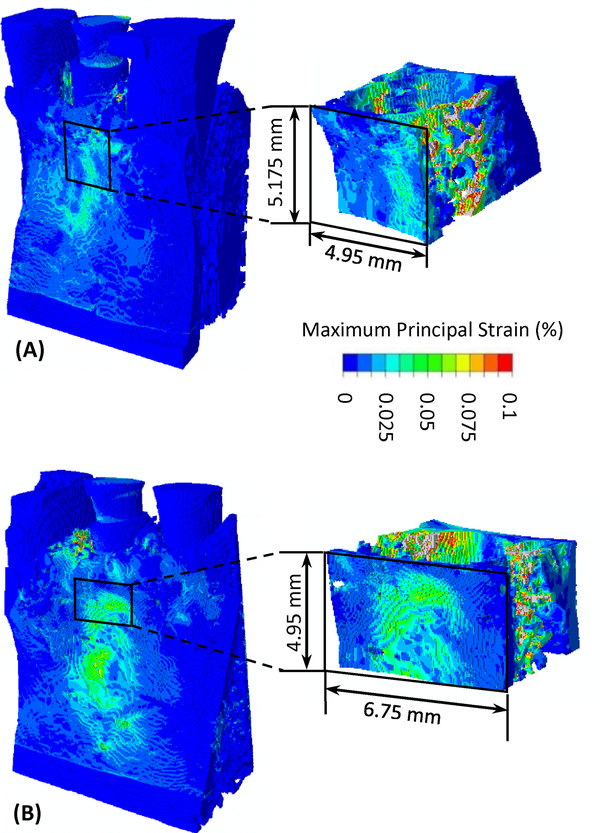
The computed 3D maximum principal strain in bone under implant loading is presented in Fig. 3. In addition, the computed maximum principal strain on all cross-sections in the 3D implant-structures for implant 23 is presented as an animation in the supplementary material. High strain appears at the bone-implant contact areas. It also appears on the surface of buccal bone at ~3 mm below the bone crest.
Fig. 3.
The computed 3D distribution of maximum principal strain in bone under implant loading for (A) implant 23 in bone and (B) implant 26 in bone.
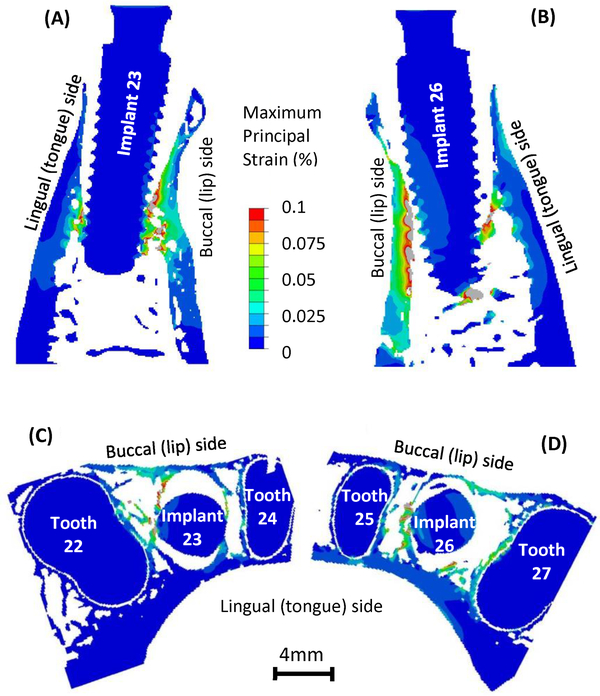
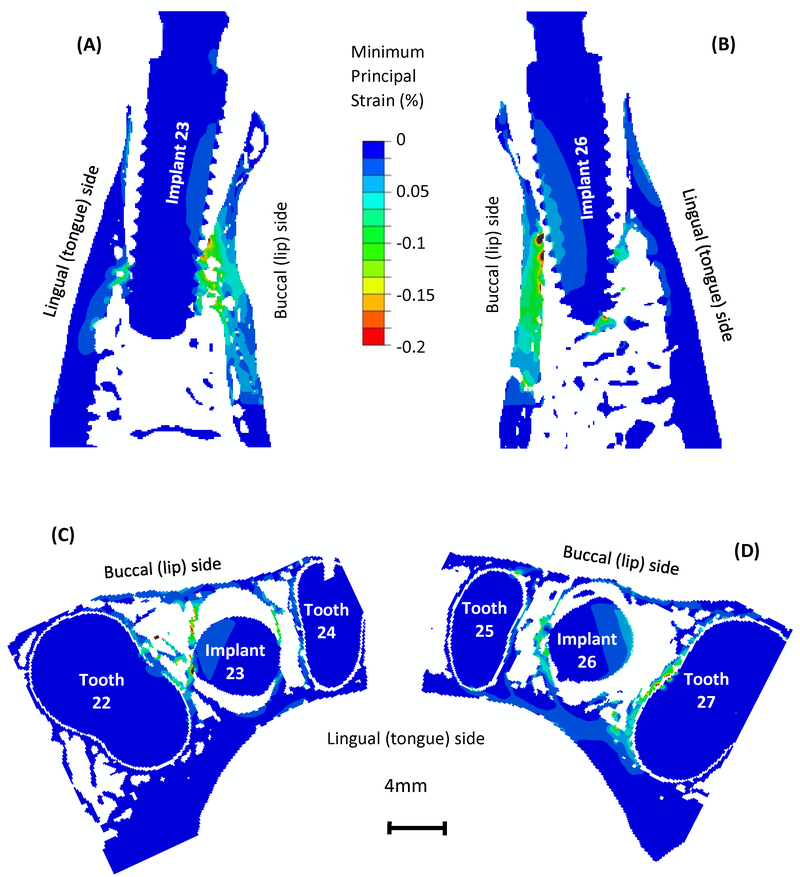
The computed maximum and minimum principal strain contour on the implant-bone structures on the longitudinal sections and cross sections are presented in Figs. 4 and 5, respectively. In Fig. 4, high maximum principal strain appears at the implant-bone contact regions, and the strain value decreases as it moves away from the implants and manifests into the supporting bone. It is important to note the strain concentration in the buccal (lip-side) and lingual (tongue-side) bones where they are not making contact with the implants. In particular, strain concentration in the buccal bone is more substantial than that in the lingual bone. In Fig. 5, minimum principal strain is lowest at the implant-bone contact regions, and increases as it moves away from the implants. Strain concentration in the buccal and lingual bones mostly appears in the regions that are making contact with the implants. In the regions that are not making contact with the implants, there are not substantial concentrations of minimum principal strain.
Fig. 4.
Maximum principal strain distribution on the longitudinal sections for (A) implant 23 in bone and (B) implant 26 in bone and on the axial cross sections for (C) implant 23 in bone and (D) implant 26 in bone.
Fig. 5.
Minimum principal strain distribution on the longitudinal sections for (A) implant 23 in bone and (B) implant 26 in bone and on the axial cross sections for (C) implant 23 in bone and (D) implant 26 in bone.
Figs. 3 to 5 show typical strain distributions resulting from models with an element size of 75 μm; Young’s moduli of 15, 116 and 18.6 GPa for bone, implant and tooth, respectively; and the bottom 2.25 mm of the models fixed. With the change of these model parameters, our models resulted in similar patterns in strain distribution, but of different values. The effects of these model parameters on strain values will be discussed in the following sections.
The computed highest elemental strain in the bone was dependent on the mesh of the trabecular bone and did not stay at the exact same location in models with different parameters. However, across all models the characteristic high maximum principal strain appeared in the same region in the mid-buccal bone, as shown in Fig. 3. Hence, the average maximum principal strain in bone in a volume-of-interest (VOI) at the vicinity of the implants was computed and used in the following discussions. The location and dimension of the VOI are illustrated in Fig. 3. The VOI included the high strain regions at the implant-bone contact areas, as well as those in the buccal bone. The method of comparing results in a sub-volume of bone at the vicinity of implant was also used by Korabi et al [34].
3.2. Mesh Convergence and Computational Cost
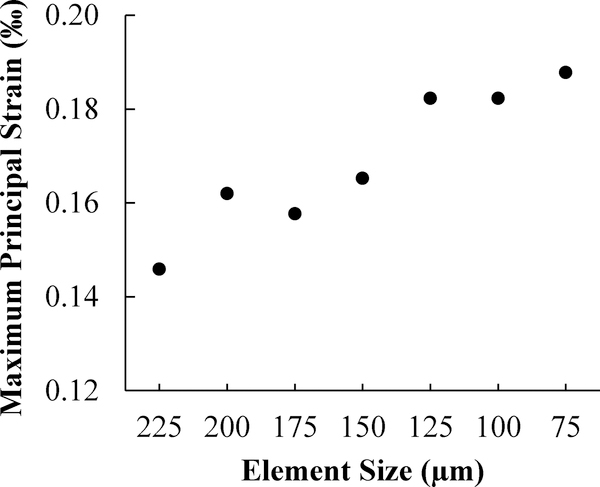
In the models for implant 26, the averaged maximum principal strain in bone in the VOI at the vicinity of the implants increased with decreasing element size, as presented in Fig. 6. Similarly, implant 23 in bone models also resulted in increasing strain with decreasing element size. When the element size was reduced from 125 μm to 75 μm, the averaged strain in bone only increased by 3.0% (Fig. 6), indicating adequate mesh convergence.
Fig. 6.
Computed maximum principal strain in bone from several models with various element sizes for implant 26 in bone.
When the element size reduced from 225 μm to 75 μm, the number of nodes increased from ~ 0.2 million to ~ 5.5 million (Fig. 2), while the computer memory required for calculation increased from ~20 GB to ~ 500 GB. The computing time also increased dramatically with decreasing element size. Models with element size smaller than 75 μm were also built, but were not able to be solved because of the limitation of our computing capability (16 CPU of 2.2 GHz Intel Xeon and memory of ~500 GB). The models with the finest possible mesh that we could achieve (75 μm) were used in the following results.
3.3. Sensitivity to Other Model Parameters
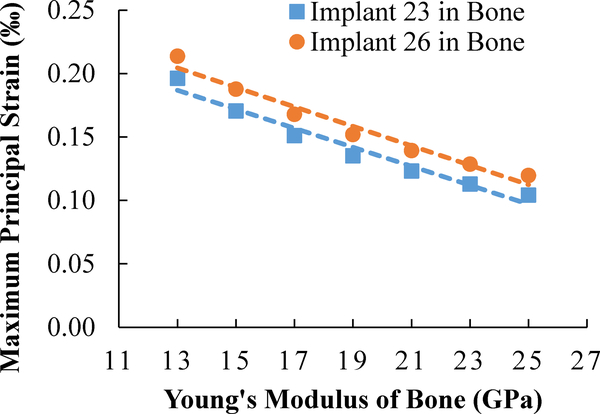
When the tissue modulus of bone increased in the models, the stiffness of bone increased, hence the computed average maximum principal strain in the above-mentioned VOI for bone decreased, as presented in Fig. 7. The relationship between the strain in bone and the tissue modulus of bone is linear (Fig. 7), consistent with the models’ linear elastic material properties. The resulting small strain also suggests there is no geometric non-linearity under normal chewing and biting forces.
Fig. 7.
Computed maximum principal strain in bone from several implant/bone models with different Young’s modulus of bone.
The Young’s modulus of implants in the model did not have a substantial effect on the computed strain in bone (Fig. S1A). As the Young’s modulus of implant increased by 16% from 100 GPa to 116 GPa, the strain in the top 1/3 of the implants decreased within 5%, and the change of strain in the bottom 2/3 of the implants was almost negligible. The load dissipation from implants to bone did not change significantly. Hence, the average strain in bone in the VOI did not change substantially (Fig. S1A).
The Young’s modulus of teeth in the models did not have a substantial effect on the computed strain bone, either (Fig. S1B). The strain in teeth was much lower than that in bone when the implants were loaded (Figs. 3 to 5). They were located further away from the implants, compared with the VOI. Hence, it appears generally acceptable to neglect the detailed differences in the structures and materials properties of enamel, dentin and pulp.
The bottom part of the models were fully fixed with no rotation or displacement. As the height of the fixed bottom part increased, the computed average strain in bone in the volume-of-interest did not change markedly (Fig. S1C). Because the fixed bottom is far from the VOI, the height of fixed part does not substantially affect how the load were transmitted from implant to bone or how the bone in the VOI were deformed and strained. In the experiments, the bottom of the specimens were embedded in PMMA. The results from these simulations also suggest that the amount of the PMMA embedding material used in the experiments does not have a substantial influence on the experimental results, when its height is much lower than the height of the VOI.
3.4. BV/TV-based Tissue Modulus
Compared with uniform tissue modulus of 15 GPa, when the tissue modulus of each bone element was assigned based on local BV/TV, the number of nodes increased by 5.8% and 6.4% for implants 23 and 26 in bone models, respectively (Table 1), with other parameters held constant. Similarly, the number of elements increased by 7.3% and 8.1%. The trend of 3D strain distribution is similar to that resulting from uniform tissue modulus, with high strain at the bone-implant contact regions and mid-buccal bone. Importantly, the computed average maximum principal strain values in the VOI increased by 22.6% and nearly 40% for implants 23 and 26 in bone models, respectively, when using BV/TV-based method as compared to using the uniform modulus.
Table 1.
Comparison between uniform Young’s modulus and BV/TV-based Young’s modulus for bone
| Implant 23 in Bone | |||
| Average Maximum Principal Strain in the VOI | Number of Nodes | Number of Elements | |
| Uniform Young’s Modulus | 0.0171% | 5293231 | 4624186 |
| Bone-volume-fraction-based Young’s Modulus | 0.0221% | 5616390 | 4989557 |
| Implant 26 in Bone | |||
| Averaged Maximum Principal Strain in the VOI | Number of Nodes | Number of Elements | |
| Uniform Young’s Modulus | 0.0188% | 4996109 | 4328418 |
| Bone-volume-fraction-based Young’s Modulus | 0.0309% | 5339742 | 4711509 |
4. Discussion
4.1. Comparison of Experimental Measurements and Simulation Results
The computed patterns of strain distribution are in good agreement with the patterns obtained from our prior experiments using mechanical testing coupled with micro-CT and digital volume correlation [12]. In the experiments, high strain concentration for maximum principal strain was also discovered at the bone-implant contact locations, especially on the distal side. The experimental results also revealed strain concentration in the mid-buccal bone that was about 5 to 7 mm below the bone crest. The strain values in buccal bone obtained from experiments for implant 26 was not as high as those for implant 23, but the trend of strain concentration in buccal bone is consistent in the two specimens. In contrast, the strain concentration on the surface of the lingual bone was not substantial.
However, the computed maximum principal strain values at bone-implant contact regions are higher than those obtained from experiments. In the experiments, the implants were placed into cadaver specimens and bone-implant interfaces included no osseointegration. But, in the numerical models, the bone-implant interfaces were fully bonded and may be over-constrained. The directions of future work include the improvement of bone-implant interface interactions to better represent bone-implant contact before osseointegration.
On the other hand, the computed maximum principal strain in the mid-buccal bone was lower than that obtained from prior experiments using the same specimens. This may be at least partly attributable to beam hardening artifacts that may have affected the strain mapping using digital volume correlation of no-load and loaded images. The mismatch of X-ray attenuation coefficients for metallic implants and hard and soft biological tissues resulted in the beam hardening artifacts in the micro-CT images. Although the artifacts have been suppressed in the experiments using a combination of physical filter and a reconstruction algorithm, they were not fully removed.
Alternatively, the tissue strain values may be underestimated in the numerical models. Several studies using voxel-based finite element simulation for trabecular bone with the absence of implants suggested that the accuracy of the models depended on the element size in relation to trabecular thickness [20], [23], [35]. The trabecular thickness values in this study are 331 μm and 320 μm for the two specimens, which is nearly 4 times greater than the element size of 75 μm. The accuracy of the models could have been improved by further reducing the element size, but the total number of elements/nodes in the models reached the limitation of our computation capability. For studies of implant biomechanics, the overall size of specimens (which influences model size) in the experiments and the numerical models need to be large enough to accommodate the implants. Wee et al. [24] explored a multi-scale modeling method that passed the results from macroscale models with no micro-scale trabecular structures to the micro-scale models with voxel-based micro trabecular structures by prescribed boundary conditions. The method was effective yet cumbersome. There is a need to seek for other methods for the improvement of the accuracy of these numerical models of implanted constructs.
4.2. Tissue Modulus for Trabecular Bone
The accuracy of the computational results depends on the selection of trabecular tissue modulus (Fig. 6). However, there are large discrepancies in reported trabecular tissue modulus from prior experimental and computational studies. Ryan and Williams measured trabecular tissue modulus values between 0.4 and 3.6 GPa, using tensile tests on single trabeculae [36]. Other studies, using three or four-point bend tests, resulted in tissue modulus values from 3.81 to 5.72 GPa [37]–[39]. Rho et al. determined the tissue modulus of single trabeculae, using microtensile testing and ultrasonic techniques, to be 10.4–14.8 GPa [40]. Rho et al. found Young’s modulus for trabecular bone to be 13.5–22.7 GPa using a nanoindentation technique [26], [27]. Rietbergen et al. used a numerical model in combination with experimental data taken from the literature and determined the trabecular tissue modulus be 2.23–10.1 GPa [23]. The discrepancies in the tissue modulus could be attributed to the differences in the experimental methods, the individual variations, the different anatomic locations and the anisotropic properties.
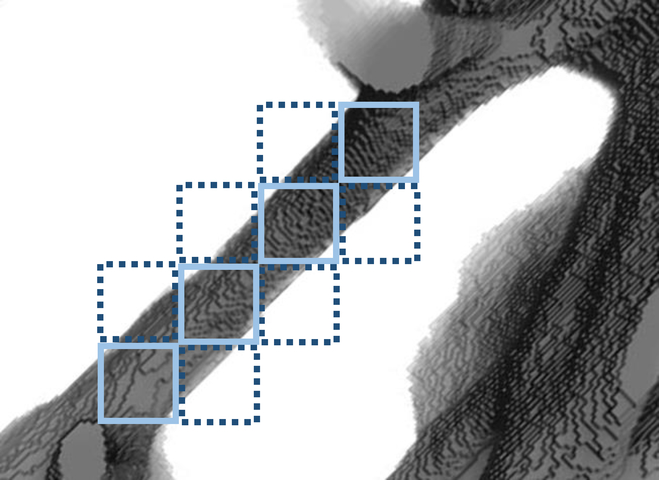
The models with uniform bone modulus (section 2.2) have inherent limitations. When the adjacent image pixels were combined to form a hexahedral element, only those elements with a BV/TV of 50% and above were modeled as bone. If their BV/TV values were not 100% (solid elements in Fig. 8), by assigning the uniform Young’s modulus of bone to these elements, their stiffness values were overestimated. In contrast, for those elements with BV/TV greater than 0 but lower than 50% (dashed elements in Fig. 8), they were modeled as empty space, with underestimated (zero) stiffness. Moreover, this process created discontinuities in the mesh. One example is illustrated in Fig. 8. When the dashed elements were modeled as empty spaces, the solid elements had insufficient constraints and usually resulted in zero pivot errors or numerical singularities. They had to be deleted to achieve convergence of the simulations. These processes resulted in disconnected regions in the model, and compromised the geometry and stiffness of the models. In the current study, when the element size decreased, the number of unconnected trabeculae was also reduced, because the models with finer mesh can more accurately represent the actual geometry of the trabecular bone. Ulrich et al. also suggested that the number of unconnected bone parts indicates the inaccuracy of the models [20].
Fig. 8.
A schematic showing the voxel-based meshing with uniform Young’s modulus (solid elements) and the Young’s modulus based on bone-volume-fraction (solid and dashed elements).
There were several efforts taken in prior studies to improve model accuracy. Voxel-based tetrahedron elements can improve the connectivity of the mesh [20], [21], but this method is not as straightforward as the hexahedral elements. Another technique to improve connectivity is mass-compensated meshing [20], in which the CT number threshold is arbitrarily selected to achieve the desired BV/TV of the models. The mass-compensated method compensates the loss of unconnected parts by thickening of the remaining structure. In other models without micro-scale trabecular structures [15]–[17], the tissue modulus of bone was assigned according to the local CT number or Hounsfield unit from the CT images in several models. However, this method is not applicable in this study due to the beam hardening artifacts resulting from the metallic implants. When substitutive polymeric implants were used in the experiments [9], the artifacts in the CT images may be removed, but the bone-implant mechanics may also be altered. Akagawa et al. modeled osseointegrated titanium implants in monkey mandible and assigned Young’s modulus for bone elements based on their BV/TV. Their method was time-consuming, because their 3D models and BV/TV values were obtained from sectioning and grinding of the specimens at intervals of 75 μm and tracing of the bone cross-sections using a profile projector.
The BV/TV-based trabecular tissue modulus method proposed in this work was achieved using less time-consuming micro-CT imaging. It has several advantages compared with the uniform tissue modulus method. First, the estimation of stiffness was more accurate for those elements with BV/TV that are not 100%, compared with the uniform modulus method, in which the elements with BV/TV less than 50% were deleted and underestimate and BV/TV between 50% to 100% were overestimated. Second, the BV/TV-based method increased the connectivity in the mesh by adding elements with BV/TV less than 50% to the models. In Fig. 8, besides the solid elements, the dashed elements were also modeled as bone elements with relatively lower Young’s modulus. The constraints for the solid elements were increased. And both the solid and dashed elements can be kept in the model. It is shown in Table 1 that the number of nodes and elements both increased, when BV/TV-based Young’s modulus was assigned to bone elements. The number of zero pivot errors or numerical singularities was also greatly reduced in these simulations. These are the indications of the improvement of the accuracy of the models [20]. Third, the results (Table 1) show that with little increase in node number and computational cost, the computed strain values largely increased and were closer to experimental measurements. Moreover, this method is still voxel-based with all elements being hexahedron, hence it is more straightforward than using tetrahedron elements [20], [21]. It is also less arbitrary than the mass-compensated meshing method [20], because there is no need to adjust the CT number threshold.
4.3. Implications
The strain distributions in bone are related to the bone-implant contact geometry and anatomy of mandibular bone. When the load was applied on the implants, the implants were pushed into the tooth sockets and pressed on the alveolar bone, hence the high strain concentration at bone-implant contact regions can be expected. However, the high strain in buccal and lingual bones is less intuitive, because these regions are not directly making contact with implants. The alveolar sockets were expanded when the implants were loaded and resulted in tensile strain in buccal and lingual bones (Fig. 4). The strain in buccal bone is especially higher and could be attributed to the fact that the buccal bone is thinner and less stiff than the lingual bone (Figs. 4C and 4D).
An important advantage of this study of dental bone-implant mechanics is the consideration of human 3D anatomy including the alveolar socket geometry and differences between buccal and lingual bones. Other methods using animal models with different anatomy may not reveal the same strain pattern as those in human mandibles. Axisymmetric models [9] and 2D models that do not have buccal and lingual bone geometry were not likely to reveal high strain in mid-buccal plates, either.
The results obtained from the current simulations provide insights that could guide the future improvement of the dental implant treatments. Dental implant failure is associated with bone resorption in the mid-buccal plate, of which the mechanism is still unclear [3]–[5]. The failure criteria of bone are complex. The experimental studies on the strength of bone have shown that the compressive strength were higher than tensile strength for both cortical and trabecular bones [41]–[44]. The strengths of bone have also found to be anisotropic [41]–[44]. The studies on the fracture toughness and the crack growth resistance of bone have shown a combination of several toughening mechanisms for bone [45]–[48]. Also, the crack driving forces for small cracks have found to be much lower than those for larger cracks. Moreover, bone is a living tissue and adapts to the changes in mechanical loads even below the critical loads [6]–[8]. The current simulation results show that the immediate loading on dental implants results in higher strain on the buccal bone than the lingual bone (Figs 3 and 4). The strain concentration in buccal bone could be a contributing factor for the bone loss in this region. Our work provides valid models with high resolution and fidelity for future studies of implant-bone biomechanics towards the success of implant treatment, using alternative boundary conditions, implant designs, or bone morphologies that may be clinically relevant. For example, future work can explore the effects of bone graft between implants and native bone on the biomechanics of bone-implant constructs. The possible direction of future work also includes the investigation of implant-bone biomechanics during the osseointegration process and the long-term bone remodeling after the healing period. Further consideration should be given toward reducing the strain concentration in the buccal bone.
5. Conclusions
This paper presents the results of 3D voxel-based micro-scale finite element modeling for dental implants in mandible bone converted from micro-CT images. The results show that computed strain values in bone were sensitive to the uncertainties in trabecular tissue modulus. To increase the accuracy of the models, Young’s modulus of bone elements was assigned based on their BV/TV. This method also increased the connectivity for the mesh and reduced the zero pivot errors and singularity warnings. The computed results showed a higher strain concentration in mid-buccal bone than those on the lingual bone, which is in good agreement with our prior experimental discoveries using micro-CT-coupled mechanical testing and digital volume correlation. Our results suggest that clinically observed bone resorption patterns on the mid-buccal bone and implant failures could be related to the strain concentrations in mid-buccal bone. Our methods provide valid models for future investigations of alternative implant treatments towards the improvement of clinical success.
Supplementary Material
Acknowledgment
The project described was supported by the National Center for Advancing Translational Sciences, National Institutes of Health, through Grant UL1TR002014. The content is solely the responsibility of the authors and does not necessarily represent the official views of the NIH. The support was made available through Penn State Clinical and Translational Science Institute (CTSI). Mr Qiyuan Mao was supported by the Education Department of Jiangsu Province. The authors are also grateful to Dr. Sunita Ho and Dr. Don Curtis at the University of California, San Francisco (UCSF) for her contribution in the experiments in our prior work. The authors would also like to express gratitude to the Institute for CyberScience (ICS) at Penn State University for providing software, computing cores and storage.
Footnotes
Competing Interests Statement
The authors have no competing interests to declare.
Supplementary material
The computed maximum principal strain on all cross-sections in the 3D implant-structures for implant 23 is provided in an animation. The computed maximum principal strain values with different selections of implant modulus, tooth modulus and boundary conditions are presented in a supplementary figure.
References
- [1].American Academy of Implant Dentistry, “Dental Implants Facts and Figures.” [Google Scholar]
- [2].De Angelis F, Papi P, Mencio F, Rosella D, Di Carlo S, and Pompa G, “Implant survival and success rates in patients with risk factors: results from a long-term retrospective study with a 10 to 18 years follow-up.,” Eur. Rev. Med. Pharmacol. Sci, vol. 21, no. 3, pp. 433–437, 2017. [PubMed] [Google Scholar]
- [3].Chen ST and Buser D, “Esthetic outcomes following immediate and early implant placement in the anterior maxilla--a systematic review.,” Int. J. Oral Maxillofac. Implants, vol. 29 Suppl, no. 1, pp. 186–215, January 2014. [DOI] [PubMed] [Google Scholar]
- [4].Chen ST and Buser D, “Clinical and esthetic outcomes of implants placed in postextraction sites.,” Int. J. Oral Maxillofac. Implants, vol. 24 Suppl, pp. 186–217, January 2009. [PubMed] [Google Scholar]
- [5].Kan JYK, Rungcharassaeng K, Lozada JL, and Zimmerman G, “Facial gingival tissue stability following immediate placement and provisionalization of maxillary anterior single implants: a 2- to 8-year follow-up.,” Int. J. Oral Maxillofac. Implants, vol. 26, no. 1, pp. 179–87, 2010. [PubMed] [Google Scholar]
- [6].Wolff J, The law of bone remodeling. New York: Springer-Verlag, 1986. [Google Scholar]
- [7].Frost HM, “Wolff’s Law and bone’s structural adaptations to mechanical usage: an overview for clinicians.,” Angle Orthodontist, vol. 64, no. 3 pp. 175–188, January-1994. [DOI] [PubMed] [Google Scholar]
- [8].Roberts WE, Huja S, and Roberts JA, “Bone modeling: biomechanics, molecular mechanisms, and clinical perspectives,” Semin. Orthod, vol. 10, no. 2, pp. 123–161, June 2004. [Google Scholar]
- [9].Wazen RM, Currey JA, Guo H, Brunski JB, Helms JA, and Nanci A, “Micromotion-induced strain fields influence early stages of repair at bone–implant interfaces,” Acta Biomater, vol. 9, no. 5, pp. 6663–6674, May 2013. [DOI] [PMC free article] [PubMed] [Google Scholar]
- [10].Zauel R, Yeni YN, Bay BK, Dong XN, and Fyhrie DP, “Comparison of the linear finite element prediction of deformation and strain of human cancellous bone to 3D digital volume correlation measurements.,” J. Biomech. Eng, vol. 128, no. 1, pp. 1–6, February 2006. [DOI] [PubMed] [Google Scholar]
- [11].Tiossi R, Vasco MAA, Lin L, Conrad HJ, Bezzon OL, Ribeiro RF, and Fok ASL, “Validation of finite element models for strain analysis of implant-supported prostheses using digital image correlation,” Dent. Mater, vol. 29, no. 7, pp. 788–796, July 2013. [DOI] [PubMed] [Google Scholar]
- [12].Du J, Lee J, Jang AT, Gu A, Hossaini-Zadeh M, Prevost R, Curtis DA, and Ho SP, “Biomechanics and strain mapping in bone as related to immediately-loaded dental implants (PMCID:PMC4663100),” J. Biomech, vol. 48, no. 12, pp. 3486–3494, September 2015. [DOI] [PMC free article] [PubMed] [Google Scholar]
- [13].Chou HY, Müftü S, and Bozkaya D, “Combined effects of implant insertion depth and alveolar bone quality on periimplant bone strain induced by a wide-diameter, short implant and a narrow-diameter, long implant,” J. Prosthet. Dent, vol. 104, no. 5, pp. 293–300, November 2010. [DOI] [PubMed] [Google Scholar]
- [14].Baggi L, Cappelloni I, Di Girolamo M, Maceri F, and Vairo G, “The influence of implant diameter and length on stress distribution of osseointegrated implants related to crestal bone geometry: A three-dimensional finite element analysis,” J. Prosthet. Dent, vol. 100, no. 6, pp. 422–431, December 2008. [DOI] [PubMed] [Google Scholar]
- [15].Taddei F, Schileo E, Helgason B, Cristofolini L, and Viceconti M, “The material mapping strategy influences the accuracy of CT-based finite element models of bones: An evaluation against experimental measurements,” Med. Eng. Phys, vol. 29, no. 9, pp. 973–979, November 2007. [DOI] [PubMed] [Google Scholar]
- [16].Keyak JH, Meagher JM, Skinner HB, and Mote CD, “Automated three-dimensional finite element modelling of bone: a new method,” J. Biomed. Eng, vol. 12, no. 5, pp. 389–397, September 1990. [DOI] [PubMed] [Google Scholar]
- [17].Keyak JH and Skinner HB, “Three-dimensional finite element modelling of bone: effects of element size,” J. Biomed. Eng, vol. 14, no. 6, pp. 483–489, November 1992. [DOI] [PubMed] [Google Scholar]
- [18].Lengsfeld M, Schmitt J, Alter P, Kaminsky J, Leppek R, Lengsfeld M, Schmitt J, Schmitt J, Alter P, Alter P, Kaminsky J, Kaminsky J, Leppek R, and Leppek R, “Comparison of geometry-based and CT voxel-based finite element modelling and experimental validation,” Med. Eng. Phys, vol. 20, pp. 515–522, 1998. [DOI] [PubMed] [Google Scholar]
- [19].Jaecques SVN, Van Oosterwyck H, Muraru L, Van Cleynenbreugel T, De Smet E, Wevers M, Naert I, and Vander Sloten J, “Individualised, micro CT-based finite element modelling as a tool for biomechanical analysis related to tissue engineering of bone,” Biomaterials, vol. 25, no. 9, pp. 1683–1696, April 2004. [DOI] [PubMed] [Google Scholar]
- [20].Ulrich D, van Rietbergen B, Weinans H, and Rüegsegger P, “Finite element analysis of trabecular bone structure: a comparison of image-based meshing techniques,” J. Biomech, vol. 31, no. 12, pp. 1187–1192, December 1998. [DOI] [PubMed] [Google Scholar]
- [21].Müller R and Rüegsegger P, “Three-dimensional finite element modelling of non-invasively assessed trabecular bone structures,” Med. Eng. Phys, vol. 17, no. 2, pp. 126–133, March 1995. [DOI] [PubMed] [Google Scholar]
- [22].Marcián P, Borák L, Valášek J, Kaiser J, Florian Z, and Wolff J, “Finite element analysis of dental implant loading on atrophic and non-atrophic cancellous and cortical mandibular bone – a feasibility study,” J. Biomech, vol. 47, no. 16, pp. 3830–3836, December 2014. [DOI] [PubMed] [Google Scholar]
- [23].van Rietbergen B, Weinans H, Huiskes R, and Odgaard A, “A new method to determine trabecular bone elastic properties and loading using micromechanical finite-element models,” J. Biomech, vol. 28, no. 1, pp. 69–81, January 1995. [DOI] [PubMed] [Google Scholar]
- [24].Wee H, Armstrong AD, Flint WW, Kunselman AR, and Lewis GS, “Peri-implant stress correlates with bone and cement morphology: Micro-FE modeling of implanted cadaveric glenoids,” J. Orthop. Res, vol. 33, no. 11, pp. 1671–1679, November 2015. [DOI] [PMC free article] [PubMed] [Google Scholar]
- [25].Akagawa Y, Sato Y, Teixeira ER, Shindoi N, and Wadamoto M, “A mimic osseointegrated implant model for three-dimensional finite element analysis,” J. Oral Rehabil, vol. 30, no. 1, pp. 41–45, January 2003. [DOI] [PubMed] [Google Scholar]
- [26].Rho J-Y, Roy ME, Tsui TY, and Pharr GM, “Elastic properties of microstructural components of human bone tissue as measured by nanoindentation,” J. Biomed. Mater. Res, vol. 45, no. 1, pp. 48–54, April 1999. [DOI] [PubMed] [Google Scholar]
- [27].Rho J-Y, Tsui TY, and Pharr GM, “Elastic properties of human cortical and trabecular lamellar bone measured by nanoindentation,” Biomaterials, vol. 18, no. 20, pp. 1325–1330, October 1997. [DOI] [PubMed] [Google Scholar]
- [28].Reilly DT and Burnstein AH, “The mechanical properties of cortical bone,” J. Bone Jt. Surg. Am, vol. 56, no. 5, pp. 1001–1022, 1974. [PubMed] [Google Scholar]
- [29].Zhang Y-R, Du W, Zhou X-D, and Yu H-Y, “Review of research on the mechanical properties of the human tooth,” Int. J. Oral Sci, vol. 6, no. 2, pp. 61–69, June 2014. [DOI] [PMC free article] [PubMed] [Google Scholar]
- [30].Brizuela-Velasco A, Pérez-Pevida E, Jiménez-Garrudo A, Gil-Mur FJ, Manero JM, Punset-Fuste M, Chávarri-Prado D, Diéguez-Pereira M, and Monticelli F, “Mechanical Characterisation and Biomechanical and Biological Behaviours of Ti-Zr Binary-Alloy Dental Implants,” Biomed Res. Int, vol. 2017, pp. 1–10, 2017. [DOI] [PMC free article] [PubMed] [Google Scholar]
- [31].Soboyejo W, Mechanical properties of engineered materials. New York: CRC, 2003. [Google Scholar]
- [32].Hernandez CJ, Beaupré GS, Keller TS, and Carter DR, “The influence of bone volume fraction and ash fraction on bone strength and modulus,” Bone, vol. 29, no. 1, pp. 74–78, July 2001. [DOI] [PubMed] [Google Scholar]
- [33].Lorna BAH, Gibson J, Ashby Michael F., Cellular Materials in Nature and Medicine, 1 edition. Cambridge University Press, 2010. [Google Scholar]
- [34].Korabi R, Shemtov-Yona K, Dorogoy A, and Rittel D, “The Failure Envelope Concept Applied To The Bone-Dental Implant System,” Sci. Rep, vol. 7, no. 1, p. 2051, December 2017. [DOI] [PMC free article] [PubMed] [Google Scholar]
- [35].Niebur GL, Yuen JC, Hsia AC, and Keaveny TM, “Convergence behavior of high-resolution finite element models of trabecular bone.,” J. Biomech. Eng, vol. 121, no. 6, pp. 629–35, December 1999. [DOI] [PubMed] [Google Scholar]
- [36].Ryan SD and Williams JL, “Tensile testing of rodlike trabeculae excised from bovine femoral bone,” J. Biomech, vol. 22, no. 4, pp. 351–355, January 1989. [DOI] [PubMed] [Google Scholar]
- [37].Kuhn JL, Goldstein SA, Choi R, London M, Feldkamp LA, and Matthews LS, “Comparison of the trabecular and cortical tissue moduli from human iliac crests,” J. Orthop. Res, vol. 7, no. 6, pp. 876–884, November 1989. [DOI] [PubMed] [Google Scholar]
- [38].Choi K and Goldstein SA, “A comparison of the fatigue behavior of human trabecular and cortical bone tissue,” J. Biomech, vol. 25, no. 12, pp. 1371–1381, December 1992. [DOI] [PubMed] [Google Scholar]
- [39].Choi K, Kuhn JL, Ciarelli MJ, and Goldstein SA, “The elastic moduli of human subchondral, trabecular, and cortical bone tissue and the size-dependency of cortical bone modulus,” J. Biomech, vol. 23, no. 11, pp. 1103–1113, January 1990. [DOI] [PubMed] [Google Scholar]
- [40].Rho JY, Ashman RB, and Turner CH, “Young’s modulus of trabecular and cortical bone material: Ultrasonic and microtensile measurements,” J. Biomech, vol. 26, no. 2, pp. 111–119, February 1993. [DOI] [PubMed] [Google Scholar]
- [41].Evans FG and Lissner HR, “Tensile and Compressive Strength of Human Parietal Bone,” J. Appl. Physiol, vol. 10, no. 3, pp. 493–497, May 1957. [DOI] [PubMed] [Google Scholar]
- [42].Keaveny TM, Wachtel EF, Ford CM, and Hayes WC, “Differences between the tensile and compressive strengths of bovine tibial trabecular bone depend on modulus,” J. Biomech, vol. 27, no. 9, pp. 1137–1146, September 1994. [DOI] [PubMed] [Google Scholar]
- [43].Stone JL, Beaupre GS, and Hayes WC, “Multiaxial strength characteristics of trabecular bone,” J. Biomech, vol. 16, no. 9, pp. 743–752, January 1983. [DOI] [PubMed] [Google Scholar]
- [44].Reilly DT and Burstein AH, “The elastic and ultimate properties of compact bone tissue,” J. Biomech, vol. 8, no. 6, pp. 393–405, January 1975. [DOI] [PubMed] [Google Scholar]
- [45].Koester KJ, Ager JW, and Ritchie RO, “The true toughness of human cortical bone measured with realistically short cracks,” Nat. Mater, vol. 7, no. 8, pp. 672–677, August 2008. [DOI] [PubMed] [Google Scholar]
- [46].Buehler MJ, “Molecular nanomechanics of nascent bone: fibrillar toughening by mineralization,” Nanotechnology, vol. 18, no. 29, p. 295102, July 2007. [Google Scholar]
- [47].Poundarik AA, Diab T, Sroga GE, Ural A, Boskey AL, Gundberg CM, and Vashishth D, “Dilatational band formation in bone,” Proc. Natl. Acad. Sci, vol. 109, no. 47, pp. 19178–19183, November 2012. [DOI] [PMC free article] [PubMed] [Google Scholar]
- [48].Vashishth D, Behiri JC, and Bonfield W, “Crack growth resistance in cortical bone: Concept of microcrack toughening,” J. Biomech, vol. 30, no. 8, pp. 763–769, August 1997. [DOI] [PubMed] [Google Scholar]
Associated Data
This section collects any data citations, data availability statements, or supplementary materials included in this article.


