

Abstract
Background
Preterm infants may accumulate nutrient deficits leading to extrauterine growth restriction. Feeding preterm infants with nutrient‐enriched rather than standard formula might increase nutrient accretion and growth rates and might improve neurodevelopmental outcomes.
Objectives
To compare the effects of feeding with nutrient‐enriched formula versus standard formula on growth and development of preterm infants.
Search methods
We used the Cochrane Neonatal standard search strategy. This included electronic searches of the Cochrane Central Register of Controlled Trials (CENTRAL; 2018, Issue 11), MEDLINE, Embase, and the Cumulative Index to Nursing and Allied Health Literature (until November 2018), as well as conference proceedings, previous reviews, and clinical trials databases.
Selection criteria
Randomised and quasi‐randomised controlled trials that compared feeding preterm infants with nutrient‐enriched formula (protein and energy plus minerals, vitamins, or other nutrients) versus standard formula.
Data collection and analysis
We extracted data using the Cochrane Neonatal standard methods. Two review authors separately evaluated trial quality and extracted and synthesised data using risk ratios (RRs), risk differences, and mean differences (MDs). We assessed certainty of evidence at the outcome level using Grading of Recommendations Assessment, Development and Evaluation (GRADE) methods.
Main results
We identified seven trials in which a total of 590 preterm infants participated. Most participants were clinically stable preterm infants of birth weight less than 1850 g. Few participants were extremely preterm, extremely low birth weight, or growth restricted at birth. Trials were conducted more than 30 years ago, were formula industry funded, and were small with methodological weaknesses (including lack of masking) that might bias effect estimates. Meta‐analyses of in‐hospital growth parameters were limited by statistical heterogeneity. There is no evidence of an effect on time to regain birth weight (MD ‐1.48 days, 95% confidence interval (CI) ‐4.73 to 1.77) and low‐certainty evidence suggests that feeding with nutrient‐enriched formula increases in‐hospital rates of weight gain (MD 2.43 g/kg/d, 95% CI 1.60 to 3.26) and head circumference growth (MD 1.04 mm/week, 95% CI 0.18 to 1.89). Meta‐analysis did not show an effect on the average rate of length gain (MD 0.22 mm/week, 95% CI ‐0.70 to 1.13). Fewer data are available for growth and developmental outcomes assessed beyond infancy, and these do not show consistent effects of nutrient‐enriched formula feeding. Data from two trials did not show an effect on Bayley Mental Development Index scores at 18 months post term (MD 2.87, 95% CI ‐1.38 to 7.12; moderate‐certainty evidence). Infants who received nutrient‐enriched formula had higher Bayley Psychomotor Development Index scores at 18 months post term (MD 6.56. 95% CI 2.87 to 10.26; low‐certainty evidence), but no evidence suggested an effect on cerebral palsy (typical RR 0.79, 95% CI 0.30 to 2.07; 2 studies, 377 infants). Available data did not indicate any other benefits or harms and provided low‐certainty evidence about the effect of nutrient‐enriched formula feeding on the risk of necrotising enterocolitis in preterm infants (typical RR 0.72, 95% CI 0.41 to 1.25; 3 studies, 489 infants).
Authors' conclusions
Available trial data show that feeding preterm infants nutrient‐enriched (compared with standard) formulas has only modest effects on growth rates during their initial hospital admission. No evidence suggests effects on long‐term growth or development. The GRADE assessment indicates that the certainty of this evidence is low, and that these findings should be interpreted and applied with caution. Further randomised trials would be needed to resolve this uncertainty.
Plain language summary
Nutrient‐enriched formula for preterm infants
Review question
Does feeding preterm infants with nutrient‐enriched formula (extra energy and protein) compared with standard formula increase the rate of growth and improve development?
Background
Standard formula (designed for term infants) may not provide preterm infants with sufficient quantities of nutrients to support optimal growth and development. Nutrient‐enriched formula (containing extra protein and energy from carbohydrates or fat and other nutrients) has about 20% higher nutrient content than standard formula. Feeding preterm infants, particularly very preterm infants, with nutrient‐enriched formula might increase nutrient intake and growth rates, and might improve development.
Study characteristics
We found seven trials; most were small (involving 590 infants in total), and some were prone to bias.
Key results
Nutrient‐enriched versus standard formula for preterm infants does not reduce the time taken to regain birth weight but is associated with higher rates of weight gain and head growth (although not length gain) during neonatal unit stay after birth. Only limited data are available for growth and developmental outcomes assessed beyond infancy, and these do not show consistent effects. No evidence suggests other potential benefits or harms of nutrient‐enriched formulas, including effects on feeding or bowel problems.
Conclusions
Although available trial data show that nutrient‐enriched formulas increase growth rates of preterm infants during their initial hospital admission, they do not provide evidence of effects on longer‐term growth or development. Further randomised trials would be needed to resolve this uncertainty.
Summary of findings
Summary of findings for the main comparison. Nutrient‐enriched formula for preterm infants.
| Patient or population: preterm infants Setting: healthcare setting Intervention: nutrient‐enriched formula Comparison: standard formula | |||||
| Outcomes | Anticipated absolute effects* (95% CI) | Relative effect (95% CI) | Number of participants (studies) | Quality of the evidence (GRADE) | |
| Risk with standard formula | Risk with nutrient‐enriched formula | ||||
| Weight gain (g/kg/d) | Comparator | MD gain was 2.43 higher (1.60 to 3.26 higher) | ‐ | 440 (6 RCTs) | ⊕⊕⊝⊝ Lowa,b |
| Length gain (mm/week) | Comparator | MD gain was 0.22 mm/week higher (0.7 lower to 1.13 higher) | ‐ | 386 (5 RCTs) | ⊕⊕⊝⊝ Lowa,b |
| Head circumference gain (mm/week) | Comparator | MD gain was 1.04 mm/week higher (0.18 to 1.89 higher) | ‐ | 399 (5 RCTs) | ⊕⊕⊝⊝ Lowa,b |
| Mental Development Index (MDI) at 18 months | Comparator | Mean MDI was 2.81 higher (1.44 lower to 7.06 higher) | ‐ | 310 (2 RCTs) | ⊕⊕⊕⊝ Moderatea |
| Psychomotor Development Index (PDI) at 18 months | Comparator | Mean PDI was 6.56 more (2.87 to 10.26 more) | ‐ | 310 (2 RCT) | ⊕⊕⊝⊝ Lowa,b |
| Necrotising enterocolitis | Study population | RR 0.72 (0.41 to 1.25) | 489 (3 RCTs) | ⊕⊕⊝⊝ Lowa,c | |
| 112 per 1000 | 31 per 1000 (66 fewer to 28 more) | ||||
| *The risk in the intervention group (and its 95% confidence interval) is based on the assumed risk in the comparison group and the relative effect of the intervention (and its 95% CI). CI: confidence interval; MD: mean difference; RCT: randomised controlled trial; RR: risk ratio. | |||||
| GRADE Working Group grades of evidence. High certainty: we are very confident that the true effect lies close to that of the estimate of the effect. Moderate certainty: we are moderately confident in the effect estimate: the true effect is likely to be close to the estimate of the effect but may be substantially different. Low certainty: our confidence in the effect estimate is limited: the true effect may be substantially different from the estimate of the effect. Very low certainty: we have very little confidence in the effect estimate: the true effect is likely to be substantially different from the estimate of the effect. | |||||
aUncertainty about methods used to generate random sequence, conceal allocation, and mask assessments in trials.
bModerate to high heterogeneity.
cPost hoc exclusions in two trials.
Background
Description of the condition
Preterm infants (born before 37 weeks' gestation), especially very preterm infants (born before 32 weeks' gestation), have fewer nutrient reserves at birth than term infants and are subject to physiological and metabolic stresses that increase their nutrient needs. Recommended nutrient requirements for preterm infants based on intrauterine growth studies assume that the optimal rate of postnatal growth should be similar to that of uncompromised foetuses of an equivalent gestational age (Tsang 1993). However, these recommended levels of nutrient input and growth are rarely achieved. Most very preterm infants accumulate substantial energy, protein, mineral, and other nutrient deficits during their initial hospital stay (Embleton 2001; Horbar 2015). By the time they are ready to go home, typically at around 36 to 40 weeks' postmenstrual age, many infants are growth restricted relative to their term‐born peers (Clark 2003; Dusick 2003). Growth deficits, which can persist through childhood and adolescence, are associated with neurodevelopmental impairment and with poor cognitive and educational outcomes (Bracewell 2008; Cooke 2003; Farooqi 2006; Ford 2000; Hack 1991; Leppänen 2014; Trebar 2007). Preterm infants who have accumulated mineral deficits have higher levels of metabolic bone disease and slower skeletal growth compared with infants born at term. Some uncertainty remains about long‐term effects of such deficits on bone mass and health (Fewtrell 2011). Furthermore, there is concern that nutritional deficiency and growth restriction during early infancy may have consequences for long‐term metabolic and cardiovascular health (Embleton 2013; Lapillonne 2013).
Description of the intervention
Human breast milk is the recommended form of enteral nutrition for preterm infants (AAP 2012). When sufficient human breast milk is not available, an artificial formula, given as the sole form of enteral nutrition or as a supplement to human breast milk, may be used as an alternative (Klingenberg 2012). A variety of formulas, typically adapted from cow's milk, are available. These vary in energy, protein, and mineral content and can be categorised broadly as follows.
Standard (‘term') formulas based on the composition of mature breast milk; the typical energy content is 67 to 70 kCal/100 mL, the concentration of protein is about 1.4 g to 1.7 g/100 mL, and the calcium and phosphate content is about 50 mg/100 mL and 30 mg/100 mL, respectively.
Nutrient‐enriched (‘preterm') formulas, designed to provide nutrient intakes to match intrauterine accretion rates; these are energy enriched (typically to about 75 to 80 kCal/100 mL), protein enriched (2.0 to 2.4 g/100 mL) and variably enriched with minerals, vitamins, electrolytes, and trace elements (Hay 2017).
How the intervention might work
Feeding preterm infants formula enriched with energy, protein, minerals, and other nutrients may be expected to promote nutrient accretion and growth (increase in weight, length, and head circumference). High levels of nutrient intake during this critical period may be especially important for infants who are growth restricted or ‘small for gestation' at birth, are unable to consume large quantities of milk, show slow postnatal growth, or have additional nutritional and metabolic requirements (Agostoni 2010; Klein 2002).
However, formula with high nutrient density might interfere with gastric emptying and intestinal peristalsis, or might perturb the microbiome, resulting in enteral feed intolerance or increased risk of necrotising enterocolitis (Embleton 2017; Hancock 1984; Ramani 2013; Shulhan 2017; Siegel 1984). Nutrient‐enriched formula that is poorly tolerated may reduce intake and any putative benefit for growth and development. Furthermore, concern exists that rapid ‘catch‐up growth' with accelerated weight gain might be associated with altered fat distribution and related ‘programmed’ metabolic consequences that increase long‐term risks of insulin resistance and cardiovascular disease (Doyle 2004; Euser 2005; Euser 2008).
Why it is important to do this review
Given that early enteral nutrition strategies may affect growth and development in preterm infants, and that uncertainty exists about the balance between possible benefits and harms, this Cochrane Review aimed to detect, appraise, and synthesise evidence from randomised controlled trials (RCTs) to inform policy, practice, and research.
This review focuses on the effects of feeding preterm infants with nutrient‐enriched formula versus standard formula during initial hospitalisation after birth. Related Cochrane Reviews have assessed the effects of feeding preterm infants nutrient‐enriched formula versus standard formula after hospital discharge (Young 2016), and of providing multi‐nutrient fortification of human milk for feeding preterm infants (Brown 2016).
Objectives
To compare the effects of feeding with nutrient‐enriched formula versus standard formula on growth and development of preterm infants.
Methods
Criteria for considering studies for this review
Types of studies
RCTs or quasi‐RCTs. Quasi‐RCTs are trials that do not use a true method of randomisation and that allocate participants to the arms of the trial based on date of birth, hospital number, or another non‐random method.
Types of participants
Preterm infants (less than 37 weeks' gestation at birth) fed formula (exclusively or as a supplement to human breast milk) during birth hospitalisation.
Types of interventions
Nutrient‐enriched formula: both energy content > 72 kcal/100 mL and protein content > 1.7 g/100 mL
versus
Standard formula: both energy content ≤ 72 kcal/100 mL and protein content ≤ 1.7 g/100 mL
The formula could be fed as the sole diet or as a supplement to human breast milk. Infants in trial groups should have received similar care but not similar types of formula. The intervention should have been intended to continue for at least two weeks to allow measurable effects on growth.
Types of outcome measures
Primary outcomes
Growth
Time to regain birth weight and subsequent rates of weight gain, linear growth, head growth, or skinfold thickness growth up to six months post term
Long‐term growth: weight, height, or head circumference (or proportion of infants who remain below the 10th percentile for index population distribution, or both) assessed at intervals from six months post term
Neurodevelopment
Death or severe neurodevelopmental disability defined as any one or a combination of the following: non‐ambulant cerebral palsy, developmental quotient more than two standard deviations below the population mean, and blindness (visual acuity < 6/60) or deafness (any hearing impairment requiring or unimproved by amplification)
Neurodevelopmental scores in children aged at least 12 months, measured via validated assessment tools such as Bayley Scales of Infant and Toddler Development, Third Edition (Bayley III), main domains (cognitive, motor, language)
Cognitive and educational outcomes in children five years of age or older.
Necrotising enterocolitis
Necrotising enterocolitis confirmed at surgery or at autopsy or diagnosed by at least two of the following clinical features (Kliegman 1987).
Abdominal radiograph showing pneumatosis intestinalis or gas in the portal venous system or free air in the abdomen.
Abdominal distension with abdominal radiograph showing gaseous distension or frothy appearance of bowel lumen (or both).
Blood in stool.
Lethargy, hypotonia, or apnoea (or a combination of these).
Secondary outcomes
Duration of birth hospitalisation (days)
Feed intolerance during the trial intervention period that results in cessation of enteral feeding for longer than four hours
All‐cause mortality before hospital discharge
Measures of body composition (lean/fat mass) and growth parameters including z‐score for weight, length, and head circumference, skinfold thickness, body mass index, and proportion of infants who remain below the 10th percentile for the index population distribution of weight, length, or head circumference at 44 weeks' postmenstrual age and beyond
Measures of bone mineralization, such as serum alkaline phosphatase level, or bone mineral content assessed by dual energy X‐ray absorptiometry (DEXA) at 44 weeks' postmenstrual age and beyond
Measures of long‐term metabolic or cardiovascular health, including insulin resistance, obesity, diabetes, and hypertension
Search methods for identification of studies
We used the standard search strategy of Cochrane Neonatal.
Electronic searches
The search strategy was developed in Ovid MEDLINE and consisted of terms for preterm or low birthweight infants combined with terms for formula milk. The search was limited to RCTs using the sensitivity maximising version of the Cochrane Highly Sensitive Search Strategy for identifying randomised trials in MEDLINE (Lefebvre 2011). We applied no language or date limits. The MEDLINE search strategy was translated for use in the other databases searched (Appendix 1).
We searched the following databases.
MEDLINE (Ovid SP, 1946 to 9 November 2018).
Cochrane Central Register of Controlled Trials (CENTRAL, in the Cochrane Library; 2018, Issue 11).
Cumulative Index to Nursing and Allied Health Literature (CINAHL Plus) (EBSCO, 1982 to 12 November 2018).
Embase (Ovid SP, 1974 to 9 November 2018).
Maternity and Infant Care (Ovid SP, 1971 to 30 September 2018).
PubMed (1966 to 12 November 2018).
In addition, we searched ClinicalTrials.gov (http://clinicaltrials.gov/) and the World Health Organization (WHO) International Clinical Trials Registry Platform (ICTRP; www.who.int/ictrp/en/) on 16 November 2018 to identify ongoing and completed trials.
Searching other resources
We examined the references provided in studies identified as potentially relevant. We searched the reference lists of any articles selected for inclusion in this review to identify additional relevant articles. We searched the abstracts from annual meetings of the Pediatric Academic Societies (1993 to 2019), the European Society for Paediatric Research (1995 to 2019), the UK Royal College of Paediatrics and Child Health (2000 to 2019), and the Perinatal Society of Australia and New Zealand (2000 to 2019). We considered trials reported only as abstracts to be eligible if sufficient information was available from the trial report, or from contact with study authors, to fulfil the inclusion criteria.
Data collection and analysis
We used the standard methods of Cochrane Neonatal.
Selection of studies
We screened the title and abstract of all studies identified by the above search strategy, and two review authors (VW and JB) independently assessed the full articles for all potentially relevant trials. We discussed any disagreements until consensus was achieved. We excluded studies that did not meet the inclusion criteria and listed all studies excluded after full‐text assessment and reasons for their exclusion in the Characteristics of excluded studies table. The study selection process is illustrated in a PRISMA diagram (Figure 1), and study selection was managed using Rayyan (Ouzzani 2016).
1.
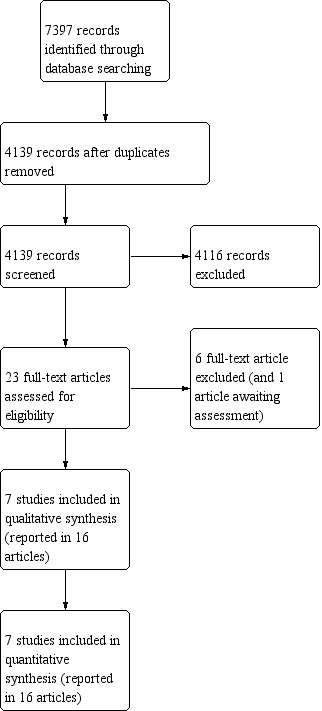
Study flow diagram.
Data extraction and management
Two review authors (VW and JB, or VW and WM) used Covidence to independently extract from each included study information on design, methods, participants, interventions, outcomes, and treatment effects(Veritas Health Innovation). We discussed any disagreements until we reached a consensus.
Assessment of risk of bias in included studies
Two review authors (VW and JB) used Covidence to independently assess risk of bias (low, high, or unclear) of all included trials using the Cochrane ‘Risk of bias’ tool for the following domains (Higgins 2017).
Sequence generation (selection bias).
Allocation concealment (selection bias).
Blinding of participants and personnel (performance bias).
Blinding of outcome assessment (detection bias).
Incomplete outcome data (attrition bias).
Selective reporting (reporting bias).
Any other bias.
We resolved disagreements by discussion or by consultation with a third review author (WM or NDE). We did not exclude trials on the basis of risk of bias. See Appendix 2 for a description of each domain.
Measures of treatment effect
We analysed treatment effects in individual trials and reported risk ratio (RR) and risk difference (RD) values for dichotomous data and mean difference (MD) values for continuous data, along with respective 95% confidence intervals (CIs). We planned to determine the number needed to treat for an additional beneficial outcome or the number needed to treat for an additional harmful outcome for analyses with a statistically significant difference in the RD.
Unit of analysis issues
The unit of analysis was the participating infant.
Dealing with missing data
Due to the age of the included studies (all published before 2000), we did not contact any original study investigators. We imputed missing standard deviations (SDs) using reported sample sizes and standard error values.
Assessment of heterogeneity
Two review authors (NDE and WM) assessed clinical heterogeneity, and we conducted meta‐analyses when both review authors agreed that study participants, interventions, and outcomes were similar.
We examined treatment effects of individual trials and heterogeneity between trial results by inspecting the forest plots. We calculated the I² statistic for each analysis to quantify inconsistency across studies and to describe the percentage of variability in effect estimates that may be due to heterogeneity rather than to sampling error. When we detected high levels of heterogeneity (I² > 75%), we explored possible sources (e.g. differences in study design, participants, or interventions; completeness of outcome assessments).
Assessment of reporting biases
We planned to inspect funnel plots for asymmetry if data from ten or more trials were included in a meta‐analysis.
Data synthesis
We used a fixed‐effect model for meta‐analyses.
Summary of findings and certainty of evidence
We assessed the certainty of the body of evidence for the main comparisons at the outcome level using the GRADE approach (Schünemann 2013; see Appendix 3). Two review authors (JB and WM) independently assessed the certainty of the evidence for outcomes identified as critical or important for clinical decision‐making: growth, development, and necrotising enterocolitis.
We considered trial evidence as high certainty but downgraded this by one level for serious (or by two levels for very serious) limitations based upon design (risk of bias), consistency across studies, directness, precision of estimates, and presence of publication bias. We used the GRADEpro Guideline Development Tool (GDT) to create a ‘Summary of findings’ table to report the certainty of the evidence (GRADEpro GDT 2015).
Subgroup analysis and investigation of heterogeneity
When data were available, we planned subgroup analyses of:
trials in which infants received formula only versus those where formula could be given as a supplement to breast milk;
extremely preterm (< 28 weeks' gestation) infants versus infants born at 29 to 36 weeks' gestation; and
infants with birth weight below the 10th percentile for the reference population (‘small for gestation') versus infants with birth weight at or above the 10th percentile (‘appropriate for gestation').
Sensitivity analysis
We planned sensitivity analyses to determine whether our findings are affected by including only studies reporting adequate methods (low risk of bias), defined as adequate randomisation and allocation concealment, blinding of intervention and measurement, and less than 10% loss to follow‐up.
Results
Description of studies
Results of the search
See Figure 1.
We included seven trials (Kashyap 1986; Kulkarni 1984; Lucas 1989a; Lucas 1989b; Siripoonya 1989; Thom 1984; Yesilipek 1992).
One trial report is awaiting assessment (Costa 1996).
We did not identify any ongoing trials.
We excluded six full‐text reports (Atkinson 1981; Duman 2000; Haque 1987; Hering 1987; Pridham 1999; Yin 2004).
Included studies
Included trials were undertaken during the 1970s and 1980s by investigators in neonatal units in the UK, the USA, Turkey, Thailand, and South Africa (see Characteristics of included studies). Five of these trials were conducted at single centres (Kashyap 1986; Kulkarni 1984; Siripoonya 1989; Thom 1984; Yesilipek 1992). Two trials were conducted across two centres (Lucas 1989a; Lucas 1989b).
Participants
In total, 590 infants participated in the included trials (range, 22 to 264). Of these, 444 infants (> 75%) participated in the two largest trials (Lucas 1989a; Lucas 1989b). Most participants were clinically stable preterm infants of birth weight less than 1850 g. Few participants were extremely preterm, extremely low birth weight, or growth restricted. The trials, in general, excluded from participation infants with congenital anomalies and those with respiratory, gastrointestinal, or neurological problems.
Interventions
Six trials assessed the use of nutrient‐enriched versus standard formula as the sole diet; one assessed formula use supplemental to human milk (Lucas 1989b). Formulas were typically commenced when infants were assessed as being clinically stable and able to tolerate enteral feeds. Trial participants continued to receive the intervention or control formula for several weeks or until they reached a specified weight (typically about 2 kg). Most trials stipulated a target volume of milk intake for both groups (typically 150 to 180 mL/kg/d).
Outcomes
Most of the trials aimed to assess effects of the intervention on growth rates during birth hospitalisation (time to regain birth weight and rate of gain in weight, length, or head circumference while in hospital or until reaching a specified weight). One trial's primary objective was to assess effects on bone mineralization (Kulkarni 1984). Two trials reported neurodevelopmental or long‐term growth outcomes (Lucas 1989a; Lucas 1989b). These trials measured participants' blood pressure and assessed insulin resistance in a subset (< 20%) of the trial cohort aged 13 to 16 years.
Excluded studies
We excluded five studies following review of the full text of the report (Atkinson 1981; Duman 2000; Haque 1987; Hering 1987; Pridham 1999; see Characteristics of excluded studies).
Risk of bias in included studies
Quality assessments are detailed in the Characteristics of included studies table and are illustrated in Figure 2.
2.
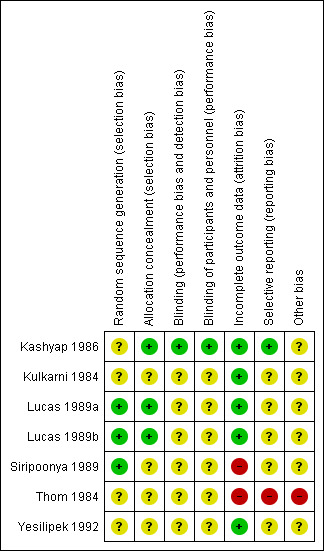
Risk of bias summary: review authors' judgements about each risk of bias item for each included study.
Overall, we found risk of bias difficult to assess because reporting was limited. Consequently, we scored most items as having unclear risk.
Allocation
Two trial reports described methods used to ensure adequate sequence generation (random numbers table) and allocation concealment (sealed, numbered envelopes); we assessed these trials as being at low risk of bias (Lucas 1989a; Lucas 1989b). The other trials did not report methods of sequence generation or allocation concealment used (unclear risk of bias)
Blinding
One trial report described masking of study personnel and parents or caregivers to formula types; we assessed this trial as being at low risk of bias (Kashyap 1986). The other trial reports did not state whether investigators or staff were masked (unclear risk of bias). In the two trials that assessed longer‐term (post infancy) growth and neurodevelopmental outcomes, assessors were unaware of the intervention group to which infants belonged (Lucas 1989a; Lucas 1989b).
Incomplete outcome data
Most trials reported complete follow‐up for the in‐hospital outcomes assessment; we assessed them as being at low risk of attrition bias. In three trials, infants who developed complications (5% to 10% of the total enrolled) were withdrawn from the study; therefore in‐hospital growth data for these infants were not presented. In the two trials that reported data for long‐term outcomes, more than 80% of participants were assessed for growth and neurodevelopmental parameters (Lucas 1989a; Lucas 1989b). These trials assessed measures of cardiovascular and metabolic health in a subset (< 20%) of study participants aged 13 to 16 years. It is unclear whether or how participants were selected to undergo these assessments.
Selective reporting
We were unable to assess reliably whether selective reporting occurred as we did not have protocols or other indicators of prespecified outcomes for any of the included trials.
Other potential sources of bias
The manufacturer of the formula being tested funded six trials (Kashyap 1986; Kulkarni 1984; Lucas 1989a; Lucas 1989b; Siripoonya 1989; Thom 1984). One trial did not report the source of funding (Yesilipek 1992).
Effects of interventions
See: Table 1
Primary outcomes
1. Days to regain birth weight (Outcome 1.1)
Three trials reported data (Kashyap 1986; Kulkarni 1984; Siripoonya 1989). Meta‐analysis did not show an effect: MD 1.48, 95% CI ‐4.73 to 1.77; I² = 57% (Analysis 1.1).
1.1. Analysis.
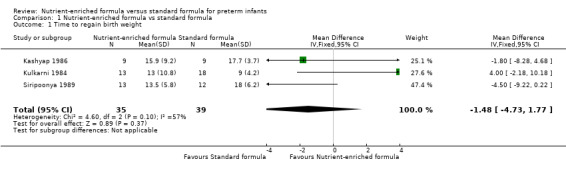
Comparison 1 Nutrient‐enriched formula vs standard formula, Outcome 1 Time to regain birth weight.
2. Rate of weight gain (Outcome 1.2)
Six trials reported data (Kashyap 1986; Lucas 1989a; Lucas 1989b; Siripoonya 1989; Thom 1984; Yesilipek 1992). Two of these trials did not report SD values (Siripoonya 1989; Thom 1984). We imputed these from the trials with the nearest sample size (Higgins 2017).
Meta‐analysis showed that weight gain was faster among infants fed nutrient‐enriched formula: MD 2.43 g/kg/d, 95% CI 1.60 to 3.26; I² = 46% (Analysis 1.2; Figure 3).
1.2. Analysis.
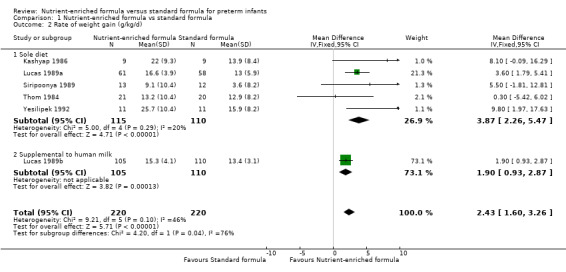
Comparison 1 Nutrient‐enriched formula vs standard formula, Outcome 2 Rate of weight gain (g/kg/d).
3.
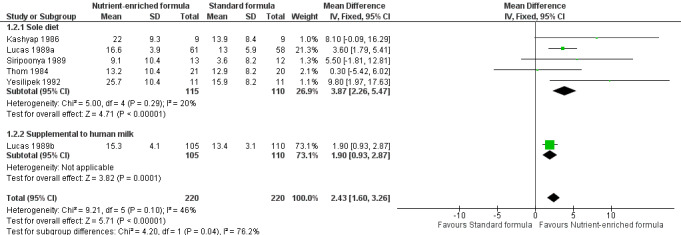
Forest plot of comparison: 1 Nutrient‐enriched formula vs standard formula, outcome: 1.2 Rate of weight gain (g/kg/d).
Kulkarni 1984 did not report numerical data but stated that there was no difference in the average daily rate of weight gain.
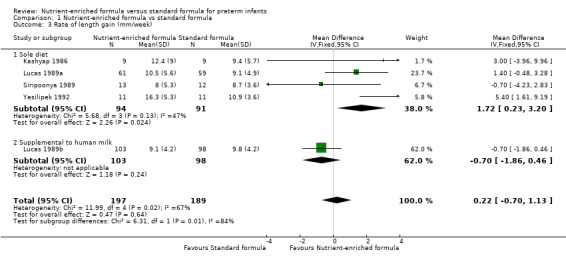
3. Rate of length gain (Outcome 1.3)
Five trials reported numerical data (Kashyap 1986; Lucas 1989a; Lucas 1989b. Siripoonya 1989; Yesilipek 1992). Siripoonya 1989 did not report SD values, so we imputed these from the trial with the nearest sample size.
Meta‐analysis did not show a statistically significant effect: MD 0.22 mm/week, 95% CI ‐0.70 to 1.13; I² = 67% (Analysis 1.3; Figure 4).
1.3. Analysis.
Comparison 1 Nutrient‐enriched formula vs standard formula, Outcome 3 Rate of length gain (mm/week).
4.
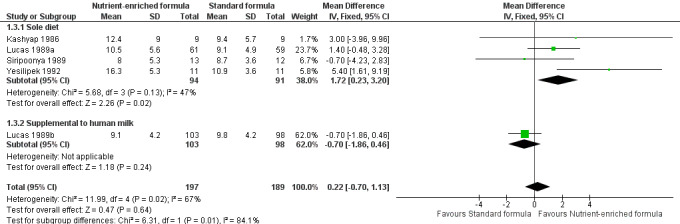
Forest plot of comparison: 1 Nutrient‐enriched formula vs standard formula, outcome: 1.3 Rate of length gain (mm/week).
Thom 1984 did not report numerical data but stated that there was no difference in the average daily rate of length gain.
Three trials did not report rate of length gain (Kulkarni 1984; Lucas 1989a; Lucas 1989b).
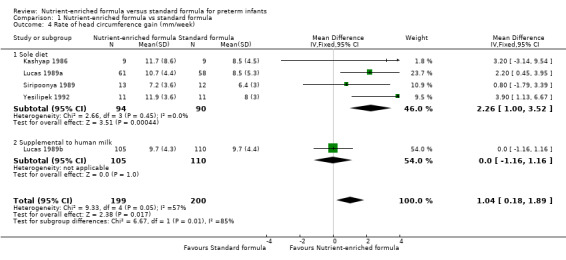
4. Rate of head circumference gain (Outcome 1.4)
Five trials reported data (Kashyap 1986; Lucas 1989a; Lucas 1989b; Siripoonya 1989; Yesilipek 1992). Siripoonya 1989 did not report SD values. We imputed these from Yesilipek 1992, the trial with the nearest sample size.
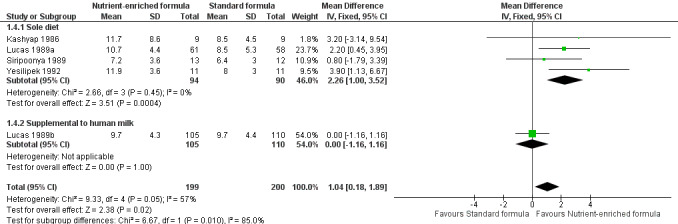
Meta‐analysis showed that head circumference growth was faster among infants fed nutrient‐enriched formula: MD 1.04 mm/week, 95% CI 0.18 to 1.89; I² = 57% (Analysis 1.4; Figure 5).
1.4. Analysis.
Comparison 1 Nutrient‐enriched formula vs standard formula, Outcome 4 Rate of head circumference gain (mm/week).
5.
Forest plot of comparison: 1 Nutrient‐enriched formula vs standard formula, outcome: 1.4 Rate of head circumference gain (mm/week).
Two trials did not report rate of head circumference gain (Kulkarni 1984; Thom 1984).
5. Rate of skinfold thickness gain (Outcome 1.5 to 1.6)
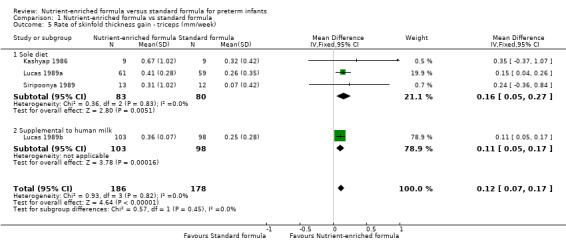
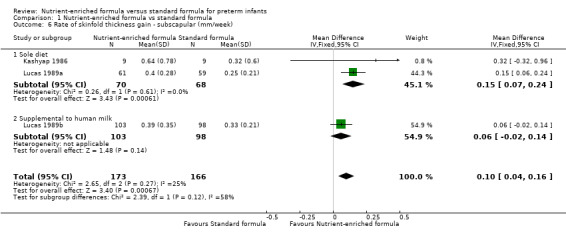
Four trials reported numerical data for triceps skinfold thickness gain (Kashyap 1986; Lucas 1989a; Lucas 1989b; Siripoonya 1989). Siripoonya 1989 did not report SD values. We imputed these from Kashyap 1986. Three trials reported data for subscapular skinfold thickness gain (Kashyap 1986; Lucas 1989a; Lucas 1989b).
Infants in the nutrient‐enriched formula group had statistically significant higher rates of:
triceps skinfold thickness gain: MD 0.12 mm/week, 95% CI 0.07 to 0.17 (Analysis 1.5); and
subscapular skinfold thickness gain: MD 0.10 mm/week, 95% CI 0.04 to 0.16 (Analysis 1.6).
1.5. Analysis.
Comparison 1 Nutrient‐enriched formula vs standard formula, Outcome 5 Rate of skinfold thickness gain ‐ triceps (mm/week).
1.6. Analysis.
Comparison 1 Nutrient‐enriched formula vs standard formula, Outcome 6 Rate of skinfold thickness gain ‐ subscapular (mm/week).
6. Long‐term growth (Outcome 1.7 to 1.16)
Two trials reported growth parameters beyond six months post term (Lucas 1989a; Lucas 1989b).
Meta‐analyses showed no statistically significant differences in average:
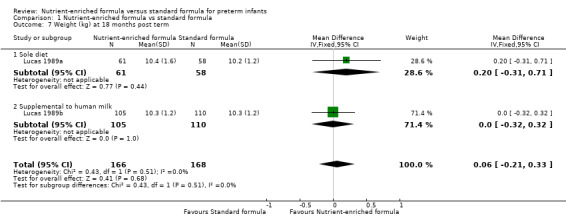
weight at 18 months (MD 0.06 kg, 95% CI ‐0.21 to 0.33; Analysis 1.7) or at 7.5 to 8 years post term (MD 0.30 kg, 95% CI ‐0.55 to 1.15; Analysis 1.8);
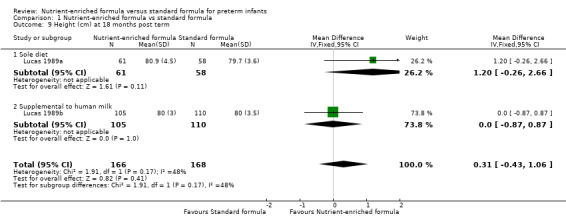
height at 18 months (MD 0.31 cm, 95% CI ‐0.43 to 1.06; Analysis 1.9) or 7.5 to 8 years post term (MD 0.93 cm, 95% CI ‐0.30 to 2.16; Analysis 1.10);
head circumference at 18 months (MD 0.09 cm, 95% CI ‐0.26 to 0.43; Analysis 1.11) or 7.5 to 8 years post term (MD ‐0.12 cm, 95% CI ‐0.45 to 0.21; Analysis 1.12);
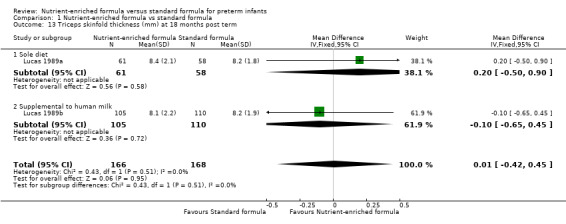
triceps skinfold thickness at 18 months (MD 0.01 mm, 95% CI ‐0.42 to 0.45; Analysis 1.13) or 7.5 to 8 years post term (MD ‐0.16 mm, 95% CI ‐0.91 to 0.60; Analysis 1.14); or
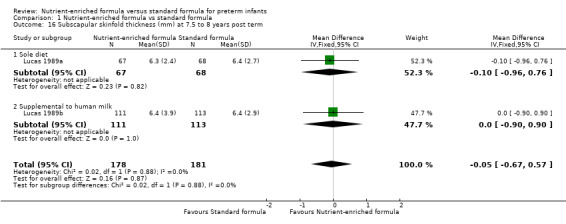
subscapular skinfold thickness at 18 months (MD ‐0.14 mm, 95% CI ‐0.40 to 0.13; Analysis 1.15) or 7.5 to 8 years post term (MD ‐0.05 mm, 95% CI ‐0.67 to 0.57; Analysis 1.16).
1.7. Analysis.
Comparison 1 Nutrient‐enriched formula vs standard formula, Outcome 7 Weight (kg) at 18 months post term.
1.8. Analysis.
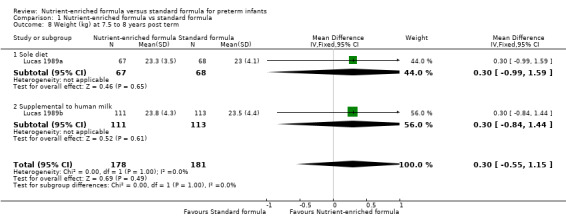
Comparison 1 Nutrient‐enriched formula vs standard formula, Outcome 8 Weight (kg) at 7.5 to 8 years post term.
1.9. Analysis.
Comparison 1 Nutrient‐enriched formula vs standard formula, Outcome 9 Height (cm) at 18 months post term.
1.10. Analysis.
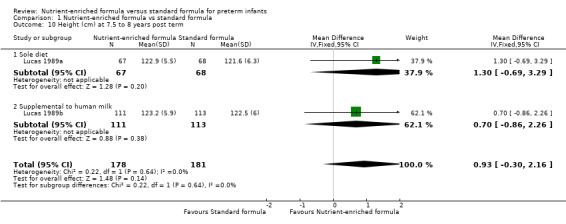
Comparison 1 Nutrient‐enriched formula vs standard formula, Outcome 10 Height (cm) at 7.5 to 8 years post term.
1.11. Analysis.
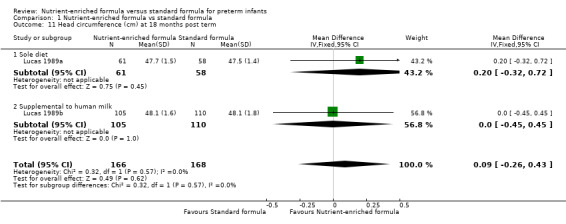
Comparison 1 Nutrient‐enriched formula vs standard formula, Outcome 11 Head circumference (cm) at 18 months post term.
1.12. Analysis.
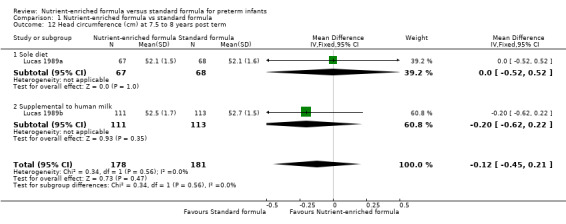
Comparison 1 Nutrient‐enriched formula vs standard formula, Outcome 12 Head circumference (cm) at 7.5 to 8 years post term.
1.13. Analysis.
Comparison 1 Nutrient‐enriched formula vs standard formula, Outcome 13 Triceps skinfold thickness (mm) at 18 months post term.
1.14. Analysis.
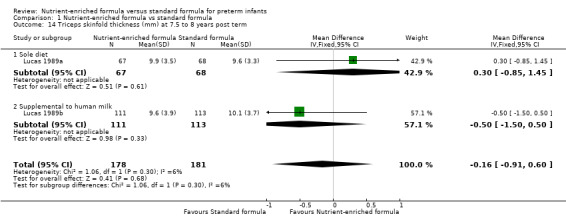
Comparison 1 Nutrient‐enriched formula vs standard formula, Outcome 14 Triceps skinfold thickness (mm) at 7.5 to 8 years post term.
1.15. Analysis.
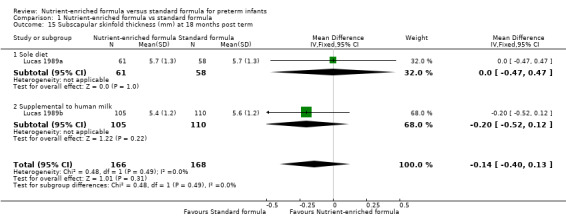
Comparison 1 Nutrient‐enriched formula vs standard formula, Outcome 15 Subscapular skinfold thickness (mm) at 18 months post term.
1.16. Analysis.
Comparison 1 Nutrient‐enriched formula vs standard formula, Outcome 16 Subscapular skinfold thickness (mm) at 7.5 to 8 years post term.
7. Neurodevelopmental outcomes (Outcome 1.17 to 1.18)
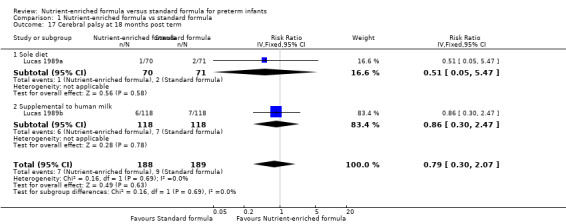
Two trials reported the number of infants with a diagnosis of cerebral palsy when assessed at age 18 months post term follow‐up assessment (Lucas 1989a; Lucas 1989b). Meta‐analysis did not show a statistically significant difference: typical RR 0.79, 95% CI 0.30 to 2.07; I² = 0% (Analysis 1.17).
1.17. Analysis.
Comparison 1 Nutrient‐enriched formula vs standard formula, Outcome 17 Cerebral palsy at 18 months post term.
None of the trials reported blindness or deafness as an outcome.
Two trials reported neurodevelopmental outcomes assessed via validated tools (Lucas 1989a; Lucas 1989b). Meta‐analyses did not show a difference in:
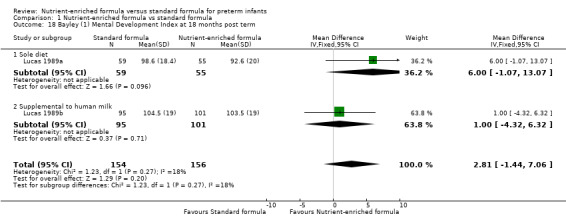
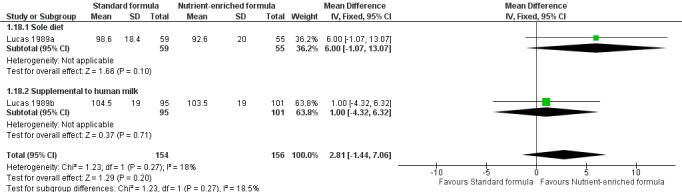
Bayley Mental Development Index (MDI) scores at 18 months post term: MD 2.87, 95% CI ‐1.38 to 7.12; I² = 15% (Analysis 1.18; Figure 6); or
Wechsler Revised Intelligence Scale for Children verbal, performance, and overall scores at 7.5 to 8 years post term (Analysis 1.19).
1.18. Analysis.
Comparison 1 Nutrient‐enriched formula vs standard formula, Outcome 18 Bayley (1) Mental Development Index at 18 months post term.
6.
Forest plot of comparison: 1 Nutrient‐enriched formula vs standard formula, outcome: 1.18 Bayley (1) Mental Development Index at 18 months post term.
1.19. Analysis.
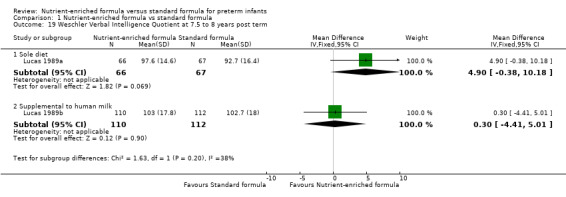
Comparison 1 Nutrient‐enriched formula vs standard formula, Outcome 19 Weschler Verbal Intelligence Quotient at 7.5 to 8 years post term.
Meta‐analysis showed a statistically significantly higher score in the nutrient‐enriched formula‐fed group for:
Bayley Psychomotor Development Index (PDI) at 18 months post term: MD 6.56, 95% CI 2.87 to 10.26; I² = 91% (Analysis 1.18; Figure 6).
8. Necrotising enterocolitis (Outcome 1.22)
Three trials reported data (Lucas 1989a; Lucas 1989b; Thom 1984).
Meta‐analysis did not show a statistically significant effect: typical RR 0.72, 95% CI 0.41 to 1.25; I² = 18%; RD ‐0.01, 95% CI ‐0.06 to 0.04 (Analysis 1.23).
1.23. Analysis.
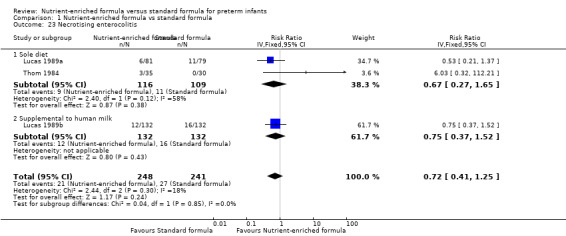
Comparison 1 Nutrient‐enriched formula vs standard formula, Outcome 23 Necrotising enterocolitis.
Secondary outcomes
9. Duration of birth hospitalisation (Outcome 1.23)
One trial reported numerical data (Kulkarni 1984). There was no statistically significant difference in duration of hospitalisation (Analysis 1.24).
1.24. Analysis.
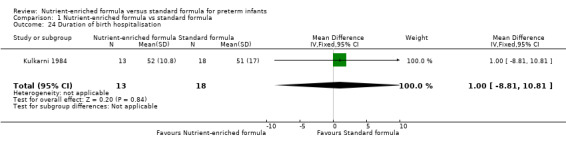
Comparison 1 Nutrient‐enriched formula vs standard formula, Outcome 24 Duration of birth hospitalisation.
11. Feed intolerance
This outcome was not reported by any of the trials.
12. All‐cause mortality (Outcome 1.24)
Two trials reported all‐cause mortality (Lucas 1989a; Lucas 1989b). These trials reported mortality until 18 months post term. Because it is likely that most mortality in this population occurred before hospital discharge, we made a consensus decision to include the data.
Neither trial nor a meta‐analysis showed a statistically significant difference: typical RR 1.12, 95% CI 0.65 to 1.93; I² = 0%; RD 0.01, 95% CI ‐0.05 to 0.07 (Analysis 1.25).
1.25. Analysis.
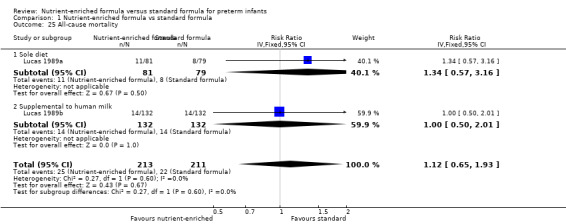
Comparison 1 Nutrient‐enriched formula vs standard formula, Outcome 25 All‐cause mortality.
13. Measures of body composition (Outcome 1.25 to 1.27)
Two trials reported body mass index on long‐term follow‐up (Lucas 1989a; Lucas 1989b). Neither trial nor a meta‐analysis showed a statistically significant difference at:
18 months post term (Analysis 1.26); nor
7.5 to 8 years (Analysis 1.27).
1.26. Analysis.
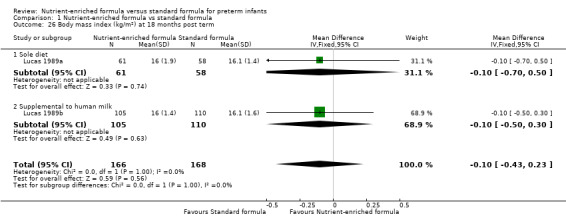
Comparison 1 Nutrient‐enriched formula vs standard formula, Outcome 26 Body mass index (kg/m²) at 18 months post term.
1.27. Analysis.
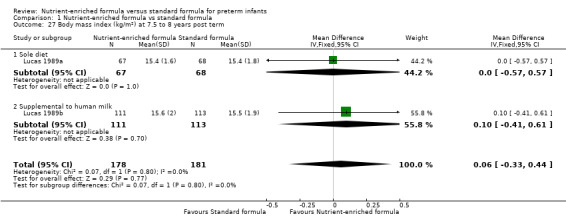
Comparison 1 Nutrient‐enriched formula vs standard formula, Outcome 27 Body mass index (kg/m²) at 7.5 to 8 years post term.
Two trials reported the waist‐to‐hip ratio at 7.5 to 8 years. Neither trial nor a meta‐analysis showed a statistically significant difference (Analysis 1.28).
1.28. Analysis.
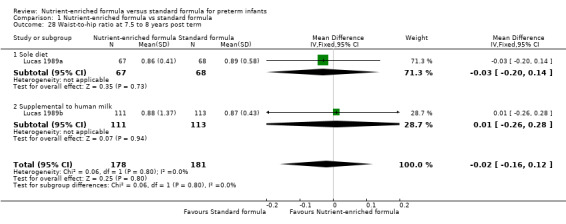
Comparison 1 Nutrient‐enriched formula vs standard formula, Outcome 28 Waist‐to‐hip ratio at 7.5 to 8 years post term.
14. Measures of bone mineralization (Outcome 1.29 to 1.30)
Two trials reported serum alkaline phosphatase levels after four weeks of the trial intervention (Kashyap 1986; Kulkarni 1984). Meta‐analysis did not show a statistically significant difference (Analysis 1.29).
1.29. Analysis.
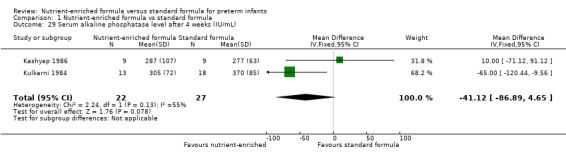
Comparison 1 Nutrient‐enriched formula vs standard formula, Outcome 29 Serum alkaline phosphatase level after 4 weeks (IU/mL).
One trial reported bone mineral content assessed by DEXA at 8 to 12 years (Lucas 1989a). Analyses did not show any statistically significant differences in lumbar spine, femoral neck, radius, or whole body bone mineral content (Analysis 1.30).
1.30. Analysis.
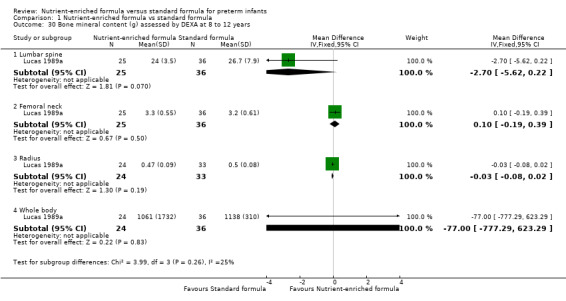
Comparison 1 Nutrient‐enriched formula vs standard formula, Outcome 30 Bone mineral content (g) assessed by DEXA at 8 to 12 years.
15. Measures of long‐term metabolic or cardiovascular health
Two trials reported mean diastolic and systolic arterial blood pressure at ages 13 to 16 years for a subset (about 20% of surviving infants) of the trial cohort (Lucas 1989a; Lucas 1989b). The report stated that there were no statistically significant differences between groups but did not provide trial‐specific data for meta‐analyses.
Two trials reported plasma glucose, insulin, and proinsulin levels at ages 13 to 16 years for a subset (about 20%) of the trial cohort (Lucas 1989a; Lucas 1989b). The report stated that there were no statistically significant differences between groups but did not provide trial‐specific data for meta‐analyses.
Subgroup analyses
Nutrient‐enriched or standard formula as sole diet or supplemental to human milk
Six trials compared feeding with formula as a sole diet (Kashyap 1986; Kulkarni 1984; Lucas 1989a; Siripoonya 1989; Thom 1984; Yesilipek 1992). One trial compared feeding with formula as a supplement to breast milk (Lucas 1989b). Analyses showed significant subgroup effects in favour of sole diet for:
rate of head circumference gain (mm/week): test for subgroup differences: Chi² = 4.22, df = 1 (P = 0.04), I² = 76.3% (Analysis 1.4); and
Bayley Psychomotor Development Index at 18 months: test for subgroup differences: Chi² = 11.59, df = 1 (P = 0.0007), I² = 91.4% (Analysis 1.20).
1.20. Analysis.
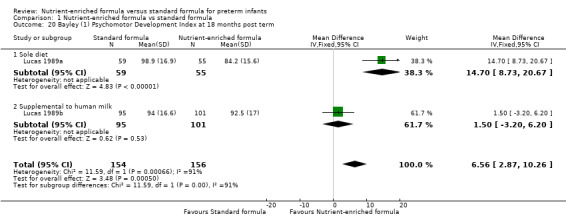
Comparison 1 Nutrient‐enriched formula vs standard formula, Outcome 20 Bayley (1) Psychomotor Development Index at 18 months post term.
Extremely preterm (< 28 weeks' gestation) infants versus infants born at 29 to 36 weeks' gestation
Subgroup data were not available.
Infants with birth weight < 10th percentile for reference population versus infants with birth weight ≥ 10th percentile
Subgroup data were not available.
Sensitivity analysis
We were unable to undertake planned sensitivity analyses to determine whether findings are affected by including only studies using adequate methods (low risk of bias) as no trial fulfilled the prespecified criteria (adequate randomisation and allocation concealment, blinding of intervention and measurement, and < 10% loss to follow‐up).
Discussion
Summary of main results
We included seven RCTs in which a total of 590 preterm infants participated. Meta‐analyses show that infants who receive nutrient‐enriched formula have higher in‐hospital rates of weight gain and head growth (although not in gain in length) than infants who receive standard formula. The effect on rate of weight gain is similar in trials that supplied formula as a sole diet and in the trial that supplied formula supplemental to human milk. A prespecified subgroup analysis shows that the effect on rate of head circumference growth was greater in trials that provided formula as the sole diet than in the trial of supplemental formula use. Follow‐up of infants who participated in two of the largest trials did not show any effects on long‐term growth nor on neurodevelopmental outcomes, with the exception of a significantly higher score for the Bayley Psychomotor Development Index (PDI) in one trial (Lucas 1989a).
Overall completeness and applicability of evidence
These findings should be interpreted and applied with caution. All trials were conducted more than 30 years ago. Most participants were stable preterm infants of low birth weight, but a few were extremely preterm or of extremely low birth weight, limiting the applicability of findings to the population at highest risk of postnatal growth restriction secondary to suboptimal nutrient intake. Although meta‐analysis shows that nutrient‐enriched formula increases the in‐hospital rate of weight gain, the effect size is modest. The average daily rate of weight gain is about 2.5 g/kg higher among infants fed nutrient‐enriched versus standard formula (about 75 g per month for a 1‐kg infant).
Meta‐analyses of growth outcomes showed moderate to high levels of statistical heterogeneity that were not explained by major differences in trial design or conduct. Participants in these trials were similar (most were stable preterm infants). Although different trials used a range of commercially prepared "preterm" formulas, these contained similar levels of energy (about 80 kcal/100 mL) and protein (> 2.0 g/100 mL) plus proportionate supplements of minerals, vitamins, and trace elements. These levels of energy and protein, however, are towards the lower bounds of current recommended intakes needed to match intrauterine accretion (based on receiving about 150 mL/kg/d of milk), and this is a possible explanation for the modest effect of the intervention on in‐hospital growth parameters. These findings are consistent with those of another Cochrane Review, which showed that human milk‐fed preterm infants who received milk fortified with extra energy and protein (to similar total levels as nutrient‐enriched formula) gained weight at about 1.8 g/kg/d faster than infants who received unfortified breast milk (Brown 2016).
As well as uncertainty about the importance of these effects on in‐hospital growth rates, uncertainty remains about their long‐term impact on growth and development. The two trials that reported data on outcomes beyond infancy did not show differences in any growth parameters when assessed at 18 months and at 7.5 to 8 years. Similarly, neurodevelopmental assessments, which were completed in more than 80% of trial participants at 18 months, did not show evidence of effects on cognitive outcomes. Infants who received nutrient‐enriched formula as a sole diet, however, had higher scores for psychomotor outcomes assessed at 18 months (Lucas 1989a). The importance of this finding is uncertain given that the predictive value of the Bayley Scales for later development of very preterm infants is low, with the Bayley Psychomotor Scale explaining 12% of later motor functioning (Luttikhuizen 2013).
Meta‐analysis did not indicate that feeding with nutrient‐enriched formula has important effects on the risk of necrotising enterocolitis. However, the risk of developing necrotising enterocolitis was reported in only three of the seven trials, and the upper bound of the 95% confidence interval (CI) does not exclude an increase in risk up to 25% (Lucas 1989a; Lucas 1989b; Thom 1984). In two trials, infants who developed necrotising enterocolitis were excluded from ongoing participation (post randomisation) but group‐specific data were not available (Kashyap 1986; Kulkarni 1984).
A final major limitation of this review is that most included trials were undertaken at healthcare facilities in high‐income countries, and none were conducted in community settings or in low‐income countries. Reported evidence therefore may be of limited use to inform care practice in the resource‐limited settings where most preterm and low birth weight infants are cared for globally (Imdad 2013).
Quality of the evidence
Using GRADE methods, we assessed the quality of the evidence as low or moderate for the prespecified outcomes (Table 1). The trials exhibited various weaknesses in methodological quality, specifically regarding allocation concealment methods and lack of masking in most. Parents, caregivers, clinicians, and investigators were likely to have been aware of the treatment group to which infants had been allocated, and this knowledge may have affected some care practices or investigation strategies, including thresholds for other interventions and investigations. Most meta‐analyses showed evidence of moderate to high heterogeneity, and pooled estimates of effect had wide 95% CIs.
Potential biases in the review process
It is possible that our findings were subject to publication and other reporting biases, including greater availability of numerical data for inclusion in meta‐analyses from trials that reported statistically significant or clinically important effects. This is important given that six of the included trials were funded or supported by manufacturers of the formulas being assessed (one trial did not report the source of funding or support). Some concern exists that formula manufacturers may selectively promote study findings from trials of specialist formulas as part of a marketing strategy that subverts UNICEF Baby Friendly Initiative regulations (Cleminson 2015; WHO 2018).
We attempted to minimise the threat of publication bias by screening the reference lists of included trials and related reviews and by searching the proceedings of the major international perinatal conferences to identify trial reports that are not yet published in full form in academic journals. However, we cannot be sure whether other trials have been undertaken but not reported, and concern remains that such trials are less likely than published trials to have detected statistically significant or clinically important effects. The meta‐analyses that we performed did not include sufficient trials to explore symmetry of funnel plots as a means of identifying possible publication or reporting bias.
Authors' conclusions
Implications for practice.
This review provides low‐certainty evidence that feeding preterm infants with nutrient‐enriched formula compared with standard formula is associated with modest short‐term increases in weight gain and head growth. These short‐term gains in growth do not appear to lead to important long‐term effects on growth or development. We did not show an increase in the risk of adverse outcomes including necrotising enterocolitis among infants who received nutrient‐enriched formula, although the total number of infants studied was small and the data that could be abstracted from published studies were few.
Implications for research.
Given the potential for nutrient‐enriched formula feeding to affect important outcomes in preterm infants, this intervention merits further assessment. As this practice is already widely established and accepted in many neonatal units (particularly in high‐income countries), it is important for researchers to determine whether families and clinicians would support a trial of this intervention. Trials should be powered to detect important effects on growth rates, as well as potential adverse consequences, during infancy and beyond. Trials should attempt to ensure that caregivers and assessors are masked to the intervention. Although this goal is more easily achievable for longer‐term assessments, it is also important for ascertainment of adverse events, such as feeding intolerance and necrotising enterocolitis, when the threshold for investigation or diagnosis may be affected by knowledge of the intervention.
What's new
| Date | Event | Description |
|---|---|---|
| 2 August 2019 | Amended | Declaration of interest updated for Dr. Nicholas D Embleton. |
History
Protocol first published: Issue 2, 2003 Review first published: Issue 7, 2019
| Date | Event | Description |
|---|---|---|
| 20 March 2019 | Amended | Protocol rewritten by new review author team to update and supersede Simmer 2003 |
Acknowledgements
We thank Melissa Harden, Information Specialist, for developing the electronic search strategy.
The methods section of this protocol is based on a standard template used by Cochrane Neonatal.
Appendices
Appendix 1. Electronic search strategy
MEDLINE(R) and Epub Ahead of Print, In‐Process & Other Non‐Indexed Citations and Daily
Ovid SP http://ovidsp.ovid.com/
1946 to November 09, 2018
Searched on: 12th November 2018
Records retrieved: 1621
The Cochrane Highly Sensitive Search Strategy for identifying randomised trials in MEDLINE (sensitivity‐maximizing version) was used to limit retrieval to clinical trials (lines 23‐32) (Lefebvre 2011).
1 exp Infant, Premature/ (51379)
2 exp Infant, Low Birth Weight/ (31813)
3 Premature Birth/ (11445)
4 (preterm or preterms or pre term or pre terms).ti,ab. (66255)
5 (preemie$ or premie or premies).ti,ab. (152)
6 prematur$.ti,ab. (132614)
7 (low adj3 (birthweight$ or birth weight$)).ti,ab. (31857)
8 (lbw or vlbw or elbw).ti,ab. (7551)
9 or/1‐8 (220728)
10 Infant Formula/ (3966)
11 formula$.ti,ab. (279507)
12 artificial milk.ti,ab. (205)
13 or/10‐12 (280600)
14 Nutriprem.ti,ab. (3)
15 Enfamil premature.ti,ab. (5)
16 Similac special care.ti,ab. (25)
17 Aptamil preterm.ti,ab. (0)
18 Good Start premature.ti,ab. (0)
19 Preemie SMA.ti,ab. (4)
20 or/14‐19 (34)
21 13 or 20 (280603)
22 9 and 21 (4416)
23 randomized controlled trial.pt. (471154)
24 controlled clinical trial.pt. (92744)
25 randomized.ab. (426145)
26 placebo.ab. (193103)
27 drug therapy.fs. (2061284)
28 randomly.ab. (300071)
29 trial.ab. (444246)
30 groups.ab. (1850065)
31 or/23‐30 (4315602)
32 exp animals/ not humans/ (4513797)
33 31 not 32 (3730894)
34 22 and 33 (1621)
Key
/ = indexing term (MeSH heading)
exp = exploded MeSH heading
$ = truncation
.ti,ab. = terms in either title or abstract fields
adj3 = terms within three words of each other (any order)
.pt.= terms in the publication type field
.fs.= floating subheading
Cochrane Central Register of Controlled Trials (CENTRAL)
Wiley http://onlinelibrary.wiley.com/
Issue 11 of 12, November 2018
Searched on: 13th November 2018
Records retrieved: 1171
#1 MeSH descriptor: [Infant, Premature] explode all trees 3394
#2 MeSH descriptor: [Infant, Low Birth Weight] explode all trees 2040
#3 MeSH descriptor: [Premature Birth] this term only 1028
#4 (preterm or preterms or pre next term or pre next terms):ti,ab,kw 9992
#5 (preemie* or premie or premies):ti,ab,kw 34
#6 prematur*:ti,ab,kw 17871
#7 (low near/3 (birthweight* or birth next weight*)):ti,ab,kw 4419
#8 (lbw or vlbw or elbw):ti,ab,kw 1359
#9 #1 or #2 or #3 or #4 or #5 or #6 or #7 or #8 23148
#10 MeSH descriptor: [Infant Formula] this term only 532
#11 formula*:ti,ab,kw 30550
#12 artificial milk:ti,ab,kw 585
#13 {OR #10‐#12} 30669
#14 Nutriprem:ti,ab,kw 0
#15 Enfamil next premature:ti,ab,kw 1
#16 Similac next special next care:ti,ab,kw 16
#17 Aptamil next preterm:ti,ab,kw 0
#18 Good next Start next premature:ti,ab,kw 0
#19 Preemie next SMA:ti,ab,kw 2
#20 {OR #14‐#19} 19
#21 #13 OR #20 30669
#22 #9 AND #21 1287
#23 #9 AND #21 in Trials 1171
Line #23 shows the number of hits in CENTRAL only.
Key
MeSH descriptor = indexing term (MeSH heading)
* = truncation
:ti,ab,kw = terms in either title, abstract or keyword fields
near/3 = terms within three words of each other (any order)
next = terms are next to each other
Cumulative Index to Nursing and Allied Health Literature (CINAHL Plus)
via EBSCO http://www.ebsco.com/
Inception to 12th November 2018
Searched on: 12th November 2018
Records retrieved: 1331
S1 (MH "Infant, Premature") 19,011
S2 (MH "Infant, Low Birth Weight+") 11,670
S3 TI ( preterm or preterms or pre‐term or pre‐terms ) OR AB ( preterm or preterms or pre‐term or pre‐terms) 25,267
S4 TI ( preemie* or premie or premies ) OR AB ( preemie* or premie or premies ) 257
S5 TI prematur* OR AB prematur* 24,035
S6 TI ( low N3 (birthweight* or birth‐weight*) ) OR AB ( low N3 (birthweight* or birth‐weight*) ) 9,594
S7 TI ( lbw or vlbw or elbw ) OR AB ( lbw or vlbw or elbw ) 2,590
S8 S1 OR S2 OR S3 OR S4 OR S5 OR S6 OR S7 58,200
S9 (MH "Infant Formula") 3,551
S10 TI formula* OR AB formula* 37,184
S11 TI artificial milk OR AB artificial milk 91
S12 S9 OR S10 OR S11 38,940
S13 TI Nutriprem OR AB Nutriprem 0
S14 TI Enfamil premature OR AB Enfamil premature 1
S15 TI Similac special care OR AB Similac special care 2
S16 TI Aptamil preterm OR AB Aptamil preterm 0
S17 TI Good Start premature OR AB Good Start premature 1
S18 TI Preemie SMA OR AB Preemie SMA 0
S19 S13 OR S14 OR S15 OR S16 OR S17 OR S18 4
S20 S12 OR S19 38,942
S21 S8 AND S20 1,369
S22 TI rat or rats or mouse or mice or hamster or hamsters or dog or dogs or cat or cats or sheep or lamb or lambs or pig or pigs or baboon* 65,296
S23 S21 NOT S22 1,331
Key
MH = indexing term (CINAHL heading)
+ = exploded CINAHL heading
* = truncation
TI = words in the title
AB = words in the abstract
N3 = terms within three words of each other (any order)
Embase
Ovid SP http://ovidsp.ovid.com/
1974 to 2018 November 09
Searched on: 12th November 2018
Records retrieved: 1937
The Cochrane EMBASE search strategy for identifying trials for populating CENTRAL (https://www.cochranelibrary.com/central/central‐creation) was used as a basis to limit retrieval to clinical trials (lines 22‐42).
1 prematurity/ (90414)
2 exp low birth weight/ (55443)
3 (preterm or preterms or pre term or pre terms).ti,ab. (91844)
4 (preemie$ or premie or premies).ti,ab. (227)
5 prematur$.ti,ab. (170179)
6 (low adj3 (birthweight$ or birth weight$)).ti,ab. (39584)
7 (lbw or vlbw or elbw).ti,ab. (10182)
8 or/1‐7 (292071)
9 artificial milk/ (12653)
10 formula$.ti,ab. (349334)
11 artificial milk.ti,ab. (229)
12 or/9‐11 (353323)
13 Nutriprem.ti,ab. (5)
14 Enfamil premature.ti,ab. (5)
15 Similac special care.ti,ab. (29)
16 Aptamil preterm.ti,ab. (0)
17 Good Start premature.ti,ab. (0)
18 Preemie SMA.ti,ab. (4)
19 or/13‐18 (40)
20 12 or 19 (353325)
21 8 and 20 (6391)
22 randomized controlled trial/ (522152)
23 controlled clinical trial/ (458440)
24 Random$.ti,ab. (1348777)
25 randomization/ (80039)
26 intermethod comparison/ (241195)
27 placebo.ti,ab. (278696)
28 (compare or compared or comparison).ti. (463938)
29 ((evaluated or evaluate or evaluating or assessed or assess) and (compare or compared or comparing or comparison)).ab. (1821129)
30 (open adj label).ti,ab. (67066)
31 ((double or single or doubly or singly) adj (blind or blinded or blindly)).ti,ab. (211971)
32 double blind procedure/ (155043)
33 parallel group$1.ti,ab. (22476)
34 (crossover or cross over).ti,ab. (94851)
35 ((assign$ or match or matched or allocation) adj5 (alternate or group$1 or intervention$1 or patient$1 or subject$1 or participant$1)).ti,ab. (291657)
36 (assigned or allocated).ti,ab. (342490)
37 (controlled adj7 (study or design or trial)).ti,ab. (304046)
38 (volunteer or volunteers).ti,ab. (227887)
39 human experiment/ (422751)
40 trial.ti. (255652)
41 22 or 23 or 24 or 25 or 26 or 27 or 28 or 29 or 30 or 31 or 32 or 33 or 34 or 35 or 36 or 37 or 38 or 39 or 40 (4418563)
42 (animal/ or nonhuman/) not exp human/ (5251547)
43 41 not 42 (3905510)
44 21 and 43 (1937)
Key:
/ = indexing term (EMTREE heading)
exp = exploded EMTREE heading
$ = truncation
$1 = limited truncation – 1 character on none after word stem.
.ti,ab. = terms in either title or abstract fields
adj3 = terms within three words of each other (any order)
Maternity and Infant Care
Ovid SP http://ovidsp.ovid.com/
1971 to September 2018
Searched on: 12 November 2018
Records retrieved: 1060
1 (preterm or preterms or pre term or pre terms).mp. (24959)
2 (preemie$ or premie or premies).mp. (52)
3 prematur$.mp. (22204)
4 (low adj3 (birthweight$ or birth weight$)).mp. (11426)
5 (lbw or vlbw or elbw).mp. (2918)
6 or/1‐5 (40035)
7 formula$.mp. (6140)
8 artificial milk.mp. (50)
9 7 or 8 (6180)
10 Nutriprem.mp. (3)
11 Enfamil premature.mp. (1)
12 Similac special care.mp. (6)
13 Aptamil preterm.mp. (0)
14 Good Start premature.mp. (0)
15 Preemie SMA.mp. (0)
16 10 or 11 or 12 or 13 or 14 or 15 (9)
17 9 or 16 (6181)
18 6 and 17 (1060)
Key
$ = truncation
.mp. = multi‐purpose field search – includes terms in either title, abstract, keyword heading, name of substance, original title or subject heading fields
adj3 = terms within three words of each other (any order)
PubMed
http://www.ncbi.nlm.nih.gov/pubmed/
Searched on: 12 November 2018
Records retrieved: 63
The Cochrane Highly Sensitive Search Strategy for identifying randomised trials in PubMed (sensitivity‐maximizing version) was used to limit retrieval to clinical trials (Lefebvre 2011). The search was limited to those records found in PubMed but not Medline (Duffy 2016).
Search (((((((((("Infant Formula"[Mesh:NoExp]) OR formula*[Title/Abstract]) OR artificial milk[Title/Abstract])) OR ((((((Nutriprem[Title/Abstract]) OR Enfamil premature[Title/Abstract]) OR Similac special care[Title/Abstract]) OR Aptamil preterm[Title/Abstract]) OR Good Start premature[Title/Abstract]) OR Preemie SMA[Title/Abstract]))) AND (((((((("Infant, Premature"[Mesh]) OR "Infant, Low Birth Weight"[Mesh]) OR "Premature Birth"[Mesh:NoExp]) OR ((preterm[Title/Abstract] OR preterms[Title/Abstract] OR "pre term"[Title/Abstract] OR "pre terms"[Title/Abstract]))) OR ((preemie*[Title/Abstract] OR premie[Title/Abstract] OR premies[Title/Abstract]))) OR prematur*[Title/Abstract]) OR ((low[Title/Abstract]) AND (birthweight*[Title/Abstract] OR birth‐weight*[Title/Abstract]))) OR ((lbw[Title/Abstract] OR vlbw[Title/Abstract] OR elbw[Title/Abstract]))))) AND (((((((((((randomized controlled trial[Publication Type])) OR (controlled clinical trial[Publication Type])) OR (randomized[Title/Abstract])) OR (placebo[Title/Abstract])) OR (drug therapy[MeSH Subheading])) OR (randomly[Title/Abstract])) OR (trial[Title/Abstract])) OR (groups[Title/Abstract]))) NOT (animals[mh] NOT humans[mh])))) AND ((pubstatusaheadofprint OR publisher[sb] OR pubmednotmedline[sb]))
Appendix 2. ‘Risk of bias' tool
1. Sequence generation (checking for possible selection bias). Was the allocation sequence adequately generated?
For each included study, we will categorise the method used to generate the allocation sequence as follows.
Low risk (any truly random process, e.g. random number table; computer random number generator).
High risk (any non‐random process, e.g. odd or even date of birth; hospital or clinic record number).
Unclear risk.
2. Allocation concealment (checking for possible selection bias). Was allocation adequately concealed?
For each included study, we will categorise the method used to conceal the allocation sequence as follows.
Low risk (e.g. telephone or central randomisation; consecutively numbered sealed opaque envelopes).
High risk (open random allocation; unsealed or non‐opaque envelopes, alternation; date of birth).
Unclear risk.
3. Blinding of participants and personnel (checking for possible performance bias). Was knowledge of the allocated intervention adequately prevented during the study?
For each included study, we will categorise the methods used to blind study participants and personnel from knowledge of which intervention a participant received. Blinding will be assessed separately for different outcomes or class of outcomes. We will categorise the methods as follows.
Low risk, high risk, or unclear risk for participants.
Low risk, high risk, or unclear risk for personnel.
4. Blinding of outcome assessment (checking for possible detection bias). Was knowledge of the allocated intervention adequately prevented at the time of outcome assessment?
For each included study, we will categorise the methods used to blind outcome assessment. Blinding will be assessed separately for different outcomes or class of outcomes. We will categorise the methods as follows.
Low risk for outcome assessors.
High risk for outcome assessors.
Unclear risk for outcome assessors.
5. Incomplete outcome data (checking for possible attrition bias through withdrawals, dropouts, protocol deviations). Were incomplete outcome data adequately addressed?
For each included study and for each outcome, we will describe the completeness of data including attrition and exclusions from the analysis. We will note whether attrition and exclusions were reported, the numbers included in the analysis at each stage (compared with the total randomised participants), reasons for attrition or exclusion where reported, and whether missing data were balanced across groups or were related to outcomes. Where sufficient information was reported or supplied by the trial authors, we will re‐include missing data in the analyses. We will categorise the methods as follows.
Low risk (< 20% missing data).
High risk (≥ 20% missing data).
Unclear risk.
6. Selective reporting bias. Are reports of the study free of suggestion of selective outcome reporting?
For each included study, we will describe how we investigated the possibility of selective outcome reporting bias and what we found. For studies in which study protocols were published in advance, we will compare prespecified outcomes versus outcomes eventually reported in the published results. If the study protocol was not published in advance, we will contact study authors to gain access to the study protocol. We will assess the methods as follows.
Low risk (where it is clear that all of the study's prespecified outcomes and all expected outcomes of interest to the review have been reported).
High risk (where not all the study's prespecified outcomes have been reported; one or more reported primary outcomes were not prespecified outcomes of interest and are reported incompletely and so cannot be used; study fails to include results of a key outcome that would have been expected to have been reported).
Unclear risk.
7. Other sources of bias. Was the study apparently free of other problems that could put it at high risk of bias?
For each included study, we will describe any important concerns we had about other possible sources of bias (e.g. whether there was a potential source of bias related to the specific study design, whether the trial was stopped early due to some data‐dependent process). We will assess whether each study was free of other problems that could put it at risk of bias as follows.
Low risk.
High risk.
Unclear risk.
If needed, we will explore the impact of the level of bias through undertaking sensitivity analyses.
Appendix 3. GRADE
The GRADE approach generates an assessment of the certainty of a body of evidence to one of four grades.
High: we are very confident that the true effect lies close to that of the estimate of the effect.
Moderate: we are moderately confident in the effect estimate: the true effect is likely to be close to the estimate of the effect, but there is a possibility that it is substantially different.
Low: our confidence in the effect estimate is limited: the true effect may be substantially different from the estimate of the effect.
Very low: we have very little confidence in the effect estimate: the true effect is likely to be substantially different from the estimate of effect.
Data and analyses
Comparison 1. Nutrient‐enriched formula vs standard formula.
| Outcome or subgroup title | No. of studies | No. of participants | Statistical method | Effect size |
|---|---|---|---|---|
| 1 Time to regain birth weight | 3 | 74 | Mean Difference (IV, Fixed, 95% CI) | ‐1.48 [‐4.73, 1.77] |
| 2 Rate of weight gain (g/kg/d) | 6 | 440 | Mean Difference (IV, Fixed, 95% CI) | 2.43 [1.60, 3.26] |
| 2.1 Sole diet | 5 | 225 | Mean Difference (IV, Fixed, 95% CI) | 3.87 [2.26, 5.47] |
| 2.2 Supplemental to human milk | 1 | 215 | Mean Difference (IV, Fixed, 95% CI) | 1.90 [0.93, 2.87] |
| 3 Rate of length gain (mm/week) | 5 | 386 | Mean Difference (IV, Fixed, 95% CI) | 0.22 [‐0.70, 1.13] |
| 3.1 Sole diet | 4 | 185 | Mean Difference (IV, Fixed, 95% CI) | 1.72 [0.23, 3.20] |
| 3.2 Supplemental to human milk | 1 | 201 | Mean Difference (IV, Fixed, 95% CI) | ‐0.70 [‐1.86, 0.46] |
| 4 Rate of head circumference gain (mm/week) | 5 | 399 | Mean Difference (IV, Fixed, 95% CI) | 1.04 [0.18, 1.89] |
| 4.1 Sole diet | 4 | 184 | Mean Difference (IV, Fixed, 95% CI) | 2.26 [1.00, 3.52] |
| 4.2 Supplemental to human milk | 1 | 215 | Mean Difference (IV, Fixed, 95% CI) | 0.0 [‐1.16, 1.16] |
| 5 Rate of skinfold thickness gain ‐ triceps (mm/week) | 4 | 364 | Mean Difference (IV, Fixed, 95% CI) | 0.12 [0.07, 0.17] |
| 5.1 Sole diet | 3 | 163 | Mean Difference (IV, Fixed, 95% CI) | 0.16 [0.05, 0.27] |
| 5.2 Supplemental to human milk | 1 | 201 | Mean Difference (IV, Fixed, 95% CI) | 0.11 [0.05, 0.17] |
| 6 Rate of skinfold thickness gain ‐ subscapular (mm/week) | 3 | 339 | Mean Difference (IV, Fixed, 95% CI) | 0.10 [0.04, 0.16] |
| 6.1 Sole diet | 2 | 138 | Mean Difference (IV, Fixed, 95% CI) | 0.15 [0.07, 0.24] |
| 6.2 Supplemental to human milk | 1 | 201 | Mean Difference (IV, Fixed, 95% CI) | 0.06 [‐0.02, 0.14] |
| 7 Weight (kg) at 18 months post term | 2 | 334 | Mean Difference (IV, Fixed, 95% CI) | 0.06 [‐0.21, 0.33] |
| 7.1 Sole diet | 1 | 119 | Mean Difference (IV, Fixed, 95% CI) | 0.20 [‐0.31, 0.71] |
| 7.2 Supplemental to human milk | 1 | 215 | Mean Difference (IV, Fixed, 95% CI) | 0.0 [‐0.32, 0.32] |
| 8 Weight (kg) at 7.5 to 8 years post term | 2 | 359 | Mean Difference (IV, Fixed, 95% CI) | 0.30 [‐0.55, 1.15] |
| 8.1 Sole diet | 1 | 135 | Mean Difference (IV, Fixed, 95% CI) | 0.30 [‐0.99, 1.59] |
| 8.2 Supplemental to human milk | 1 | 224 | Mean Difference (IV, Fixed, 95% CI) | 0.30 [‐0.84, 1.44] |
| 9 Height (cm) at 18 months post term | 2 | 334 | Mean Difference (IV, Fixed, 95% CI) | 0.31 [‐0.43, 1.06] |
| 9.1 Sole diet | 1 | 119 | Mean Difference (IV, Fixed, 95% CI) | 1.20 [‐0.26, 2.66] |
| 9.2 Supplemental to human milk | 1 | 215 | Mean Difference (IV, Fixed, 95% CI) | 0.0 [‐0.87, 0.87] |
| 10 Height (cm) at 7.5 to 8 years post term | 2 | 359 | Mean Difference (IV, Fixed, 95% CI) | 0.93 [‐0.30, 2.16] |
| 10.1 Sole diet | 1 | 135 | Mean Difference (IV, Fixed, 95% CI) | 1.30 [‐0.69, 3.29] |
| 10.2 Supplemental to human milk | 1 | 224 | Mean Difference (IV, Fixed, 95% CI) | 0.70 [‐0.86, 2.26] |
| 11 Head circumference (cm) at 18 months post term | 2 | 334 | Mean Difference (IV, Fixed, 95% CI) | 0.09 [‐0.26, 0.43] |
| 11.1 Sole diet | 1 | 119 | Mean Difference (IV, Fixed, 95% CI) | 0.20 [‐0.32, 0.72] |
| 11.2 Supplemental to human milk | 1 | 215 | Mean Difference (IV, Fixed, 95% CI) | 0.0 [‐0.45, 0.45] |
| 12 Head circumference (cm) at 7.5 to 8 years post term | 2 | 359 | Mean Difference (IV, Fixed, 95% CI) | ‐0.12 [‐0.45, 0.21] |
| 12.1 Sole diet | 1 | 135 | Mean Difference (IV, Fixed, 95% CI) | 0.0 [‐0.52, 0.52] |
| 12.2 Supplemental to human milk | 1 | 224 | Mean Difference (IV, Fixed, 95% CI) | ‐0.20 [‐0.62, 0.22] |
| 13 Triceps skinfold thickness (mm) at 18 months post term | 2 | 334 | Mean Difference (IV, Fixed, 95% CI) | 0.01 [‐0.42, 0.45] |
| 13.1 Sole diet | 1 | 119 | Mean Difference (IV, Fixed, 95% CI) | 0.20 [‐0.50, 0.90] |
| 13.2 Supplemental to human milk | 1 | 215 | Mean Difference (IV, Fixed, 95% CI) | ‐0.10 [‐0.65, 0.45] |
| 14 Triceps skinfold thickness (mm) at 7.5 to 8 years post term | 2 | 359 | Mean Difference (IV, Fixed, 95% CI) | ‐0.16 [‐0.91, 0.60] |
| 14.1 Sole diet | 1 | 135 | Mean Difference (IV, Fixed, 95% CI) | 0.30 [‐0.85, 1.45] |
| 14.2 Supplemental to human milk | 1 | 224 | Mean Difference (IV, Fixed, 95% CI) | ‐0.5 [‐1.50, 0.50] |
| 15 Subscapular skinfold thickness (mm) at 18 months post term | 2 | 334 | Mean Difference (IV, Fixed, 95% CI) | ‐0.14 [‐0.40, 0.13] |
| 15.1 Sole diet | 1 | 119 | Mean Difference (IV, Fixed, 95% CI) | 0.0 [‐0.47, 0.47] |
| 15.2 Supplemental to human milk | 1 | 215 | Mean Difference (IV, Fixed, 95% CI) | ‐0.20 [‐0.52, 0.12] |
| 16 Subscapular skinfold thickness (mm) at 7.5 to 8 years post term | 2 | 359 | Mean Difference (IV, Fixed, 95% CI) | ‐0.05 [‐0.67, 0.57] |
| 16.1 Sole diet | 1 | 135 | Mean Difference (IV, Fixed, 95% CI) | ‐0.10 [‐0.96, 0.76] |
| 16.2 Supplemental to human milk | 1 | 224 | Mean Difference (IV, Fixed, 95% CI) | 0.0 [‐0.90, 0.90] |
| 17 Cerebral palsy at 18 months post term | 2 | 377 | Risk Ratio (IV, Fixed, 95% CI) | 0.79 [0.30, 2.07] |
| 17.1 Sole diet | 1 | 141 | Risk Ratio (IV, Fixed, 95% CI) | 0.51 [0.05, 5.47] |
| 17.2 Supplemental to human milk | 1 | 236 | Risk Ratio (IV, Fixed, 95% CI) | 0.86 [0.30, 2.47] |
| 18 Bayley (1) Mental Development Index at 18 months post term | 2 | 310 | Mean Difference (IV, Fixed, 95% CI) | 2.81 [‐1.44, 7.06] |
| 18.1 Sole diet | 1 | 114 | Mean Difference (IV, Fixed, 95% CI) | 6.0 [‐1.07, 13.07] |
| 18.2 Supplemental to human milk | 1 | 196 | Mean Difference (IV, Fixed, 95% CI) | 1.0 [‐4.32, 6.32] |
| 19 Weschler Verbal Intelligence Quotient at 7.5 to 8 years post term | 2 | Mean Difference (IV, Fixed, 95% CI) | Subtotals only | |
| 19.1 Sole diet | 1 | 133 | Mean Difference (IV, Fixed, 95% CI) | 4.90 [‐0.38, 10.18] |
| 19.2 Supplemental to human milk | 1 | 222 | Mean Difference (IV, Fixed, 95% CI) | 0.30 [‐4.41, 5.01] |
| 20 Bayley (1) Psychomotor Development Index at 18 months post term | 2 | 310 | Mean Difference (IV, Fixed, 95% CI) | 6.56 [2.87, 10.26] |
| 20.1 Sole diet | 1 | 114 | Mean Difference (IV, Fixed, 95% CI) | 14.70 [8.73, 20.67] |
| 20.2 Supplemental to human milk | 1 | 196 | Mean Difference (IV, Fixed, 95% CI) | 1.5 [‐3.20, 6.20] |
| 21 Weschler Performance Intelligence Quotient at 7.5 to 8 years post term | 2 | 355 | Mean Difference (IV, Fixed, 95% CI) | 0.06 [‐3.24, 3.36] |
| 21.1 Sole diet | 1 | 133 | Mean Difference (IV, Fixed, 95% CI) | ‐1.70 [‐7.12, 3.72] |
| 21.2 Supplemental to human milk | 1 | 222 | Mean Difference (IV, Fixed, 95% CI) | 1.10 [‐3.06, 5.26] |
| 22 Weschler Overall Intelligence Quotient at 7.5 to 8 years post term | 2 | 355 | Mean Difference (IV, Fixed, 95% CI) | 1.49 [‐1.61, 4.59] |
| 22.1 Sole diet | 1 | 133 | Mean Difference (IV, Fixed, 95% CI) | 2.20 [‐2.65, 7.05] |
| 22.2 Supplemental to human milk | 1 | 222 | Mean Difference (IV, Fixed, 95% CI) | 1.0 [‐3.03, 5.03] |
| 23 Necrotising enterocolitis | 3 | 489 | Risk Ratio (IV, Fixed, 95% CI) | 0.72 [0.41, 1.25] |
| 23.1 Sole diet | 2 | 225 | Risk Ratio (IV, Fixed, 95% CI) | 0.67 [0.27, 1.65] |
| 23.2 Supplemental to human milk | 1 | 264 | Risk Ratio (IV, Fixed, 95% CI) | 0.75 [0.37, 1.52] |
| 24 Duration of birth hospitalisation | 1 | 31 | Mean Difference (IV, Fixed, 95% CI) | 1.0 [‐8.81, 10.81] |
| 25 All‐cause mortality | 2 | 424 | Risk Ratio (IV, Fixed, 95% CI) | 1.12 [0.65, 1.93] |
| 25.1 Sole diet | 1 | 160 | Risk Ratio (IV, Fixed, 95% CI) | 1.34 [0.57, 3.16] |
| 25.2 Supplemental to human milk | 1 | 264 | Risk Ratio (IV, Fixed, 95% CI) | 1.0 [0.50, 2.01] |
| 26 Body mass index (kg/m²) at 18 months post term | 2 | 334 | Mean Difference (IV, Fixed, 95% CI) | ‐0.10 [‐0.43, 0.23] |
| 26.1 Sole diet | 1 | 119 | Mean Difference (IV, Fixed, 95% CI) | ‐0.10 [‐0.70, 0.50] |
| 26.2 Supplemental to human milk | 1 | 215 | Mean Difference (IV, Fixed, 95% CI) | ‐0.10 [‐0.50, 0.30] |
| 27 Body mass index (kg/m²) at 7.5 to 8 years post term | 2 | 359 | Mean Difference (IV, Fixed, 95% CI) | 0.06 [‐0.33, 0.44] |
| 27.1 Sole diet | 1 | 135 | Mean Difference (IV, Fixed, 95% CI) | 0.0 [‐0.57, 0.57] |
| 27.2 Supplemental to human milk | 1 | 224 | Mean Difference (IV, Fixed, 95% CI) | 0.10 [‐0.41, 0.61] |
| 28 Waist‐to‐hip ratio at 7.5 to 8 years post term | 2 | 359 | Mean Difference (IV, Fixed, 95% CI) | ‐0.02 [‐0.16, 0.12] |
| 28.1 Sole diet | 1 | 135 | Mean Difference (IV, Fixed, 95% CI) | ‐0.03 [‐0.20, 0.14] |
| 28.2 Supplemental to human milk | 1 | 224 | Mean Difference (IV, Fixed, 95% CI) | 0.01 [‐0.26, 0.28] |
| 29 Serum alkaline phosphatase level after 4 weeks (IU/mL) | 2 | 49 | Mean Difference (IV, Fixed, 95% CI) | ‐41.12 [‐86.89, 4.65] |
| 30 Bone mineral content (g) assessed by DEXA at 8 to 12 years | 1 | Mean Difference (IV, Fixed, 95% CI) | Subtotals only | |
| 30.1 Lumbar spine | 1 | 61 | Mean Difference (IV, Fixed, 95% CI) | ‐2.70 [‐5.62, 0.22] |
| 30.2 Femoral neck | 1 | 61 | Mean Difference (IV, Fixed, 95% CI) | 0.10 [‐0.19, 0.39] |
| 30.3 Radius | 1 | 57 | Mean Difference (IV, Fixed, 95% CI) | ‐0.03 [‐0.08, 0.02] |
| 30.4 Whole body | 1 | 60 | Mean Difference (IV, Fixed, 95% CI) | ‐77.0 [‐777.29, 623.29] |
1.21. Analysis.
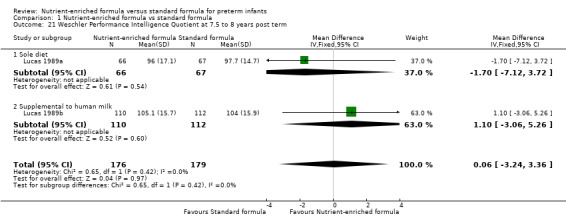
Comparison 1 Nutrient‐enriched formula vs standard formula, Outcome 21 Weschler Performance Intelligence Quotient at 7.5 to 8 years post term.
1.22. Analysis.
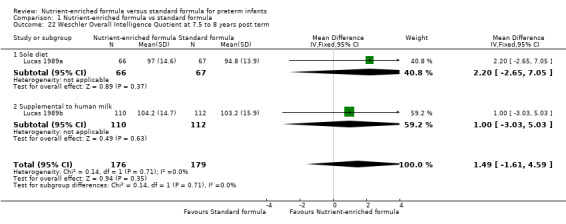
Comparison 1 Nutrient‐enriched formula vs standard formula, Outcome 22 Weschler Overall Intelligence Quotient at 7.5 to 8 years post term.
Characteristics of studies
Characteristics of included studies [ordered by study ID]
Kashyap 1986.
| Methods | Randomised controlled trial | |
| Participants | Preterm infants of birth weight 900 to 1750 g (excluding infants with gastrointestinal tract, renal, or respiratory problems) | |
| Interventions |
Sole diet: Nutrient‐enriched formula (N = 11)
Standard formula (N = 12)
|
|
| Outcomes | Time to regain birth weight Rate of weight, length, and head circumference gain Rate of skinfold thickness gain ‐ triceps and subscapular |
|
| Identification |
Sponsorship source: US National Institute of Health Research grants (HD13020, AM27358, RR00645); Bristol‐Myers Grant Setting: Department of Pediatrics, Columbia University College of Physicians & Surgeons, USA (early 1980s) |
|
| Notes | Infants were randomised into 3 groups. Only data from group 1 ("standard formula") and group 3 ("nutrient‐enriched formula") were included in this review | |
| Risk of bias | ||
| Bias | Authors' judgement | Support for judgement |
| Random sequence generation (selection bias) | Unclear risk | "...assigned randomly shortly after birth to receive one of three formulas" ‐ sequence generation not described. |
| Allocation concealment (selection bias) | Low risk | Allocated colour‐coded formula ‐ investigators and nurses did not know how the codes applied to the formulas |
| Blinding (performance bias and detection bias) All outcomes | Low risk | Not described |
| Blinding of participants and personnel (performance bias) All outcomes | Low risk | Formula containers were colour coded, with code known to neither the investigator nor nurses caring for the infants |
| Incomplete outcome data (attrition bias) All outcomes | Low risk | Outcome assessments likely to include complete cohort |
| Selective reporting (reporting bias) | Low risk | A trial protocol could not be found, but data for all outcomes described in the methods section of the paper were reported in the results |
| Other bias | Unclear risk | The study was funded by a pharmaceutical company. It is unclear if this company was also the manufacturer of the formulas used in the study Infants in the standard formula group had slightly higher mean birth weight |
Kulkarni 1984.
| Methods | Randomised controlled trial | |
| Participants | Preterm infants of birth weight < 1501 g (excluding infants with "severe malformations, or prolonged ventilatory assistance"). Infants were excluded post randomisation if they failed to achieve enteral intake of 80 kcal/kg/d by 5 weeks of age and/or if they developed necrotising enterocolitis (unclear if this was planned) | |
| Interventions |
Sole diet: Nutrient‐enriched formula (N = 13)
Standard formula (N = 18)
|
|
| Outcomes | Time to regain birth weight Duration of hospitalisation Serum alkaline phosphatase level up to 14 weeks |
|
| Identification |
Sponsorship source: supported in part by a grant from Ross Laboraties, Columbus, Ohio Setting: Regional Neonatal Intensive Care Unit, Baptist Medical Center, Montgomery, Alabama, USA (late 1970s) |
|
| Notes | Infants were randomised into 3 groups. Only data from group 2 ("standard formula") and group 3 ("nutrient‐enriched formula") were included in this review | |
| Risk of bias | ||
| Bias | Authors' judgement | Support for judgement |
| Random sequence generation (selection bias) | Unclear risk | "... randomly allocated..." Randomisation occurred when infants had been weaned from supplemental oxygen and were clinically stable. No further details provided |
| Allocation concealment (selection bias) | Unclear risk | Not described |
| Blinding (performance bias and detection bias) All outcomes | Unclear risk | Not described |
| Blinding of participants and personnel (performance bias) All outcomes | Unclear risk | Not described |
| Incomplete outcome data (attrition bias) All outcomes | Low risk | Outcome assessments likely to include complete cohort |
| Selective reporting (reporting bias) | Unclear risk | Protocol not available |
| Other bias | Unclear risk | Funded by Ross Laboratories, the manufacturer of the formula milks used (Osomil and Similac). An employee of Ross Laboratories is acknowledged for having provided "help in statistical data analyses" |
Lucas 1989a.
| Methods | Randomised controlled trial | |
| Participants | Preterm infants weighing < 1850 g at birth (excluding those with "major congenital malformations known to impair growth and development") | |
| Interventions |
Sole diet: Nutrient‐enriched formula (N = 81)
Standard formula (N = 79)
|
|
| Outcomes | Rates of change in weight and head circumference (135/160 infants) from the point of regained birth weight until discharge from the neonatal unit or reaching a weight of 2000 g
Necrotising enterocolitis ‐ suspected and confirmed reported for complete cohort of 160 infants
Bayley Mental Development Index and Psychomotor Development Index at 18 months post term in 114/141 surviving infants
Growth parameters in surviving infants (weight, length, and head circumference) at 18 months (119 infants) and at 7.5 to 8 years (135 infants) post term Intelligence quotient at (IQ) at 7.5 to 8 years with abbreviated Weschler Intelligence Scale for Children (revised Anglicised version: WISC‐R UK) Bone mineral content (DEXA) at 8 to 12 years Blood pressure and plasma glucose and split proinsulin levels assessed in 31 of 141 (22%) surviving infants at 13 to 16 years |
|
| Identification |
Sponsorship source: Farley Health Products gave financial assistance, continued collaboration, and supply of trial diets Setting: Norfolk and Norwich Hospital, Norwich Special Care Baby Unit and Jessop Hospital, Sheffield, UK (early 1980s) |
|
| Notes | Investigators reported a parallel trial of the same interventions used as a supplement to human milk (as opposed to use as the sole diet) ‐ see Lucas 1989b | |
| Risk of bias | ||
| Bias | Authors' judgement | Support for judgement |
| Random sequence generation (selection bias) | Low risk | "Assignments were based on permuted blocks of variable length" Stratified by birth weight < 1201 g and 1201 to 1850 g Randomised within first 48 hours after birth Randomisation was conducted independently at each centre |
| Allocation concealment (selection bias) | Low risk | "... sealed envelopes..."; "...consecutively‐numbered" |
| Blinding (performance bias and detection bias) All outcomes | Unclear risk | Not described |
| Blinding of participants and personnel (performance bias) All outcomes | Unclear risk | Formulas were identified by numerical code so that neonatal staff, parents, and eventually follow‐up staff were blinded to dietary assignment |
| Incomplete outcome data (attrition bias) All outcomes | Low risk | Long‐term growth and developmental assessments were completed for > 80% of surviving infants Cardiovascular (blood pressure) and metabolic (plasma insulin levels) assessments at age 15 years available for < 25% enrolled participants |
| Selective reporting (reporting bias) | Unclear risk | Protocol not available |
| Other bias | Unclear risk | Farley Health Products, the manufacturer of the formula milks used in this trial, was acknowledged "for their financial assistance, continuing collaboration, and supply of trial diets." It is unclear how far the manufacturer was involved in the conduct of the trial, the statistical analyses, and preparation of the published report |
Lucas 1989b.
| Methods | Randomised controlled trial | |
| Participants | Preterm infants weighing < 1850 g at birth (excluding those with "major congenital malformations known to impair growth and development") | |
| Interventions |
Supplemental to human milk: Nutrient‐enriched formula (N = 132)
Standard formula (N = 132)
|
|
| Outcomes | Rates of change in weight and head circumference (225/264 infants) from the point of regained birth weight until discharge from the neonatal unit or reaching a weight of 2000 g
Necrotising enterocolitis ‐ suspected and confirmed reported for complete cohort of 264 infants
Bayley Mental Development Index and Psychomotor Development Index at 18 months post term in 196/236 surviving infants
Growth parameters in surviving infants (weight, length, and head circumference) at 18 months (225 infants) and at 7.5 to 8 years (224 infants) post term Bone mineral content (DEXA) at 8 to 12 years Blood pressure and plasma glucose and split proinsulin levels assessed in 55 of 235 (218%) surviving infants at 13 to 16 years |
|
| Identification |
Sponsorship source: Farley Health Products gave financial assistance, continued collaboration, and supply of trial diets Setting: Norfolk and Norwich Hospital, Norwich Special Care Baby Unit and Jessop Hospital, Sheffield, UK (early 1980s) |
|
| Notes | Investigators reported a parallel trial of the same interventions used as the sole diet (as opposed to use as a supplement to human milk) ‐ see Lucas 1989a | |
| Risk of bias | ||
| Bias | Authors' judgement | Support for judgement |
| Random sequence generation (selection bias) | Low risk | "Assignments were based on permuted blocks of variable length" Stratified by birth weight < 1201 g and 1201 to 1850 g |
| Allocation concealment (selection bias) | Low risk | "... sealed envelopes..."; "...consecutively‐numbered" |
| Blinding (performance bias and detection bias) All outcomes | Unclear risk | Not described |
| Blinding of participants and personnel (performance bias) All outcomes | Unclear risk | Not described |
| Incomplete outcome data (attrition bias) All outcomes | Low risk | Long‐term growth and developmental assessments were completed for > 80% of surviving infants Cardiovascular (blood pressure) and metabolic (plasma insulin levels) assessments at age 15 years available for < 25% of enrolled participants |
| Selective reporting (reporting bias) | Unclear risk | Protocol not available |
| Other bias | Unclear risk | Farley Health Products, the manufacturer of the formula milks used in this trial, was acknowledged "for their financial assistance, continuing collaboration, and supply of trial diets." It is unclear how far the manufacturer was involved in the conduct of the trial, the statistical analyses, and preparation of the published report |
Siripoonya 1989.
| Methods | Randomised controlled trial | |
| Participants | Preterm infants weighing 1000 to 1750 g at birth (excluding those with "respiratory distress, infection and other pathology that affected growth and feeding") | |
| Interventions |
Sole diet: Nutrient‐enriched formula (N = 13)
Standard formula (N = 12)
|
|
| Outcomes | Time to regain birth weight and rate of weight gain ‐ calculated from daily weights to the nearest 10 g Rate of length gain and fronto‐occipital head circumference measured weekly to the nearest mm |
|
| Identification |
Sponsorship source: supported in part by a grant from Nestle, Switzerland Setting: Department of Paediatrics, Mahidol University, Thailand (early‐mid 1980s) |
|
| Notes | ||
| Risk of bias | ||
| Bias | Authors' judgement | Support for judgement |
| Random sequence generation (selection bias) | Low risk | Random numbers table |
| Allocation concealment (selection bias) | Unclear risk | Not described |
| Blinding (performance bias and detection bias) All outcomes | Unclear risk | Not described |
| Blinding of participants and personnel (performance bias) All outcomes | Unclear risk | Not described |
| Incomplete outcome data (attrition bias) All outcomes | High risk | Of 31 preterm infants who were randomised, 6 were excluded due to "illness or infection". No outcome data were reported for these infants, and it is not stated to which group the excluded infants belonged |
| Selective reporting (reporting bias) | Unclear risk | Protocol not available |
| Other bias | Unclear risk | Nestle, the manufacturer of the formula milks used in this trial, was the main sponsor |
Thom 1984.
| Methods | Randomised controlled trial | |
| Participants | "Healthy" newborn infants of birth weight < 1501 g | |
| Interventions |
Sole diet: Nutrient‐enriched formula (N = 35)
Standard formula (N = 30)
|
|
| Outcomes | Time to regain birth weight Rate of weight, length, and head circumference gain |
|
| Identification |
Sponsorship source: Nestle Infant and Dietetic Services acknowledged for providing "financial assistance". Further details of sponsorship sources not reported Setting: Department of Paediatrics, University of Stellenbosch and Tygerberg Hospital, South Africa (early 1980s) |
|
| Notes | ||
| Risk of bias | ||
| Bias | Authors' judgement | Support for judgement |
| Random sequence generation (selection bias) | Unclear risk | "... randomly allocated" ‐ sequence generation not described |
| Allocation concealment (selection bias) | Unclear risk | Not described |
| Blinding (performance bias and detection bias) All outcomes | Unclear risk | Not described |
| Blinding of participants and personnel (performance bias) All outcomes | Unclear risk | Not described |
| Incomplete outcome data (attrition bias) All outcomes | High risk | Of 75 randomised infants, 41 were available for assessment at 28 days old |
| Selective reporting (reporting bias) | High risk | Numerical data not reported for growth outcomes (findings described as "not statistically significant") |
| Other bias | High risk | The trial was undertaken explicitly to "evaluate this formula [Alprem] clinically". Nestle, the manufacturer of Alprem, is acknowledged for the "supply of Alprem and for financial assistance". It is unclear how the comparator formula (Nan, also manufactured by Nestle) was sourced and how far the manufacturer was involved in the conduct of the trial, the statistical analyses, or production of the publication |
Yesilipek 1992.
| Methods | Randomised controlled trial | |
| Participants | Preterm infants weighing < 2000 g at birth (excluding those with "congenital malformations, infections or respiratory distress syndrome") | |
| Interventions |
Sole diet: Nutrient‐enriched formula (N = 11)
Standard formula (N = 11)
|
|
| Outcomes | Rate of weight, length, and head circumference gain | |
| Identification |
Sponsorship source: not stated Setting: Maternity and Children's Hospital, Samsun, Turkey (late 1980s) |
|
| Notes | ||
| Risk of bias | ||
| Bias | Authors' judgement | Support for judgement |
| Random sequence generation (selection bias) | Unclear risk | "...randomly divided..." ‐ sequence generation not described |
| Allocation concealment (selection bias) | Unclear risk | Not described |
| Blinding (performance bias and detection bias) All outcomes | Unclear risk | Not described |
| Blinding of participants and personnel (performance bias) All outcomes | Unclear risk | Not described |
| Incomplete outcome data (attrition bias) All outcomes | Low risk | Outcome assessments likely to include complete cohort |
| Selective reporting (reporting bias) | Unclear risk | Protocol not available |
| Other bias | Unclear risk | Funding source not stated |
DEXA: dual‐energy X‐ray absorptiometry. IQ: intelligence quotient. WISC‐R: Wechsler Intelligence Scale for Children ‐ Revised.
Characteristics of excluded studies [ordered by study ID]
| Study | Reason for exclusion |
|---|---|
| Atkinson 1981 | Not an RCT |
| Duman 2000 | Unclear if RCT; none of the formulas used met the definition of "standard" |
| Haque 1987 | Not an RCT |
| Hering 1987 | Intervention formula used did not meet the definition of "nutrient enriched" |
| Pridham 1999 | Term‐equivalent infants randomly allocated to nutrient‐enriched vs standard formula when nipple‐feeding established (> 36 weeks' postmenstrual age) |
| Yin 2004 | Term infants (growth restricted) |
RCT: randomised controlled trial.
Characteristics of studies awaiting assessment [ordered by study ID]
Costa 1996.
| Methods | Quasi‐RCT (birth order alternating allocation to either group) |
| Participants | Preterm infants (< 37 weeks' gestation) with birth weight < 1750 g (excluding those with serious congenital anomalies, surgical diseases of the gastrointestinal tract, congential infection, and home birth) Subsequent exclusion criteria: change in diet due to team failure; maternal refusal to keep up the regimen up to 40 weeks |
| Interventions |
Supplemental to human milk: Nutrient‐enriched formula (N = 29: 15 average for gestational age; 14 small for gestational age)
Standard formula (N = 41: 20 average for gestational age; 21 small for gestational age)
|
| Outcomes | Time to regain birth weight Rate of weight gain Length gain Head circumference gain Feed intolerance |
| Notes | Awaiting translation and clarification about intervention formula protein content |
Differences between protocol and review
Mortality until 18 months included.
Contributions of authors
All review authors contributed to study selection, data extraction and analysis, and writing of the review. All review authors approved the final review version.
Sources of support
Internal sources
Centre for Reviews and Dissemination, University of York, UK.
Royal Victoria Infirmary, Newcastle upon Tyne, UK.
University of Sydney, NWS, Australia.
External sources
-
Vermont Oxford Network, USA.
Cochrane Neonatal Reviews are produced with support from Vermont Oxford Network, a worldwide collaboration of health professionals dedicated to providing evidence‐based care of the highest quality for newborn infants and their families.
-
National Institute for Health Research (NIHR), UK.
This report is independent research funded by a UK NIHR Cochrane Programme Grant (16/114/03). The views expressed in this publication are those of the review authors and are not necessarily those of the National Health Service, the NIHR, or the UK Department of Health.
-
The Gerber Foundation, USA.
Editorial support for this review, as part of a suite of preterm nutrition reviews, has been provided by a grant from The Gerber Foundation. The Gerber Foundation is a separately endowed, private, 501(c)(3) foundation not related to Gerber Products Company in any way.
Declarations of interest
NDE declares the following: receiving a research grant award for an RCT of breast milk products by Prolacta Bioscience, 2017; receiving a grant from Danone Early Life Nutrition to support a study on feeding in late and moderately preterm infants, 2018; receiving a grant from Nestle Nutrition for transcriptomic analyses of gut tissue, 2016; lectures with Wyeth Nutrition in 2017, Nestle Nutrition Institute in 2017 and 2018, Philipps in 2017, and Fresenius, 2017.
VW has no conflicts of interest.
JB has no conflicts of interest.
LA has no conflicts of interest.
WM has no conflicts of interest.
Core editorial and administrative support for this review has been provided by a grant from The Gerber Foundation. The Gerber Foundation is a separately endowed, private foundation, distinct from the Gerber Products Company. The grantor has no input on the content of the review nor on the editorial process.
To maintain the utmost editorial independence for this Cochrane Review, an editor outside of the Cochrane Neonatal core editorial team who is not receiving any financial remuneration from the grant, Eugene Dempsey, was the Sign‐off Editor for this review. Additionally, a Senior Editor from the Cochrane Children and Families Network, Robert Boyle, assessed and signed off on this Cochrane Review.
Edited (no change to conclusions)
References
References to studies included in this review
Kashyap 1986 {published data only}
- Kashyap S, Forsyth M, Zucker C, Ramakrishnan R, Dell RB, Heird WC. Effects of varying protein and energy intakes on growth and metabolic response in low birth weight infants. Journal of Pediatrics 1986;108(6):955‐63. [PUBMED: 3712165] [DOI] [PubMed] [Google Scholar]
Kulkarni 1984 {published data only}
- Kulkarni PB, Dorand RD, Bridger WM, Payne JH, Montiel DC, Hill JG. Rickets in premature infants fed different formulas. Southern Medical Journal 1984;77(1):13‐6, 20. [PUBMED: 6364370] [DOI] [PubMed] [Google Scholar]
Lucas 1989a {published data only}
- Bishop NJ, Dahlenburg SL, Fewtrell MS, Morley R, Lucas A. Early diet of preterm infants and bone mineralization at age five years. Acta Paediatrica 1996;85(2):230‐6. [PUBMED: 8640056] [DOI] [PubMed] [Google Scholar]
- Fewtrell MS, Prentice A, Jones SC, Bishop NJ, Stirling D, Buffenstein R, et al. Bone mineralization and turnover in preterm infants at 8‐12 years of age: the effect of early diet. Journal of Bone and Mineral Research 1999;14(5):810‐20. [DOI: 10.1359/jbmr.1999.14.5.810; PUBMED: 10320530] [DOI] [PubMed] [Google Scholar]
- Fewtrell MS, Williams JE, Singhal A, Murgatroyd PR, Fuller N, Lucas A. Early diet and peak bone mass: 20 year follow‐up of a randomized trial of early diet in infants born preterm. Bone 2009;45(1):142‐9. [DOI: 10.1016/j.bone.2009.03.657; PUBMED: 19306955] [DOI] [PubMed] [Google Scholar]
- Isaacs EB, Morley R, Lucas A. Early diet and general cognitive outcome at adolescence in children born at or below 30 weeks gestation. Journal of Pediatrics 2009;155(2):229‐34. [DOI: 10.1016/j.jpeds.2009.02.030; PUBMED: 19446846] [DOI] [PubMed] [Google Scholar]
- Lucas A, Cole TJ. Breast milk and neonatal necrotising enterocolitis. Lancet 1990;336(8730):1519‐23. [DOI: 10.1016/0140-6736(90)93304-8; PUBMED: 1979363] [DOI] [PubMed] [Google Scholar]
- Lucas A, Morley R, Cole TJ. Randomised trial of early diet in preterm babies and later intelligence quotient. BMJ 1998;317(7171):1481‐7. [DOI: 10.1136/bmj.317.7171.1481; PUBMED: 9831573] [DOI] [PMC free article] [PubMed] [Google Scholar]
- Lucas A, Morley R, Cole TJ, Gore SM, Davis JA, Bamford MF, et al. Early diet in preterm babies and developmental status in infancy. Archives of Disease in Childhood 1989;64(11):1570‐8. [DOI: 10.1136/adc.64.11.1570; PUBMED: 2690739] [DOI] [PMC free article] [PubMed] [Google Scholar]
- Lucas A, Morley R, Cole TJ, Gore SM, Lucas PJ, Crowle P, et al. Early diet in preterm babies and developmental status at 18 months. Lancet 1990;335(8704):1477‐81. [DOI: 10.1016/0140-6736(90)93026-l; PUBMED: 1972430] [DOI] [PubMed] [Google Scholar]
- Morley R, Lucas A. Randomized diet in the neonatal period and growth performance until 7.5‐8 y of age in preterm children. American Journal of Clinical Nutrition 2000;71(3):822‐8. [DOI: 10.1093/ajcn/71.3.822; PUBMED: 10702179] [DOI] [PubMed] [Google Scholar]
- Singhal A, Cole TJ, Lucas A. Early nutrition in preterm infants and later blood pressure: two cohorts after randomised trials. Lancet 2001;357(9254):413‐9. [DOI: 10.1016/S0140-6736(00)04004-6; PUBMED: 11273059] [DOI] [PubMed] [Google Scholar]
- Singhal A, Fewtrell M, Cole TJ, Lucas A. Low nutrient intake and early growth for later insulin resistance in adolescents born preterm. Lancet 2003;361(9363):1089‐97. [DOI: 10.1016/S0140-6736(03)12895-4; PUBMED: 12672313] [DOI] [PubMed] [Google Scholar]
Lucas 1989b {published data only}
- Bishop NJ, Dahlenburg SL, Fewtrell MS, Morley R, Lucas A. Early diet of preterm infants and bone mineralization at age five years. Acta Paediatrica 1996;85(2):230‐6. [PUBMED: 8640056] [DOI] [PubMed] [Google Scholar]
- Fewtrell MS, Prentice A, Jones SC, Bishop NJ, Stirling D, Buffenstein R, et al. Bone mineralization and turnover in preterm infants at 8‐12 years of age: the effect of early diet. Journal of Bone and Mineral Research 1999;14(5):810‐20. [DOI: 10.1359/jbmr.1999.14.5.810; PUBMED: 10320530] [DOI] [PubMed] [Google Scholar]
- Fewtrell MS, Williams JE, Singhal A, Murgatroyd PR, Fuller N, Lucas A. Early diet and peak bone mass: 20 year follow‐up of a randomized trial of early diet in infants born preterm. Bone 2009;45(1):142‐9. [PUBMED: 19306955] [DOI] [PubMed] [Google Scholar]
- Isaacs EB, Morley R, Lucas A. Early diet and general cognitive outcome at adolescence in children born at or below 30 weeks gestation. Journal of Pediatrics 2009;155(2):229‐34. [DOI: 10.1016/j.jpeds.2009.02.030; PUBMED: 19446846] [DOI] [PubMed] [Google Scholar]
- Lucas A, Cole TJ. Breast milk and neonatal necrotising enterocolitis. Lancet 1990;336(8730):1519‐23. [DOI: 10.1016/0140-6736(90)93304-8; PUBMED: 1979363] [DOI] [PubMed] [Google Scholar]
- Lucas A, Morley R, Cole TJ. Randomised trial of early diet in preterm babies and later intelligence quotient. BMJ (Clinical Research Ed.) 1998;317(7171):1481‐7. [DOI: 10.1136/bmj.317.7171.1481; PUBMED: 9831573] [DOI] [PMC free article] [PubMed] [Google Scholar]
- Lucas A, Morley R, Cole TJ, Gore SM, Davis JA, Bamford MF, et al. Early diet in preterm babies and developmental status in infancy. Archives of Disease in Childhood 1989;64(11):1570‐8. [DOI: 10.1136/adc.64.11.1570; PUBMED: 2690739] [DOI] [PMC free article] [PubMed] [Google Scholar]
- Lucas A, Morley R, Cole TJ, Gore SM, Lucas PJ, Crowle P, et al. Early diet in preterm babies and developmental status at 18 months. Lancet 1990;335(8704):1477‐81. [DOI: 10.1016/0140-6736(90)93026-l; PUBMED: 1972430] [DOI] [PubMed] [Google Scholar]
- Morley R, Lucas A. Randomized diet in the neonatal period and growth performance until 7.5‐8 y of age in preterm children. American Journal of Clinical Nutrition 2000;71(3):822‐8. [DOI: 10.1093/ajcn/71.3.822; PUBMED: 10702179] [DOI] [PubMed] [Google Scholar]
- Singhal A, Cole TJ, Lucas A. Early nutrition in preterm infants and later blood pressure: two cohorts after randomised trials. Lancet 2001;357(9254):413‐9. [DOI: 10.1016/S0140-6736(00)04004-6; PUBMED: 11273059] [DOI] [PubMed] [Google Scholar]
- Singhal A, Fewtrell M, Cole TJ, Lucas A. Low nutrient intake and early growth for later insulin resistance in adolescents born preterm. Lancet 2003;361(9363):1089‐97. [PUBMED: 12672313] [DOI] [PubMed] [Google Scholar]
Siripoonya 1989 {published data only}
- Siripoonya P, Sasivimolkul V, Tejavej A, Hotrakitya S, Tontisirin K. Clinical trial of special premature formula for low‐birth‐weight infants. Journal of the Medical Association of Thailand 1989;72 Suppl 1:61‐5. [PUBMED: 2659718] [PubMed] [Google Scholar]
Thom 1984 {published data only}
- Thom JC, Jong G, Kotze TJ. Clinical trial of a milk formula for infants of low birth weight. South African Medical Journal 1984;65(4):125‐7. [PUBMED: 6364395] [PubMed] [Google Scholar]
Yesilipek 1992 {published data only}
- Yesilipek MA. Standard and low birth weight formulas compared for effects on growth of preterm infants. Turkish Journal of Pediatrics 1992;34(1):31‐6. [PUBMED: 1509527] [PubMed] [Google Scholar]
References to studies excluded from this review
Atkinson 1981 {published data only}
- Atkinson SA, Bryan MH, Anderson GH. Human milk feeding in premature infants: protein, fat, and carbohydrate balances in the first two weeks of life. Journal of Pediatrics 1981;99(4):617‐24. [PUBMED: 7277107] [DOI] [PubMed] [Google Scholar]
Duman 2000 {published data only}
- Duman N, Utkutan S, Ozkan H, Ozdogan S. Are the stool characteristics of preterm infants affected by infant formulas?. Turkish Journal of Pediatrics 2000;42(2):138‐44. [PUBMED: 10936980] [PubMed] [Google Scholar]
Haque 1987 {published data only}
- Haque KN, Bashir O, Lanbourne A, Mullen J. Trial of a new high density milk formula (Prematalac) in Saudi preterm and low birth weight infants. Saudi Medical Journal 1987;8:77‐86. [Google Scholar]
Hering 1987 {published data only}
- Hering E, Vaisman S, Beca JP. Evaluation of a modified milk formula in low birth weight neonates [Evaluacion de una formula de leche modificada en recien nacidos de bajo peso]. Revista Chilena de Pediatria 1987;58(3):197‐202. [PUBMED: 3454457] [PubMed] [Google Scholar]
Pridham 1999 {published data only}
- Pridham K, Kosorok MR, Greer F, Carey P, Kayata S, Sondel S. The effects of prescribed versus ad libitum feedings and formula caloric density on premature infant dietary intake and weight gain. Nursing Research 1999;48(2):86‐93. [PUBMED: 10190835] [DOI] [PubMed] [Google Scholar]
Yin 2004 {published data only}
- Lin YF, Hsieh KS. Chen YY. Nutrient‐enriched versus standard term formula feeding in disproportionately small for gestational age infants. Clinical Neonatology 2004;11:36‐39. [Google Scholar]
References to studies awaiting assessment
Costa 1996 {published data only}
Additional references
AAP 2012
- American Academy of Pediatrics. Breastfeeding and the use of human milk. Pediatrics 2012;129(3):e827–41. [DOI: 10.1542/peds.2011-3552; PUBMED: 22371471] [DOI] [PubMed] [Google Scholar]
Agostoni 2010
- Agostoni C, Buonocore G, Carnielli VP, Curtis M, Darmaun D, Decsi T, et al. ESPGHAN Committee on Nutrition. Enteral nutrient supply for preterm infants: commentary from the European Society of Paediatric Gastroenterology, Hepatology and Nutrition Committee on Nutrition. Journal of Pediatric Gastroenterology and Nutrition 2010;50(1):85‐91. [DOI: 10.1097/MPG.0b013e3181adaee0; PUBMED: 19881390] [DOI] [PubMed] [Google Scholar]
Bracewell 2008
- Bracewell MA, Hennessy EM, Wolke D, Marlow N. The EPICure study: growth and blood pressure at 6 years of age following extremely preterm birth. Archives of Disease in Childhood. Fetal and Neonatal Edition 2008;93(2):F108‐14. [PUBMED: 17660214] [DOI] [PubMed] [Google Scholar]
Brown 2016
- Brown JV, Embleton ND, Harding JE, McGuire W. Multi‐nutrient fortification of human milk for preterm infants. Cochrane Database of Systematic Reviews 2016, Issue 5. [DOI: 10.1002/14651858.CD000343.pub3; PUBMED: 27155888] [DOI] [PubMed] [Google Scholar]
Clark 2003
- Clark RH, Thomas P, Peabody J. Extrauterine growth restriction remains a serious problem in prematurely born neonates. Pediatrics 2003;111(5 Pt 1):986‐90. [DOI] [PubMed] [Google Scholar]
Cleminson 2015
- Cleminson J, Oddie S, Renfrew MJ, McGuire W. Being baby friendly: evidence‐based breastfeeding support. Archives of Disease in Childhood. Fetal and Neonatal Edition 2015;100(2):F173‐8. [DOI: 10.1136/archdischild-2013-304873; PUBMED: 25293712] [DOI] [PubMed] [Google Scholar]
Cooke 2003
- Cooke RWI, Foulder‐Hughes L. Growth impairment in the very preterm and cognitive and motor performance at 7 years. Archives of Disease in Childhood 2003;88(6):482‐7. [DOI] [PMC free article] [PubMed] [Google Scholar]
Doyle 2004
- Doyle LW, Faber B, Callanan C, Ford GW, Davis NM. Extremely low birth weight and body size in early adulthood. Archives of Disease in Childhood 2004;89(4):347‐50. [PUBMED: 15033844] [DOI] [PMC free article] [PubMed] [Google Scholar]
Duffy 2016
- Duffy S, Kock S, Misso K, Noake C, Ross J, Stirk L. Supplementary searches of PubMed to improve currency of MEDLINE and MEDLINE In‐Process searches via Ovid. Journal of the Medical Library Association 2016;104(4):309‐12. [DOI: 10.3163/1536-5050.104.4.011; PUBMED: 27822154] [DOI] [PMC free article] [PubMed] [Google Scholar]
Dusick 2003
- Dusick AM, Poindexter BB, Ehrenkranz RA, Lemons JA. Growth failure in the preterm infant: can we catch up?. Seminars in Perinatology 2003;27(4):302‐10. [PUBMED: 14510321] [DOI] [PubMed] [Google Scholar]
Embleton 2001
- Embleton NE, Pang N, Cooke RJ. Postnatal malnutrition and growth retardation: an inevitable consequence of current recommendations in preterm infants?. Pediatrics 2001;107(2):270‐3. [DOI] [PubMed] [Google Scholar]
Embleton 2013
- Embleton ND. Early nutrition and later outcomes in preterm infants. World Review of Nutrition and Dietetics 2013;106:26‐32. [PUBMED: 23428677] [DOI] [PubMed] [Google Scholar]
Embleton 2017
- Embleton ND, Berrington JE, Dorling J, Ewer AK, Juszczak E, Kirby JA, et al. Mechanisms affecting the gut of preterm infants in enteral feeding trials. Frontiers in Nutrition 2017;4:14. [PUBMED: 28534028] [DOI] [PMC free article] [PubMed] [Google Scholar]
Euser 2005
- Euser AM, Finken MJ, Keijzer‐Veen MG, Hille ET, Wit JM, Dekker FW, Dutch POPS‐19 Collaborative Study Group. Associations between prenatal and infancy weight gain and BMI, fat mass, and fat distribution in young adulthood: a prospective cohort study in males and females born very preterm. American Journal of Clinical Nutrition 2005;81(2):480‐7. [PUBMED: 15699238] [DOI] [PubMed] [Google Scholar]
Euser 2008
- Euser AM, Wit CC, Finken MJ, Rijken M, Wit JM. Growth of preterm born children. Hormone Research 2008;70(6):319‐28. [PUBMED: 18953169] [DOI] [PubMed] [Google Scholar]
Farooqi 2006
- Farooqi A, Hägglöf B, Sedin G, Gothefors L, Serenius F. Growth in 10‐ to 12‐year‐old children born at 23 to 25 weeks' gestation in the 1990s: a Swedish national prospective follow‐up study. Pediatrics 2006;118(5):e1452‐65. [PUBMED: 17079546] [DOI] [PubMed] [Google Scholar]
Fewtrell 2011
- Fewtrell M. Early nutritional predictors of long‐term bone health in preterm infants. Current Opinion in Clinical Nutrition and Metabolic Care 2011;14(3):297‐301. [PUBMED: 21378555] [DOI] [PubMed] [Google Scholar]
Ford 2000
- Ford GW, Doyle LW, Davis NM, Callanan C. Very low birth weight and growth into adolescence. Archives of Pediatrics and Adolescent Medicine 2000;154(8):778‐84. [DOI] [PubMed] [Google Scholar]
GRADEpro GDT 2015 [Computer program]
- McMaster University (developed by Evidence Prime). GRADEpro GDT. Version accessed 7 August 2018. Hamilton (ON): McMaster University (developed by Evidence Prime), 2015.
Hack 1991
- Hack M, Breslau N, Weissman B, Aram D, Klein N, Borawski E. Effect of very low birth weight and subnormal head size on cognitive abilities at school age. New England Journal of Medicine 1991;325(4):231–7. [DOI] [PubMed] [Google Scholar]
Hancock 1984
- Hancock PJ, Bancalari E. Gastric motility in premature infants fed two different formulas. Journal of Pediatric Gastroenterology and Nutrition 1984;3(5):696‐9. [DOI] [PubMed] [Google Scholar]
Hay 2017
- Hay WW Jr, Hendrickson KC. Preterm formula use in the preterm very low birth weight infant. Seminars in Fetal & Neonatal Medicine 2017;22(1):15‐22. [PUBMED: 27595621] [DOI] [PubMed] [Google Scholar]
Higgins 2017
- Higgins JP, Green S (editors). Cochrane Handbook for Systematic Reviews of Interventions Version 5.2.0 (updated June 2017). The Cochrane Collaboration, 2017. Available from training.cochrane.org/handbook.
Horbar 2015
- Horbar JD, Ehrenkranz RA, Badger GJ, Edwards EM, Morrow KA, Soll RF, et al. Weight growth velocity and postnatal growth failure in infants 501 to 1500 grams: 2000‐2013. Pediatrics 2015;136(1):e84‐92. [PUBMED: 26101360] [DOI] [PubMed] [Google Scholar]
Imdad 2013
- Imdad A, Bhutta ZA. Nutritional management of the low birth weight/preterm infant in community settings: a perspective from the developing world. Journal of Pediatrics 2013;162(3 Suppl):s107‐14. [DOI: 10.1016/j.jpeds.2012.11.060; PUBMED: 23445841] [DOI] [PubMed] [Google Scholar]
Klein 2002
- Klein CJ. Nutrient requirements for preterm infant formulas. Journal of Nutrition 2002;132(6):1395S‐577S. [DOI] [PubMed] [Google Scholar]
Kliegman 1987
- Kliegman RM, Walsh MC. Neonatal necrotizing enterocolitis: pathogenesis, classification, and spectrum of illness. Current Problems in Pediatrics 1987;17(4):213‐88. [PUBMED: 3556038] [DOI] [PMC free article] [PubMed] [Google Scholar]
Klingenberg 2012
- Klingenberg C, Embleton ND, Jacobs SE, O'Connell LA, Kuschel CA. Enteral feeding practices in very preterm infants: an international survey. Archives of Disease in Childhood. Fetal and Neonatal Edition 2012;97(1):F56‐61. [DOI: 10.1136/adc.2010.204123; PUBMED: 21856644] [DOI] [PubMed] [Google Scholar]
Lapillonne 2013
- Lapillonne A, Griffin IJ. Feeding preterm infants today for later metabolic and cardiovascular outcomes. Journal of Pediatrics 2013;162(3 Suppl):S7‐16. [PUBMED: 23445851] [DOI] [PubMed] [Google Scholar]
Lefebvre 2011
- Lefebvre C, Manheimer E, Glanville J. Chapter 6. Searching for studies. In: Higgins JP, Green S, editor(s). Cochrane Handbook for Systematic Reviews of Interventions Version 5.1.0 (updated March 2011). The Cochrane Collaboration, 2011. Available from handbook.cochrane.org.
Leppänen 2014
- Leppänen M, Lapinleimu H, Lind A, Matomäki J, Lehtonen L, Haataja L, et al. PIPARI Study Group. Antenatal and postnatal growth and 5‐year cognitive outcome in very preterm infants. Pediatrics 2014;133(1):63‐70. [PUBMED: 24344103] [DOI] [PubMed] [Google Scholar]
Luttikhuizen 2013
- Luttikhuizen dos Santos ES, Kieviet JF, Konigs M, Elburg RM, Oosterlaan J. Predictive value of the Bayley scales of infant development on development of very preterm/very low birth weight children: a meta‐analysis. Early Human Development 2013;89(7):487‐96. [DOI: 10.1016/j.earlhumdev.2013.03.008; PUBMED: 23597678] [DOI] [PubMed] [Google Scholar]
Ouzzani 2016
- Ouzzani M, Hammady H, Fedorowicz Z, Elmagarmid A. Rayyan ‐ a web and mobile app for systematic reviews. Systematic Reviews 2016;5(1):210. [DOI: 10.1186/s13643-016-0384-4] [DOI] [PMC free article] [PubMed] [Google Scholar]
Ramani 2013
- Ramani M, Ambalavanan N. Feeding practices and necrotizing enterocolitis. Clinics in Perinatology 2013;40(1):1‐10. [PUBMED: 23415260] [DOI] [PMC free article] [PubMed] [Google Scholar]
Schünemann 2013
- Schünemann H, Brożek J, Guyatt G, Oxman A, editor(s). Handbook for grading the quality of evidence and the strength of recommendations using the GRADE approach (updated October 2013). GRADE Working Group, 2013. Available from gdt.guidelinedevelopment.org/app/handbook/handbook.html.
Shulhan 2017
- Shulhan J, Dicken B, Hartling L, Larsen BM. Current knowledge of necrotizing enterocolitis in preterm infants and the impact of different types of enteral nutrition products. Advances in Nutrition 2017;8(1):80‐91. [PUBMED: 28096129] [DOI] [PMC free article] [PubMed] [Google Scholar]
Siegel 1984
- Siegel M, Lebenthal E, Krantz B. Effect of caloric density on gastric emptying in premature infants. Journal of Pediatrics 1984;104(1):118‐22. [DOI] [PubMed] [Google Scholar]
Trebar 2007
- Trebar B, Traunecker R, Selbmann HK, Ranke MB. Growth during the first two years predicts pre‐school height in children born with very low birth weight (VLBW): results of a study of 1,320 children in Germany. Pediatric Research 2007;62(2):209‐14. [PUBMED: 17597641] [DOI] [PubMed] [Google Scholar]
Tsang 1993
- Tsang RC, Lucas A, Uauy R, Zlotkin S. Nutritional Needs of the Newborn Infant: Scientific Basis and Practical Guidelines. Pawling, New York: Caduceus Medical Publishers, 1993. [Google Scholar]
Veritas Health Innovation [Computer program]
- Veritas Health Innovation. Covidence. Melbourne, Australia: Veritas Health Innovation, accessed prior to 13 June 2019.
WHO 2018
- WHO, UNICEF, IBFAN. Marketing of breast‐milk substitutes: national implementation of the international code, status report. Geneva: World Health Organization, 2018; Vol. Licence: CC BY‐NC‐SA 3.0 IGO.
Young 2016
- Young L, Embleton ND, McGuire W. Nutrient‐enriched formula versus standard formula for preterm infants following hospital discharge. Cochrane Database of Systematic Reviews 2016, Issue 12. [DOI: 10.1002/14651858.CD004696.pub5; PUBMED: 27958643] [DOI] [PMC free article] [PubMed] [Google Scholar]
References to other published versions of this review
Simmer 2003
- Simmer K, Askie LM 2003, Issue 2. Art. No.: CD004204. DOI: 10.1002/14651858.CD004204. Preterm formula milk versus term formula milk for feeding preterm or low birth weight infants. Cochrane Database of Systematic Reviews 2003, Issue 2. [DOI: 10.1002/14651858.CD004204] [DOI] [Google Scholar]