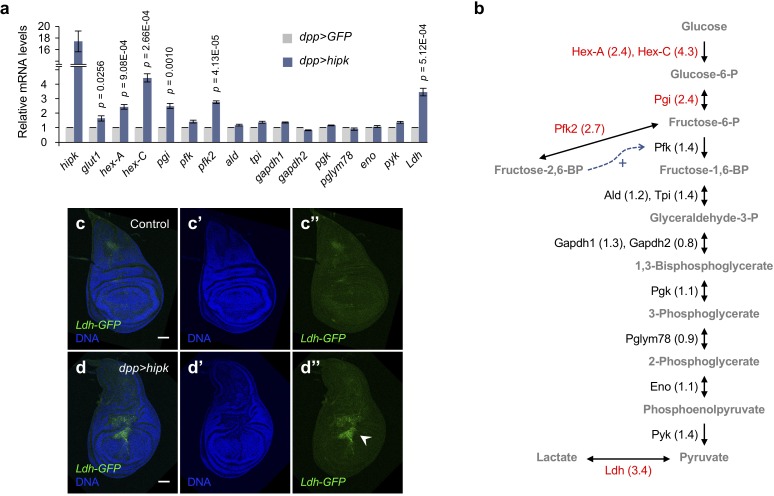
Figure 2. Elevated Hipk induces robust expression of a subset of glycolytic genes.
(a, b) qRT-PCR analysis of glycolytic gene expression in hipk-expressing discs (dpp>hipk) relative to control discs (dpp>GFP) (a). Data are mean ± sem. n = 3 independent experiments with samples pooled from 10 to 20 wing discs per genotype. Schematic diagram of glycolysis (b). Fold changes are shown in brackets. Glycolytic enzymes with more than 1.5-fold transcriptional upregulation in hipk-expressing discs are marked in red. Bi- and uni-directional arrows indicate the reversible and essentially irreversible steps in glycolysis, respectively. Dashed arrow (blue) shows the positive allosteric regulation of Pfk by fructose-2,6-BP. Full names of the glycolytic genes are provided in Supplementary file 1. Exact p values are shown and calculated using unpaired two-tailed t-test. (c–d) Expression of Ldh-GFP (green), an enhancer trap to monitor Ldh expression, in control (genotype: Ldh-GFP/+) (c) and hipk-expressing wing discs (genotype: Ldh-GFP/dpp>hipk) (d). DAPI staining for DNA (blue) reveals tissue morphology. White arrowhead in d’’ indicates marked induction of Ldh expression. Scale bars, 50 μm.

