Abstract
To investigate changes in breast density (BD) during the menstrual cycle in young women in comparison to inter-breast and -segment changes as well as reproducibility of a novel Speed-of-Sound (SoS) Ultrasound (US) method.
SoS-US uses a conventional US system with a reflector and a software add-on to quantify SoS in the retro-mammillary, inner and outer segments of both breasts. Twenty healthy women (18–40 years) with regular menstrual cycles were scanned twice with two weeks in-between. Three of these were additionally measured twice per week for 25 days. Average SoS (m/s) and ΔSoS (segment-variation SoS; m/s) were measured. Variations between follicular and luteal phases and changes over the four-week period were assessed. Inter-examiner and inter-reader agreements were also evaluated. Variances between cycle phases, examiners and readers were compared.
No significant SoS difference was observed between follicular and luteal phases for the twenty women (P = .126), and between all different days for the three more frequently measured women (P = .892). Inter-reader (ICC = 0.999) and inter-examiner (ICC = 0.990) agreements were high. The SoS variance due to menstrual variations was not significantly larger than the inter-examiner uncertainty (P = .461). Inter-reader variations were significantly smaller than menstrual and examiner variations (P < .001).
SoS-US showed high inter-examiner and inter-reader reproducibility. The alterations during the menstrual cycles were not significantly larger than the confidence interval of measurements.
Keywords: biomarker, breast density, menstrual cycle, speed of sound, ultrasound tomography, young females
1. Introduction
Breast density is an important independent risk factor for breast cancer and increases the accuracy of breast cancer risk models.[1,2] Several states in the United States have passed legislation, which requires radiologists to communicate with their patients about their breast density and discuss supplemental screening methods, such as sonography or magnetic resonance imaging (MRI).[3] The 12 to 18 month change in breast density has been shown to be a predictor of response to tamoxifen therapy[4] and variations of breast density have been observed for women undergoing controlled ovarian stimulation.[5] Breast density is presently calculated as a by-product at the time of the first mammography, which currently varies between 40 and 50 years old, depending on country and recommendation source.[6–8]
Ultrasound (US) is a radiation-free, non-invasive and cost effective imaging modality. Breast density correlates with the speed of longitudinal ultrasound waves, also known as the Speed-of-Sound (SoS).[9,10] SoS is a quantitative biomarker measured in a continuous scale, which would as well be potentially adequate to non-invasively monitor SoS changes during the menstruation cycle and as a result of hormonal treatment or medication. Current SoS measurement systems are based on 3D-US-tomography, which require a special table or a water bath, and are associated with long measurement times.[11] While the complexity of these systems can be justified for screening of early-stage cancers, more simple methods are necessary for the monitoring of breast density.
Recently, a novel US method, 2D Speed-of-Sound Ultrasound (SoS-US), has been proposed to measure breast density, which can be implemented as an add-on to standard ultrasound systems.[12,13] This method uses a passive reflector opposite to the breast at a known distance to measure the echo arrival time between a conventional US probe and said reflector. This provides a SoS profile (m/s) along the probe width. Breast density classification based on SoS-US has demonstrated a strong correlation to ACR density categories.[12,13] In contrast to 3D-US-tomography, the reflector technique can be quickly performed without a water bath. A modality like SoS-US would also be adequate to non-invasively monitor SoS changes during the menstruation cycle and as a result of hormonal treatment or medication.
With SoS values ranging (5–95% percentile) from 1403 m/s for ACR a (almost entirely fatty) to 1506 m/s for ACR d (extremely dense) categories,[12,14,15] a SoS range of approximately 100 m/s can be roughly approximated for density variations between 0 and 100% resulting in a variation of 1 m/s per % breast density variation[10], assuming a linear relationship between both modalities.[16]
The goal of this study was to investigate the influence of the menstrual cycle on breast density assessment using SoS-US in young, healthy women. To our knowledge, this is the first pilot study monitoring the breast density variations of a healthy population within the same menstrual cycle.
2. Materials and methods
2.1. Study design
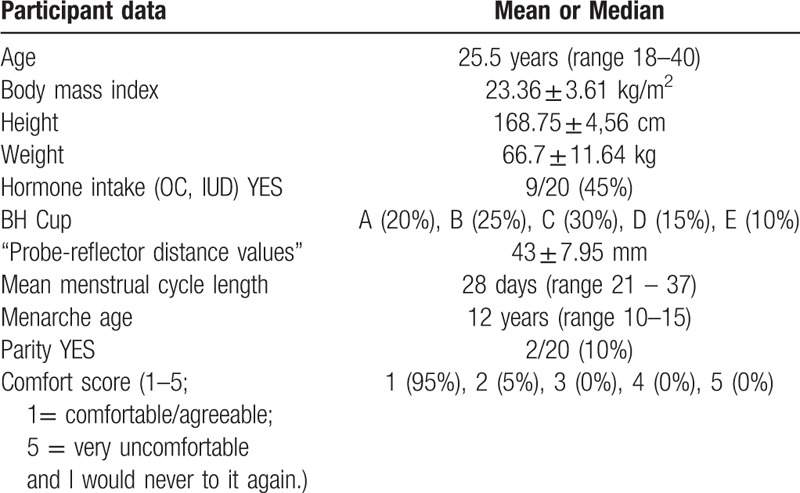
This prospective single-institution study was approved by the institutional review board and local ethics committee “Kantonale Ethikkommission Zürich”. The study was performed in March and April 2018. Twenty healthy volunteers were selected after a local advertisement. Informed written consent was obtained from all women. Inclusion criterion was a regular menstrual cycle, defined as 28 +/− 7 days, reported by the women. The mean age of the women was 26.6 years (range 18–40 years). Volunteers’ characteristics are listed in Table 1. Exclusion criteria were a previous breast tumor, trauma or previous biopsies/operations in either breast. None of the healthy volunteers had undergone mammography. The women were examined at two time points with a 14-day period in-between by examiner 1, a first-year radiology resident (L.R.). A menstrual cycle history questionnaire, including the first bleeding day of the last three menstruation cycles, was completed by the volunteers in a questionnaire and each participant was allocated to either the follicular (day 1–14) or luteal (day 15–18) group at each of the two measurements days. The first menstruation day marked the first day of the menstrual cycle. For cycles not lasting 28 days, we assumed a constant duration of the luteal phase length of 13 to 14 days and a lesser extent of variation in length than the follicular phase[17–19] to allocate the women to the correct menstrual phase. On the day of the second measurement, 18 volunteers (108 breast segments) were additionally examined by a second examiner, a third year medical student (A.S.O.), to obtain inter-examiner agreement. Examiners were blinded to each other's assessment. A subgroup of three volunteers (“frequently measured”) were additionally examined twice a week for a period of 25 days by examiner 1 (L.R.). 9/20 and 2/3 volunteers reported hormone contraceptive intake, including oral contraceptives or a hormone intrauterine device.
Table 1.
Participant data.
2.2. Speed-of-Sound (SoS) Ultrasound (US)
For SoS measurements, we acquired US raw data, also called radiofrequency (RF) lines, with an aperture of one element with a commercial US system (SonixTouch, Ultrasonix, Richmond, Canada). The measurements were performed with a linear ultrasound array (L14/5–38) with an effective center imaging frequency of 5 MHz. A flat Plexiglas reflector located opposite to the breast was delineated in the acquired ultrasound data and used as a timing reference for the US signals transmitted through the breast. Both probe and reflector were attached to a frame, which enabled controlling the distance d (in millimeters) between both elements (Fig. 1a). Ultrasound lotion (PolySonic, Parker Laboratories, Inc., Fairfield, NJ) was applied on the reflector and probe surfaces. The distance d was adjusted to achieve contact between the US probe, the breast and the reflector, read from a digital distance sensor and used to convert the time of flight of the reflector echo into SoS units. Given a reflector echo time t (in seconds), the SoS (in m/s) is calculated as SoS = 2∗d/t. A SoS segment is calculated at a defined measurement position by converting the time coordinate in the RF lines to SoS units according to d.
Figure 1.
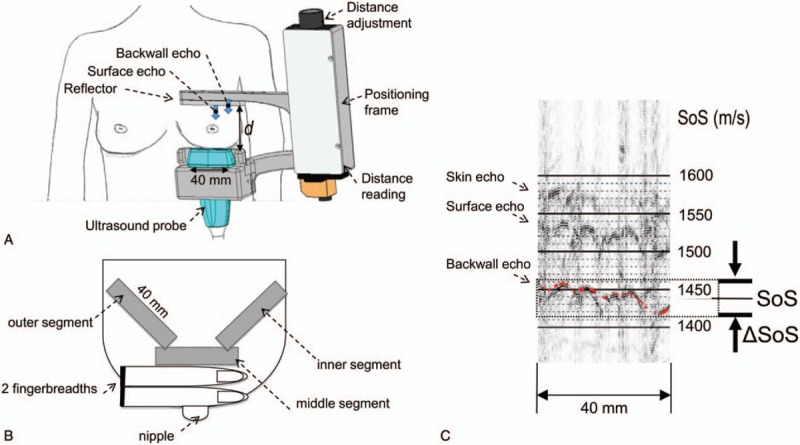
Speed-of-Sound (SoS) ultrasound (US) examination setting. (A) View from ventral: breast with positioning frame, reflector, US probe and distance adjustment unit; (B) right breast viewed from above showing the three measured breast segments; (C) Annotation of average SoS value (1562 m/s) and SoS variation range (‘breast heterogeneity’) ΔSoS = 12 m/s in a dense breast segment. The back wall echo of the reflector is used as a timing reference. The automatic reading is displayed as an overlaid red line.
2.3. Examination protocol
We measured three different (retro-mamillary, outer, inner) segments in each breast. The “retro-mammillary segment” was located in the coronal plane two fingerbreadths dorsal of the mamilla (Fig. 1b). The reflector was placed above the breast, whereas the US probe was located below the breast. Reflector and probe were then rotated 45° around the probe axis and moved to the outer and inner breast thirds, respectively. The corner of the reflector in the retro-mammillary measurement defined the start position for the outer and inner measurements, respectively. In case of a small breast, the end position of outer and inner measurements was given by the chest wall. All study participants sat on a chair in an upright position during the entire examination.
2.4. Comfort level assessment
We used the Likert scale for assessing the volunteers’ comfort during the examination. The scale ranged from 1 = “comfortable/agreeable”, 2 = “slightly uncomfortable but I would do it again”, 3 = “uncomfortable and unsure whether I would do it again”, 4 = “quite uncomfortable and I would prefer not to do it again”, to 5 = “very uncomfortable and I would never to it again”.
2.5. Reading process
Two blinded human readers (manual reader), one ultrasound physicist (S.J.S.) and one third-year medical student (A.S.O.), read the SoS values of all acquired examinations. After a 15-minute practice, each manual reader independently drew a line for each measured segment between the minimum and maximum SoS values in m/s. Then, the average SoS reading (segment-average) was obtained as the midpoint of both values, and the ΔSoS (segment-variation of SoS, “heterogeneity”) was calculated as the difference of maximum and minimum values (Fig. 1c). Additionally, an automatic algorithm was used for automatic reading of SoS and ΔSoS (automatic reader). The algorithm is based on the dynamic programming approach of,[13] where a new algorithm was written at Zurich Ultrasound Research & Translation (ZURT) to simultaneously account for skin, reflector surface and backwall echoes. It provided the maximum and minimum values, from which SoS and ΔSoS were calculated. Inter-reader agreements between the manual readers and between the mean of the manual readers and the automatic reader was assessed for the SoS and ΔSoS values.
2.6. Statistical analysis
Statistical analysis was performed using SPSS (Statistics software version 25, IBM, Armonk, NY) and Matlab (R2016b, The MathWorks Inc., Natick, MA). The means of the six segments of each woman were used for the investigation of differences between luteal and follicular phase, inter-examiner and inter-reader agreement. Statistical differences in SoS and ΔSoS among the subjects were assessed using both unpaired and paired t-tests. Spearman rank correlation coefficients rs and intraclass correlation coefficients (ICC) were calculated to assess correlations of SoS and ΔSoS between phases, examiners, and readers.[20,21] The Bland-Altman method[22] was used to summarize the differences of SoS and ΔSoS. Using the calculated mean and the standard deviation (SD), we calculated the confidence interval (CI) for the SoS variation between menstrual phases and examiners given the current sample size.[23] Differences in variance between paired measurements annotated by different readers, performed by different examiners, and performed on different days were assessed using a 2-sample F-test. To avoid clustering data, when comparing inter-examiner and menstruation cycle variations, only data from one reader and from one examiner, respectively, were used. In order to investigate the influence of hormone intake on SoS variations during the menstrual cycle, the differences between the follicular and luteal phase were first calculated and a student t test was performed between the hormone and non-hormone groups. For the three frequently measured women, repeated measures ANOVA was used to assess differences in SoS and ΔSoS within the investigated period.
3. Results
511 out of 520 (98.27%) segment measurements were successful. Four of the unsuccessful measurements were due to poor gel coupling and five due to false distance readings by the examiner. These errors were easily identified since the ultrasound echoes did then not appear within the SoS reading interval (Fig. 1). The comfort score was in the range 1 to 2 (Table 1).
3.1. Average measurements of both breasts
3.1.1. Comparison of the follicular and luteal phase
For SoS, both unpaired t test (P = .786) and paired t test (P = .126) did not indicate a significant difference (Fig. 2a). The mean SoS difference between follicular and luteal phases was 3.2 m/s with a standard deviation (SD) of 9.2 m/s (Fig. 3a). For ΔSoS, both unpaired (P = .470) and paired (P = .257; 95%-CI -1.58; 5.58) t test did not indicate a significant difference in between follicular and luteal phases (Fig. 2b). The mean ΔSoS difference between follicular and luteal acquisitions was 2.0 m/s, with SD = 7.7 m/s (Fig. 3b). From the current sample size (n = 20), we can conclude that in a 95% confidence interval the mean variation is [−1.1; 7.5 m/s] for SoS and [−1.6; 5.6 m/s] for ΔSoS. We found an ICC of 0.985 (P < .001) for SoS and 0.757 (P < .01) for ΔSoS.
Figure 2.
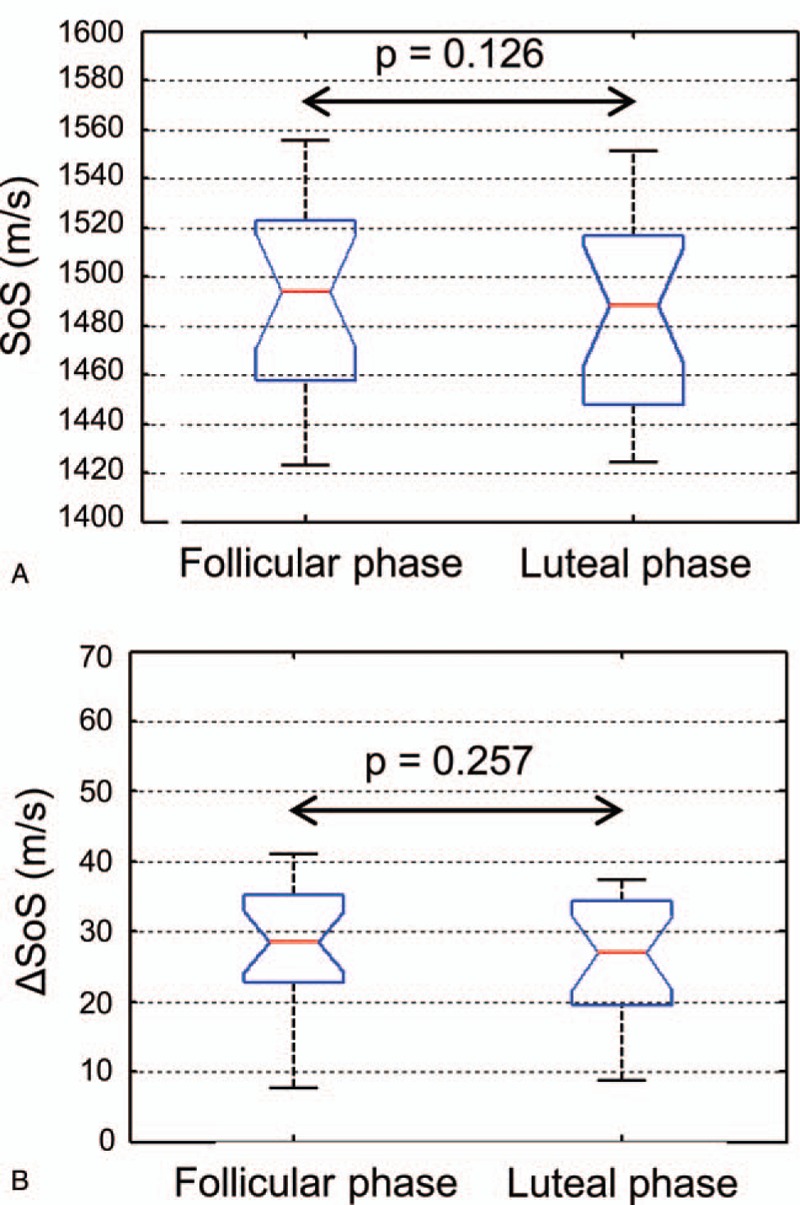
Boxplots of SoS (A) and ΔSoS (B) values of the follicular (n = 20) and luteal phases (n = 20). Average measurements of both breasts are plotted. The P values represent a comparison using paired t test.
Figure 3.
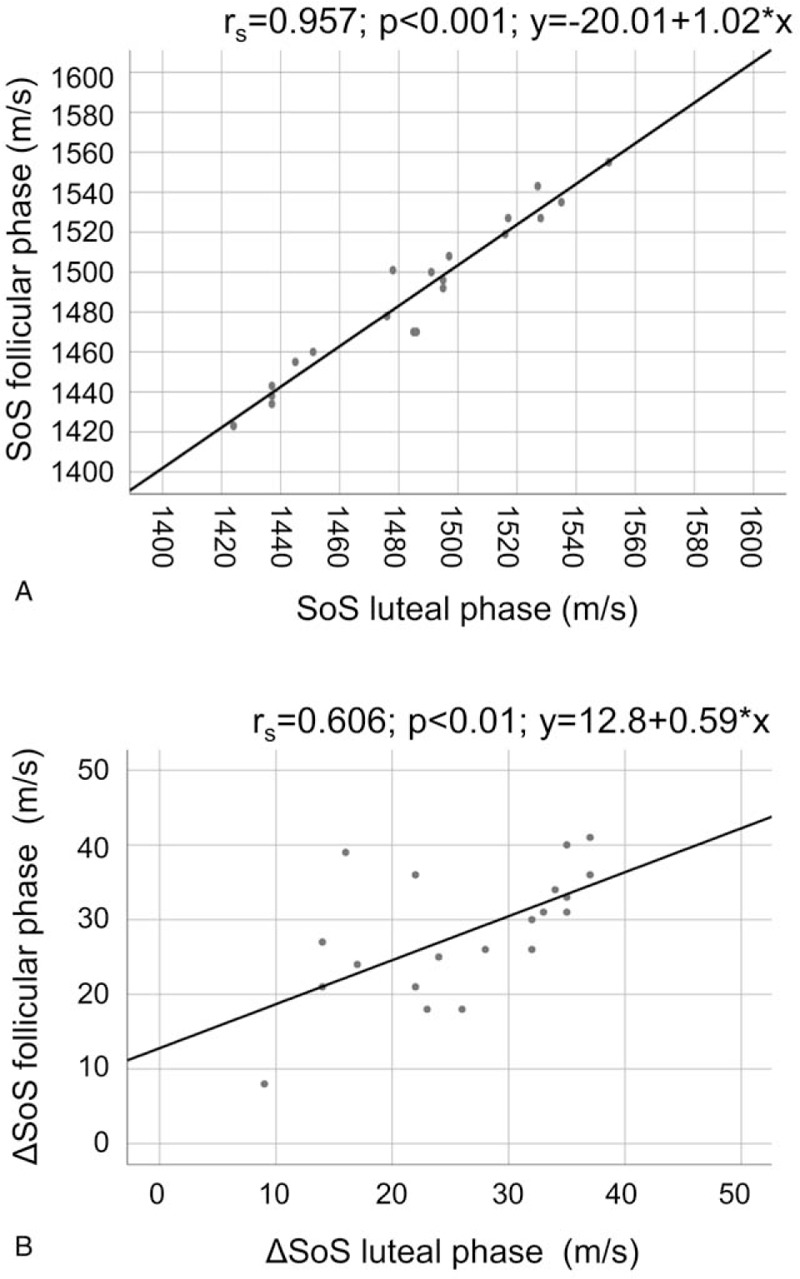
Correlation of SoS (A) and ΔSoS (B) measurements of the follicular (n = 20) and luteal phases (n = 20) (average measurements of both breasts).
3.1.2. Frequently measured women
One-way repeated measures ANOVA indicated ANOVA indicated no significant change in SoS over the seven measured time points (P = .892) (Fig. 4).
Figure 4.
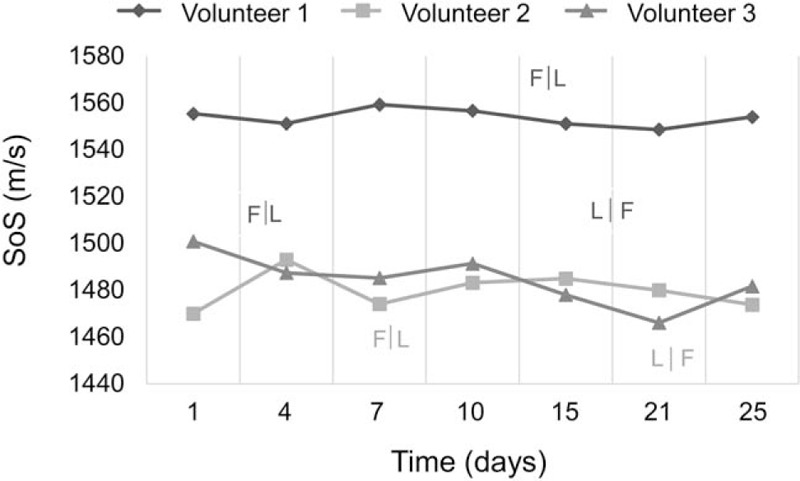
Frequently measured women. Average values of six segments (three per breast) over a 25-day period.
3.1.3. Hormone vs non-hormone
Considering the differences between the follicular and luteal phase in the twenty women, the comparison of the hormone and non-hormone group was not significant for either SoS (P = .614) or ΔSoS (P = .735).
3.1.4. Inter-examiner agreement
Comparing the two examiners, we found a correlation of rs = 0.959 (P < .001) and an ICC of 0.990 for SoS (Fig. 5), and a correlation of rs = 0.612 (P < .01) and an ICC of 0.811 for ΔSoS (Fig. 5). For SoS, the average difference between the examiners was −2.2 m/s, with SD = 7.6 m/s. For ΔSoS, the average difference was 1.4 m/s, with SD = 6.4 m/s.
Figure 5.
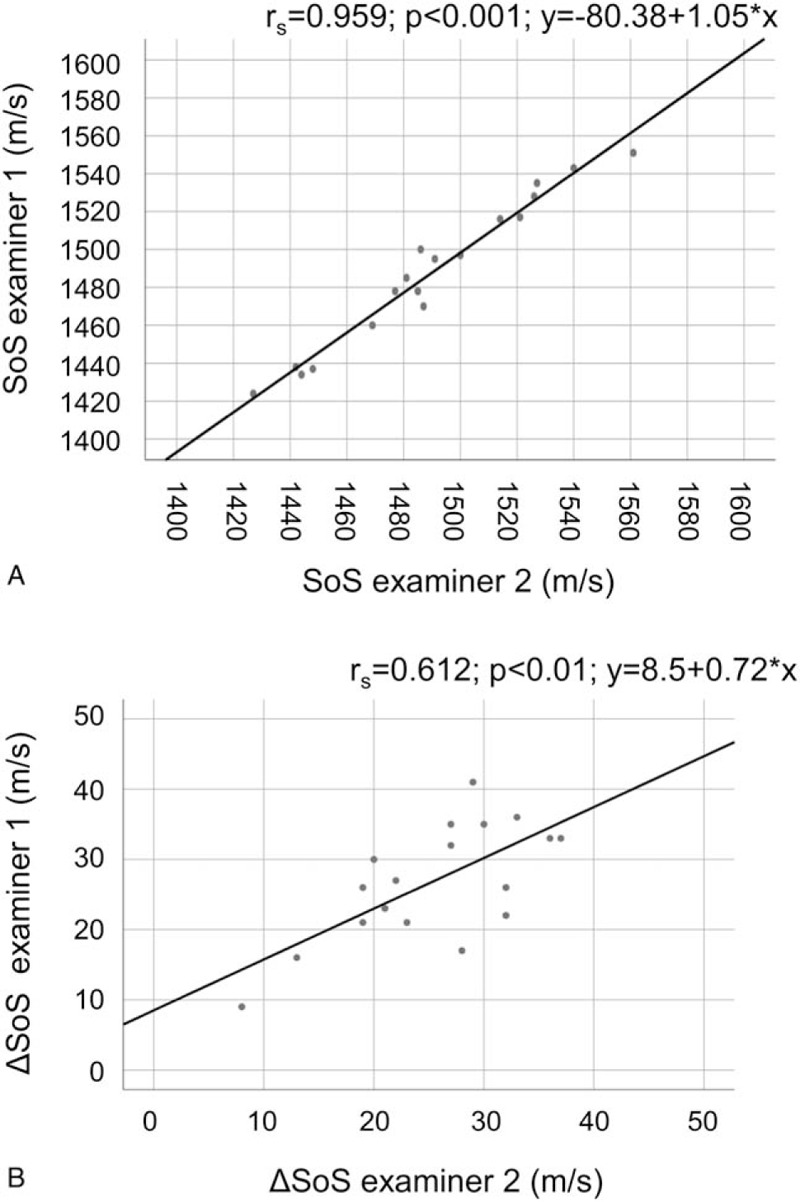
Correlation of SoS (A) and ΔSoS (B) measurements between examiner 1 and examiner 2 (average measurements of both breasts).
3.1.5. Inter-reader agreement
Comparing the two readers, we found a correlation coefficient of rs = 0.997 (P < .001) for SoS and rs = 0.870 (P < .001) for ΔSoS. The ICC was 0.999 for SoS and 0.922 for ΔSoS. The mean SoS difference between the readers was 2.1 m/s, with SD = 1.86 m/s. The mean ΔSoS difference was −4.0 m/s, with SD = 4.7 m/s. Comparing the mean of both manual readers with the automatic reading, we found a correlation coefficient of rs = 0.992 and an ICC = 1.000 for SoS and rs = 0.925 and an ICC = 0.957 for ΔSoS. Figure 6 displays the comparison of the automatic reading and the mean of both manual readers (“manual annotation”).
Figure 6.
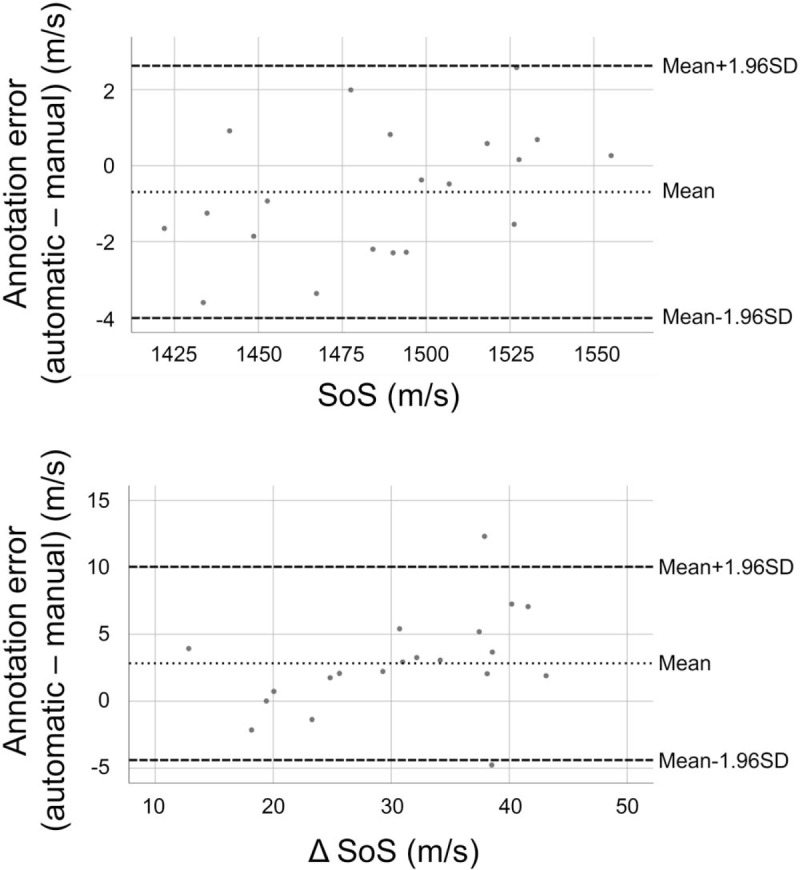
Bland-Altman plot. Automatic annotation – manual annotation (mean of reader 1 and reader 2).
3.1.6. Comparison of variances
The variance between measurements in follicular/luteal phases was not significantly different from the variance between measurements performed by two examiners on the same day (P = .461 for SoS and P = .477 for ΔSoS). For SoS, the variance between measurements performed by the same examiner and annotated by two different manual readers was significantly smaller than the variance between measurements performed by two examiners and annotated by the same manual reader (P < .001), while for ΔSoS the difference of SD was not significant (P = .173) (Fig. 7). The variance between the automatic and manual readers was not significantly different than the variance between two different manual readers for either SoS (P = .694) and ΔSoS (P = .318). The variance between measurements in follicular/luteal phases was significantly larger than the variance between measurements performed by the same examiner and annotated by two different manual readers for SoS (P < .001) and for ΔSoS (P = .035).
Figure 7.
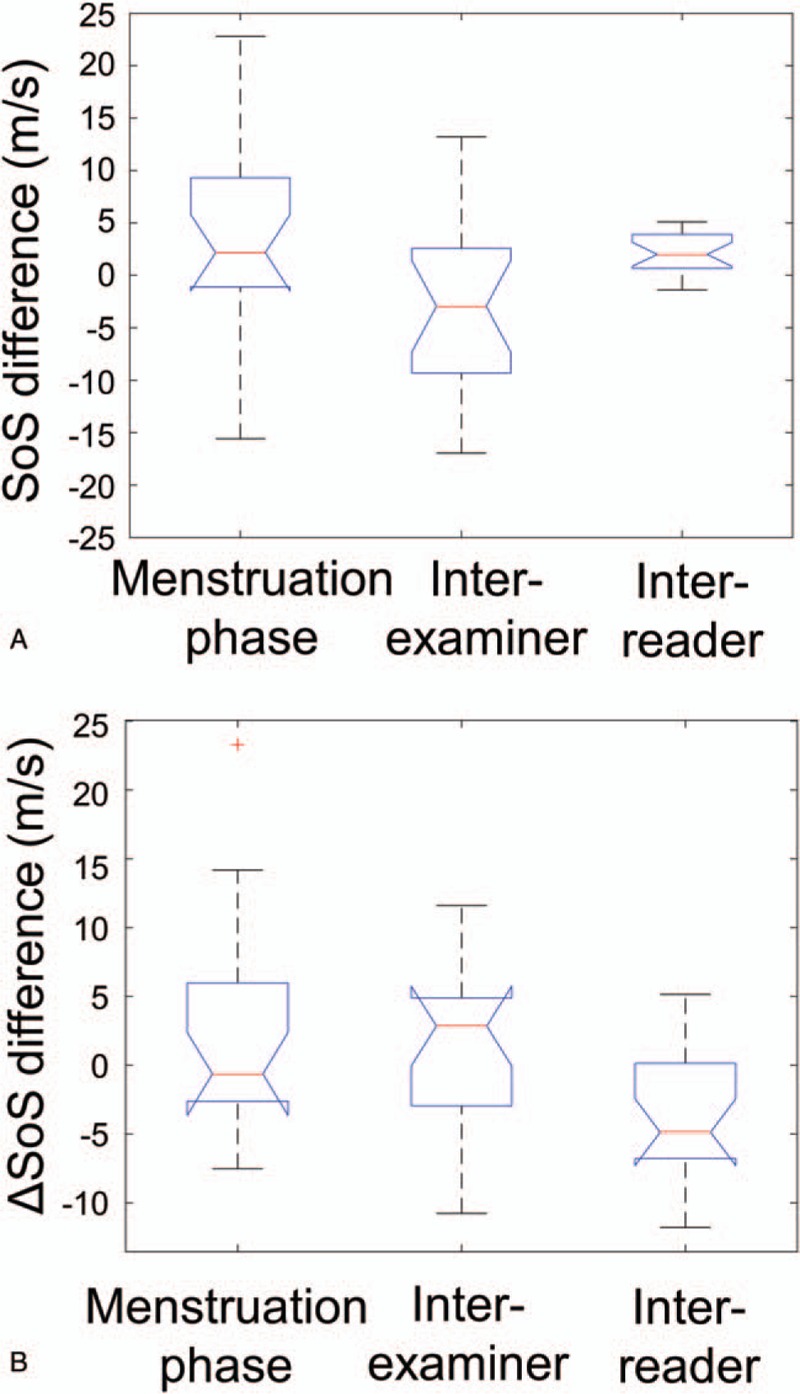
Boxplots of uncertainties between SoS (A) and ΔSoS (B) measurements performed at left: different menstruation phases (luteal/follicular), center: by different examiners, and right: annotated by different readers. Average measurements of both breasts are plotted.
4. Discussion
We showed that the SoS variability was not significantly different over the menstrual cycle and comparable to the inter-examiner variability. Measurements of different examiners and manual readers showed a high reproducibility.
Evidence of menstrual cycle-related histological changes of the breast gland tissue has been published.[24] According to According to Bertrand et al., who investigated the role of sex steroid hormones by menstrual timing and mammographic density in premenopausal women, follicular estradiol and sex hormone-binding globulin may play an important role in premenopausal percent mammographic density.[25] For imaging modalities, different results with respect to the variation of breast density during the menstrual cycle have been published: Magnetic resonance imaging studies demonstrated an increased parenchymal volume during the luteal phase, cycle-dependent changes in contrast enhancement, as well as an overall fluctuation in breast density of about 7%.[26–28] However, Hovhannisyan et al and Buist et al showed non-significant changes in mammographic breast density, whereas White et al found small, but significant changes over the menstrual cycle.[29–31] According to Miglioretti et al, the accuracy of mammographic density measurements is affected by the timing during the menstrual cycle.[32] Using multimodal ultrasound tomography, which combines SoS with other biomarkers, such as acoustic attenuation, Forte et al did not observe statistically significant changes over the menstrual cycle.[33] Our results indicate that variations of breast density within the menstrual cycle, if at all present, are small (SoS variation 95% CI [−1.1,7.5] m/s equivalent to breast density variations between [−1.1,7.5]%). We found that there is no statistically significant difference in SoS and ΔSoS between the follicular and luteal phase among volunteers with very dense breasts. Unpaired analysis shows that the density differences among volunteers with extremely dense breasts are larger than the variations of density within one volunteer within the menstrual cycle. Paired analysis and F-test indicate that the random SoS variance between follicular and luteal cycles for the same volunteer (SD = 9.2 m/s) is not significantly larger than the observed inter-examiner variance on the same day (SD = 7.6 m/s).
Whereas Dorgan et al found breast density to be inversely associated with the age women began taking hormonal contraceptives and positively correlated with the duration of hormone use, Haars et al did not observe an influence of oral contraceptive intake on breast density.[34,35] The comparison of the increments between the follicular and luteal phase did not reveal a significant difference between the hormone intake and non-hormone intake groups.
In our measurements, the inter-reader error appears smaller than the inter-examiner variability for both manual and automatic readings. Moreover, reproducibility errors due to mechanical inaccuracy of the reflector positioning system are considered negligible from previous calibration measurements in reference materials.[13] Therefore, we interpret that the main reproducibility constraint is related to accessing exactly the same breast plane twice with the ultrasound probe. In contrast to this, ultrasound computed tomography (USCT) systems measure the full breast volume. However, the average of the three segments provides a stable predictor of overall breast density. Variations on different measurement days are not significantly larger than the inter-examiner variability on the same day. Therefore, unaccounted menstruation variations do not seem to have a significant confounder impact on SoS measurement reproducibility. Measuring the same patients twice with different USCT devices on the same day, Sak et al[36] found a repeatability of SD = 6.3 m/s, ICC = 0.973, rs = 0.808. Measuring a population characterized by dense breasts, we found similar interexaminer variations (SD = 7.6 m/s; ICC = 0.990; rs = 0.959). Khodr et al measured the reproducibility of SoS USCT for breast density assessment with a follow-up scan one to thirteen months after the first scan per person with the same system.[37] They found a SoS change with a SD of 5.74 m/s with an ICC of 0.933. In comparison, we found an ICC of 0.985 with a SD of 9.2 m/s for SoS and an ICC of 0.757 (P < .01) with a SD of 7.7 m/s for ΔSoS.
There are some limitations to our study. Our sample size was small and we only measured over a single menstruation cycle. A further limitation is that we performed measurements only at two time points for the larger group (N = 20). In addition, conclusions regarding breast density could be affected by the high breast density of the women studied, that is, changes throughout the menstrual cycle may be smaller in dense breasts. The acquisition of only three planes as compared to the entire breast volume using USCT, which could be interpreted as a limitation, has been shown to provide a stable predictor of overall breast density.
While SoS-US showed high reproducibility in comparison with state-of-the-art USCT systems, the alterations during the menstrual cycles were smaller than the confidence interval of measurements. In conclusion, the SoS variability was not significant throughout the menstrual cycle and similar to the inter-examiner variability. Measurements between examiners and readers showed a high reproducibility.
Author contributions
Conceptualization: Lisa Ruby, Sergio J Sanabria, Katharina Martini, Serafino Forte, Orcun Goksel, Thomas Frauenfelder, Rahel A Kubik-Huch, Marga B. Rominger.
Formal analysis: Lisa Ruby, Sergio J Sanabria, Anika S Obrist, Katharina Martini, Thomas Frauenfelder, Rahel A Kubik-Huch, Marga B. Rominger.
Funding acquisition: Marga B. Rominger.
Investigation: Lisa Ruby, Sergio J Sanabria, Anika S Obrist.
Methodology: Lisa Ruby, Katharina Martini, Serafino Forte, Orcun Goksel, Thomas Frauenfelder, Rahel A Kubik-Huch, Marga B. Rominger.
Project administration: Lisa Ruby, Thomas Frauenfelder, Marga B. Rominger.
Resources: Sergio J Sanabria, Orcun Goksel, Rahel A Kubik-Huch, Marga B. Rominger.
Software: Sergio J Sanabria, Orcun Goksel.
Supervision: Serafino Forte, Orcun Goksel, Thomas Frauenfelder, Marga B. Rominger.
Validation: Lisa Ruby, Katharina Martini, Serafino Forte, Orcun Goksel, Rahel A Kubik-Huch, Marga B. Rominger.
Visualization: Lisa Ruby, Sergio J Sanabria, Marga B. Rominger.
Writing – original draft: Lisa Ruby.
Writing – review & editing: Sergio J Sanabria, Anika S Obrist, Katharina Martini, Serafino Forte, Orcun Goksel, Thomas Frauenfelder, Rahel A Kubik-Huch, Marga B. Rominger.
Footnotes
Abbreviations: ACR = American College of Radiology, BD = breast density, CI = confidence interval, ICC = intraclass correlation coefficient, MRI = magnetic resonance imaging, RF = radiofrequency, SoS = speed of sound, US = ultrasound, USCT = ultrasound computed tomography.
The study was approved by an appropriate institutional review board.
This project has been generously supported by a donation from Dr Hans-Peter Wild to the University Hospital Zurich Foundation. Orcun Goksel was funded by a Grant of the Swiss National Science Foundation (#179116). Sergio J. Sanabria was additionally funded by the ETH Pioneer Fellowship. All of the above mentioned provided permission to be named.
The authors have no conflicts of interest to disclose.
References
- [1].Brentnall AR, Harkness EF, Astley SM, et al. Mammographic density adds accuracy to both the Tyrer-Cuzick and Gail breast cancer risk models in a prospective UK screening cohort. Breast Cancer Res 2015;17:147. [DOI] [PMC free article] [PubMed] [Google Scholar]
- [2].Bae MS, Moon WK, Chang JM, et al. Breast cancer detected with screening US: reasons for nondetection at mammography. Radiology 2014;270:369–77. [DOI] [PubMed] [Google Scholar]
- [3].Hooley RJ. Breast density legislation and clinical evidence. Radiol Clin North Am 2017;55:513–26. [DOI] [PubMed] [Google Scholar]
- [4].Cuzick J, Warwick J, Pinney E, et al. Tamoxifen-induced reduction in mammographic density and breast cancer risk reduction: a nested case-control study. J Natl Cancer I 2011;103:744–52. [DOI] [PubMed] [Google Scholar]
- [5].Lundberg FE, Johansson AL, Rodriguez-Wallberg K, et al. Association of infertility and fertility treatment with mammographic density in a large screening-based cohort of women: a cross-sectional study. Breast Cancer Res 2016;18:36. [DOI] [PMC free article] [PubMed] [Google Scholar]
- [6].Hamashima C, Japanese Research Group for the Development of Breast Cancer Screening G, Hamashima CC, et al. The Japanese guidelines for breast cancer screening. Jpn J Clin Oncol 2016;46:482–92. [DOI] [PubMed] [Google Scholar]
- [7].Oeffinger KC, Fontham ET, Etzioni R, et al. Breast cancer screening for women at average risk: 2015 guideline update from the american cancer society. JAMA 2015;314:1599–614. [DOI] [PMC free article] [PubMed] [Google Scholar]
- [8].Smith RA, Andrews KS, Brooks D, et al. Cancer screening in the United States, 2017: a review of current American Cancer Society guidelines and current issues in cancer screening. CA Cancer J Clin 2017;67:100–21. [DOI] [PubMed] [Google Scholar]
- [9].Chivers RC, Parry RJ. Ultrasonic velocity and attenuation in mammalian tissues. J Acoust Soc Am 1978;63:940–53. [DOI] [PubMed] [Google Scholar]
- [10].Sak M, Duric N, Littrup P, et al. Using speed of sound imaging to characterize breast density. Ultrasound Med Biol 2017;43:91–103. [DOI] [PMC free article] [PubMed] [Google Scholar]
- [11].Duric N, Boyd N, Littrup P, et al. Breast density measurements with ultrasound tomography: a comparison with film and digital mammography. Med Phys 2013;40:013501. [DOI] [PMC free article] [PubMed] [Google Scholar]
- [12].Sanabria SJ, Goksel O, Martini K, et al. Breast-density assessment with hand-held ultrasound: A novel biomarker to assess breast cancer risk and to tailor screening? Eur Radiol 2018;28:3165–75. [DOI] [PubMed] [Google Scholar]
- [13].Sanabria SJ, Rominger MB, Goksel O. Speed-of-sound imaging based on reflector delineation. IEEE Trans Biomed Eng 2018;doi: 10.1109/TBME.2018.2881302. [DOI] [PubMed] [Google Scholar]
- [14].Lou Y, Zhou W, Matthews TP, et al. Generation of anatomically realistic numerical phantoms for photoacoustic and ultrasonic breast imaging. J Biomed Opt 2017;22:41015. [DOI] [PMC free article] [PubMed] [Google Scholar]
- [15].Glide C, Duric N, Littrup P. Novel approach to evaluating breast density utilizing ultrasound tomography. Med Phys 2007;34:744–53. [DOI] [PubMed] [Google Scholar]
- [16].Sak M, Duric N, Littrup P, et al. Breast density measurements using ultrasound tomography for patients undergoing tamoxifen treatment. Proc SPIE Int Soc Opt Eng 2013;8675:86751e. [DOI] [PMC free article] [PubMed] [Google Scholar]
- [17].Harlow SD, Ephross SA. Epidemiology of menstruation and its relevance to women's health. Epidemiol Rev 1995;17:265–86. [DOI] [PubMed] [Google Scholar]
- [18].Lenton EA, Landgren BM, Sexton L. Normal variation in the length of the luteal phase of the menstrual cycle: identification of the short luteal phase. Br J Obstet Gynaecol 1984;91:685–9. [DOI] [PubMed] [Google Scholar]
- [19].Lenton EA, Landgren BM, Sexton L, et al. Normal variation in the length of the follicular phase of the menstrual cycle: effect of chronological age. Br J Obstet Gynaecol 1984;91:681–4. [DOI] [PubMed] [Google Scholar]
- [20].Ronald Press Co, Meyers CR, Blesh TE. Measurement in physical education. 1962. [Google Scholar]
- [21].Brooks/Cole Publishing Company, Evans JD. Straightforward Statistics for the Behavioral Sciences. 1996. [Google Scholar]
- [22].Bland JM, Altman DG. Statistical methods for assessing agreement between two methods of clinical measurement. Lancet 1986;1:307–10. [PubMed] [Google Scholar]
- [23].Duxbury Press, Rosner B. Fundamentals of Biostatistics. 4th ed.1995. [Google Scholar]
- [24].Vogel PM, Georgiade NG, Fetter BF, et al. The correlation of histologic changes in the human breast with the menstrual cycle. Am J Pathol 1981;104:23–34. [PMC free article] [PubMed] [Google Scholar]
- [25].Bertrand KA, Eliassen AH, Hankinson SE, et al. Circulating hormones and mammographic density in premenopausal women. Horm Cancer 2018;9:117–27. [DOI] [PMC free article] [PubMed] [Google Scholar]
- [26].Fowler PA, Casey CE, Cameron GG, et al. Cyclic changes in composition and volume of the breast during the menstrual cycle, measured by magnetic resonance imaging. Br J Obstet Gynaecol 1990;97:595–602. [DOI] [PubMed] [Google Scholar]
- [27].Chan S, Su MY, Lei FJ, et al. Menstrual cycle-related fluctuations in breast density measured by using three-dimensional MR imaging. Radiology 2011;261:744–51. [DOI] [PMC free article] [PubMed] [Google Scholar]
- [28].Kuhl CK, Bieling HB, Gieseke J, et al. Healthy premenopausal breast parenchyma in dynamic contrast-enhanced MR imaging of the breast: normal contrast medium enhancement and cyclical-phase dependency. Radiology 1997;203:137–44. [DOI] [PubMed] [Google Scholar]
- [29].Buist DS, Aiello EJ, Miglioretti DL, et al. Mammographic breast density, dense area, and breast area differences by phase in the menstrual cycle. Cancer Epidemiol Biomarkers Prev 2006;15:2303–6. [DOI] [PubMed] [Google Scholar]
- [30].Hovhannisyan G, Chow L, Schlosser A, et al. Differences in measured mammographic density in the menstrual cycle. Cancer Epidemiol Biomarkers Prev 2009;18:1993–9. [DOI] [PubMed] [Google Scholar]
- [31].White E, Velentgas P, Mandelson MT, et al. Variation in mammographic breast density by time in menstrual cycle among women aged 40-–49 years. J Natl Cancer Inst 1998;90:906–10. [DOI] [PubMed] [Google Scholar]
- [32].Miglioretti DL, Walker R, Weaver DL, et al. Accuracy of screening mammography varies by week of menstrual cycle. Radiology 2011;258:372–9. [DOI] [PMC free article] [PubMed] [Google Scholar]
- [33].Forte S, Dellas S, Stieltjes B, et al. Multimodal ultrasound tomography for breast imaging: a prospective study of clinical feasibility. Eur Radiol Exp 2017;1:27. [DOI] [PMC free article] [PubMed] [Google Scholar]
- [34].Dorgan JF, Klifa C, Deshmukh S, et al. Menstrual and reproductive characteristics and breast density in young women. Cancer Causes Control 2013;24:1973–83. [DOI] [PMC free article] [PubMed] [Google Scholar]
- [35].Haars G, van Noord PA, van Gils CH, et al. Measurements of breast density: no ratio for a ratio. Cancer Epidemiol Biomarkers Prev 2005;14(11 Pt 1):2634–40. [DOI] [PubMed] [Google Scholar]
- [36].Sak M, Duric N, Littrup P, et al. Comparison of sound speed measurements on two different ultrasound tomography devices. Proc SPIE Int Soc Opt Eng 2014;9040:90400s. [DOI] [PMC free article] [PubMed] [Google Scholar]
- [37].Khodr ZG, Sak MA, Pfeiffer RM, et al. Determinants of the reliability of ultrasound tomography sound speed estimates as a surrogate for volumetric breast density. Med Phys 2015;42:5671–8. [DOI] [PMC free article] [PubMed] [Google Scholar]


