eLife logoLink to eLife
. 2019 Jul 15;8:e42299. doi: 10.7554/eLife.42299

More homogeneous capillary flow and oxygenation in deeper cortical layers correlate with increased oxygen extraction

Baoqiang Li 1,, Tatiana V Esipova 2,3,, Ikbal Sencan 1, Kıvılcım Kılıç 4, Buyin Fu 1, Michele Desjardins 5, Mohammad Moeini 6,7, Sreekanth Kura 1, Mohammad A Yaseen 1, Frederic Lesage 6,7, Leif Østergaard 8, Anna Devor 1,4,5, David A Boas 1,9, Sergei A Vinogradov 2,3, Sava Sakadžić 1,
Editors: Serge Charpak10, Timothy E Behrens11
PMCID: PMC6636997  PMID: 31305237

Abstract

Our understanding of how capillary blood flow and oxygen distribute across cortical layers to meet the local metabolic demand is incomplete. We addressed this question by using two-photon imaging of resting-state microvascular oxygen partial pressure (PO2) and flow in the whisker barrel cortex in awake mice. Our measurements in layers I-V show that the capillary red-blood-cell flux and oxygenation heterogeneity, and the intracapillary resistance to oxygen delivery, all decrease with depth, reaching a minimum around layer IV, while the depth-dependent oxygen extraction fraction is increased in layer IV, where oxygen demand is presumably the highest. Our findings suggest that more homogeneous distribution of the physiological observables relevant to oxygen transport to tissue is an important part of the microvascular network adaptation to local brain metabolism. These results will inform the biophysical models of layer-specific cerebral oxygen delivery and consumption and improve our understanding of the diseases that affect cerebral microcirculation.

Research organism: Mouse

Introduction

Normal brain functioning is critically dependent on the adequate and uninterrupted supply of oxygen to brain tissue (Attwell and Laughlin, 2001; Raichle and Gusnard, 2002; Raichle et al., 2001). Significant efforts have been made over the years to investigate the regulation of cerebral blood flow (CBF), including auto-regulation of CBF in response to the changes in cerebral perfusion pressure (Aaslid et al., 1989; Paulson et al., 1990) and the processes underlying neurovascular coupling (Anenberg et al., 2015; Cai et al., 2018; Girouard and Iadecola, 2006; Iordanova et al., 2015; Vazquez et al., 2010). Furthermore, neuronal and microvascular densities vary greatly between cortical layers (Blinder et al., 2013; Sakadžić et al., 2014; Weber et al., 2008; Wu et al., 2016), suggesting a laminar variation of tissue metabolism (de Kock et al., 2007; Hyder et al., 2013). However, it is still not well understood how blood flow and oxygenation are distributed through the microvascular network to support an adequate tissue oxygenation across the closely spaced, but morphologically and metabolically heterogeneous cortical layers. Answering this question is important to improve our understanding of the normal brain physiology as well as brain diseases that affect cerebral microcirculation (Berthiaume et al., 2018; Iadecola, 2016; Iadecola, 2017; Pantoni, 2010; Zlokovic, 2011).

The recent development of tools for in vivo microvascular oxygen imaging enabled investigation of brain oxygen delivery and consumption within the arteriolar, venular and capillary domains over large tissue volumes (Cao et al., 2017; Chong et al., 2015a; Hu et al., 2009; Lecoq et al., 2011; Parpaleix et al., 2013; Sakadzić et al., 2010; Sakadžić et al., 2015; Wang et al., 2011; Yaseen et al., 2009). In addition, distributions of microvascular blood flow and oxygen in mice at rest have been assessed in several studies using optical coherence tomography, two-photon microscopy and photoacoustic imaging (Cao et al., 2017; Chong et al., 2015b; Gutiérrez-Jiménez et al., 2018; Lyons et al., 2016; Moeini et al., 2018; Sakadžić et al., 2011; Sakadžić et al., 2014; Santisakultarm et al., 2012; Santisakultarm et al., 2014; Srinivasan et al., 2015). However, only in few previous studies blood flow properties at rest have been considered as a function of cortical depth, but without information about capillary oxygenation and branching order (Gutiérrez-Jiménez et al., 2016; Kleinfeld et al., 1998; Li et al., 2016; Merkle and Srinivasan, 2016). These studies in anesthetized mice showed that capillary red-blood-cell (RBC) flux and/or speed slightly decreased with cortical depth at rest, and that smaller transit time heterogeneity occurred in the deeper cortical layers. By using two-photon phosphorescence lifetime microscopy (2PLM) of oxygen (Finikova et al., 2008), distributions of capillary oxygen concentration were reported in both anesthetized (Lecoq et al., 2011; Parpaleix et al., 2013; Sakadžić et al., 2014) and awake (Lyons et al., 2016; Moeini et al., 2018) mice. The use of anesthesia in some of these studies could have significantly affected both brain CBF and metabolism (Alkire et al., 1999; Goldberg et al., 1966). Moreover, all earlier studies using 2PLM were limited by smaller sample size and insufficient imaging penetration depth due to limitations of the applied oxygen probe – PtP-C343 (Finikova et al., 2008). Lyons et al. for the first time measured the distributions of capillary blood flow and PO2 as a function of cortical depth in the somatosensory cortex in awake mice (Lyons et al., 2016). However, the measurements were performed in less than 100 capillaries across n = 3 mice with the imaging depth of ≤410 µm. Due to these limitations, a detailed layer-specific analysis with the acquired data would be challenging. Moeini et al. conducted imaging study with 2PLM in awake mice through a thinned-skull cranial window (Moeini et al., 2018). This procedure was less invasive, but it further limited imaging depth.

In addition to the experimental observations, several recent studies using numerical modeling based on the realistic and artificial vascular anatomical networks (VANs) predicted layer-dependent blood flow (Hartung et al., 2018; Schmid et al., 2017) and oxygen distributions (Gagnon et al., 2016; Gould and Linninger, 2015; Gould et al., 2017; Linninger et al., 2013; Lücker et al., 2018a; Lücker et al., 2018b). Developing and using accurate biophysical models of oxygen advection and diffusion based on large-scale realistic VANs is a key component in our quest to better understand the regulation of microvascular blood flow. However, current numerical models need to be improved, and their predictions need to be validated by more comprehensive experimental measurements of the physiological observables involved in microvascular oxygen transport to tissue.

The development of 2PLM of oxygen also enabled measurements of erythrocyte-associated transients (EAT) in cortical capillaries (Lecoq et al., 2011). EAT were first theoretically predicted by Hellums (1977) and extensively investigated over the last four decades using analytical and numerical approaches (Federspiel and Popel, 1986; Hellums, 1977; Lücker et al., 2015; Lücker et al., 2017; Popel, 1989). Originally, they were experimentally observed in peripheral capillaries (Barker et al., 2007; Golub and Pittman, 2005), but the full confirmation within the more challenging three-dimensional cortical capillary network was made possible only recently with advent of 2PLM (Lecoq et al., 2011; Parpaleix et al., 2013). Since EAT is tightly related to the intravascular resistance to oxygen transport to tissue (Golub and Pittman, 2005; Hellums, 1977), their direct measurements are critical for better understanding of the oxygen delivery through the capillary network. However, the dependence of EAT on cortical layer has not been fully explored.

To this end, in the present work, we applied 2PLM to measure the absolute intravascular PO2 in a large number of arterioles, venules and capillaries, as well as RBC-PO2, InterRBC-PO2, EAT and RBC flow properties in capillaries as a function of cortical depth within the range of 0–600 µm. We used a new phosphorescent oxygen probe – Oxyphor2P (Esipova et al., 2019). Compared to its predecessor – PtP-C343 (Finikova et al., 2008), Oxyphor2P exhibits longer excitation and emission wavelength maxima, higher quantum yield and a larger two-photon absorption cross-section, facilitating simultaneous mapping of microvascular PO2 and capillary RBC flux in cortical layers I-V in mice and making it possible to significantly increase both the sample size and imaging penetration depth in comparison to the previous studies (Lecoq et al., 2011; Lyons et al., 2016; Moeini et al., 2018; Parpaleix et al., 2013; Sakadzić et al., 2010; Sakadžić et al., 2014). Moreover, our measurements were performed in head-restrained awake mice, and thus were free of the confounding effects of anesthesia on neuronal activity, CBF and brain metabolism. With the results, we report that 1) in the whisker barrel cortex in awake mice the oxygen extraction fraction (OEF), measured at different cortical depths (i.e., depth-dependent OEF), reaches its maximum at the depth range of 320–450 µm, corresponding to cortical layer IV, where the neuron and capillary densities are the largest, and, presumably, oxygen consumption is the highest; and 2) the increased OEF is accompanied by the more homogenously distributed capillary PO2 and RBC flux, as well as by a decrease in the intracapillary resistance to oxygen delivery (inferred from the EAT magnitude). These experimental results enabled quantification of parameters of importance for oxygen transport to tissue and put forward a potential mechanism, by which the microvascular networks at rest may adapt to the heterogeneous metabolic demands in different cortical layers. We anticipate that our results will improve our understanding of the normal brain function as well as of diseases that affect the cerebral microcirculation (Girouard and Iadecola, 2006; Iadecola, 2016; Müller et al., 2017; Pantoni, 2010; Wardlaw et al., 2013; Zlokovic, 2011). In addition, detailed knowledge of the distributions of capillary RBC flux and oxygenation at different depths should inform the next generation of biophysical models of the layer-specific blood flow, oxygen delivery and consumption (Gagnon et al., 2016; Gould and Linninger, 2015; Gould et al., 2017; Guibert et al., 2010; Guibert et al., 2012; Hartung et al., 2018; Linninger et al., 2013; Lorthois and Lauwers, 2012; Lorthois et al., 2011; Peyrounette et al., 2018; Schmid et al., 2017), as well as modeling of the impact of various RBC flow properties on oxygen delivery (Lücker et al., 2018a; Lücker et al., 2018b).

Results

Oxygen extraction fraction increases in the deeper cortical layers

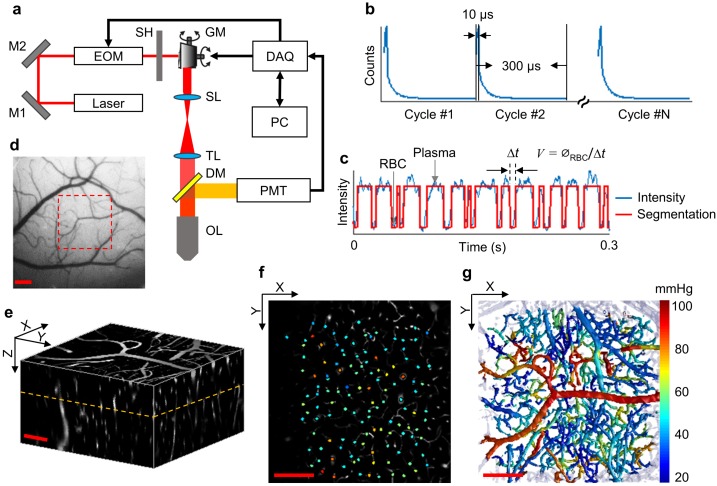
We used a home-built two-photon microscope (Sakadzić et al., 2010; Yaseen et al., 2015) (Figure 1a) to measure the resting intravascular PO2 in the whisker barrel cortex in head-restrained awake mice through a chronic cranial window. PO2 imaging was performed within a 500 × 500 µm2 field of view (FOV) down to 600 µm below the cortical surface. At each imaging depth, we selected the points for measuring PO2 inside the microvascular segments (one point per segment), including arterioles, venules and capillaries (Figure 1f). Point-based acquisition of PO2 was conducted plane-by-plane from the cortical surface down to the cortical depth of 600 µm with inter-plane separation of 50 µm. The intravascular Mean-PO2 was measured in all diving arterioles, venules and in the majority of branching arterioles, venules and capillaries (6544 vascular segments across n = 15 mice) within the FOV. In addition, capillary RBC flux, speed and line-density, as well as RBC-PO2, InterRBC-PO2 and EAT (please see the Materials and methods section for the details) were calculated in a large subset of capillary segments (978 capillaries across n = 15 mice). In each mouse, the measurements were grouped by the cortical layer and then averaged. Subsequently, the average measurements for each cortical layer were averaged over animals (please see the Materials and methods section for the details). Histograms of capillary Mean-PO2, RBC flux, line-density and speed are presented in Figure 1—figure supplement 1. The measurement information (e.g. imaging depth, animal number and sample size) for the main analysis in Figures 27 is provided in the corresponding figure legends, as well as summarized as a table included in Supplementary file 1. Please note that the RBC speed estimation in this work was model-based by assuming a constant RBC size (6 µm) (Unekawa et al., 2010). However, the RBC size may vary with RBC speed, line-density and capillary diameter (Chaigneau et al., 2003). The comparisons between the RBC speed measurements obtained by using the model-based point-scan method and more direct measurements by the line-scan method (Kleinfeld et al., 1998) are presented in Figure 1—figure supplement 2.

Figure 1. Experimental setup and data acquisition protocol.

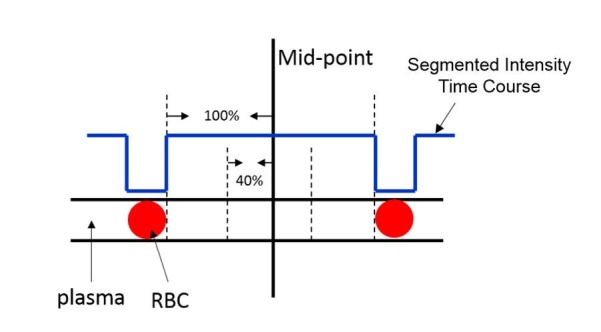
(a) Schematic of our home-built two-photon microscope. The components are abbreviated as: mirror (M), electro-optic modulator (EOM), shutter (SH), galvo mirrors (GM), scan lens (SL), tube lens (TL), dichroic mirror (DM), objective lens (OL), and photomultiplier tube (PMT). (b) Illustrative example of the phosphorescence decays for PO2 recording at a single location. Each 300-µs-long cycle includes a 10-µs-long EOM-gated excitation, followed by a 290-µs-long detection of phosphorescence decay. (c) A representative phosphorescence intensity time course during PO2 recording at a single location (blue curve). Each point in the time course represents the sum of the photon counts acquired during one 300-µs-long excitation/decay cycle in b. The red curve represents the binary segmented time course, with valleys and peaks representing RBC and blood-plasma-passages through the focal volume, respectively. (d) An image of the brain surface vasculature, taken through the chronic cranial window using a CCD camera. (e) The 3D representation of a Sulforhodamine-B-labeled cortical microvasculature imaged over the region of interest outlined by the red dashed square in d. f. PO2 measurements inside the microvascular segments at the imaging plane outlined by the orange dashed line in e. PO2 values (in mmHg, color-coded) were spatially co-registered with the microvascular angiogram. (g) Composite image shows the top view of the 3D projection of the PO2 distribution in the microvascular network. Please note that panel g does not represent an instantaneous PO2 distribution in the presented microvascular network. The color bar serves for panels f and g. Scale bars: 200 µm.

Figure 1—source data 1. Measurements of Mean-PO2 acquired in 6544 microvascular segments over n = 15 mice.
elife-42299-fig1-data1.xlsx (351.7KB, xlsx)
DOI: 10.7554/eLife.42299.005

Figure 1.

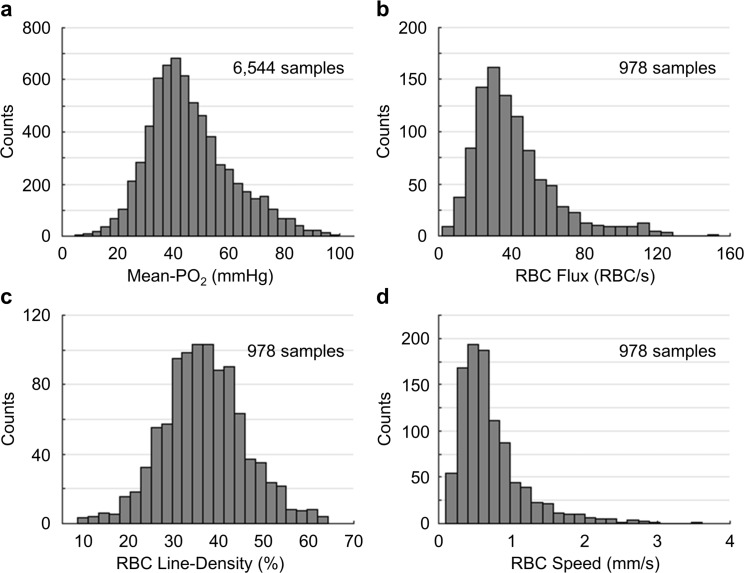
Figure 1—figure supplement 1. Histograms of capillary Mean-PO2, RBC flux, line-density and speed.

Figure 1—figure supplement 1.

(a) Capillary Mean-PO2 was measured in 6544 capillary segments, across n = 15 mice. The Mean-PO2 range is from ~5 mmHg to ~100 mmHg (mean value: 45.6 ± 1.4 mmHg). (b–d) Capillary RBC flux, line-density and speed were measured in a subset of capillaries (978 segments). The RBC flux range (b) is from ~2 RBC/s to ~154 RBC/s (mean value: 41.5 ± 1.2 RBC/s); the line-density range (c) is from 8.6% to 64.4% (mean value: 37.2 ± 0.7%); the speed range (d) is from 0.11 mm/s to 3.63 mm/s (mean value: 0.71 ± 0.03 mm/s).
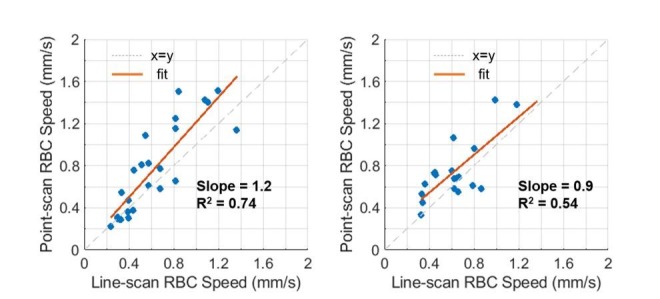
Figure 1—figure supplement 2. Comparison between the capillary RBC speed measurements by the line-scan and point-scan methods.

Figure 1—figure supplement 2.

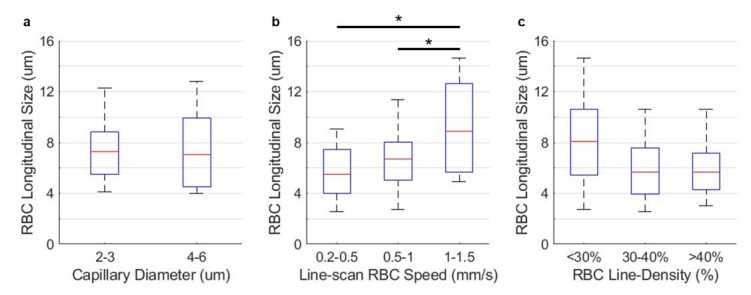
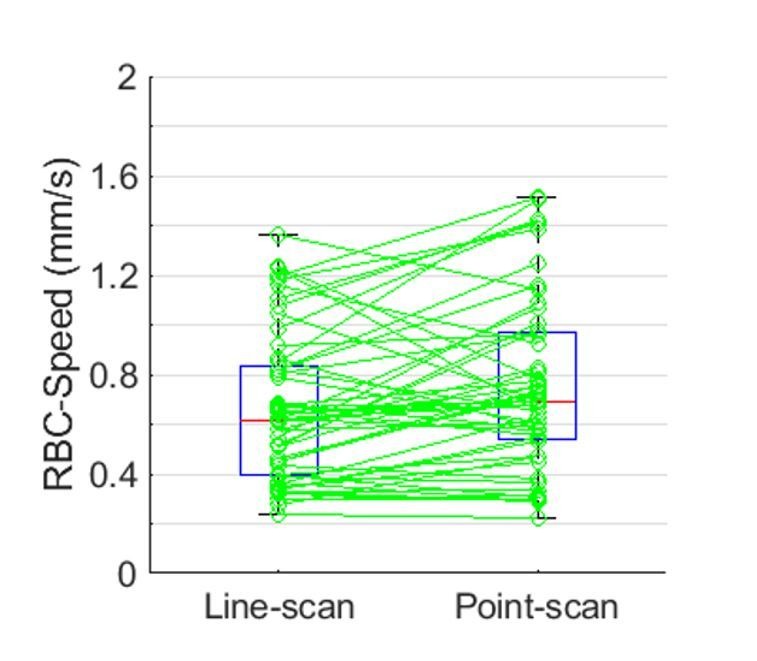
Estimation of the RBC speed based on the measured RBC-passage time through the excitation focal volume (i.e. ‘RBC-passage’ or ‘point-scan’ method) requires a knowledge of the RBC longitudinal size. In this work, we assumed a constant RBC longitudinal size (6 µm) (Unekawa et al., 2010) when estimating the RBC speed (please see Materials and methods section for details). However, the RBC longitudinal size may vary with capillary diameter, RBC speed and hematocrit (Chaigneau et al., 2003). To better understand this limitation, we performed line-scan measurements in 58 capillaries in two awake C57BL/6 mice (3–5 months old, female, 20–25 g, Charles River Laboratories). The cranial window was prepared following the same protocol as described in the Materials and methods section. The blood plasma was labeled by dextran-conjugated Sulforhodamine-B (0.1 ml at 5% W/V in saline, Sigma R9379). The line-scans (2-s-long acquisition in each capillary with 2 kHz line-scan rate) were performed within the cortical depth of 0–200 µm. The RBC speed was calculated from the line-scan images with the procedures described in Kleinfeld et al. (1998). In addition, we extracted the fluorescence intensity time courses from the same parallel line-scan images, and then the RBC speed was calculated by using the procedures described in the Methods section (i.e. by the ‘point-scan’ or ‘RBC-passage’ method). Furthermore, we investigated the dependence of RBC longitudinal size on capillary diameter, RBC speed, and linear-density. (a) The capillary RBC speed values estimated simultaneously by both the line-scan and point-scan methods. The RBC speed values obtained by the two methods in each capillary (green circles) are connected by green lines. Boxplots of the line-scan and point-scan RBC-speed values indicate the median values, the 1st and 3rd quartiles, and the maximum and minimum values. (b) and (c) Correlation between the line-scan and point-scan RBC speed values from the same n = 58 capillaries used in a), grouped by the capillary diameter: 2–3 µm (b) and 3–5 µm (c). In panels b and c, we also presented the corresponding linear regression lines (orange), as well as their slopes and coefficients of determination (R2). (d-f) Dependence of the RBC longitudinal size on capillary diameter (d), RBC speed (e), and line-density (f). For each of the 58 capillaries, we estimated the capillary diameter by fitting the transversal intensity profile to a Gaussian model. The diameters were calculated as the full width at half maximum of the Gaussian profiles. The RBC line-density and longitudinal size were calculated by following the procedures described in Chaigneau et al. (2003). By averaging over all the RBCs identified in each capillary and then across the 58 capillaries, we obtained the mean RBC longitudinal size (6.9 ± 3.0 µm; Mean ±STD). The mean RBC longitudinal size in the capillaries with smaller diameter (2–3 µm; panel d) was just slightly (statistically not significantly) larger than in the capillaries with larger diameter (4–6 µm). This result can be expected as the RBCs in the smaller capillaries may be squeezed to a greater extent. We further observed that the RBC longitudinal size increased with RBC speed (e), where the RBC longitudinal size in the fastest group of capillaries (1–1.5 mm/s) was statistically significantly larger than in the other two lower speed groups. Finally, the capillaries with lower-line-density had more elongated RBC size than the capillaries with median- and higher-line-density (f), although the difference was not statistically significant. The statistical comparison in d) was conducted using Student’s t-test. The statistical comparisons in e) and f) were conducted using ANOVA followed by a Tukey-HSD post-hoc test. The asterisk symbol indicates p<0.05. Data from 58 capillaries were used for the analysis in a and (d-f) and data from 25 and 19 capillaries were used for the analysis in b and c, respectively. In addition, we analyzed the temporal fluctuation of the RBC longitudinal size during the 2-s-long acquisition. For each capillary, we computed the standard deviation (STD) and coefficient of variance (CV) of the RBC longitudinal size from the individual RBC measurements acquired during the 2-s-long acquisition. Then, we obtained the mean STD (2.3 ± 0.6 µm) and CV (0.4 ± 0.1) values averaging over the 58 capillaries. Based on presented results, RBC longitudinal size may be different from capillary to capillary as a function of capillary diameter, RBC speed, and line-density, and may vary over time within the same capillaries. The RBC longitudinal size was especially large at high RBC speed (e). In addition, the average temporal fluctuation of the RBC longitudinal size was moderate (STD = 2.3 ± 0.6 µm). Finally, pairwise comparisons between the RBC speed values obtained by the two methods (a–c) reveal variability, especially at the high RBC speed. Therefore, instantaneous RBC speed obtained by the point-scan method may have larger measurement error, which needs to be considered when interpreting the data. On the other hand, the small difference between the mean RBC speed obtained in the paired measurements (a) did not reach statistical significance (Student’s t-test), and the linear regression slopes in panels b and c are reasonably close to 1. Therefore, for the purpose of providing mean values for group comparison, the RBC speed measurements based on the point-scan method, while limited by assuming the constant RBC longitudinal length, may still be reasonably accurate. Please note that regarding the extreme values of the estimated RBC longitudinal size (d–f), they were calculated as the product of the fitted temporal width of the shadows and the RBC speed, both of which were extracted from the line-scan images. Measurements of both these parameters have limitations. The line-scan method is less accurate for high RBC speed, while estimation of the shadow width sometimes may be influenced by the stacked RBCs, and the fluorescence intensity time courses may be noisier when acquired with the line-scan method (due to shorter dwelling time per time-point) than with the point-scan method.

Figure 2. Cortical layer-dependent distributions of the arteriolar and venular intravascular PO2 and SO2.

Figure 2.

(a) Intravascular PO2 in the diving arterioles (red symbols) and venules (blue symbols) across cortical layers I-V (11 arterioles, 14 venules, from n = 7 mice). (b) SO2 in the diving arterioles (red symbols) and venules (blue symbols) across cortical layers I-V, and the depth-dependent OEF (DOEF, black symbols). For each diving arteriole or surfacing venule in a and b, PO2 was tracked from the cortical surface down to the cortical depth of 600 µm. Data are expressed as mean ± SEM. Please note that the error bars may be too small to be visible.

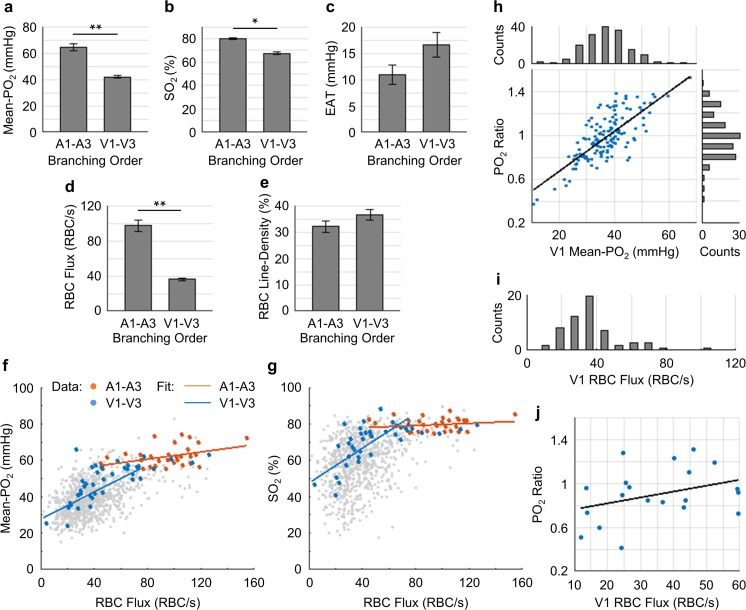
Figure 7. Capillary flow and oxygenation in the upstream and downstream branches.

(a-e) Average capillary Mean-PO2, SO2, EAT, RBC flux and line-density, in the upstream (A1–A3) and downstream (V1–V3) capillary branches, across cortical layers I-III. Data are expressed as mean ± SEM. Statistical comparisons were carried out using Student’s t-test. The single-asterisk symbol (*) indicates p<0.05; the double-asterisk symbol (**) indicates p<0.001. (f and g) Correlations between capillary RBC flux and Mean-PO2 (f) and SO2 (g). Data points and regression lines from the A1-A3, V1-V3, and all capillary segments (branching order unassigned) are color-coded red, blue, and gray, respectively. Linear regression slopes in f: V1-V3 slope = 0.37 mmHg∙s∙RBC−1 (R2 = 0.61), A1-A3 slope = 0.1 mmHg∙s∙RBC−1 (R2 ≈ 0.17). Linear regression slopes in g: V1-V3 slope = 0.50 s∙RBC−1 (R2 = 0.52), A1-A3 slope = 0.03 s∙RBC−1 (R2≈0.04). The analysis in a–g was made with 47 upstream and 50 downstream capillaries, across n = 5 mice. (h) Correlation between the PO2 ratio (the V1 capillary Mean-PO2 to the adjacent PCV PO2) and the V1 capillary Mean-PO2. Histograms of the V1 capillary Mean-PO2, and PO2 ratio are at the top and on the right from the main panel, respectively (178 capillaries, across n = 5 mice). (i) Histogram of the V1 capillary RBC flux (65 capillaries, across n = 5 mice). (j) Correlation between the V1 capillary RBC flux and PO2 ratio (20 capillaries, across n = 5 mice). The linear regression slope = 0.01 s∙RBC−1 (R2≈0.12).

Figure 7.

Figure 7—figure supplement 1. Average capillary RBC speed in the upstream (A1–A3) and downstream (V1–V3) capillary branches, across cortical layers I-III.

Figure 7—figure supplement 1.

Data are expressed as mean ± SEM. Statistical comparisons were carried out using Student’s t-test. The double-asterisk symbol (**) indicates p<0.001. This analysis was made with 47 upstream and 50 downstream capillaries, across n = 5 mice.
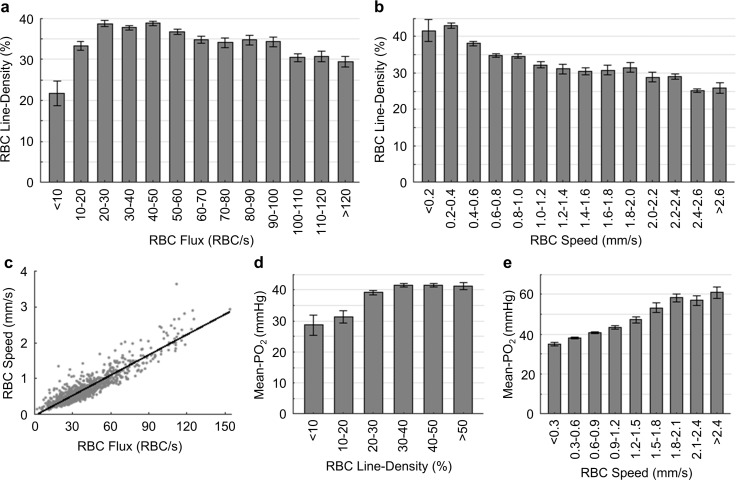
Figure 7—figure supplement 2. Pairwise relations between capillary RBC flux, speed, line-density and Mean-PO2.

Figure 7—figure supplement 2.

The analysis in (a–e) was made with the measurements from 978 capillary segments collected in cortical layers I-V, across n = 15 mice. Data are expressed as mean ± SEM. In (c), the slope of the linear regression line was calculated as ~0.02 mm/RBC (R2 =~ 0.84).
Figure 7—figure supplement 3. Relations between capillary RBC line-density, Mean-PO2, flux, speed and EAT.

Figure 7—figure supplement 3.

The analysis in (a–d) was made with the measurements from 373 capillary segments collected in cortical layers I-V, across n = 7 mice. Data are expressed as mean ± SEM.
Figure 7—figure supplement 4. Identification of a capillary segment having stalled RBC flow.

Figure 7—figure supplement 4.

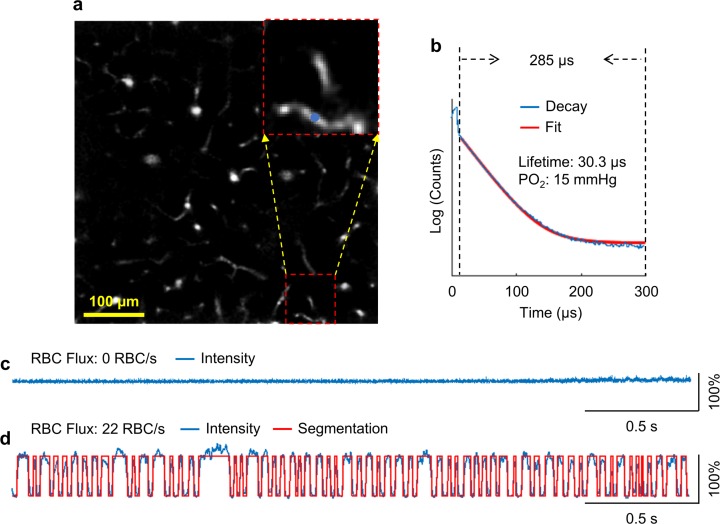
(a) A Sulforhodamine-B labeled mouse cortical microvasculature. The enlarged image includes the stalled capillary segment. The PO2 measurement was performed on the location denoted by the blue dot. (b) The average phosphorescence decay recorded on the measurement location in a. The 285-µs-long phosphorescence decay was used to calculate the phosphorescence lifetime. (c) The associated phosphorescence intensity time course (3 s trace) acquired on the measurement location in a. d. A phosphorescence intensity time course (3 s trace) acquired in an arbitrary non-stalled capillary segment as a comparison.
Figure 7—figure supplement 5. Identification of a suspected thoroughfare capillary.

Figure 7—figure supplement 5.

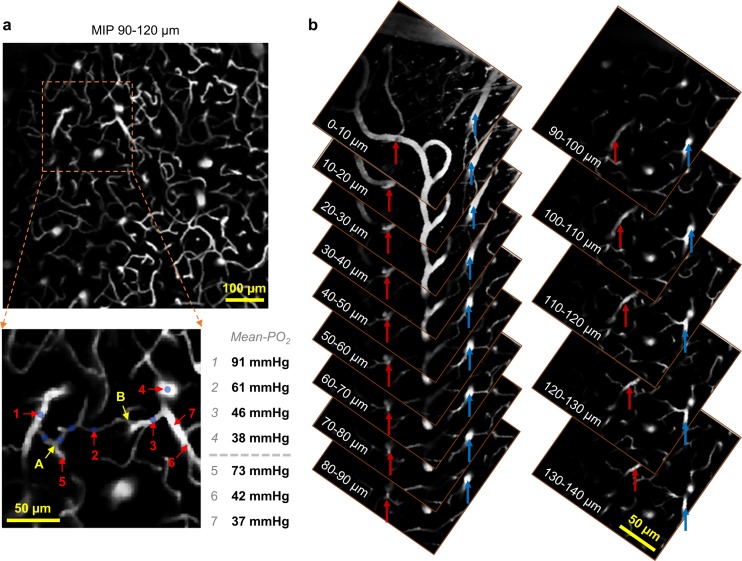
(a) Upper panel: The maximum intensity projection of the vasculature stack (90–120 µm under cortical surface). Lower panel: The enlarged image includes the vascular paths of the suspected thoroughfare capillary. PO2 measurements were performed on the segments labeled with numbers, and their values are shown next to the vascular image. (b) Tracking of the arteriole (#1 in the lower panel in a) indicated by the red arrow and the venule (#4 in the lower panel in a) indicated by the blue arrow, from the cortical depth of 140 μm to the cortical surface. The maximum intensity projection of the Sulforhodamine-B labeled microvascular stack (cortical depth: 90–120 µm) is shown in the upper panel in a). The enlarged image (lower panel in a) includes the vascular paths of the suspected thoroughfare capillary. The vessel types of the vascular segments #1 and #4 were identified as arteriole and venule, respectively, based on their PO2 values and the morphologies of their parent vessels by tracking them with the three-dimensional angiogram to the cortical surface. The complete vascular path, starting from the arteriole (#1) to the venule (#4), consists of the vascular segments marked by the blue dots. PO2 measurements were performed on the locations labeled with numbers, and their PO2 values are shown at right. The three vascular segments from A to B were identified as capillaries, based on their diameters. The Mean-PO2 of the pre-venule capillary (#2) was calculated to be 61 mmHg, much higher than the average capillary Mean-PO2 (45.6 ± 1.4 mmHg; Figure 1—figure supplement 2a). In addition, the vascular path from A to B consists of only three segments; and the physical length from A to B was estimated to be 85 µm. Therefore, this vascular path (A–B) is short in both number of capillary segments and physical length. We thus suspect that the capillary segment #2 is a thoroughfare channel that transported the highly oxygenated blood back to the venule, contributing to the increase in the venous oxygenation towards brain surface.

The average PO2 values in the diving arterioles and surfacing venules across cortical layers I-V are shown in Figure 2a. The PO2 in the diving arterioles decreased from 99 ± 4 mmHg in layer I to 84 ± 3 mmHg in layer V; while the PO2 in the surfacing venules exhibited a small increase starting from 43 ± 3 mmHg in layer V to 49 ± 4 mmHg in layer I. Similar trends were observed in the SO2 values (Figure 2b), but the levels of SO2 changes were different from those of PO2 due to the sigmoidal shape of the oxygen-hemoglobin dissociation curve (Uchida et al., 1998). The SO2 in the diving arterioles decreased slightly from 90.9 ± 0.8% in layer I to 87.1 ± 1.0% in layer V (∆SO2,A = 3.8 ± 1.2 %), while the SO2 change in the surfacing venules was larger, from 53.5 ± 1.0% in layer V to 61.8 ± 0.8% in layer I (∆SO2,V = 8.3 ± 1.1 %). Consequently, the layer-specific difference between SO2 in the diving arterioles and that in the surfacing venules increased toward deeper layers, and the depth-dependent OEFs (DOEF) in layers IV (39.9 ± 3.2%) and V (38.7 ± 3.3%) were larger than in more superficial layers, for example, layers I (32.0 ± 2.7%) and II/III (33.3 ± 2.7%; Figure 2b).

The observed increase in the DOEF with cortical depth suggests that surfacing venules received more oxygenated blood in the upper cortical layers than in the deeper layers, and that SO2 in the pre-venular capillaries (or ‘downstream capillaries’) was higher for the capillaries joining venules in the upper cortical layers than for those in the deeper layers. We revisit this observation in the later section. In addition, the relation between blood flow, oxygen extraction, and the observed SO2 changes across cortical layers was discussed.

Capillary RBC flux and PO2 are more homogenous in the deeper cortical layers

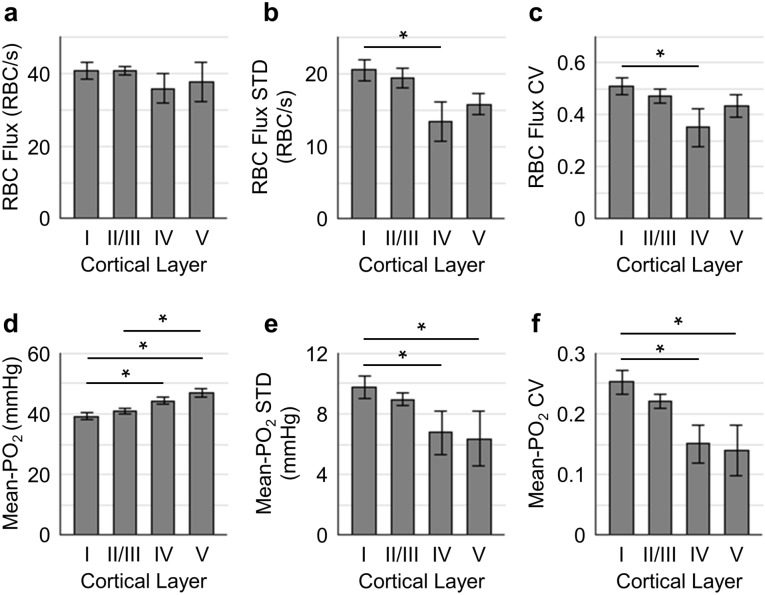
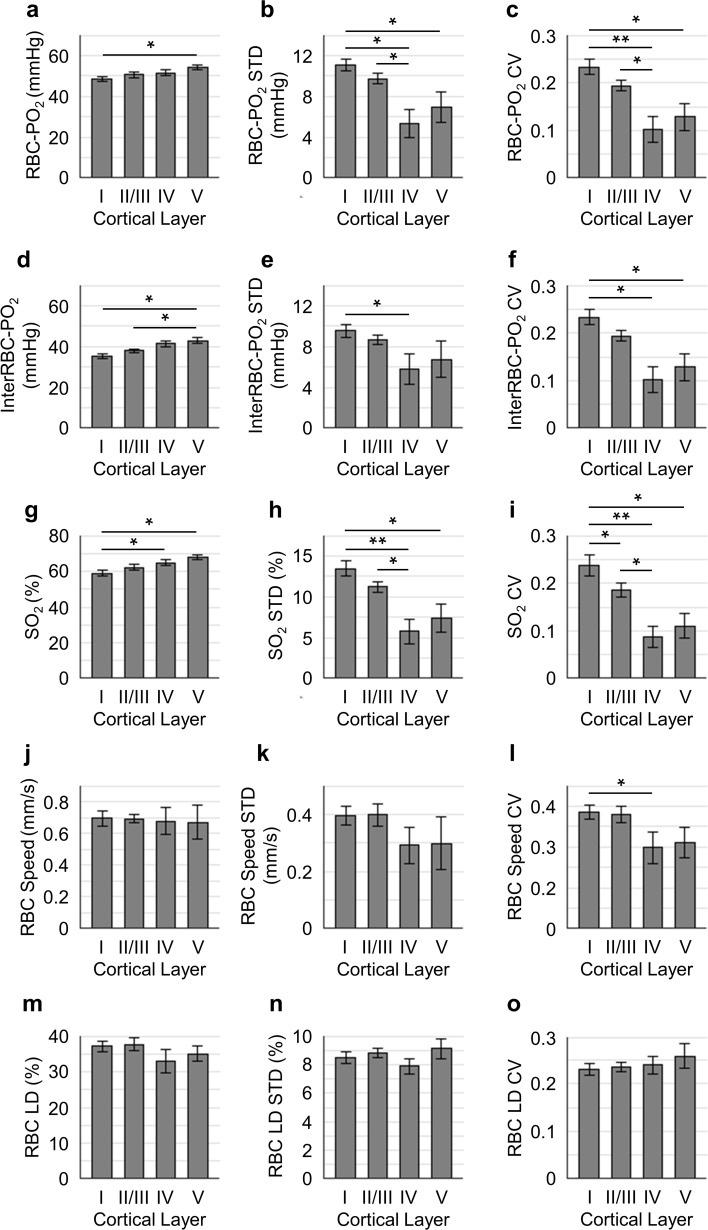
To better understand how the distributions of the capillary RBC flow and oxygenation change in order to support the heterogeneous demand for oxygen across cortical layers, we assessed both the spatial distributions and the temporal fluctuations of the resting capillary RBC flux and Mean-PO2 in layers I-V. The spatial distributions for both the mean value and heterogeneity (quantified by STD and CV across capillaries) of capillary RBC flux and Mean-PO2 in cortical layers I-V are shown in Figure 3. The RBC flux in layers IV (36 ± 4 RBC/s) and V (38 ± 6 RBC/s) were slightly lower than in layers I (41 ± 2 RBC/s) and II/III (41 ± 1 RBC/s; Figure 3a). The decrease in the RBC flux in the deeper layers might be due to the redistribution of RBCs over a denser capillary network, especially in layer IV (Blinder et al., 2013; Sakadžić et al., 2014), causing the RBC flux to be lower in individual capillaries. Importantly, both the STD and CV of RBC flux were lower in layers IV-V than in layers I-III, reaching a minimum in layer IV (Figure 3b,c); and the STD and CV of RBC flux in layer IV were significantly lower than their counterparts in layer I. This result suggests that RBC flux in the deeper cortical layers is more homogeneous, which may facilitate oxygen extraction as theoretically predicted (Hartung et al., 2018; Jespersen and Østergaard, 2012; Schmid et al., 2017). Similar trends could be observed in the distributions of capillary Mean-PO2 (Figure 3d–f), capillary RBC-PO2, InterRBC-PO2, SO2 and RBC speed (Figure 3—figure supplement 1). We did not find statistically significant difference in absolute RBC line-density, and its STD and CV between different cortical layers (Figure 3—figure supplement 1).

Figure 3. Spatial variations of capillary RBC flux and Mean-PO2 as a function of cortical depth.

The panels (a–c) and (d-f) show the dependence of the absolute values, standard deviations (STDs) and coefficients of variance (CVs) of capillary RBC flux and Mean-PO2 on cortical layer, respectively. The absolute values, STDs and CVs were calculated across capillaries. The analysis in (a–f) was made with 400, 356, 118, and 104 capillaries measured in cortical layers I, II/III, IV and V, respectively, across n = 15 mice. Data are expressed as mean ± SEM. Statistical comparisons were carried out using ANOVA followed by Tukey HSD post hoc test. The asterisk symbol (*) indicates p<0.05.

Figure 3—source data 1. Measurements of Mean-PO2, RBC-PO2, InterRBC-PO2 and RBC flux acquired in 978 microvascular segments over n = 15 mice.
elife-42299-fig3-data1.xlsx (119.1KB, xlsx)
DOI: 10.7554/eLife.42299.009

Figure 3.

Figure 3—figure supplement 1. Distributions of capillary RBC-PO2, InterRBC-PO2, SO2, RBC speed, and line-density, and their STDs and CVs as a function of cortical layer.

Figure 3—figure supplement 1.

(a-c) Distributions of the absolute capillary RBC-PO2, RBC-PO2 STD and CV as a function of cortical layer, respectively. (d-f) Distributions of the absolute InterRBC-PO2, InterRBC-PO2 STD and CV as a function of cortical layer, respectively. (g–i) Distributions of the absolute capillary SO2, SO2 STD and CV as a function of cortical layer, respectively. (j–l) Distributions of the absolute capillary RBC speed, speed STD and CV as a function of cortical layer, respectively. (m–o) Distributions of the absolute capillary RBC line-density (LD), LD STD and CV as a function of cortical layer, respectively. The analysis in a–o was made with the measurements acquired in 400, 356, 118 and 104 capillary segments in cortical layers I, II/III, IV and V, respectively, across n = 15 mice. Data are expressed as mean ± SEM. Statistical comparisons were carried out using ANOVA followed by Tukey HSD post hoc test. The single-asterisk symbol (*) indicates p<0.05; the double-asterisk symbol (*) indicates p<0.001.

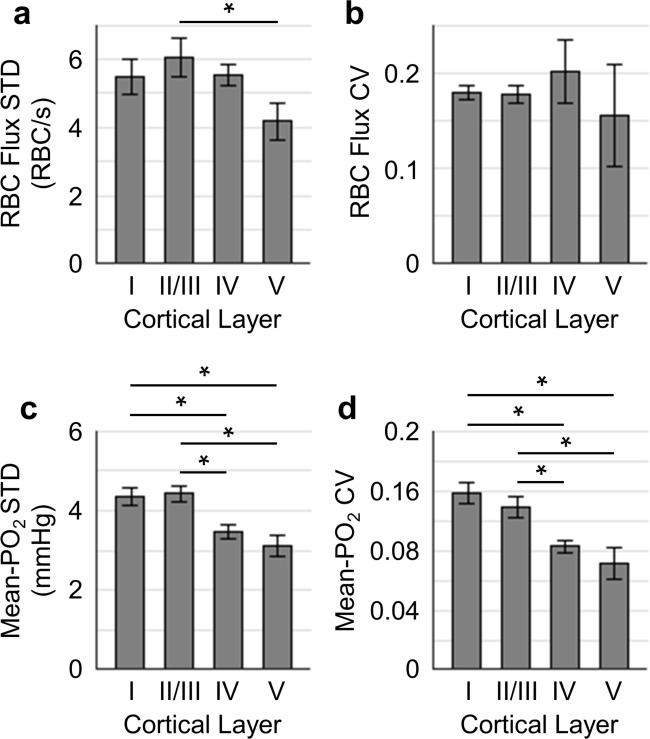
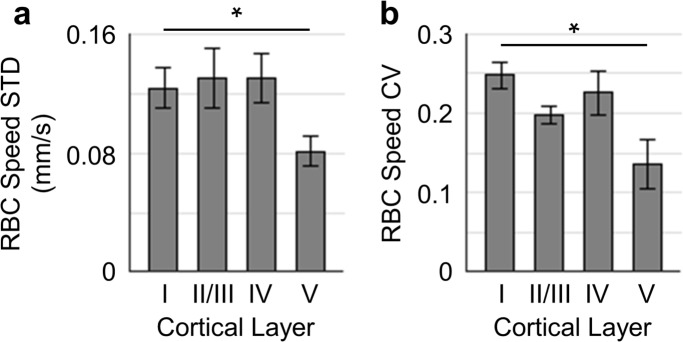
Next, we assessed the temporal fluctuations of RBC flux and Mean-PO2 within individual capillaries, extracted from the 9-s-long acquisitions (Figure 4). The level of the temporal fluctuation (quantified by STD and CV) of capillary RBC flux (Figure 4a,b) decreased only in layer V, while the temporal fluctuation of the capillary Mean-PO2 was significantly attenuated in layers IV and V (Figure 4c,d). Similar trend was also observed in RBC speed (Figure 4—figure supplement 1), but not in RBC line-density (not shown). However, the mean STDs and CVs of each observable were much smaller than that calculated across different capillaries (Figure 3).

Figure 4. Temporal fluctuations of RBC flux and Mean-PO2 within individual capillaries in cortical layers I-V.

Panels (a–b) and (c–d) show the layer-dependent standard deviations (STDs) and coefficients of variance (CVs) of the temporal fluctuations of RBC flux and Mean-PO2, respectively. The STD and CV of each observable for each capillary were calculated based on the 9-s-long time course. The analysis in (a–d) was made with 130, 140, 63 and 40 samples, collected in cortical layers I, II/III, IV and V, respectively, across n = 7 mice. Each sample corresponds to a 9-s-long, 15-time-point measurement acquired in each capillary. Data are expressed as mean ± SEM. Statistical comparisons were carried out using ANOVA followed by Tukey HSD post hoc test. The asterisk symbol (*) indicates p<0.05.

Figure 4.

Figure 4—figure supplement 1. Temporal fluctuations of RBC speed within individual capillaries in cortical layers I-V.

Figure 4—figure supplement 1.

Panels (a–b) show the layer-dependent standard deviations (STDs) and coefficients of variance (CVs) of the temporal fluctuations of RBC speed. The STD and CV of each observable for each capillary were calculated based on the 9-s-long time course. This analysis was made with 130, 140, 63 and 40 samples, collected in cortical layers I, II/III, IV and V, respectively, across n = 7 mice. Each sample corresponds to a 9-s-long, 15-time-point measurement acquired in each capillary. Data are expressed as mean ± SEM. Statistical comparisons were carried out using ANOVA followed by Tukey HSD post hoc test. The single-asterisk symbol (*) indicates p<0.05.

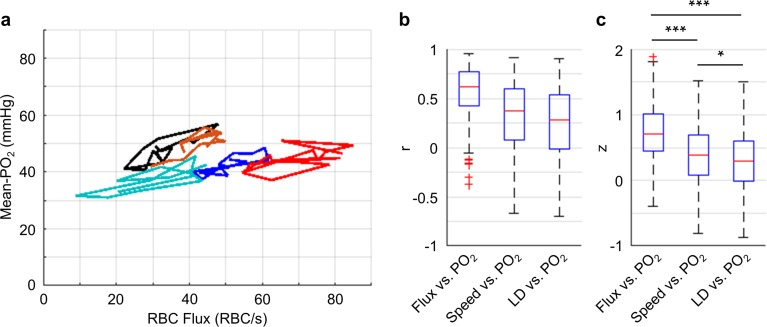
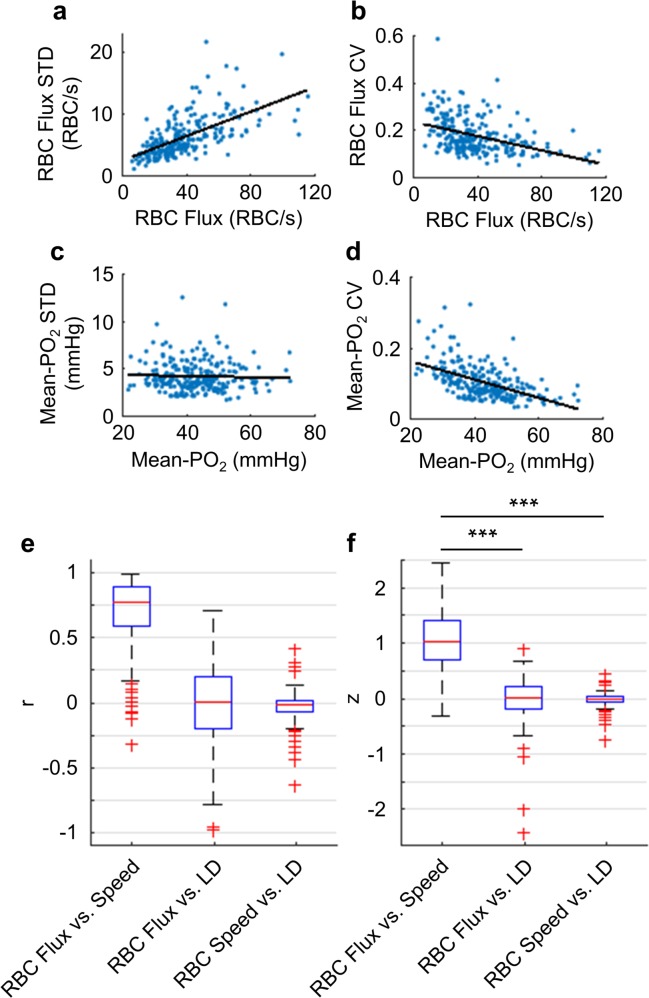
Importantly, our measurements revealed that the Mean-PO2, measured within individual capillaries as a function of time, was best correlated with RBC flux (Figure 5). We calculated the Pearson correlations between the temporal fluctuations (9-s-long traces with 0.6 s steps) of RBC flux, speed, line-density and the temporal fluctuation of the Mean-PO2. All these parameters were simultaneously measured in each assessed capillary (n = 373 capillaries). The correlation coefficient r between the temporal fluctuations of the RBC flux and Mean-PO2 (median value = 0.71) was higher than between the RBC speed and Mean-PO2 (median value = 0.37), and between line-density and Mean-PO2 (median value = 0.29). The r values were converted to Fisher z values to compare for statistical difference (Diamond et al., 2006). Mean-PO2 was significantly stronger correlated with RBC flux than with RBC speed and line-density (Figure 5c). The results of the pairwise correlations between the temporal fluctuations of capillary RBC flux, speed and line-density are presented in Figure 5—figure supplement 1.

Figure 5. Correlations between the temporal fluctuations of capillary RBC flux, speed, line-density and Mean-PO2.

(a) Temporal evolutions (9-s-long traces with 0.6 s steps) of RBC flux and Mean-PO2 from five representative capillaries. For each capillary, its Mean-PO2 as a function of RBC flux is represented by a different line color; the consecutive time points are connected to illustrate the temporal trajectory of the variation. (b) Boxplots of the pairwise correlation coefficients (r) between the temporal fluctuations of capillary RBC flux, speed, line-density (LD) and Mean-PO2. (c) Boxplots of the Fisher z values calculated based on the r values in b. The analysis in b and c was made with 373 capillaries, collected in cortical layers I-V, across n = 7 mice. Statistical comparisons were carried out using ANOVA followed by Tukey HSD post hoc test. The single-asterisk symbol (*) indicates p<0.05; the triple-asterisk symbol (***) indicates p<0.0001.

Figure 5.

Figure 5—figure supplement 1. Quantifications of the temporal fluctuations of capillary RBC flux, speed, line-density and Mean-PO2.

Figure 5—figure supplement 1.

(a-d) Correlations between the STDs and CVs of the temporal fluctuations of capillary RBC flux and Mean-PO2 and their mean absolute values, calculated based on the 9-s-long measurements. The data points are represented by the blue dots. The linear regression lines of the correlations are in black. The computed slope (and R2) values of the linear regressions in panels a–d are: 0.1 (R2 = 0.4),–0.002 s∙RBC−1 (R2 = 0.17),–0.01 (R2 = 0.001) and −0.003 mmHg−1 (R2 = 0.3), respectively. (e–f) Pairwise correlations between the temporal fluctuations of RBC flux, speed and line-density (LD). The panel e presents the correlation coefficients (r); the panel f presents the Fisher z values. The analysis in a–f was made with the measurements from 373 capillary segments in cortical layers I-V, across n = 7 mice. Statistical comparisons were carried out using ANOVA followed by Tukey HSD post hoc test. The triple-asterisk symbol (***) indicates p<0.0001.

Our depth-resolved measurements across capillaries revealed that the distributions of RBC flux and Mean-PO2 became more homogeneous in layers IV and V compared to layers I-III. This increase in the spatial homogeneity of the capillary RBC flow and oxygenation (Figure 3) was accompanied by an increase in the depth-dependent OEF (Figure 2). We also observed attenuation of the temporal fluctuations of these parameters in layers IV and V compared to layers I-III (Figure 4), although with much lower amplitudes than seen in the corresponding spatial variations (Figure 3). Finally, the time-course cross-correlation analysis revealed that the Mean-PO2 was best correlated with the RBC flux, as opposed to RBC speed and line-density (Figure 5).

Intracapillary resistance of oxygen transport to tissue decreases in deeper cortical layers

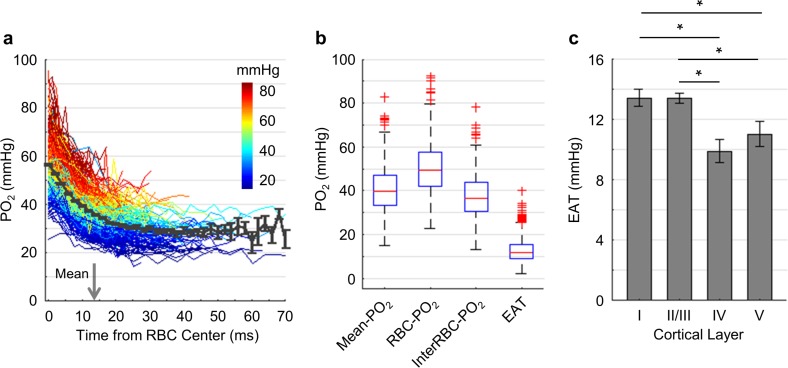
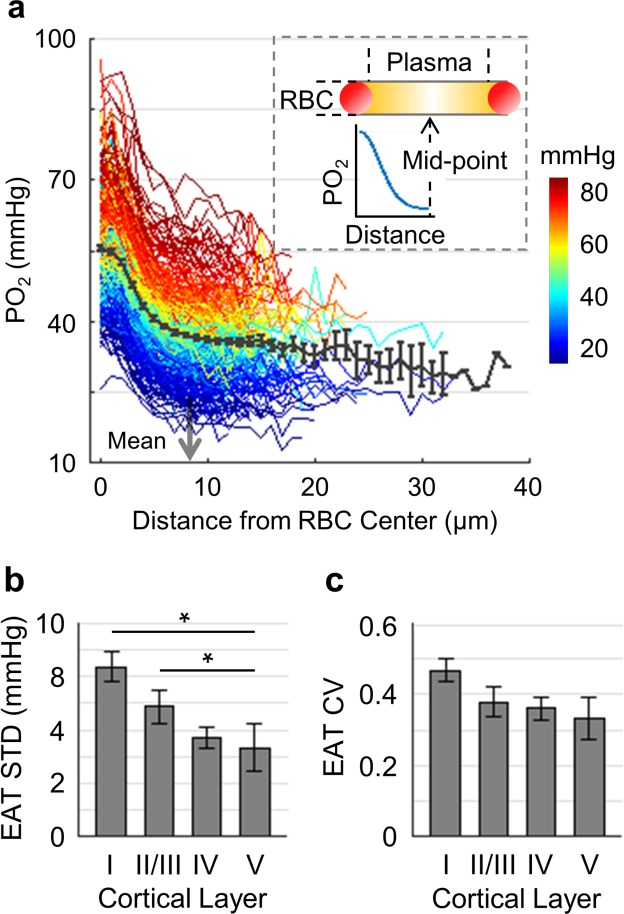
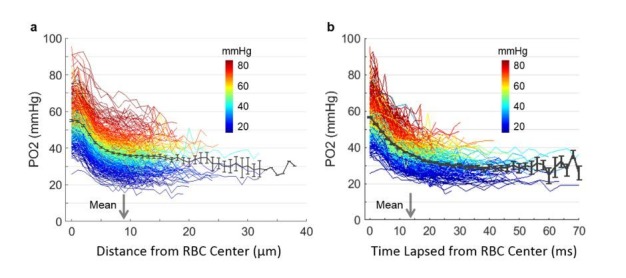
We now turn to the analysis of EAT that reflect the PO2 modulation in capillaries due to the passages of individual RBCs. EAT has been observed in the peripheral and brain capillaries (Barker et al., 2007; Golub and Pittman, 2005; Lecoq et al., 2009; Lecoq et al., 2011; Lyons et al., 2016; Parpaleix et al., 2013). According to the modeling studies (Barker et al., 2007; Golub and Pittman, 2005; Hellums, 1977), larger EAT was associated with higher intracapillary resistance to oxygen transport to tissue from capillaries. Since cortical layers exhibit differences in the neuronal and vascular densities and possibly in oxygen metabolism, we examined whether EAT would differ in different cortical layers. Benefitting from the superior properties of Oxyphor2P, we were able to measure PO2 in the blood plasma as a function of time (Figure 6a) and distance (Figure 6—figure supplement 1) from the center of the nearest RBC in a larger number of capillaries. In this work, PO2 gradients were measured in a larger number of capillaries (Figure 6a; 373 capillaries across n = 7 mice) and with greater imaging depth (from cortical surface to 600 μm) in comparison to the previous studies (Lecoq et al., 2011; Lyons et al., 2016; Parpaleix et al., 2013). Averaging over all the assessed capillaries, PO2 (black curve in Figure 6a) decreased from 56.8 ± 0.4 mmHg at t = 0 ms to 28.6 ± 2.6 mmHg at t = 50 ms. The mean half-time-gap between adjacent RBCs was estimated to be 13.5 ms (denoted by the gray arrow in Figure 6a). The median values of capillary Mean-PO2, RBC-PO2, InterRBC-PO2 and EAT were 39.4 mmHg, 49.2 mmHg, 36.3 mmHg and 11.7 mmHg, respectively (Figure 6b). Interestingly, we found a significant reduction in EAT in cortical layers IV (9.9 ± 0.8 mmHg) and V (11.0 ± 0.8 mmHg) compared to layers I (13.4 ± 0.6 mmHg) and II/III (13.3 ± 0.3 mmHg; Figure 6c), suggesting that the intracapillary resistance to oxygen transport to tissue may be lower in the deeper cortical layers, thus facilitating oxygen delivery to brain tissue according to the biophysical modeling (Hellums, 1977). In addition, we observed reduction in EAT STD and CV from layer I to layer V (Figure 6—figure supplement 1).

Figure 6. Dependence of EAT on cortical layer.

(a) Intracapillary PO2 gradients. The PO2 gradients measured in different capillaries (373 capillaries across n = 7 mice) are color-coded based on their Mean-PO2 values. The black curve represents the average PO2 gradient. The gray arrow denotes the mean half-time-gap between adjacent RBCs (13.5 ms). (b) Boxplots of capillary Mean-PO2, RBC-PO2, InterRBC-PO2 and EAT. (c) Dependence of EAT on cortical layer. The analysis in c was made with 130, 140, 63 and 40 capillaries measured in cortical layers I, II/III, IV and V, respectively, across n = 7 mice. Data are expressed as mean ± SEM. Statistical comparisons were carried out using ANOVA followed by Tukey HSD post hoc test. The single-asterisk symbol (*) indicates p<0.05.

Figure 6.

Figure 6—figure supplement 1. Dependence of EAT STD and CV on cortical layer.

Figure 6—figure supplement 1.

(a) The PO2 gradients were measured in 373 capillaries across n = 7 mice, with imaging penetration down to 600 µm in the cortex. The capillaries are color-coded based on their Mean-PO2 values. The inset schematically illustrates the intracapillary PO2 gradient. Shown in this figure, PO2 in the blood plasma was grouped as a function of distance to the nearest RBC centers. Averaging over all the assessed capillaries, PO2 (black curve) decreased from 55.0 ± 0.6 mmHg at the RBC center to 30.0 ± 7.8 mmHg, 30 µm away from the RBC center, where the PO2 measurements were typically associated with the low-line-density capillaries. However, in most capillaries the half-distance between adjacent RBCs was much smaller than 30 µm. The mean half-distance between adjacent RBCs was estimated to be 8.0 ± 0.7 µm (denoted by the gray arrow). (b and c) Dependence of EAT STD and CV on cortical layer, respectively. The analysis in b and c was made with 130, 140, 63 and 40 capillaries measured in cortical layers I, II/III, IV and V, respectively, across n = 7 mice. Data are expressed as mean ± SEM. Statistical comparisons were carried out using ANOVA followed by Tukey HSD post hoc test. The single-asterisk symbol (*) indicates p<0.05.

Low oxygen extraction along the superficial capillary paths contributes to the increase in the mean venular SO2 toward cortical surface

To better understand why SO2 in the ascending venules increased toward the cortical surface (Figure 2), we investigated the distributions of capillary flow and oxygenation along the capillary paths in the upper cortical layers. For this analysis, capillaries in the top 300 μm of the cortex (layers I-III) were grouped based on their branching orders into two main groups: 1) ‘upstream’ capillaries with branching orders A1-A3, which are closer to the arteriolar side of the network, and 2) ‘downstream’ capillaries with branching orders V1-V3, which are closer to the venular side of the network. Due to the limited number of capillary segments with assigned branch orders, A1-A3 and V1-V3 capillaries were grouped together to enable group comparisons with stronger statistical power.

The average values of Mean-PO2, SO2, EAT, RBC flux and line-density from the combined A1-A3 (upstream) and V1-V3 (downstream) capillaries are presented in Figure 7a–e. The average Mean-PO2 in the A1-A3 capillaries (64.4 ± 2.4 mmHg) in layers I-III was, as expected, significantly higher than that in the V1-V3 capillaries (41.8 ± 0.9 mmHg; Figure 7a), suggesting that a large fraction of oxygen has been extracted along the capillary paths (i.e. from A1 to V1). Indeed, the average SO2 in the A1-A3 capillaries (77.6 ± 1.7%) was significantly higher than that in the V1-V3 capillaries (67.3 ± 1.2%; Figure 7b). Provided that the average SO2 in the A1 capillary segments was 81.0 ± 2.3%, and that the SO2’s in the arterioles (SO2,A) and venules (SO2,V) at cortical surface were 91.0 ± 0.8% and 62.0 ± 0.8%, respectively (Figure 2b), we estimated that the decrease in SO2 from the pial arterioles to the A1 capillary segments in the upper 300 μm of the cortex accounted for 34% (or 1/3) of the total extracted oxygen. Here, the total extracted oxygen was calculated as the A-V difference in SO2 at the cortical surface (ΔSO2,A-V = 30 %; Figure 2b). Therefore, 66% (or 2/3) of the oxygen extraction in awake mice took place after the arterioles. This is in contrast to our previous study in anesthetized mice, which reported that ~ 50% of the oxygen delivered to brain tissue was extracted after the arterioles (Sakadžić et al., 2014). The average V1 capillary SO2 in layers I-III was 65 ± 1.9%, higher than that in the ascending venules, both in layer I (62 ± 0.8%) and layer II/III (59 ± 0.4%; Figure 2b). Accordingly, capillaries that feed the surfacing venules in layers I-III apparently do so with more oxygenated blood, contributing to the increase in the venular SO2 toward brain surface (Figure 2b).

The RBC flux in the A1-A3 capillaries (97 ± 6 RBC/s) was ~2.7 times higher than that in the V1-V3 capillaries (36 ± 2 RBC/s; Figure 7d). Since blood flow obeys the principle of mass conservation (i.e. the numbers of RBCs entering the capillary paths per unit time on the arteriolar side and exiting from the venous side must be equal), this result is in agreement with the previously observed ~3 fold-greater number of V1 than A1 capillaries in mouse cortex (Nguyen et al., 2011). Furthermore, the RBC speed in the A1-A3 capillaries (1.9 ± 0.2 mm/s) had a similar ratio (~3.2 times) to that in the V1-V3 capillaries (0.6 ± 0.1 mm/s; Figure 7—figure supplement 1), which is also consistent with the strong correlation between RBC flux and speed (Figure 7—figure supplement 2) (Desjardins et al., 2014; Kleinfeld et al., 1998).

We found strong positive correlations between the capillary RBC flux and both Mean-PO2 and SO2 in the downstream (V1-V3) capillaries, but not in the upstream (A1-A3) capillaries (Figure 7f,g), suggesting that a positive correlation between the RBC flux and oxygenation may be gradually building up along the capillary paths. In addition, we observed very heterogeneous distributions of both Mean-PO2 (from ~11 mmHg to ~68 mmHg) and RBC flux (from ~30 RBCs/s to ~110 RBCs/s) in the V1 capillaries (Figure 7h,i). Lastly, the V1 capillary RBC flux was correlated positively with the ratio of the V1 capillary Mean-PO2 to the PO2 in the adjacent post-capillary venules (PCV PO2) (Figure 7j). Therefore, heterogeneous oxygen delivery was taking place along different capillary paths, such that V1 capillaries had various levels of RBC flux and PO2. However, the V1 capillaries with higher RBC flux were better oxygenated, contributing more to the increase in the PCV oxygenation.

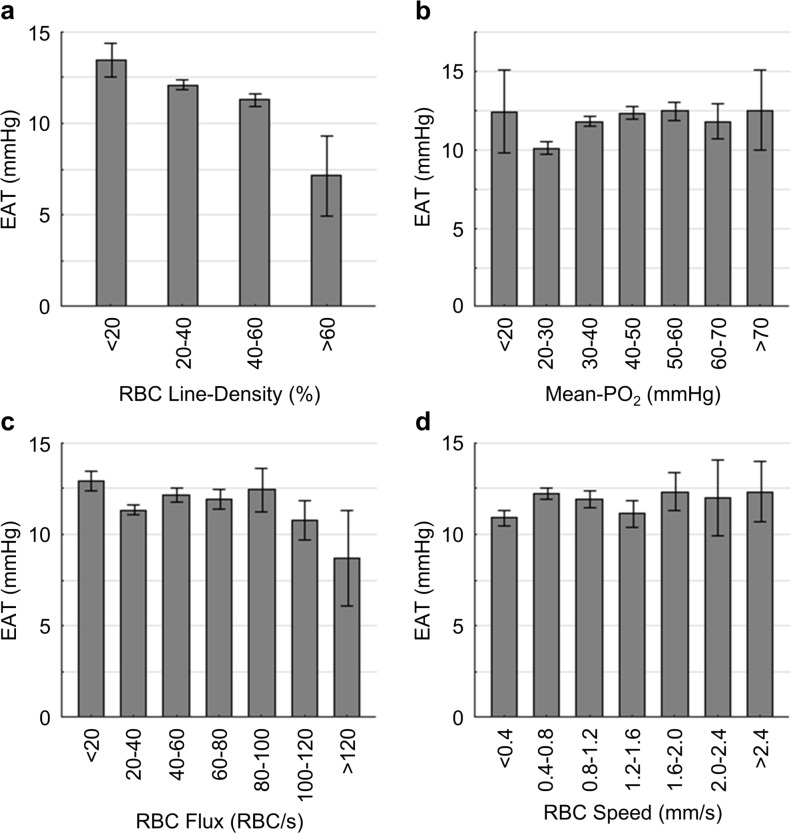
Finally, EAT observed in the A1-A3 capillaries (10.9 ± 1.9 mmHg) was noticeably smaller than in the V1-V3 capillaries (16.6 ± 2.3 mmHg; Figure 7c), although this difference did not reach statistical significance (p=0.09). From both this work (Figure 7—figure supplement 3) and a previous study (Lyons et al., 2016), EAT did not exhibit any obvious dependence on the Mean-PO2, RBC flux or speed, but they were correlated negatively with line-density. Nevertheless, the observed trend that the average EAT in the A1-A3 capillaries was smaller than that in the V1-V3 capillaries is unlikely to be related to line-density, as the difference between the upstream and downstream line-density is insignificant (Figure 7e).

Discussion

We have performed measurements of absolute intra-vascular PO2 in arterioles, venules and a large number of capillaries (6544 capillaries across n = 15 mice), as well as EAT, RBC flux, speed and line-density in a subset of capillaries (978 capillaries across n = 15 mice). These parameters were measured simultaneously in the whisker barrel cortex in head-restrained awake C57BL/6 mice and thus were free of the confounding effects of anesthesia on neuronal activity, CBF and brain metabolism.

A new two-photon-excitable phosphorescence oxygen probe – Oxyphor2P was used in this study. Oxyphor2P belongs to the class of dendritically protected oxygen probes (Lebedev et al., 2009), and it is built around a newly developed Pt tetraarylphthalimidoporphyrin (PtTAPIP) (Esipova et al., 2017). In comparison to its predecessor (PtP-C343) (Finikova et al., 2008), Oxyphor2P exhibits red-shifted two-photon excitation and emission maxima, higher phosphorescence quantum yield and larger two-photon absorption cross-section (Esipova et al., 2019). Furthermore, in contrast to PtP-C343 the phosphorescence decay of Oxyphor2P exhibits well-defined single-exponential kinetics, which helps improve the accuracy of PO2 calculation. These improvements of Oxyphor2P facilitated large-scale sampling of both capillary RBC flow and PO2 deeper in the brain, for example, 600 µm vs. 450 µm (Lyons et al., 2016; Sakadžić et al., 2014), and with higher signal-to-noise ratios, which, in turn, powered the statistical analyses beyond what could be achievable with PtP-C343 (Devor et al., 2011; Lecoq et al., 2011; Lyons et al., 2016; Parpaleix et al., 2013; Sakadzić et al., 2010; Sakadžić et al., 2014). In addition, the very high phosphorescence quantum yield of Oxyphor2P (Esipova et al., 2017; Esipova et al., 2019) enabled detection of RBC-passages in capillaries based on phosphorescence alone, without the need to enhance the signal from the blood plasma using additional chromophores (Lyons et al., 2016).

We first assessed oxygenation in the diving arterioles and surfacing venules and observed a decrease in PO2 with cortical depth for both vessel types (Figure 2a). The PO2 decrease in the diving arterioles between layer I and V was about 15 mmHg, equivalent to the difference in SO2 of 3.8%. This modest oxygen extraction along the diving arterioles implies that much more oxygen was extracted from the rest of the microvascular network, including arteriolar branches, capillaries and potentially venules. Previous measurements performed in mice (Kisler et al., 2017; Moeini et al., 2018) and rats (Devor et al., 2011; Sakadžić et al., 2016) reported pronounced PO2 gradients in the periarteriolar tissue around the cortical diving arterioles, implying extraction of oxygen from cortical diving arterioles. Specifically, a significantly steeper decrease in PO2 with cortical depth was observed directly in diving arterioles in isoflurane-anesthetized mice by Kazmi et al. (2013) and indirectly, based on the depth dependence of the extravascular (tissue) PO2 measured immediately next to the diving arterioles, in α-chloralose anesthetized rats by Devor et al. (2011). The most likely reason for these discrepancies is the higher suppression of CBF than CMRO2 under different anesthesia regimes. In awake mice, Lyons et al. (2016) measured approximately constant PO2 in the diving arterioles over cortical depth of 0–400 µm. This result is consistent with our current observation that in awake mice, the amount of oxygen extracted along the diving arterioles over depth represents a small fraction of the total amount of oxygen transported by these arterioles.

In contrast to the moderate PO2 decrease along the penetrating arterioles, the decrease in the venular PO2 from layer I to V was much smaller (~6 mmHg), but resulted in a larger fractional decrease in SO2 (8.3%) than in the penetrating arterioles (Figure 2b). An increase in PO2 in ascending venues towards the cortical surface has been previously observed in isoflurane-anesthetized mice (Sakadzić et al., 2010). However, the PO2 values, measured previously along the ascending venules in the fore-paw and hind-paw regions of the somatosensory cortex in awake mice, were reported to be nearly constant (Lyons et al., 2016). The difference between these observations may be attributed to the difference in the studied cortical regions and/or to the lower measurement accuracy associated with the old probe – PtP-C343, because of its lower brightness and inability to resolve small PO2 changes. In addition, some discrepancies in the absolute baseline PO2 in arterioles and venules at different depths were observed between our present and some previous studies (Kazmi et al., 2013; Lecoq et al., 2011; Lyons et al., 2016; Parpaleix et al., 2013; Sakadzić et al., 2010). Different anesthesia regimes, different cortical areas and, most importantly, use of anesthetized vs. awake animals would be the most obvious factors underlying the observed discrepancies. Furthermore, cortical temperature typically was not controlled in the previous studies, while the presence of a cranial window can cause reduction in the cortical temperature (Shirey et al., 2015), especially when imaging is carried out using a non-heated water-immersion objective. Temperature affects all physiological parameters and chemical properties, including O2 diffusion and solubility, hemoglobin affinity to O2, CBF, CMRO2 and the triplet decay time of the oxygen probe (Benesch et al., 1969; Croughwell et al., 1992; Finikova et al., 2008; Hanks and Wallace, 1949; Jones and Siegel, 1969; Pray, 1952; Rosomoff and Holaday, 1954; Rossing and Cain, 1966; Soukup et al., 2002) – all of which may affect the experimental results.

A faster decrease in SO2 with cortical depth in the ascending venules than in the penetrating arterioles resulted in a higher depth-dependent OEF in the deeper cortical layers, reaching the maximum in layer IV (Figure 2b). In addition, the total blood flow may be higher in layer IV than in layer I, as suggested by the measurements of capillary RBC flux (~13% lower in layer IV than in layer I; Figure 3a) and capillary segment density (~50% higher in layer IV than in layer I; Gould et al., 2017; Sakadžić et al., 2014). Altogether, this implies that oxygen extraction was higher in the deeper cortical layers, which would be in agreement with the findings that layer IV of mouse cortex has the highest neuronal and capillary densities (Blinder et al., 2013; Lefort et al., 2009; Patel, 1983; Wu et al., 2016), and that the cells in layer IV exhibit the highest cytochrome oxidase labeling activity, suggestive of the highest oxidative metabolism (Land and Simons, 1985). We estimated the depth-dependent OEF, which implies existence of a laminar flow pattern in the brain cortical microvascular network. This was recently confirmed by Schmid et al. (2017), who applied numerical modeling of blood flow and tracking of the trajectories of individual RBCs in realistic mouse cortical vasculature, which led to conclusion that RBCs predominantly flow in plane and no significant RBC flow in the direction of cortical depth takes place. Since oxygen extraction depends on both total blood flow and arterio-venous oxygen saturation difference, it will be important in the future to further experimentally investigate the total blood flow differences across different cortical layers.

The mean capillary RBC flux decreased only slightly with cortical depth, without reaching statistically significant difference across layers I-V (Figure 3a). This might be due to the redistribution of the blood flow over the denser capillary network in the deeper cortical layers, especially in layer IV (Blinder et al., 2013; Sakadžić et al., 2014; Wu et al., 2016), causing the RBC flux to be lower in individual capillaries. The observed mean capillary RBC flux (41.5 ± 1.2 RBCs/s; Figure 1—figure supplement 2) is in good agreement with the value of 41.9 ± 1.8 RBCs/s, reported by Lyons et al. (2016), and somewhat lower than ~48 RBC/s reported by Moeini et al. (2018) for somatosensory cortex in awake mice. The average capillary Mean-PO2 increased slightly by ~7 mmHg from layer I to V (Figure 3d), which is in agreement with the previously reported increase in capillary Mean-PO2 in both awake (Lyons et al., 2016) and isoflurane-anesthetized mice (Sakadžić et al., 2014) across the upper 400 µm of the cortex. One potential explanation for this increase could be related to the finding by Blinder et al. (2013), who reported that, in the upper 600 µm of somatosensory cortex, the probability of penetrating arterioles giving off side branches increased with cortical depth, whereas the probability for the ascending venules decreased with depth. This suggests that the ratio between the number of the more oxygenated (upstream) capillary branches and that of the less oxygenated (downstream) capillary branches increases with depth, contributing to the higher capillary PO2 at greater depth.

Importantly, we found that the distributions of capillary RBC flux, speed and Mean-PO2 were more homogeneous in cortical layers IV and V (Figure 3). The layer-dependent homogeneity of blood flow has been predicted by modeling the blood flow distribution in large-scale mouse brain microvasculature covering the whisker barrel cortex (Hartung et al., 2018). Both analytical and numerical models of oxygen advection and diffusion in microvascular networks predict that more homogenous capillary blood flow facilitates oxygen delivery to tissue (Jespersen and Østergaard, 2012; Østergaard et al., 2013; Østergaard et al., 2014a; Østergaard et al., 2014b; Rasmussen et al., 2015). Indeed, capillary blood flow homogeneity, measured by the distribution of capillary transit time or RBC flux during functional activation in the brain in healthy anesthetized animals, have been reported previously (Gutiérrez-Jiménez et al., 2016; Lee et al., 2016; Stefanovic et al., 2008). Interestingly, capillary flow homogeneity was absent in the mouse model of Alzheimer’s disease (Gutiérrez-Jiménez et al., 2018), while increased capillary blood flow heterogeneity was found in patients of Alzheimer’s disease (Eskildsen et al., 2017; Nielsen et al., 2017), suggesting a possible link between disturbed capillary flow patterns, reduced oxygen supply to tissue, and the progression of neurodegeneration. Our observations are in agreement with the previously reported lower capillary transit time heterogeneity in cortical layers IV and V than in the upper layers in anesthetized mice (Merkle and Srinivasan, 2016). Furthermore, capillary Mean-PO2 also exhibited a similar homogeneous trend (Figure 3e,f). This could be expected since capillary RBC flow is correlated positively with Mean-PO2 (Figure 7—figure supplement 2) (Lyons et al., 2016).

The temporal resolution of our measurements (0.6 s) ensured that the blood flow and PO2 fluctuations due to cardiac and respiratory cycles, as they occurred to awake mice, were averaged out, but it is sufficient to capture the dynamics related to the rate of oxygen consumption, which could be estimated as the time for tissue PO2 to drop to zero after blood flow stoppage. As reported in cats, that time was at least several seconds (Acker and Lübbers, 1977; Whalen and Nair, 1975). In addition, blood flow responses to neuronal activation could typically be resolved with such temporal resolution (Uhlirova et al., 2016). However, it is important to note that our experiments probed just one frequency window within a wide range of both faster and slower fluctuations present in the microvascular network. The cause of the dampening of the temporal fluctuations with depth is unclear. It may be related to the anatomical and functional differences between cortical layers; it also can be due to the expected dampening along the vascular paths if the temporal fluctuations originate from the upstream arteriolar blood flow.

We observed strong positive correlations between the temporal fluctuations of capillary RBC flux and Mean-PO2 (Figure 5). This observation is in agreement with the previously reported positive correlation between the fluctuations of RBC flux and extravascular (tissue) PO2 measured adjacent to the capillaries in rat tumor, although the latter occurred at a lower frequency range (Braun et al., 1999; Kimura et al., 1996). Importantly, the fluctuation of capillary Mean-PO2 was found to be correlated positively with the fluctuation of RBC flux significantly stronger than with the fluctuations of RBC speed or line-density (Figure 5b,c), although these three variables are closely related as RBC flux is proportional to the product of RBC speed and line-density (Kleinfeld et al., 1998). This result could be expected, since most oxygen in the blood is bound to the hemoglobin inside RBCs (Pittman, 2011). We also observed strong positive correlation between the fluctuations of RBC flux and speed, but the fluctuations of line-density was poorly correlated with both of them (Figure 5—figure supplement 1). These correlations between the temporal fluctuations are in agreement with the trends measured using the populations of capillaries (Figure 7—figure supplement 2) as well as with the previous studies (Kleinfeld et al., 1998; Santisakultarm et al., 2012; VanTeeffelen et al., 2008). Despite poor correlation between the RBC flux and line-density, we observed reasonably positive correlation between the temporal fluctuations of capillary Mean-PO2 and line-density (Figure 5). Similarly, shown in Figure 7—figure supplement 2 and in Lyons et al. (2016), capillary Mean-PO2 and line-density, measured in the populations of capillaries, were also positively correlated, emphasizing the specific role of RBC line-density in oxygen transport (Lücker et al., 2017).

Capillary PO2 gradients were measured to assess the intracapillary resistance to oxygen delivery to tissue and to calculate capillary SO2 (Figure 6). For measuring EAT, we followed the previously developed methods (Lecoq et al., 2011; Lyons et al., 2016; Parpaleix et al., 2013). Compared to the previous studies performed with the old probe – PtP-C343 (Lecoq et al., 2011; Lyons et al., 2016; Parpaleix et al., 2013), the superior properties of Oxyphor2P enabled us to measure PO2 gradients in a much larger number of capillaries over a greater cortical depth (down to 600 µm below the cortical surface) and using a shorter acquisition time (9 s) per measurement location. In agreement with Lyons et al. (2016), we observed EAT in capillaries (Figure 6), although the magnitude was lower than previously reported. EAT did not appear to depend significantly on RBC flux, speed or Mean-PO2, but were correlated negatively with the line-density (Figure 7—figure supplement 3). Our measurements are in agreement with the previous observations (Lyons et al., 2016) as well as with the theoretical predictions (Hellums, 1977; Lücker et al., 2017). Importantly, we detected a significant decrease in EAT towards the deeper cortical layers (Figure 6c). Since EAT is directly related to the intravascular resistance to the diffusive oxygen transport from RBCs to tissue (Hellums, 1977), reduced EAT in the deeper layers represents another example of the adaptation of the microvascular network in order to facilitate local oxygen delivery in cortical regions with higher oxygen demand (Pries et al., 1994; Pries et al., 1998; Reglin et al., 2009; Reglin et al., 2017). However, it is important to note that mechanisms that govern EAT are multifactorial. EAT may be affected by multiple parameters, such as RBC spacing, shape and wall-to-RBC spatial clearance (Golub and Pittman, 2005; Lücker et al., 2017; Popel, 1989). In addition, our EAT measurements provide average values based on multiple RBC-passages. Therefore, they do not account for fluctuations of the parameters that affect EAT, which may differ between cortical layers and/or proximal and distal capillaries, and differentially affect the EAT measurements. Smaller difference between RBC-PO2 and InterRBC-PO2 and, consequently, smaller EATs at greater depths are likely a consequence of more narrowly distributed capillary blood flow and oxygenation. However, it is less clear why the mean RBC-PO2 and InterRBC-PO2 are increasing with depth (Figure 3—figure supplement 1). The observed increases in the mean RBC-PO2 and InterRBC-PO2 may be in part due to the potential change in proportion of the more oxygenated upstream capillaries to the less oxygenated downstream capillaries. Our measurement protocol (i.e., measuring PO2 in most of the capillaries identified within the field of view at each imaging plane) together with the large number of capillaries interrogated at each depth, ensured 1) that the upstream and downstream capillaries were sampled proportional to their number densities, and 2) that the mean PO2 values were properly estimated, but could not guarantee an equal sampling of the upstream and downstream capillaries unless the equal distributions of the upstream and downstream capillaries are naturally occurring. Other mechanisms, such as the effect of the increased homogeneity of capillary RBC flux and PO2 on the mean intravascular PO2, may also contribute.

The elevated SO2 in the surfacing venules in layers I-III suggests that in the upper cortical layers (e.g. layers I-III) the downstream capillaries and post-capillary venules that feed the surfacing venules are more oxygenated compared to the surfacing venules in the deeper layers (e.g. layers IV and V). We therefore assigned branching orders to the capillary segments in cortical layers I-III and investigated the distributions of capillary RBC flow and oxygenation along the capillary paths. We found that the average SO2 in the V1 capillaries selected across layers I-III was indeed higher than the SO2 in the ascending venules in both layers I and II/III, confirming that high oxygen content in the superficial capillaries contributed to the increase in the venular SO2 toward brain surface. This result is in line with the recent experimental and theoretical findings that capillary transit time is shorter in the surface cortical layers (Gutiérrez-Jiménez et al., 2016; Schmid et al., 2017), causing less efficient release of oxygen by the RBCs, thus elevating the SO2 in the surfacing venules (Schmid et al., 2017). This result also suggests that the baseline oxygen extraction may be different between the cortical layers, which has been predicted by several theoretical studies using realistic vascular anatomical models (Gould and Linninger, 2015; Gould et al., 2017; Linninger et al., 2013). If true, this may have implications on the interpretation of results from different imaging modalities such as BOLD fMRI (Blockley et al., 2015; Griffeth and Buxton, 2011; Siero et al., 2011; Silva and Koretsky, 2002; Vazquez et al., 2006; Yu et al., 2014). Secondly, approximately 1/3 of the total oxygen extraction took place along the paths from the pial arterioles to the A1 capillary segments in layers I-III. This observation differs from our previous study in isoflurane-anesthetized mice, where we found, based on the measurements in the upper 450 µm of somatosensory cortex, that ~50% of the oxygen delivered to brain tissue was extracted from arterioles (Sakadžić et al., 2014). The discrepancy might be due to the effect of anesthesia, which suppressed cerebral oxygen metabolism and possibly increased both CBF and arteriolar surface area due to vasodilation (Alkire et al., 1999; Goldberg et al., 1966; Ogawa et al., 1990). As a result of these perturbations, oxygen extraction could be shifted towards the upstream microvascular segments (Sakadžić et al., 2014). Based on the observed difference in oxygen extraction and the assumed difference in oxygen metabolism between cortical layers, we anticipate that in cortical layers IV and V, the fraction of the extracted oxygen from arterioles may be smaller than in layers I-III, but still significant.

Our data provided additional evidence that the distributions of capillary flow and oxygenation were highly heterogeneous and strongly positively correlated with one-another, in particular in the downstream capillaries (Figure 7). This implies that the mixed venous blood oxygenation was, therefore, a result of the contributions from the wide distribution of capillary paths, carrying blood that was both more and less oxygenated than the blood in the postcapillary venules (Figure 7). At the extreme ends of this distribution are capillary paths with very low and very high oxygenation and blood flow. The paths with very low oxygenation may be the first sites of coupling of microvascular dysfunction and progression of various brain pathologies (Erdener et al., 2017; Lücker et al., 2018a). Indeed, it has been recently reported that only ~0.4% of the cortical capillaries in healthy mice had ‘stalled flow’, but in transgenic mice of Alzheimer’s disease the fraction was as high as 2% (Cruz Hernandez et al., 2016; Momjian-Mayor and Baron, 2005). As an example of such poorly oxygenated/perfused capillaries, we identified a capillary segment with PO2 of ~15 mmHg and no detectable RBC flow during the 9-s-long acquisition (Figure 7—figure supplement 4). In contrast, the paths with very high oxygenation and blood flow (Figure 7—figure supplement 5) may be especially good sites for implementing blood flow control in response to locally increased oxygen demand, since increasing their resistance to flow may quickly redistribute blood over the nearby capillary network. However, the prevalence of such highly oxygenated/perfused capillaries in the cortical microvascular network and the existence of mechanisms of their site-specific control are unknown (Hudetz et al., 1996). Further studies should address these questions in relation to both normal and pathological brain conditions.

One potential limitation of this study is that the assignment of the cortical layers as a function of the cortical depth was performed based on the literature data (Blinder et al., 2013; Lefort et al., 2009), as opposed to identification of the layer-specific anatomical landmarks. Nevertheless, while slight shifts in the layer boundaries, which may have resulted from such an assignment, may have affected the exact values, it is unlikely that the observed general trends and significant differences in the observables between the layers would have changed. In addition, layer V in mouse barrel cortex spans the depth range of 450–700 μm (Blinder et al., 2013; Lefort et al., 2009), so that the range of 450–600 μm, interrogated in this study, likely overlaps the best with the upper part of layer V (i.e., layer Va) (Blinder et al., 2013; Lefort et al., 2009).

Another limitation is that at greater cortical depths, expanding shadows below large pial vessels, partial obstruction of the optical paths by the edge of the cranial window, and gradual loss of resolution, contributed to the smaller sampling size. It is possible that due to the smaller number of measured capillaries in the deeper cortical layers (e.g., 104 capillaries in layer V vs. 400 capillaries in layer I; Figure 3), some investigated variables did not show statistically significant difference between cortical layers.

The capillaries were identified based on their morphology, without taking into account the smooth muscle cell coverage and pericyte types (Attwell et al., 2016; Hall et al., 2014; Hartmann et al., 2015; Hill et al., 2015; Mishra et al., 2014; Peppiatt et al., 2006; Secomb, 2017), and the assignment of capillary branching order indices was performed manually, which may be operator-dependent. In principle, misclassifying vessel types and/or branching orders could potentially influence our analysis. However, based on the overwhelmingly larger number of capillaries compared to the non-penetrating arterioles and venules, our conclusions in general are unlikely to be different. Furthermore, identification of capillaries based on the biochemical staining of smooth muscle cells and pericytes (Hall et al., 2014; Hartmann et al., 2015) will add significant complexity to the study, especially considering a large sample size used in our analysis, but in the end may not provide more accurate results, as the debate on what is a proper classification of vessel-types based on staining is still ongoing (Hill et al., 2015).

The RBC speed was calculated by assuming a constant RBC size (6 µm) (Unekawa et al., 2010) along the capillary axis, without considering its potential variations with RBC speed, line-density and capillary diameter. In a separate set of experiments, we performed line-scan measurements (Kleinfeld et al., 1998) in 58 capillaries (2-s-long acquisition, 2 kHz line-scan rate) in n = 2 awake mice, and obtained close mean RBC speed values by processing the data by using two methods: by the line-scan method described in Kleinfeld et al. (1998) (mean RBC speed = 0.61 mm/s) and by the RBC-passage (or point-scan) method used in this work (mean RBC speed = 0.69 mm/s). The mean RBC longitudinal size was estimated by following the procedures described in Chaigneau et al. (2003), and it did not vary significantly as a function of RBC speed, line-density and capillary diameter, except for the fast RBCs (>1 mm/s), which were also associated with the noisier measurements by both techniques. However, the mean fluctuation of the RBC longitudinal size over the 2-s-long acquisition was moderate (STD = 2.3 ± 0.6 µm). Therefore, group comparison of the mean RBC speed values measured by the RBC-passage method may be conducted with reasonable accuracy, but the instantaneous speed of individual RBCs obtained by this method may have larger measurement errors (please see Figure 1—figure supplement 2 and text for additional details). These limitations of the technique should be considered for particular experimental designs.

The RBCs that are touching each other might be counted mistakenly as a single RBC, causing underestimation of RBC flux and speed. We estimated that approximately 6% of the ‘valleys’ might be caused by the passing of multiple RBCs through the optical focus. However, as no difference in RBC line-density across different cortical layers was observed, we do not anticipate that our layer-specific analysis is affected as it is unlikely that the RBCs-touching phenomenon differentially affects the measurements in different cortical layers.

We would also like to mention that some discrepancy exists between the EAT magnitudes measured using 2PLM by different groups. For example, rather large EAT was reported in Lecoq et al. (2011); Lyons et al. (2016); Parpaleix et al. (2013) with the PtP-C343 probe. Much smaller EAT (only a few mmHg) were measured previously using also PtP-C343 (unpublished data from Sakadžić et al., 2014), and moderate EAT are reported in the present work with Oxyphor2P. It should be mentioned that the data underlying the EAT measurements are typically noisier than those used to derive mean intravascular and tissue PO2's, since to quantify EAT the signals have to be split into multiple distance or time bins. In addition, the previously used probe PtP-C343 has intrinsically non-single-exponential phosphorescence decay and much lower emission quantum yield. These limitations, in combination with potentially slightly different implementations of acquisition protocols and algorithms for fitting the phosphorescence decay data, are likely to be the dominant factor contributing to the differences in the reported EAT magnitudes. By using Oxyphor2P, which has much stronger signal and much better defined single-exponential decay, making data analysis much more robust, here we greatly reduced uncertainty in the EAT measurements, which was inherent to the previous probe PtP-C343. Nevertheless, we still would like to emphasize the importance of aligning the acquisition and data analysis protocols across the labs as well as using the same data acquisition protocols during measurement as used for probe calibration.

We averaged all the phosphorescence decays within the valleys (i.e. RBC-passages) in the segmented phosphorescence intensity time courses to calculate RBC-PO2. This approach does not consider that within the valley PO2 may vary as a function of distance to the center of the valley, and the extent of this variation may be different among capillaries of different diameter and/or RBC speeds.

In conclusion, we have experimentally mapped the distributions of microvascular flow and oxygenation in the whisker barrel cortex in awake mice using two-photon phosphorescence lifetime microscopy. We have found evidence that oxygen was extracted differently in different cortical layers, and that the distributions of microvascular blood flow and oxygenation were adjusted across layers in a way that facilitated oxygen delivery in the deeper layers. Specifically, the depth-dependent OEF was measured higher in cortical layers IV and V, where the oxidative metabolism is presumably the highest in the cortex. This increase was accompanied by the more homogenous capillary RBC flow and oxygenation, as well as by the reduction of intracapillary resistance to oxygen diffusion to tissue (inferred from the EAT changes). In addition, we have found that arterioles in the superficial cortical layers (e.g. layers I-III) contributed significantly to the oxygen extraction from blood (34%) even in awake mice. We anticipate that our results and analysis will help better understand the normal brain physiology, and the progression of brain pathologies that affect cerebral microcirculation. They will also inform more accurate biophysical models of the cortical layer-specific oxygen delivery and consumption, as well as improve the interpretation of the results from other brain imaging modalities.

Materials and methods

Animal preparation

We used n = 15 C57BL/6 mice (3–5 months old, 20–25 g, female, Charles River Laboratories) in this study. We followed the procedures of chronic cranial window preparation outlined by Goldey et al. (2014). A custom-made head-post (Mateo et al., 2011) allowing repeated head immobilization was glued to the skull, overlaying the right hemisphere. A craniotomy (round shape, 3 mm in diameter) was performed over the left hemisphere, centered approximately over the E1 whisker barrel. The dura was kept intact. The cranial window was subsequently sealed with a glass plug (Komiyama et al., 2010) and dental acrylic. After surgery, mice were given 5 days to recover before starting the habituation training. The training was conducted while mice were resting on a suspended soft fabric bed in a home-built platform, under the microscope. Mice were gradually habituated to longer periods (from 10 min to 2 hr) of head-restraint with the head slightly rotated (~35°) to make the cortical surface perpendicular to the optical axis. All mice were rewarded with sweetened milk every 15 min during both training and experiments. While head-restrained, the mice were free to readjust their body position and from time to time displayed natural grooming behavior. All animal surgical and experimental procedures were conducted following the Guide for the Care and Use of Laboratory Animals and approved by the Massachusetts General Hospital Subcommittee on Research Animal Care (Protocol No.: 2007N000050).

Two-photon microscope

In this study, we employed our previously developed home-built two-photon microscope (Figure 1a) (Sakadzić et al., 2010; Yaseen et al., 2015). Briefly, a pulsed laser (InSight DeepSee, Spectra-Physics, tuning range: 680 nm to 1300 nm,~120 fs pulse width, 80 MHz repetition rate) was used as an excitation source. Laser power was controlled by an electro-optic modulator (EOM). The laser beam was focused with a water-immersion objective lens (XLUMPLFLN20XW, Olympus, NA = 1.0), and scanned in the X-Y plane by a pair of galvanometer scanners. The objective was moved along the Z axis by a motorized stage (M-112.1DG, Physik Instrumente) for probing different cortical depth. Oxyphor2P was excited at 950 nm. The emitted phosphorescence, centered at 760 nm, was directed toward a photon-counting photomultiplier tube (H10770PA-50, Hamamatsu) by a dichroic mirror (FF875-Di01−25 × 36, Semrock), followed by an infrared blocker (FF01-890/SP-25, Semrock) and an emission filter (FF01-795/150-25, Semrock). The lateral and axial resolutions of the PO2 measurements were estimated as 2 and 5 µm, respectively (Sakadzić et al., 2010; Yaseen et al., 2015). During the experiments, the objective lens was heated by an electric heater (TC-HLS-05, Bioscience Tools) to maintain the temperature of the water between the cranial window and the objective lens at 36–37°C. In addition, we attached the sensor of an accelerometer module to the suspended bed of the mouse platform to record the signals induced by mouse motion. Mice were continuously monitored during experiments by acquiring live videos with a CCD camera (CoolSNAPfx, Roper Scientific) using a LED illumination at 940 nm.

Intravascular PO2 imaging

Before imaging, mice were briefly anesthetized by isoflurane (1.5–2%, during ~2 min), and then the solution of Oxyphor2P (0.1 ml at ~34 µM) was retro-orbitally injected into the bloodstream. Here, we used a new phosphorescent oxygen probe – Oxyphor2P (Esipova et al., 2019). Compared to its predecessor – PtP-C343 (Finikova et al., 2008), Oxyphor2P exhibits red-shifted excitation and emission (λexc = 950 nm, λem = 757 nm), higher quantum yield, much larger two-photon absorption cross-section, and well-defined single-exponential kinetics. Mice were recovered from anesthesia and then head fixed under the microscope. The imaging session was started 30–60 min after injection, and lasted for up to 2 hr.

The acquisition protocol is illustrated in Figure 1b. We first recorded a CCD image of the mouse brain surface vasculature (Figure 1d) under green light illumination to guide the selection of a region of interest for the subsequent functional imaging. The two-photon microscopic measurements were collected at different X-Y planes, perpendicular to the optical axis (Z). The imaging planes were separated in depth by 50 µm. Starting from the cortical surface, up to 13 planes were interrogated per mouse, spanning the depth range of 600 µm. At each imaging depth, we first performed a raster scan of phosphorescence intensity, which revealed the locations of the micro-vessels within a 500 × 500 µm2 field of view (FOV). Then, we manually selected the measurement locations inside all the vascular segments captured within the FOV. At each selected location, Oxyphor2P in the focal volume was excited with a 10-µs-long laser excitation at 950 nm gated by the EOM, followed by a 290-µs-long collection of the emitted phosphorescence. Typically, at each location, such 300-µs-long excitation/decay cycle was repeated 2000 times (0.6 s) to obtain an average phosphorescence decay with sufficient signal-to-noise ratio (SNR) for an accurate lifetime calculation. In some mice, longer acquisition (30,000 cycles; 9 s) was applied to enable measurement of EAT and temporal fluctuations of PO2 and RBC flux (please see the following subsection for details).

Measurement of RBC-PO2, InterRBC-PO2, EAT, and RBC flow in capillaries

In the capillaries in n = 7 mice, we repeated the 300-µs-long excitation/decay cycle 30,000 times, corresponding to a 9-s-long acquisition per capillary. In the capillaries in the other n = 8 mice, we repeated the 300-µs-long excitation/decay cycle 2000 times, corresponding to a 0.6-s-long acquisition per capillary. At each imaging depth, all the capillaries that could be visually identified were selected for measurements. The 9-s-long acquisition allowed us to estimate RBC-PO2, InterRBC-PO2, EAT, and intracapillary PO2 gradients, as well as the temporal fluctuations of RBC flux, speed and Mean-PO2. Both 9-s-long and 0.6-s-long acquisitions were used to calculate Mean-PO2, RBC flux, speed and line-density.

Acquisition of microvascular angiograms

Microvascular angiograms were acquired by two-photon microscopic imaging of blood plasma labeled with dextran-conjugated Sulforhodamine-B (SRB) (0.15–0.2 ml at 5 % W/V in saline, R9379, Sigma Aldrich). The SRB solution was retro-orbitally injected into the blood stream under brief isoflurane anesthesia (1.5–2%, during ~2 min). The microvascular stacks were acquired within a 700 × 700 µm2 FOV, centered over the same region of interest as for PO2 imaging. In each mouse, the angiogram and intravascular PO2 were acquired separately on different days in order not to stress the animals by the combined long imaging session.

Calculation of PO2

We rejected the initial 5-µs phosphorescence decay data after the 10-µs-long excitation gate, and used the remaining 285-µs decay to fit for the phosphorescence lifetime. The phosphorescence lifetime was calculated by fitting the average phosphorescence decay to a single-exponential decay function, using a standard non-linear least square minimization algorithm (Finikova et al., 2008; Sakadzić et al., 2010). The lifetime was converted to absolute PO2 using a Stern-Volmer type calibration plot obtained in an independent oxygen titration experiment, conducted with the same 300-µs-long excitation/decay acquisition protocol as in our in vivo recordings.

Calculation of capillary RBC flux, speed and line-density

The phosphorescence intensity was calculated by integrating the phosphorescence photon counts over each 300-µs-long excitation/decay cycle. Same as all the dendritic oxygen probes, Oxyphor2P is confined to blood plasma, but not permeates RBCs (Lebedev et al., 2009), the variations of the phosphorescence intensity recorded in capillaries encoded the passing of RBCs through the optical focus (Lecoq et al., 2011; Parpaleix et al., 2013) (Figure 1b,c). Following the previously described procedures (Lecoq et al., 2011; Parpaleix et al., 2013), the phosphorescence intensity time course was segmented using a standard thresholding method (Otsu, 1979). The segmentation of the phosphorescence intensity time courses was evaluated by the coefficient of determination (R2) between the experimental and fitted time courses, and the data with R2 <0.5 were rejected. A representative phosphorescence intensity time course is shown in Figure 1c, where a RBC and a blood-plasma-passage induced phosphorescence intensity transients are denoted by arrows. Subsequently, capillary RBC flux was calculated by counting the number of detected RBCs (i.e., valleys in the binary segmented curve) during the acquisition time. RBC line-density was estimated as the ratio of the combined time duration of all valleys to the total duration of the entire time course. Finally, RBC speed for each RBC-passage event was estimated as v = ø/∆t, where ∆t is the time for the RBC to pass through the focal zone, and ø is RBC diameter, assumed to be 6 µm (Unekawa et al., 2010). For each capillary, the mean RBC speed was calculated by averaging over all RBC-passage events throughout the time course. Please note that the method for calculating RBC flow properties as described above is only valid for single-file-flow vessels, which are typically capillaries.

Calculation of intracapillary PO2 gradients, RBC-PO2, InterRBC-PO2 and EAT

To estimate the intracapillary PO2 gradients in Figure 6a, the phosphorescence decays from the 9-s-long acquisition in each capillary were binned using 2-ms-wide bins, starting from the closest RBC center. The decays from the 9-s-long acquisition were subsequently averaged and PO2 was calculated using the previously described procedures.

To estimate the intracapillary PO2 gradients in Figure 6—figure supplement 1, the phosphorescence decays were grouped by their distance to the nearest RBC center, using 1-µm-wide bins. The distance to the nearest RBC center was estimated as v∙∆t', where v was the RBC speed, and ∆t' was the time interval between the phosphorescence decay event and the center of the nearest RBC-passage (i.e., center of the valley). The decays from the 9-s-long acquisition were subsequently averaged and PO2 was calculated as described previously.

With the same 9-s-long measurements, RBC-PO2 was calculated with all the phosphorescence decays in the valleys (RBC-passages) in the segmented phosphorescence intensity time course (Figure 1c). InterRBC-PO2 was calculated with the decays in the central 40% of the peaks (plasma). EAT was calculated as RBC-PO2 - InterRBC-PO2. Mean-PO2 was calculated based on all the decays, regardless of their positions in the phosphorescence intensity time course. The calculation procedures were similar to what was described in Lecoq et al. (2011); Parpaleix et al. (2013); Lyons et al. (2016).

Calculation of SO2 and depth-dependent OEF

The oxygen saturation of hemoglobin (SO2) was computed based on PO2 using the Hill equation with the parameters (h = 2.59, P50 = 40.2 mmHg) specific for C57BL/6 mice (Uchida et al., 1998). Here, h is the Hill coefficient, and P50 is the oxygen tension at which hemoglobin is 50% saturated. SO2 in the penetrating arterioles and surfacing venules was calculated based on their Mean-PO2. SO2 in capillaries was calculated based on the RBC-PO2 (Lyons et al., 2016; Sakadžić et al., 2014).

The depth-dependent OEF (DOEF), in a given cortical layer, was calculated as (SO2,A–SO2,V)/SO2,A, where SO2,A and SO2,V represent the layer-specific SO2 in the diving arterioles and surfacing venules, respectively. Therefore, DOEF in a certain layer measures the OEF accumulated downstream from that layer and, as a special case, DOEF in layer I represents the global OEF in the interrogated cortical tissue territory. Please note that DOEF in each layer depends on both blood flow and oxygen metabolism.

Quantification of the temporal fluctuations of capillary Mean-PO2, RBC flux, speed and line-density

The phosphorescence decays recorded during the 9-s-long acquisition (30,000 repetitions of the excitation/decay cycle) in each capillary were divided into 15 groups using 0.6 s bins (2000 repetitions for each bin). Here, averaging the phosphorescence decays with 0.6 s bins ensured that the blood flow and PO2 fluctuations due to cardiac and respiratory cycles, as they occurred to awake mice, were averaged out. RBC flux, speed, line-density and Mean-PO2 were calculated with the 2000 phosphorescence decays at each bin, yielding 15-point time courses of these four parameters for each assessed capillary. Subsequently, for each of the four parameters, we quantified the temporal fluctuation by computing the standard deviation (STD) and coefficient of variance (CV) from the 15-point data. Here, CV is defined as the ratio of STD to mean (Golub and Pittman, 2005).

Identification of capillary branching order

Capillaries were typically identified starting one or two segments away from the diving arterioles and surfacing venules based on visually inspecting their morphology (e.g. smaller diameters and higher tortuosity) (Sakadžić et al., 2014). Their branching order indices were assigned by visually inspecting the microvascular angiograms. Starting immediately after the pre-capillary arteriole (PCA), capillary segments were counted in the direction of blood flow and indexed as Ai (i = 1, 2, 3, …). Analogously, starting immediately before the post-capillary venule (PCV), capillary segments were counted in the opposite direction of blood flow and indexed as Vi (i = 1, 2, 3, …). In the analysis, only the first three upstream capillary segments (A1-A3) and the last three downstream capillary segments (V1-V3) were considered, as visually inspecting and confirming higher branching orders of capillaries would be more challenging. In addition, most of the capillaries selected were within the central part of the FOV of the microvascular angiograms and in the cortical depth of ≤300 µm, which were due to the difficulty in tracking the capillaries close to the boundaries of the FOV and at greater depth. PCAs and PCVs were identified based on their PO2 values and by visually inspecting their morphology, as well as by tracing the vessels up to the brain surface where we identified pial arterioles and venules based on their morphology and PO2.

Cortical layer-specific data analysis

The capillary RBC flow and PO2 properties acquired in each animal were grouped into four groups based on the cortical depth: 0–100 µm, 100–320 µm, 320–450 µm, and 450–600 µm. These depth ranges approximately correspond to the cortical layers I, II/III, IV, and V, respectively, in the whisker barrel cortex in 3-month-old C57BL/6 mice (Blinder et al., 2013; Lefort et al., 2009). For each cortical layer in each mouse, the absolute values of capillary RBC flow and PO2 properties were averaged, and the STD and CV computed. Subsequently, the measurements belonging to each cortical layer were averaged over mice.

Rejection of motion artifacts

Data affected by mouse motion were rejected based on the signal generated by the accelerometer attached to the fabric underneath the mouse. We excluded from analysis the phosphorescence decays acquired within the time intervals determined by an empirically defined threshold of the accelerometer signal amplitude. In addition, visual inspection of the phosphorescence intensity traces acquired in the microvascular segments was also used to find and reject motion artifacts. This was achieved by looking for the sudden changes of phosphorescence intensity or loss of contrast between RBC and plasma passing through the focal volume. Finally, long episodes of motion were captured by the live-videos recorded by a CCD camera during acquisition. When motion occurred, the acquisition was manually stopped and the corresponding measurements were excluded from the analysis.

Construction of the composite image

To construct composite images such as the one shown in Figure 1g, tubeness filtering (Sato et al., 1998) and intensity thresholding were applied to segment the two-photon angiograms into binary images. Subsequently, PO2 measurements were spatially co-registered with the segmented angiogram. The three-dimensional composite image was created by color-coding the experimental PO2 values in the corresponding vascular segments (shades of gray). The color-coding was performed by assigning the PO2 (or Mean-PO2 for capillary) value measured in the focal volume within a vascular segment to the whole segment. For some vascular segments without PO2 measurements, such measurements were instead available for the segments joining them in each end. To such segments, we assigned the average PO2 values of the connecting segments.

Statistical analysis

Statistical comparisons were carried out using ANOVA or t-test (MATLAB, MathWorks Inc). p-Value less than 0.05 was considered statistically significant. Details about the statistical analysis and measurement information are provided in the figure legends and/or text, where relevant. Mean values and standard deviations of parameters needed to estimate the sample size were either assumed to be the same as those measured previously in anesthetized animals or assumed empirically. Since multiple parameters were measured in the same animals, sample size (i.e. n = 15 mice) was set based on anticipation that the most demanding one will be to detect 30% difference between the mean EAT values (coefficient of variance = 0.3, power = 0.8, α = 0.05).

Data availability

All data generated or analyzed during this study are included in this paper and the supporting files.

Acknowledgements

Support of the grants NS091230, MH111359, EB018464, NS092986, NS055104 and AA027097 from the National Institutes of Health, USA, is gratefully acknowledged.

Funding Statement

The funders had no role in study design, data collection and interpretation, or the decision to submit the work for publication.

Contributor Information

Sava Sakadžić, Email: sava.sakadzic@mgh.harvard.edu.

Serge Charpak, Institut National de la Santé et de la Recherche Médicale, Université Paris Descartes, France.

Timothy E Behrens, University of Oxford, United Kingdom.

Funding Information

This paper was supported by the following grants:

  • National Institutes of Health NS091230 to Sava Sakadžić.

  • National Institutes of Health MH111359 to Anna Devor.

  • National Institutes of Health EB018464 to Sergei A Vinogradov.

  • National Institutes of Health NS092986 to Sergei A Vinogradov.

  • National Institutes of Health NS055104 to Sava Sakadžić.

  • National Institutes of Health AA027097 to Mohammad A Yaseen.

Additional information

Competing interests

No competing interests declared.

Author contributions

Conceptualization, Data curation, Software, Formal analysis, Investigation, Visualization, Methodology, Writing—original draft, Writing—review and editing.

Investigation, Methodology.

Investigation, Methodology.

Investigation, Methodology, Writing—original draft.

Investigation, Methodology.

Validation, Investigation, Methodology, Writing—review and editing.

Software, Validation, Methodology, Writing—review and editing.

Software, Visualization, Writing—original draft.

Software, Validation, Methodology.

Validation, Investigation, Methodology, Writing—review and editing.

Validation, Writing—review and editing.

Resources, Funding acquisition, Validation, Investigation, Methodology, Writing—review and editing.

Resources, Funding acquisition, Validation, Investigation, Methodology, Writing—review and editing.

Resources, Funding acquisition, Validation, Investigation, Methodology, Writing—review and editing.

Conceptualization, Resources, Software, Supervision, Funding acquisition, Validation, Investigation, Methodology, Project administration, Writing—review and editing.

Ethics

Animal experimentation: All animal surgical and experimental procedures were conducted following the Guide for the Care and Use of Laboratory Animals and approved by the Massachusetts General Hospital Subcommittee on Research Animal Care (Protocol No.: 2007N000050).

Additional files

Supplementary file 1. Measurement information for the main analysis in Figures 27.
elife-42299-supp1.docx (13.6KB, docx)
DOI: 10.7554/eLife.42299.022
Transparent reporting form
DOI: 10.7554/eLife.42299.023

Data availability

All data generated or analyzed during this study are included in this paper and the supporting files.

References

  1. Aaslid R, Lindegaard KF, Sorteberg W, Nornes H. Cerebral autoregulation dynamics in humans. Stroke. 1989;20:45–52. doi: 10.1161/01.STR.20.1.45. [DOI] [PubMed] [Google Scholar]
  2. Acker H, Lübbers DW. The kinetics of local tissue PO2 decrease after perfusion stop within the carotid body of the cat in vivo and in vitro. PflüGers Archiv European Journal of Physiology. 1977;369:135–140. doi: 10.1007/BF00591569. [DOI] [PubMed] [Google Scholar]
  3. Alkire MT, Pomfrett CJ, Haier RJ, Gianzero MV, Chan CM, Jacobsen BP, Fallon JH. Functional brain imaging during anesthesia in humans: effects of halothane on global and regional cerebral glucose metabolism. Anesthesiology. 1999;90:701–709. doi: 10.1097/00000542-199903000-00011. [DOI] [PubMed] [Google Scholar]
  4. Anenberg E, Chan AW, Xie Y, LeDue JM, Murphy TH. Optogenetic stimulation of GABA neurons can decrease local neuronal activity while increasing cortical blood flow. Journal of Cerebral Blood Flow & Metabolism. 2015;35:1579–1586. doi: 10.1038/jcbfm.2015.140. [DOI] [PMC free article] [PubMed] [Google Scholar]
  5. Attwell D, Mishra A, Hall CN, O'Farrell FM, Dalkara T. What is a pericyte? Journal of Cerebral Blood Flow & Metabolism. 2016;36:451–455. doi: 10.1177/0271678X15610340. [DOI] [PMC free article] [PubMed] [Google Scholar]
  6. Attwell D, Laughlin SB. An energy budget for signaling in the grey matter of the brain. Journal of Cerebral Blood Flow & Metabolism. 2001;21:1133–1145. doi: 10.1097/00004647-200110000-00001. [DOI] [PubMed] [Google Scholar]
  7. Barker MC, Golub AS, Pittman RN. Erythrocyte-associated transients in capillary PO2: an isovolemic hemodilution study in the rat spinotrapezius muscle. American Journal of Physiology. Heart and Circulatory Physiology. 2007;292:H2540–H2549. doi: 10.1152/ajpheart.00915.2006. [DOI] [PubMed] [Google Scholar]
  8. Benesch RE, Benesch R, Yu CI. The oxygenation of hemoglobin in the presence of 2,3-diphosphoglycerate. Effect of temperature, pH, ionic strength, and hemoglobin concentration. Biochemistry. 1969;8:2567–2571. doi: 10.1021/bi00834a046. [DOI] [PubMed] [Google Scholar]
  9. Berthiaume AA, Hartmann DA, Majesky MW, Bhat NR, Shih AY. Pericyte structural remodeling in cerebrovascular health and homeostasis. Frontiers in Aging Neuroscience. 2018;10 doi: 10.3389/fnagi.2018.00210. [DOI] [PMC free article] [PubMed] [Google Scholar]
  10. Blinder P, Tsai PS, Kaufhold JP, Knutsen PM, Suhl H, Kleinfeld D. The cortical angiome: an interconnected vascular network with noncolumnar patterns of blood flow. Nature Neuroscience. 2013;16:889–897. doi: 10.1038/nn.3426. [DOI] [PMC free article] [PubMed] [Google Scholar]
  11. Blockley NP, Griffeth VE, Stone AJ, Hare HV, Bulte DP. Sources of systematic error in calibrated BOLD based mapping of baseline oxygen extraction fraction. NeuroImage. 2015;122:105–113. doi: 10.1016/j.neuroimage.2015.07.059. [DOI] [PubMed] [Google Scholar]
  12. Braun RD, Lanzen JL, Dewhirst MW. Fourier analysis of fluctuations of oxygen tension and blood flow in R3230Ac tumors and muscle in rats. American Journal of Physiology-Heart and Circulatory Physiology. 1999;277:H551–H568. doi: 10.1152/ajpheart.1999.277.2.H551. [DOI] [PubMed] [Google Scholar]
  13. Cai C, Fordsmann JC, Jensen SH, Gesslein B, Lønstrup M, Hald BO, Zambach SA, Brodin B, Lauritzen MJ. Stimulation-induced increases in cerebral blood flow and local capillary vasoconstriction depend on conducted vascular responses. PNAS. 2018;115:E5796–E5804. doi: 10.1073/pnas.1707702115. [DOI] [PMC free article] [PubMed] [Google Scholar]
  14. Cao R, Li J, Ning B, Sun N, Wang T, Zuo Z, Hu S. Functional and oxygen-metabolic photoacoustic microscopy of the awake mouse brain. NeuroImage. 2017;150:77–87. doi: 10.1016/j.neuroimage.2017.01.049. [DOI] [PMC free article] [PubMed] [Google Scholar]
  15. Chaigneau E, Oheim M, Audinat E, Charpak S. Two-photon imaging of capillary blood flow in olfactory bulb glomeruli. PNAS. 2003;100:13081–13086. doi: 10.1073/pnas.2133652100. [DOI] [PMC free article] [PubMed] [Google Scholar]
  16. Chong SP, Merkle CW, Leahy C, Radhakrishnan H, Srinivasan VJ. Quantitative microvascular hemoglobin mapping using visible light spectroscopic optical coherence tomography. Biomedical Optics Express. 2015a;6:1429–1450. doi: 10.1364/BOE.6.001429. [DOI] [PMC free article] [PubMed] [Google Scholar]
  17. Chong SP, Merkle CW, Leahy C, Srinivasan VJ. Cerebral metabolic rate of oxygen (CMRO2) assessed by combined doppler and spectroscopic OCT. Biomedical Optics Express. 2015b;6:3941–3951. doi: 10.1364/BOE.6.003941. [DOI] [PMC free article] [PubMed] [Google Scholar]
  18. Croughwell N, Smith LR, Quill T, Newman M, Greeley W, Kern F, Lu J, Reves JG. The effect of temperature on cerebral metabolism and blood flow in adults during cardiopulmonary bypass. The Journal of Thoracic and Cardiovascular Surgery. 1992;103:549–554. [PubMed] [Google Scholar]
  19. Cruz Hernandez JC, Kersbergen C, Muse V, Ivasyk I, Bracko O, Haft-Javaherian M, Kang Y, Zhou J, Beverly JD, Slack E, Otte G, Santisakultarm TP, Iadecola C, Nishimura N, Schaffer CB. Stalled blood flow in brain capillaries is responsible for reduced cortical perfusion in a mouse model of alzheimer’S DISEASE. Alzheimer's & Dementia. 2016;12:P1049–P1050. doi: 10.1016/j.jalz.2016.06.2186. [DOI] [Google Scholar]
  20. de Kock CP, Bruno RM, Spors H, Sakmann B. Layer- and cell-type-specific suprathreshold stimulus representation in rat primary somatosensory cortex. The Journal of Physiology. 2007;581:139–154. doi: 10.1113/jphysiol.2006.124321. [DOI] [PMC free article] [PubMed] [Google Scholar]
  21. Desjardins M, Berti R, Lefebvre J, Dubeau S, Lesage F. Aging-related differences in cerebral capillary blood flow in anesthetized rats. Neurobiology of Aging. 2014;35:1947–1955. doi: 10.1016/j.neurobiolaging.2014.01.136. [DOI] [PubMed] [Google Scholar]
  22. Devor A, Sakadzic S, Saisan PA, Yaseen MA, Roussakis E, Srinivasan VJ, Vinogradov SA, Rosen BR, Buxton RB, Dale AM, Boas DA. "Overshoot" of O₂ is required to maintain baseline tissue oxygenation at locations distal to blood vessels. Journal of Neuroscience. 2011;31:13676–13681. doi: 10.1523/JNEUROSCI.1968-11.2011. [DOI] [PMC free article] [PubMed] [Google Scholar]
  23. Diamond SG, Huppert TJ, Kolehmainen V, Franceschini MA, Kaipio JP, Arridge SR, Boas DA. Dynamic physiological modeling for functional diffuse optical tomography. NeuroImage. 2006;30:88–101. doi: 10.1016/j.neuroimage.2005.09.016. [DOI] [PMC free article] [PubMed] [Google Scholar]
  24. Erdener Ş.E, Tang J, Sajjadi A, Kılıç K, Kura S, Schaffer CB, Boas DA. Spatio-temporal dynamics of cerebral capillary segments with stalling red blood cells, Spatio-temporal dynamics of cerebral capillary segments with stalling red blood cells. Journal of Cerebral Blood Flow and Metabolism. 2017;39:886–900. doi: 10.1177/0271678X17743877. [DOI] [PMC free article] [PubMed] [Google Scholar]
  25. Esipova TV, Rivera-Jacquez HJ, Weber B, Masunov AE, Vinogradov SA. Stabilizing g-States in centrosymmetric tetrapyrroles: two-photon-absorbing porphyrins with bright phosphorescence. The Journal of Physical Chemistry A. 2017;121:6243–6255. doi: 10.1021/acs.jpca.7b04333. [DOI] [PubMed] [Google Scholar]
  26. Esipova TV, Barrett MJP, Erlebach E, Masunov AE, Weber B, Vinogradov SA. Oxyphor 2P: a High-Performance probe for Deep-Tissue longitudinal oxygen imaging. Cell Metabolism. 2019;29:736–744. doi: 10.1016/j.cmet.2018.12.022. [DOI] [PMC free article] [PubMed] [Google Scholar]
  27. Eskildsen SF, Gyldensted L, Nagenthiraja K, Nielsen RB, Hansen MB, Dalby RB, Frandsen J, Rodell A, Gyldensted C, Jespersen SN, Lund TE, Mouridsen K, Brændgaard H, Østergaard L. Increased cortical capillary transit time heterogeneity in Alzheimer's disease: a DSC-MRI perfusion study. Neurobiology of Aging. 2017;50:107–118. doi: 10.1016/j.neurobiolaging.2016.11.004. [DOI] [PubMed] [Google Scholar]
  28. Federspiel WJ, Popel AS. A theoretical analysis of the effect of the particulate nature of blood on oxygen release in capillaries. Microvascular Research. 1986;32:164–189. doi: 10.1016/0026-2862(86)90052-X. [DOI] [PMC free article] [PubMed] [Google Scholar]
  29. Finikova OS, Lebedev AY, Aprelev A, Troxler T, Gao F, Garnacho C, Muro S, Hochstrasser RM, Vinogradov SA. Oxygen microscopy by two-photon-excited phosphorescence. ChemPhysChem. 2008;9:1673–1679. doi: 10.1002/cphc.200800296. [DOI] [PMC free article] [PubMed] [Google Scholar]
  30. Gagnon L, Smith AF, Boas DA, Devor A, Secomb TW, Sakadžić S. Modeling of cerebral oxygen transport based on in vivo microscopic imaging of microvascular network structure, blood flow, and oxygenation. Frontiers in Computational Neuroscience. 2016;10 doi: 10.3389/fncom.2016.00082. [DOI] [PMC free article] [PubMed] [Google Scholar]
  31. Girouard H, Iadecola C. Neurovascular coupling in the normal brain and in hypertension, stroke, and alzheimer disease. Journal of Applied Physiology. 2006;100:328–335. doi: 10.1152/japplphysiol.00966.2005. [DOI] [PubMed] [Google Scholar]
  32. Goldberg ND, Passonneau JV, Lowry OH. Effects of changes in brain metabolism on the levels of citric acid cycle intermediates. The Journal of Biological Chemistry. 1966;241:3997–4003. [PubMed] [Google Scholar]
  33. Goldey GJ, Roumis DK, Glickfeld LL, Kerlin AM, Reid RC, Bonin V, Schafer DP, Andermann ML. Removable cranial windows for long-term imaging in awake mice. Nature Protocols. 2014;9:2515–2538. doi: 10.1038/nprot.2014.165. [DOI] [PMC free article] [PubMed] [Google Scholar]
  34. Golub AS, Pittman RN. Erythrocyte-associated transients in PO2 revealed in capillaries of rat mesentery. American Journal of Physiology. Heart and Circulatory Physiology. 2005;288:H2735–H2743. doi: 10.1152/ajpheart.00711.2004. [DOI] [PubMed] [Google Scholar]
  35. Gould IG, Tsai P, Kleinfeld D, Linninger A. The capillary bed offers the largest hemodynamic resistance to the cortical blood supply. Journal of Cerebral Blood Flow & Metabolism. 2017;37:52–68. doi: 10.1177/0271678X16671146. [DOI] [PMC free article] [PubMed] [Google Scholar]
  36. Gould IG, Linninger AA. Hematocrit distribution and tissue oxygenation in large microcirculatory networks. Microcirculation. 2015;22:1–18. doi: 10.1111/micc.12156. [DOI] [PubMed] [Google Scholar]
  37. Griffeth VE, Buxton RB. A theoretical framework for estimating cerebral oxygen metabolism changes using the calibrated-BOLD method: modeling the effects of blood volume distribution, hematocrit, oxygen extraction fraction, and tissue signal properties on the BOLD signal. NeuroImage. 2011;58:198–212. doi: 10.1016/j.neuroimage.2011.05.077. [DOI] [PMC free article] [PubMed] [Google Scholar]
  38. Guibert R, Fonta C, Plouraboué F. Cerebral blood flow modeling in primate cortex. Journal of Cerebral Blood Flow & Metabolism. 2010;30:1860–1873. doi: 10.1038/jcbfm.2010.105. [DOI] [PMC free article] [PubMed] [Google Scholar]
  39. Guibert R, Fonta C, Risser L, Plouraboué F. Coupling and robustness of intra-cortical vascular territories. NeuroImage. 2012;62:408–417. doi: 10.1016/j.neuroimage.2012.04.030. [DOI] [PubMed] [Google Scholar]
  40. Gutiérrez-Jiménez E, Cai C, Mikkelsen IK, Rasmussen PM, Angleys H, Merrild M, Mouridsen K, Jespersen SN, Lee J, Iversen NK, Sakadzic S, Østergaard L. Effect of electrical forepaw stimulation on capillary transit-time heterogeneity (CTH) Journal of Cerebral Blood Flow & Metabolism. 2016;36:2072–2086. doi: 10.1177/0271678X16631560. [DOI] [PMC free article] [PubMed] [Google Scholar]
  41. Gutiérrez-Jiménez E, Angleys H, Rasmussen PM, West MJ, Catalini L, Iversen NK, Jensen MS, Frische S, Østergaard L. Disturbances in the control of capillary flow in an aged APPswe/PS1ΔE9 model of Alzheimer's disease. Neurobiology of Aging. 2018;62:82–94. doi: 10.1016/j.neurobiolaging.2017.10.006. [DOI] [PubMed] [Google Scholar]
  42. Hall CN, Reynell C, Gesslein B, Hamilton NB, Mishra A, Sutherland BA, O'Farrell FM, Buchan AM, Lauritzen M, Attwell D. Capillary pericytes regulate cerebral blood flow in health and disease. Nature. 2014;508:55–60. doi: 10.1038/nature13165. [DOI] [PMC free article] [PubMed] [Google Scholar]
  43. Hanks JH, Wallace RE. Relation of oxygen and temperature in the preservation of tissues by refrigeration. Experimental Biology and Medicine. 1949;71:196–200. doi: 10.3181/00379727-71-17131. [DOI] [PubMed] [Google Scholar]
  44. Hartmann DA, Underly RG, Grant RI, Watson AN, Lindner V, Shih AY. Pericyte structure and distribution in the cerebral cortex revealed by high-resolution imaging of transgenic mice. Neurophotonics. 2015;2:041402. doi: 10.1117/1.NPh.2.4.041402. [DOI] [PMC free article] [PubMed] [Google Scholar]
  45. Hartung G, Vesel C, Morley R, Alaraj A, Sled J, Kleinfeld D, Linninger A. Simulations of blood as a suspension predicts a depth dependent hematocrit in the circulation throughout the cerebral cortex. PLOS Computational Biology. 2018;14:e1006549. doi: 10.1371/journal.pcbi.1006549. [DOI] [PMC free article] [PubMed] [Google Scholar]
  46. Hellums JD. The resistance to oxygen transport in the capillaries relative to that in the surrounding tissue. Microvascular Research. 1977;13:131–136. doi: 10.1016/0026-2862(77)90122-4. [DOI] [PubMed] [Google Scholar]
  47. Hill RA, Tong L, Yuan P, Murikinati S, Gupta S, Grutzendler J. Regional blood flow in the normal and ischemic brain is controlled by arteriolar smooth muscle cell contractility and not by capillary pericytes. Neuron. 2015;87:95–110. doi: 10.1016/j.neuron.2015.06.001. [DOI] [PMC free article] [PubMed] [Google Scholar]
  48. Hu S, Maslov K, Tsytsarev V, Wang LV. Functional transcranial brain imaging by optical-resolution photoacoustic microscopy. Journal of Biomedical Optics. 2009;14:040503. doi: 10.1117/1.3194136. [DOI] [PMC free article] [PubMed] [Google Scholar]
  49. Hudetz AG, Fehér G, Kampine JP. Heterogeneous autoregulation of cerebrocortical capillary flow: evidence for functional thoroughfare channels? Microvascular Research. 1996;51:131–136. doi: 10.1006/mvre.1996.0015. [DOI] [PubMed] [Google Scholar]
  50. Hyder F, Rothman DL, Bennett MR. Cortical energy demands of signaling and nonsignaling components in brain are conserved across mammalian species and activity levels. PNAS. 2013;110:3549–3554. doi: 10.1073/pnas.1214912110. [DOI] [PMC free article] [PubMed] [Google Scholar]
  51. Iadecola C. Vascular and metabolic factors in Alzheimer's Disease and Related Dementias: Introduction. Cellular and Molecular Neurobiology. 2016;36:151–154. doi: 10.1007/s10571-015-0319-y. [DOI] [PMC free article] [PubMed] [Google Scholar]
  52. Iadecola C. The neurovascular unit coming of age: a journey through neurovascular coupling in health and disease. Neuron. 2017;96:17–42. doi: 10.1016/j.neuron.2017.07.030. [DOI] [PMC free article] [PubMed] [Google Scholar]
  53. Iordanova B, Vazquez AL, Poplawsky AJ, Fukuda M, Kim SG. Neural and hemodynamic responses to optogenetic and sensory stimulation in the rat somatosensory cortex. Journal of Cerebral Blood Flow & Metabolism. 2015;35:922–932. doi: 10.1038/jcbfm.2015.10. [DOI] [PMC free article] [PubMed] [Google Scholar]
  54. Jespersen SN, Østergaard L. The roles of cerebral blood flow, capillary transit time heterogeneity, and oxygen tension in brain oxygenation and metabolism. Journal of Cerebral Blood Flow & Metabolism. 2012;32:264–277. doi: 10.1038/jcbfm.2011.153. [DOI] [PMC free article] [PubMed] [Google Scholar]
  55. Jones PF, Siegel S. Temperature effects on the phosphorescence of aromatic hydrocarbons in poly(methylmethacrylate) The Journal of Chemical Physics. 1969;50:1134–1140. doi: 10.1063/1.1671168. [DOI] [Google Scholar]
  56. Kazmi SMS, Salvaggio AJ, Estrada AD, Hemati MA, Shaydyuk NK, Roussakis E, Jones TA, Vinogradov SA, Dunn AK. Three-dimensional mapping of oxygen tension in cortical arterioles before and after occlusion. Biomedical Optics Express. 2013;4:1061–1073. doi: 10.1364/BOE.4.001061. [DOI] [PMC free article] [PubMed] [Google Scholar]
  57. Kimura H, Braun RD, Ong ET, Hsu R, Secomb TW, Papahadjopoulos D, Hong K, Dewhirst MW. Fluctuations in red cell flux in tumor microvessels can lead to transient hypoxia and reoxygenation in tumor parenchyma. Cancer Research. 1996;56:5522–5528. [PubMed] [Google Scholar]
  58. Kisler K, Nelson AR, Rege SV, Ramanathan A, Wang Y, Ahuja A, Lazic D, Tsai PS, Zhao Z, Zhou Y, Boas DA, Sakadžić S, Zlokovic BV. Pericyte degeneration leads to neurovascular uncoupling and limits oxygen supply to brain. Nature Neuroscience. 2017;20:406–416. doi: 10.1038/nn.4489. [DOI] [PMC free article] [PubMed] [Google Scholar]
  59. Kleinfeld D, Mitra PP, Helmchen F, Denk W. Fluctuations and stimulus-induced changes in blood flow observed in individual capillaries in layers 2 through 4 of rat neocortex. PNAS. 1998;95:15741–15746. doi: 10.1073/pnas.95.26.15741. [DOI] [PMC free article] [PubMed] [Google Scholar]
  60. Komiyama T, Sato TR, O'Connor DH, Zhang YX, Huber D, Hooks BM, Gabitto M, Svoboda K. Learning-related fine-scale specificity imaged in motor cortex circuits of behaving mice. Nature. 2010;464:1182–1186. doi: 10.1038/nature08897. [DOI] [PubMed] [Google Scholar]
  61. Land PW, Simons DJ. Cytochrome oxidase staining in the rat SmI barrel cortex. The Journal of Comparative Neurology. 1985;238:225–235. doi: 10.1002/cne.902380209. [DOI] [PubMed] [Google Scholar]
  62. Lebedev AY, Cheprakov AV, Sakadzić S, Boas DA, Wilson DF, Vinogradov SA. Dendritic phosphorescent probes for oxygen imaging in biological systems. ACS Applied Materials & Interfaces. 2009;1:1292–1304. doi: 10.1021/am9001698. [DOI] [PMC free article] [PubMed] [Google Scholar]
  63. Lecoq J, Tiret P, Najac M, Shepherd GM, Greer CA, Charpak S. Odor-evoked oxygen consumption by action potential and synaptic transmission in the olfactory bulb. Journal of Neuroscience. 2009;29:1424–1433. doi: 10.1523/JNEUROSCI.4817-08.2009. [DOI] [PMC free article] [PubMed] [Google Scholar]
  64. Lecoq J, Parpaleix A, Roussakis E, Ducros M, Goulam Houssen Y, Vinogradov SA, Charpak S. Simultaneous two-photon imaging of oxygen and blood flow in deep cerebral vessels. Nature Medicine. 2011;17:893–898. doi: 10.1038/nm.2394. [DOI] [PMC free article] [PubMed] [Google Scholar]
  65. Lee J, Wu W, Boas DA. Early capillary flux homogenization in response to neural activation. Journal of Cerebral Blood Flow & Metabolism. 2016;36:375–380. doi: 10.1177/0271678X15605851. [DOI] [PMC free article] [PubMed] [Google Scholar]
  66. Lefort S, Tomm C, Floyd Sarria JC, Petersen CC. The excitatory neuronal network of the C2 barrel column in mouse primary somatosensory cortex. Neuron. 2009;61:301–316. doi: 10.1016/j.neuron.2008.12.020. [DOI] [PubMed] [Google Scholar]
  67. Li B, Lee J, Boas DA, Lesage F. Contribution of low- and high-flux capillaries to slow hemodynamic fluctuations in the cerebral cortex of mice. Journal of Cerebral Blood Flow & Metabolism. 2016;36:1351–1356. doi: 10.1177/0271678X16649195. [DOI] [PMC free article] [PubMed] [Google Scholar]
  68. Linninger AA, Gould IG, Marrinan T, Hsu CY, Chojecki M, Alaraj A. Cerebral microcirculation and oxygen tension in the human secondary cortex. Annals of Biomedical Engineering. 2013;41:2264–2284. doi: 10.1007/s10439-013-0828-0. [DOI] [PMC free article] [PubMed] [Google Scholar]
  69. Lorthois S, Cassot F, Lauwers F. Simulation study of brain blood flow regulation by intra-cortical arterioles in an anatomically accurate large human vascular network: part I: methodology and baseline flow. NeuroImage. 2011;54:1031–1042. doi: 10.1016/j.neuroimage.2010.09.032. [DOI] [PubMed] [Google Scholar]
  70. Lorthois S, Lauwers F. Control of brain blood flow by capillaries: a simulation study in an anatomically accurate large human vascular network. Computer Methods in Biomechanics and Biomedical Engineering. 2012;15 Suppl 1:66–68. doi: 10.1080/10255842.2012.713680. [DOI] [PubMed] [Google Scholar]
  71. Lücker A, Weber B, Jenny P. A dynamic model of oxygen transport from capillaries to tissue with moving red blood cells. American Journal of Physiology-Heart and Circulatory Physiology. 2015;308:H206–H216. doi: 10.1152/ajpheart.00447.2014. [DOI] [PubMed] [Google Scholar]
  72. Lücker A, Secomb TW, Weber B, Jenny P. The relative influence of hematocrit and red blood cell velocity on oxygen transport from capillaries to tissue. Microcirculation. 2017;24:e12337. doi: 10.1111/micc.12337. [DOI] [PMC free article] [PubMed] [Google Scholar]
  73. Lücker A, Secomb TW, Weber B, Jenny P. The relation between capillary transit times and hemoglobin saturation heterogeneity. Part 1: theoretical models. Frontiers in Physiology. 2018a;9 doi: 10.3389/fphys.2018.00420. [DOI] [PMC free article] [PubMed] [Google Scholar]
  74. Lücker A, Secomb TW, Barrett MJP, Weber B, Jenny P. The relation between Capillary transit times and hemoglobin saturation heterogeneity. Part 2: capillary networks. Frontiers in Physiology. 2018b;9 doi: 10.3389/fphys.2018.01296. [DOI] [PMC free article] [PubMed] [Google Scholar]
  75. Lyons DG, Parpaleix A, Roche M, Charpak S. Mapping oxygen concentration in the awake mouse brain. eLife. 2016;5:e12024. doi: 10.7554/eLife.12024. [DOI] [PMC free article] [PubMed] [Google Scholar]
  76. Mateo C, Avermann M, Gentet LJ, Zhang F, Deisseroth K, Petersen CC. In vivo optogenetic stimulation of neocortical excitatory neurons drives brain-state-dependent inhibition. Current Biology. 2011;21:1593–1602. doi: 10.1016/j.cub.2011.08.028. [DOI] [PubMed] [Google Scholar]
  77. Merkle CW, Srinivasan VJ. Laminar microvascular transit time distribution in the mouse somatosensory cortex revealed by dynamic contrast optical coherence tomography. NeuroImage. 2016;125:350–362. doi: 10.1016/j.neuroimage.2015.10.017. [DOI] [PMC free article] [PubMed] [Google Scholar]
  78. Mishra A, O'Farrell FM, Reynell C, Hamilton NB, Hall CN, Attwell D. Imaging pericytes and capillary diameter in brain slices and isolated retinae. Nature Protocols. 2014;9:323–336. doi: 10.1038/nprot.2014.019. [DOI] [PubMed] [Google Scholar]
  79. Moeini M, Lu X, Avti PK, Damseh R, Bélanger S, Picard F, Boas D, Kakkar A, Lesage F. Compromised microvascular oxygen delivery increases brain tissue vulnerability with age. Scientific Reports. 2018;8:8219. doi: 10.1038/s41598-018-26543-w. [DOI] [PMC free article] [PubMed] [Google Scholar]
  80. Momjian-Mayor I, Baron JC. The pathophysiology of watershed infarction in internal carotid artery disease: review of cerebral perfusion studies. Stroke. 2005;36:567–577. doi: 10.1161/01.STR.0000155727.82242.e1. [DOI] [PubMed] [Google Scholar]
  81. Müller K, Courtois G, Ursini MV, Schwaninger M. New insight into the pathogenesis of cerebral Small-Vessel diseases. Stroke. 2017;48:520–527. doi: 10.1161/STROKEAHA.116.012888. [DOI] [PubMed] [Google Scholar]
  82. Nguyen J, Nishimura N, Fetcho RN, Iadecola C, Schaffer CB. Occlusion of cortical ascending venules causes blood flow decreases, reversals in flow direction, and vessel dilation in upstream capillaries. Journal of Cerebral Blood Flow & Metabolism. 2011;31:2243–2254. doi: 10.1038/jcbfm.2011.95. [DOI] [PMC free article] [PubMed] [Google Scholar]
  83. Nielsen RB, Egefjord L, Angleys H, Mouridsen K, Gejl M, Møller A, Brock B, Brændgaard H, Gottrup H, Rungby J, Eskildsen SF, Østergaard L. Capillary dysfunction is associated with symptom severity and neurodegeneration in Alzheimer's disease. Alzheimer's & Dementia. 2017;13:1143–1153. doi: 10.1016/j.jalz.2017.02.007. [DOI] [PubMed] [Google Scholar]
  84. Ogawa S, Lee TM, Kay AR, Tank DW. Brain magnetic resonance imaging with contrast dependent on blood oxygenation. PNAS. 1990;87:9868–9872. doi: 10.1073/pnas.87.24.9868. [DOI] [PMC free article] [PubMed] [Google Scholar]
  85. Østergaard L, Aamand R, Gutiérrez-Jiménez E, Ho YC, Blicher JU, Madsen SM, Nagenthiraja K, Dalby RB, Drasbek KR, Møller A, Brændgaard H, Mouridsen K, Jespersen SN, Jensen MS, West MJ. The capillary dysfunction hypothesis of Alzheimer's disease. Neurobiology of Aging. 2013;34:1018–1031. doi: 10.1016/j.neurobiolaging.2012.09.011. [DOI] [PubMed] [Google Scholar]
  86. Østergaard L, Engedal TS, Aamand R, Mikkelsen R, Iversen NK, Anzabi M, Næss-Schmidt ET, Drasbek KR, Bay V, Blicher JU, Tietze A, Mikkelsen IK, Hansen B, Jespersen SN, Juul N, Sørensen JC, Rasmussen M. Capillary transit time heterogeneity and flow-metabolism coupling after traumatic brain injury. Journal of Cerebral Blood Flow & Metabolism. 2014a;34:1585–1598. doi: 10.1038/jcbfm.2014.131. [DOI] [PMC free article] [PubMed] [Google Scholar]
  87. Østergaard L, Kristiansen SB, Angleys H, Frøkiær J, Michael Hasenkam J, Jespersen SN, Bøtker HE. The role of capillary transit time heterogeneity in myocardial oxygenation and ischemic heart disease. Basic Research in Cardiology. 2014b;109:1–18. doi: 10.1007/s00395-014-0409-x. [DOI] [PMC free article] [PubMed] [Google Scholar]
  88. Otsu N. A threshold selection method from Gray-Level histograms. IEEE Transactions on Systems, Man, and Cybernetics. 1979;9:62–66. doi: 10.1109/TSMC.1979.4310076. [DOI] [Google Scholar]
  89. Pantoni L. Cerebral small vessel disease: from pathogenesis and clinical characteristics to therapeutic challenges. The Lancet Neurology. 2010;9:689–701. doi: 10.1016/S1474-4422(10)70104-6. [DOI] [PubMed] [Google Scholar]
  90. Parpaleix A, Goulam Houssen Y, Charpak S. Imaging local neuronal activity by monitoring PO₂ transients in capillaries. Nature Medicine. 2013;19:241–246. doi: 10.1038/nm.3059. [DOI] [PubMed] [Google Scholar]
  91. Patel U. Non-random distribution of blood vessels in the posterior region of the rat somatosensory cortex. Brain Research. 1983;289:65–70. doi: 10.1016/0006-8993(83)90006-9. [DOI] [PubMed] [Google Scholar]
  92. Paulson OB, Strandgaard S, Edvinsson L. Cerebral autoregulation. Cerebrovascular and Brain Metabolism Reviews. 1990;2:161–192. [PubMed] [Google Scholar]
  93. Peppiatt CM, Howarth C, Mobbs P, Attwell D. Bidirectional control of CNS capillary diameter by pericytes. Nature. 2006;443:700–704. doi: 10.1038/nature05193. [DOI] [PMC free article] [PubMed] [Google Scholar]
  94. Peyrounette M, Davit Y, Quintard M, Lorthois S. Multiscale modelling of blood flow in cerebral microcirculation: details at capillary scale control accuracy at the level of the cortex. PLOS ONE. 2018;13:e0189474. doi: 10.1371/journal.pone.0189474. [DOI] [PMC free article] [PubMed] [Google Scholar]
  95. Pittman RN. Regulation of Tissue Oxygenation. San Rafael: Morgan & Claypool Life Sciences; 2011. [PubMed] [Google Scholar]
  96. Popel AS. Theory of oxygen transport to tissue. Critical Reviews in Biomedical Engineering. 1989;17:257–321. [PMC free article] [PubMed] [Google Scholar]
  97. Pray HA. Solubility of hydrogen, oxygen, nitrogen, and Helium in water. Industrial and Engineering Chemistry. 1952;44:1146–1151. doi: 10.1021/ie50509a058. [DOI] [Google Scholar]
  98. Pries AR, Secomb TW, Gessner T, Sperandio MB, Gross JF, Gaehtgens P. Resistance to blood flow in microvessels in vivo. Circulation Research. 1994;75:904–915. doi: 10.1161/01.RES.75.5.904. [DOI] [PubMed] [Google Scholar]
  99. Pries AR, Secomb TW, Gaehtgens P. Structural adaptation and stability of microvascular networks: theory and simulations. American Journal of Physiology-Heart and Circulatory Physiology. 1998;275:H349–H360. doi: 10.1152/ajpheart.1998.275.2.H349. [DOI] [PubMed] [Google Scholar]
  100. Raichle ME, MacLeod AM, Snyder AZ, Powers WJ, Gusnard DA, Shulman GL. A default mode of brain function. PNAS. 2001;98:676–682. doi: 10.1073/pnas.98.2.676. [DOI] [PMC free article] [PubMed] [Google Scholar]
  101. Raichle ME, Gusnard DA. Appraising the brain's energy budget. PNAS. 2002;99:10237–10239. doi: 10.1073/pnas.172399499. [DOI] [PMC free article] [PubMed] [Google Scholar]
  102. Rasmussen PM, Jespersen SN, Østergaard L. The effects of transit time heterogeneity on brain oxygenation during rest and functional activation. Journal of Cerebral Blood Flow & Metabolism. 2015;35:432–442. doi: 10.1038/jcbfm.2014.213. [DOI] [PMC free article] [PubMed] [Google Scholar]
  103. Reglin B, Secomb TW, Pries AR. Structural adaptation of microvessel diameters in response to metabolic stimuli: where are the oxygen sensors? American Journal of Physiology-Heart and Circulatory Physiology. 2009;297:H2206–H2219. doi: 10.1152/ajpheart.00348.2009. [DOI] [PMC free article] [PubMed] [Google Scholar]
  104. Reglin B, Secomb TW, Pries AR. Structural control of microvessel diameters: origins of metabolic signals. Frontiers in Physiology. 2017;8:813. doi: 10.3389/fphys.2017.00813. [DOI] [PMC free article] [PubMed] [Google Scholar]
  105. Rosomoff HL, Holaday DA. Cerebral blood flow and cerebral oxygen consumption during hypothermia. American Journal of Physiology-Legacy Content. 1954;179:85–88. doi: 10.1152/ajplegacy.1954.179.1.85. [DOI] [PubMed] [Google Scholar]
  106. Rossing RG, Cain SM. A nomogram relating pO2, pH, temperature, and hemoglobin saturation in the dog. Journal of Applied Physiology. 1966;21:195–201. doi: 10.1152/jappl.1966.21.1.195. [DOI] [PubMed] [Google Scholar]
  107. Sakadzić S, Roussakis E, Yaseen MA, Mandeville ET, Srinivasan VJ, Arai K, Ruvinskaya S, Devor A, Lo EH, Vinogradov SA, Boas DA. Two-photon high-resolution measurement of partial pressure of oxygen in cerebral vasculature and tissue. Nature Methods. 2010;7:755–759. doi: 10.1038/nmeth.1490. [DOI] [PMC free article] [PubMed] [Google Scholar]
  108. Sakadžić S, Roussakis E, Yaseen MA, Mandeville ET, Srinivasan VJ, Arai K, Ruvinskaya S, Wu W, Devor A, Lo EH, Vinogradov SA, Boas DA. Cerebral blood oxygenation measurement based on oxygen-dependent quenching of phosphorescence. Journal of Visualized Experiments : JoVE. 2011 doi: 10.3791/1694. [DOI] [PMC free article] [PubMed] [Google Scholar]
  109. Sakadžić S, Mandeville ET, Gagnon L, Musacchia JJ, Yaseen MA, Yucel MA, Lefebvre J, Lesage F, Dale AM, Eikermann-Haerter K, Ayata C, Srinivasan VJ, Lo EH, Devor A, Boas DA. Large arteriolar component of oxygen delivery implies a safe margin of oxygen supply to cerebral tissue. Nature Communications. 2014;5:5734. doi: 10.1038/ncomms6734. [DOI] [PMC free article] [PubMed] [Google Scholar]
  110. Sakadžić S, Lee J, Boas DA, Ayata C. High-resolution in vivo optical imaging of stroke injury and repair. Brain Research. 2015;1623:174–192. doi: 10.1016/j.brainres.2015.04.044. [DOI] [PMC free article] [PubMed] [Google Scholar]
  111. Sakadžić S, Yaseen MA, Jaswal R, Roussakis E, Dale AM, Buxton RB, Vinogradov SA, Boas DA, Devor A. Two-photon microscopy measurement of cerebral metabolic rate of oxygen using periarteriolar oxygen concentration gradients. Neurophotonics. 2016;3:045005. doi: 10.1117/1.NPh.3.4.045005. [DOI] [PMC free article] [PubMed] [Google Scholar]
  112. Santisakultarm TP, Cornelius NR, Nishimura N, Schafer AI, Silver RT, Doerschuk PC, Olbricht WL, Schaffer CB. In vivo two-photon excited fluorescence microscopy reveals cardiac- and respiration-dependent pulsatile blood flow in cortical blood vessels in mice. American Journal of Physiology-Heart and Circulatory Physiology. 2012;302:H1367–H1377. doi: 10.1152/ajpheart.00417.2011. [DOI] [PMC free article] [PubMed] [Google Scholar]
  113. Santisakultarm TP, Paduano CQ, Stokol T, Southard TL, Nishimura N, Skoda RC, Olbricht WL, Schafer AI, Silver RT, Schaffer CB. Stalled cerebral capillary blood flow in mouse models of essential thrombocythemia and polycythemia vera revealed by in vivo two-photon imaging. Journal of Thrombosis and Haemostasis. 2014;12:2120–2130. doi: 10.1111/jth.12738. [DOI] [PubMed] [Google Scholar]
  114. Sato Y, Nakajima S, Shiraga N, Atsumi H, Yoshida S, Koller T, Gerig G, Kikinis R. Three-dimensional multi-scale line filter for segmentation and visualization of curvilinear structures in medical images. Medical Image Analysis. 1998;2:143–168. doi: 10.1016/S1361-8415(98)80009-1. [DOI] [PubMed] [Google Scholar]
  115. Schmid F, Tsai PS, Kleinfeld D, Jenny P, Weber B. Depth-dependent flow and pressure characteristics in cortical microvascular networks. PLOS Computational Biology. 2017;13:e1005392. doi: 10.1371/journal.pcbi.1005392. [DOI] [PMC free article] [PubMed] [Google Scholar]
  116. Secomb TW. Blood flow in the microcirculation. Annual Review of Fluid Mechanics. 2017;49:443–461. doi: 10.1146/annurev-fluid-010816-060302. [DOI] [Google Scholar]
  117. Shirey MJ, Smith JB, Kudlik DE, Huo BX, Greene SE, Drew PJ. Brief anesthesia, but not voluntary locomotion, significantly alters cortical temperature. Journal of Neurophysiology. 2015;114:309–322. doi: 10.1152/jn.00046.2015. [DOI] [PMC free article] [PubMed] [Google Scholar]
  118. Siero JC, Petridou N, Hoogduin H, Luijten PR, Ramsey NF. Cortical depth-dependent temporal dynamics of the BOLD response in the human brain. Journal of Cerebral Blood Flow & Metabolism. 2011;31:1999–2008. doi: 10.1038/jcbfm.2011.57. [DOI] [PMC free article] [PubMed] [Google Scholar]
  119. Silva AC, Koretsky AP. Laminar specificity of functional MRI onset times during somatosensory stimulation in rat. PNAS. 2002;99:15182–15187. doi: 10.1073/pnas.222561899. [DOI] [PMC free article] [PubMed] [Google Scholar]
  120. Soukup J, Zauner A, Doppenberg EM, Menzel M, Gilman C, Young HF, Bullock R. The importance of brain temperature in patients after severe head injury: relationship to intracranial pressure, cerebral perfusion pressure, cerebral blood flow, and outcome. Journal of Neurotrauma. 2002;19:559–571. doi: 10.1089/089771502753754046. [DOI] [PubMed] [Google Scholar]
  121. Srinivasan VJ, Yu E, Radhakrishnan H, Can A, Climov M, Leahy C, Ayata C, Eikermann-Haerter K. Micro-heterogeneity of flow in a mouse model of chronic cerebral hypoperfusion revealed by longitudinal doppler optical coherence tomography and angiography. Journal of Cerebral Blood Flow & Metabolism. 2015;35:1552–1560. doi: 10.1038/jcbfm.2015.175. [DOI] [PMC free article] [PubMed] [Google Scholar]
  122. Stefanovic B, Hutchinson E, Yakovleva V, Schram V, Russell JT, Belluscio L, Koretsky AP, Silva AC. Functional reactivity of cerebral capillaries. Journal of Cerebral Blood Flow & Metabolism. 2008;28:961–972. doi: 10.1038/sj.jcbfm.9600590. [DOI] [PMC free article] [PubMed] [Google Scholar]
  123. Uchida K, Reilly MP, Asakura T. Molecular stability and function of mouse hemoglobins. Zoological Science. 1998;15:703–706. doi: 10.2108/zsj.15.703. [DOI] [Google Scholar]
  124. Uhlirova H, Kılıç K, Tian P, Sakadžić S, Gagnon L, Thunemann M, Desjardins M, Saisan PA, Nizar K, Yaseen MA, Hagler DJ, Vandenberghe M, Djurovic S, Andreassen OA, Silva GA, Masliah E, Kleinfeld D, Vinogradov S, Buxton RB, Einevoll GT, Boas DA, Dale AM, Devor A. The roadmap for estimation of cell-type-specific neuronal activity from non-invasive measurements. Philosophical Transactions of the Royal Society B: Biological Sciences. 2016;371:20150356. doi: 10.1098/rstb.2015.0356. [DOI] [PMC free article] [PubMed] [Google Scholar]
  125. Unekawa M, Tomita M, Tomita Y, Toriumi H, Miyaki K, Suzuki N. RBC velocities in single capillaries of mouse and rat brains are the same, despite 10-fold difference in body size. Brain Research. 2010;1320:69–73. doi: 10.1016/j.brainres.2010.01.032. [DOI] [PubMed] [Google Scholar]
  126. VanTeeffelen JW, Constantinescu AA, Brands J, Spaan JA, Vink H. Bradykinin- and sodium nitroprusside-induced increases in capillary tube haematocrit in mouse cremaster muscle are associated with impaired glycocalyx barrier properties. The Journal of Physiology. 2008;586:3207–3218. doi: 10.1113/jphysiol.2008.152975. [DOI] [PMC free article] [PubMed] [Google Scholar]
  127. Vazquez AL, Cohen ER, Gulani V, Hernandez-Garcia L, Zheng Y, Lee GR, Kim SG, Grotberg JB, Noll DC. Vascular dynamics and BOLD fMRI: cbf level effects and analysis considerations. NeuroImage. 2006;32:1642–1655. doi: 10.1016/j.neuroimage.2006.04.195. [DOI] [PubMed] [Google Scholar]
  128. Vazquez AL, Masamoto K, Fukuda M, Kim SG. Cerebral oxygen delivery and consumption during evoked neural activity. Frontiers in Neuroenergetics. 2010;2 doi: 10.3389/fnene.2010.00011. [DOI] [PMC free article] [PubMed] [Google Scholar]
  129. Wang Y, Hu S, Maslov K, Zhang Y, Xia Y, Wang LV. In vivo integrated photoacoustic and confocal microscopy of hemoglobin oxygen saturation and oxygen partial pressure. Optics Letters. 2011;36:1029–1031. doi: 10.1364/OL.36.001029. [DOI] [PMC free article] [PubMed] [Google Scholar]
  130. Wardlaw JM, Smith C, Dichgans M. Mechanisms of sporadic cerebral small vessel disease: insights from neuroimaging. The Lancet Neurology. 2013;12:483–497. doi: 10.1016/S1474-4422(13)70060-7. [DOI] [PMC free article] [PubMed] [Google Scholar]
  131. Weber B, Keller AL, Reichold J, Logothetis NK. The microvascular system of the striate and extrastriate visual cortex of the macaque. Cerebral Cortex. 2008;18:2318–2330. doi: 10.1093/cercor/bhm259. [DOI] [PubMed] [Google Scholar]
  132. Whalen WJ, Nair P. Some factors affecting tissue Po2 in the carotid body. Journal of Applied Physiology. 1975;39:562–566. doi: 10.1152/jappl.1975.39.4.562. [DOI] [PubMed] [Google Scholar]
  133. Wu J, Guo C, Chen S, Jiang T, He Y, Ding W, Yang Z, Luo Q, Gong H. Direct 3D analyses reveal Barrel-Specific vascular distribution and Cross-Barrel branching in the mouse barrel cortex. Cerebral Cortex. 2016;26:23–31. doi: 10.1093/cercor/bhu166. [DOI] [PubMed] [Google Scholar]
  134. Yaseen MA, Srinivasan VJ, Sakadzić S, Wu W, Ruvinskaya S, Vinogradov SA, Boas DA. Optical monitoring of oxygen tension in cortical microvessels with confocal microscopy. Optics Express. 2009;17:22341–22350. doi: 10.1364/OE.17.022341. [DOI] [PMC free article] [PubMed] [Google Scholar]
  135. Yaseen MA, Srinivasan VJ, Gorczynska I, Fujimoto JG, Boas DA, Sakadžić S. Multimodal optical imaging system for in vivo investigation of cerebral oxygen delivery and energy metabolism. Biomedical Optics Express. 2015;6:4994–5007. doi: 10.1364/BOE.6.004994. [DOI] [PMC free article] [PubMed] [Google Scholar]
  136. Yu X, Qian C, Chen DY, Dodd SJ, Koretsky AP. Deciphering laminar-specific neural inputs with line-scanning fMRI. Nature Methods. 2014;11:55–58. doi: 10.1038/nmeth.2730. [DOI] [PMC free article] [PubMed] [Google Scholar]
  137. Zlokovic BV. Neurovascular pathways to neurodegeneration in Alzheimer's disease and other disorders. Nature Reviews Neuroscience. 2011;12:723–738. doi: 10.1038/nrn3114. [DOI] [PMC free article] [PubMed] [Google Scholar]

Decision letter

Editor: Serge Charpak1
Reviewed by: Serge Charpak2, Andreas Linninger3

In the interests of transparency, eLife includes the editorial decision letter and accompanying author responses. A lightly edited version of the letter sent to the authors after peer review is shown, indicating the most substantive concerns; minor comments are not usually included.

[Editors’ note: this article was originally rejected after discussions between the reviewers, but the authors were invited to resubmit after an appeal against the decision.]

Thank you for submitting your work entitled "Homogenization of capillary flow and oxygenation in deeper cortical layers correlates with increased oxygen extraction" for consideration by eLife. Your article has been reviewed by three peer reviewers, including Serge Charpak as the guest Reviewing Editor and Reviewer #1, and the evaluation has been overseen by a Senior Editor. The following individual involved in review of your submission has also agreed to reveal his identity: Andreas Linninger (Reviewer #2).

The reviewers have discussed the reviews with one another. All appreciated the quality of the data, however several analysis, hypothesis and statistical problems were raised, casting doubts on the article conclusion. As the amount of work required to improve the manuscript in a 2-month time period seems too important, the Reviewing and Senior Editors have taken the decision to reject the manuscript.

Please find below the detailed reviewer comments:

Reviewer #1:

Li's paper reports 2PLM measurements of PO2 in cortical vessels distributed from layer I-5, in awake mice. Using the new 2P phosphorescence probe PtTAPIP, synthesized by the group of S. Vinogradov (one of the co-authors) and which has an excellent 2PA cross section, the authors succeed in detecting all capillary parameters: mean-PO2, RBC flux and velocity and also erythrocyte-associated transients i.e. RBC PO2, Inter RBC-PO2. These measurements are reported for each layer of the cortex.

The work is interesting but lacks novelty and the analysis is not rigorously done. The Introduction requires a paragraph describing previous theoretical and experimental demonstrations of EATs and the scientific reasons for which the authors could not detected EATs previously. The community of 2PLM users is now expanding and it is important to mention all the flaws the initial labs working with this approach have been through. The introduction should properly describe previous 2PLM works reporting PO2 in mouse cortical layers. Surprisingly, the statistical tests are not adapted to the data preventing the interpretation of most comparisons. To conclude, the new dye is certainly a technical improvement, but the present manuscript requires major rewriting, analysis and does not reach the standards of eLife.

Technical comments:

Subsection “Calculation of capillary RBC flux, speed, and hematocrit”: The authors estimate RBC velocity as "v = ø/Δt, where Δt is the time for the RBC to pass through the focal zone, and ø is RBC diameter, assumed to be 6 μm (Unekawa et al., 2010). RBC diameter cannot assume to be 6 µm: in capillaries, RBC orientation and thus "RBC size" varies with capillary diameter, RBC density and velocity. As the shadow size in time, Δt, depends on the "RBC size", and thus velocity, it cannot be used to calculate velocity. All velocity measurements should be removed from the paper.

This also raises a problem in the way EATs are defined, as v.Δt is used to determine the distance to the nearest RBC center. I suggest that the authors reanalyze their data considering time and not distance to extract EATs.

Subsection “Calculation of capillary RBC flux, speed, and hematocrit”: The authors make the same mistake as Parpaleix et al., (2013) and Lyons et al., (2016) in the way they estimate hematocrit, which is normally a measure of blood volume percentage: "Hematocrit was estimated as the ratio of the combined duration of all valleys associated with the RBC passages to the duration of the entire time course." Because RBC elongation varies with velocity (see first comment), the hematocrit calculated in the paper will depend on velocity. The authors should name differently what is actually measured.

It is difficult to understand how RBC PO2 was determined. Could the authors elaborate on their approach: did they consider the first bin ("micron") or an average several bins to determine RBC PO2? Additionally, the use of the criterion of "the central 40% of the peaks in the binary segmented time course" to extract InterRBC-PO2 could be prone to error. Given that the InterRBC-PO2 is defined at the lowest value of plasma PO2 reached between the passage of RBCs, when the RBC flux is low, the use of the central 40% criterion could yield an accurate value of the this parameter, but is likely to become less accurate with increasing RBC flux, as the period when the plasma PO2 is at its minimum will be shorter, and the inflection will be sharper. The use of this criterion should be validated, comparing the InterRBC-PO2 value it provides with those values that are extracted from more restricted windows at greater distance from the RBCs.

All statistics are based on Student's t-test whereas in almost all comparisons, ANOVA test with multiple comparison analysis should be used.

Subsection “Calculation of capillary PO2 gradients and EATs” and subsection “Accumulated oxygen extraction fraction increases in deeper cortical layers” The authors estimate layer-specific oxygen extraction fraction by comparing the PO2 in arterioles and venules at a given depth. This approach tacitly assumes that a layer-specific network of microvessels connects arterioles and venules in this layer, and that all RBCs which leave arterioles in the given FOV and layer flow into venules in that same field of view and layer. The authors should cite which theoretical and experimental papers support the hypothesis. In addition, as they have the tools to reconstruct easily the vascular angiograms, they should trace a series of pathways from the pre-capillary arteriole to the post-capillary venule in order to verify the hypothesis, which is key for the paper. They could potentially limit their investigation to layer I and IV pathways, which are likely to differ.

Is the mouse's head rotated around the rostro-caudal axis during the 2PLM sessions? If not (and unless the objective lens can be inclined, thought this doesn't appear to be the case in Supplementary Figure 1(b)), due to the inclination of the cortical surface at the coordinates of the barrel field it is probable that there is a discrepancy between the reported measurement depths and the true depth of measurement in the cortex. As illustration, the approximately 40-45 degree inclination of the cortex relative to the horizontal at the level of the S1 barrel field (as per Paxinos and Watson), would mean that the maximum reported imaging depth of 600 micros would infact correspond to a true cortical depth of approximately 460 microns. Thus, the assignation of the measurements to different layers will be compromised. Conversely, if the mouse head is rotated, could the authors note this and comment on the likely effect on the comfort and behavioural state of the mouse during the imaging sessions.

Biological:

3D projections of PO2 maps (Figure 1G) are made with acquisitions lasting only 0.6 seconds (2000 decays). This is really short as PO2 varies with time. It is clearly shown in Figure 5. PO2 may change by more than a factor 2 within 9 s. Therefore, PO2 maps using such brief acquisitions will change dramatically from one acquisition to the other. What is the scientific value of such 3D map? In addition, it artificially increases the number of vessels imaged.

If this approach was also used to build Figure 2, it strongly decreases its significance.

In the absence of proper statistics, Figure 3, Figure 4, Figure 5, Figure 6 and Figure 7 cannot be interpreted.

In their 2014 paper, the authors reported that PO2 decreases with the capillary order. Could the author verify if their findings hold true in the awake mouse? This would require a simple analysis regrouping A1, A2 and A3 capillaries.

Given the concerns raised above about the definition of RBC-PO2 in capillaries and the method for estimation of OEF by comparing arterioles and venules (and indeed A1-A3 and V1-V3 capillaires) in the same layer, it follows that the estimation of the relative contribution of different vascular compartments and the related conclusions (Subsection “Low oxygen extraction along the superficial capillary paths contributes to an increase in the mean venular SO2 towards cortical surface”) are questionable.

Reviewer #2:

The article presents novel data on hemodynamic states in the different layers of the whisker barrel cortex of awake mice. in vivo data are acquired using a novel oxygen probing technique with two-photon phosphorescence lifetime microscopy. Specifically, steady averaged oxygen pressures and red blood cell (RBC) flux counts were acquired. In addition, temporal variations within a 9s observation window were collected. A detailed statistical analysis of the layer dependence of oxygenation and RBC fluxes is presented. The main conclusions include the experimental observation of depth dependence of oxygen extraction, and a reduction in the RBC flux variability with increasing cortical depth. This study presents an invaluable experimental body of work that will help to elucidate oxygen extraction mechanisms in the mouse cortex and create in vivo data for mechanistic models to explain the physiochemical principles that drive and control cerebral blood flow and metabolism. This is a significant piece of work which I highly recommend for publication after modifications listed below:

Technical comments:

Introduction. The EAT is used to characterize the heterogeneity of the oxygen extraction within capillaries. What is the physical rationale for correlating oxygen point measurements to intracapillary resistance to oxygen delivery? Are these measurements for erythrocyte bound versus unbound oxygen in plasma? How is this EAT related to oxygen saturation?

It appears that measurements of RBC fluxes (RBC counts) assume that signals are generated from individual RBCs that are sharply separated. Figure 1C shows signals with different durations (and intensity). Is it possible that two aligned RBCs (two or more RBCs in file) may cause a longer signal that is indistinguishable from a single slow RBC? How would this affect the analysis of RBC fluxes?

In the Introduction, the authors cite the next generation of biophysical models, which with the exception of Gagnon's 2016 paper do not correspond to the anatomical detail presented in this study. Layer specific oxygen consumption has been predicted by recent biophysical models that match the detailed anatomical scope and three-dimensional resolution of the proposed experimental study. For example, three dimensional predictions of depth dependent oxygen gradients in mouse are given in Gould et al., 2017. Biophysical models to predict depth dependent oxygen gradients in humans are presented in Linninger et al., 2013 and Gould and Linninger, 2015. These studies have been successful in solving oxygen delivery to brain tissue coupled with biphasic blood flow in a realistic cortical microanatomy and are therefore perfectly aligned with the scope of the current study. These advancements should therefore be incorporated and discussed.

Subsection “Accumulated oxygen extraction fraction increases in deeper cortical layers”. The data in Figure 2 seem to refer to steady magnitudes or levels, the use of the word "amplitudes" seems ambiguous.

Subsection “Capillary RBC flux and oxygenation homogenize in deeper cortical layers”. The prediction that homogenization of RBC flow velocity enhances the oxygen extraction is made based on a single segment analysis in the cited biophysical model. Here, experiments are presented for a three-dimensional vascular network. I am uncertain whether the two scopes are really "in line" with each other as suggested in the current text.

Figure 5. The trend line in Figure 5 does not intersect at zero. What does the non-zero intercept of roughly 16-18mmHg pO2 mean? Should the trend have a zero intercept?

Subsection “Capillary RBC flux and oxygenation homogenize in deeper cortical layers”. The number of segments in layer IV and V have only half the segments than layer I-III. Could this affect the statistics? If not, this observation should be listed in the limitations.

The assignment of upstream capillaries A1-A3 and downstream capillaries V1-V3 was done manually. Is it hard to imagine that roughly hundred segments (=according to subsection “Low oxygen extraction along the superficial capillary paths contributes to an increase in the mean venular SO2 towards cortical surface”, the analysis included 97 segments for all mice specimen) were identified by hand without the aid of image filters (e.g. Blinder et al., 2013; Hsu et al., 2017) in combination with automatic segmentation.

In subsection “Low oxygen extraction along the superficial capillary paths contributes to an increase in the mean venular SO2 towards cortical surface” it is argued that the manual method provides statistical power. It is not clear what statistical power is referred to? I suspect that the results could come out quite differently, if labels were assigned differently. Is there any data on operator dependence of the labeling method? I recommend to consider writing the discussion section more cautiously to reflect that results are based on an operator dependent method with high uncertainty in segmentation, and that major results would not be affected by uncertainty associated with operator dependence in upstream and downstream labeling. This point is optional to the discretion of the authors.

Subsection “Low oxygen extraction along the superficial capillary paths contributes to an increase in the mean venular SO2 towards cortical surface”. The hematocrit changes were reported between upstream (A1-A3) and downstream capillaries (V1-V3). Why did the study not explore layer dependence or branch hierarchy dependence (Strahler order analysis) of hematocrit?

Discussion section. The RBC flux is equal to the product of bulk flow rate and hematocrit (volume fraction). How should we understand the variance reduction in RBC flux without any relation to variations in hematocrit, since the quantities are directly related?

Discussion section. The wide variability of hemodynamic states (high heterogeneity of capillary flow and oxygenation) was predicted previously in a biophysical model by Gould et al.,.2017. It would be helpful if the experimental results could be aligned with already completed theoretical work that aims at addressing the same points as those that are here so elegantly presented experimentally.

In the same vein, it is worth mentioning that a main finding of the reduced variance of RBC fluxes was just recently predicted covering the whisker barrel mouse cortex with extension to the entire MCA territory (Hartung et al., 2018). The experiments confirm several findings so that the predictive model results are highly relevant for this study and should be discussed.

Reviewer #3:

The work addresses highly relevant questions (depth-dependent difference, homogeneity/heterogeneity of microvascular flow and oxygenation). The amount of measurements performed is significant and the capabilities of the new oxygen probe PtTAPIP to measure a variety of blood flow characteristics in large cortical depths is nicely demonstrated. However, we have major concerns regarding some of the analysis performed and some of the conclusions drawn (listed below). Furthermore, there is a significant shortcoming in referencing earlier work. It remains unclear, where the current work goes beyond what was published before.

Essential revisions:

1) Calculation of capillary RBC flux, speed and hematocrit (subsection “Calculation of capillary RBC flux, speed, and hematocrit”):

As the authors are well aware, the methods presented to compute RBC flux, RBC speed and hematocrit are only valid in vessels where single file flow persists. The authors write that those measurements were performed in "capillaries". However, it remains unclear how capillaries were identified as capillaries. Were diameter measurements performed? As the RBC diameter of the mouse is 6 µm, single file flow can only be expected for vessel diameters < 6 µm. This aspect is key for the validity of the results. We propose that the authors come up with a table describing the measured vessels (type, depth, number) for clarity.

1a) Additional Concern regarding velocity calculations (subsection “Calculation of capillary RBC flux, speed, and hematocrit”):

Characteristics Mouse RBC: Diameter 6 µm, Volume: 45.5 µm3 (Windberger et al., 2013), Thickness: 1.6 µm.

Assuming that each RBC is 6 µm is not correct. Especially, in larger vessels the RBC orientation makes a significant difference in the proposed velocity calculation (by a factor of ~4).

For vessel diameters <5.5 µm the applied velocity calculation is more suitable, because here RBCs need to squeeze into the vessel. However, also here we need to account for changes in RBC length depending on the vessel diameter.

In summary, the presented approach gives at best a rough estimate of the RBC velocity and it remains unclear, why the authors have not chosen line scans that would be so much more appropriate.

1b) Additional Concern regarding hematocrit calculations (subsection “Calculation of capillary RBC flux, speed, and hematocrit”):

The hematocrit computation is based on the assumption that plasma and RBCs have the same velocity. However, RBCs travel on average faster than plasma (Fahraeus effect). This velocity difference can cause an underestimation of hematocrit. Even so this approach is used frequently this assumption should be described and the term "line-density" should be used instead of "hematocrit".

1c) Additional Concern regarding flux and velocity calculation (subsection “Calculation of capillary RBC flux, speed, and hematocrit”):

For the flux and velocity computation it is crucial that individual RBCs can be distinguished from another. Can this be guaranteed for all hematocrit levels? Some discussion/comments should be added.

1d) Selection of vessels for analysis (Subsection “Capillary RBC flux and oxygenation homogenize in deeper cortical layers”, subsection “Imaging of EATs and capillary RBC flow”):

The selection criterion for the vessels that have been chosen to analyse flow properties are not described. Moreover, it remains unclear why the number of vessels investigated per layer differs so significantly (400, 356, 118, 104).

2) Quantification of the temporal fluctuations of capillary Mean-PO2, RBC flux, speed and hematocrit (subsection “Quantification of the temporal fluctuations of capillary Mean-PO2, RBC flux, speed, and hematocrit”, Discussion section):

On the one hand, the chosen measurement time is rather short for a good averaging of the readouts. On the other hand, an averaging interval of 0.6 s is too large to resolve fluctuations in the capillary bed. An RBC with an average velocity of 1mm/s would travel 600 µm during that time. So, for the overall statistics, longer periods should be measured, but for describing the fluctuations over time, those segments should be split up into smaller than 0.6 s intervals, so that the fluctuations are dampened too much due to the averaging.

The arguments given in the discussion for the chosen interval seem to be motivated by dynamics on a larger scale but not by microvascular fluctuations. Why is the rate of oxygen consumption relevant for the capturing microvascular flow dynamics?

Alternatively, it has to be described more clearly that only fluctuations on the time scale of seconds are analysed and that faster fluctuations persist but are not of interest in the current study.

3) Analysis of EATs:

Intracapillary resistance of oxygen transport to tissue decreases in deeper cortical layers (subsection “Intracapillary resistance of oxygen transport to tissue decreases in deeper cortical layers”) and Low oxygen extraction along the superficial capillary paths contributes to an increase in the mean venular SO2 towards cortical surface (subsection “Low oxygen extraction along the superficial capillary paths contributes to an increase in the mean venular SO2 towards cortical surface”):

In order to understand the observed EAT trends, it is crucial to also analyse RBC-PO2 and interRBC-PO2. This aspect has been neglected for most EAT results. As such, possible reasons for the observed EAT drop in Figure 6C and the EAT increase in V1-V3 segments have not been analysed sufficiently (Based on Figure 3—figure supplement 1ARBC-PO2 does not drop? Thus interRBC-PO2 should rise for deeper layers to explain the EAT drop? How can a rise in RBC-PO2 and interRBC-PO2 for deeper cortical layers be explained? A higher interRBC-PO2 would however suggest a "higher intercapillary resistance to oxygen transport" instead of a lower one.)

Moreover, the EAT strongly depends on the distance of the capillary to the arteriole/venule (see Figure 7C). This impact should be discussed, e.g. how do you make sure that your depth-dependent EAT average is not affected by a larger number capillaries close to arterioles?

In an earlier work by the same authors, they did not observe EATs. The authors should discuss in detail where this discrepancy originates from.

4) Depth-dependent oxygen extraction (subsection “Accumulated oxygen extraction fraction increases in deeper cortical layers”, Discussion section):

We generally agree with the idea to use the difference in oxygen saturation as an indicator of oxygen extraction. However, as also shown in this work here, many factors have an impact on the oxygen saturation. Thus, saturation difference is not always equal to oxygen extraction. For example, higher blood flow in layer I leads to a higher oxygen availability in layer I and thus to higher SO2 values in the venules, even if the oxygen extraction is constant over depth.

"Benefitting from the improved sensitivity of the new oxygen probe, we were able to measure intracapillary longitudinal PO2 gradients in a larger number of capillaries…" why does the application of the improved probe help to increase the number of vessels measured?

[Editors’ note: what now follows is the decision letter after the authors submitted for further consideration.]

Thank you for submitting your article "More homogeneous capillary flow and oxygenation in deeper cortical layers correlate with increased oxygen extraction" for consideration by eLife. Your article has been reviewed by three peer reviewers, including Serge Charpak as the guest Reviewing Editor and Reviewer #1, and the evaluation has been overseen by Timothy Behrens as the Senior Editor. The following individual involved in review of your submission has also agreed to reveal his identity: Andreas Linninger (Reviewer #2).

The reviewers have discussed the reviews with one another and the Reviewing editor has drafted this decision to help you prepare a revised submission. All reviewers believe that the work is interesting. They however raised a number of questions that I ask you to address and which would clarify the manuscript. No new data is required. I have summarized the key questions:

1) The demonstration that RBC size can be estimated from the 2PLM measurements is still not convincing. The way you analyzed your new data is not informative: Comparing the mean RBC values from 58 capillaries measured with Line-Scan and Point-Scan (Author response image 2) does not solve the problem, in particular as the variability is large. Please show the plot in Author response image 2A, with lines joining each values, capillary per capillary. It is important as Author response image 2B and C already seem to demonstrate that RBC longitudinal size varies a lot. The 3 reviewers believe that if your new analysis reveals that RBC size cannot be accurately estimated, all RBC velocity data should be removed from the paper and the resulting uncertainty of RBC PO2 measurements be carefully addressed in the discussion.

Author response image 2. Comparison between the RBC speed measurements by the line-scan and point-scan method.

Author response image 2.

The measurements were performed in 58 capillaries across two mice within cortical depth of 0-200 µm. The statistical comparison wascarried out using Student’s t-test, but no statistical significance was found.

2) Please address in the discussion the issue that a saturation difference may depend on several factors.

3) Add the plot for interRBC-PO2 over depth to the supplementary figures.

4) Add in the Impact Statement that the measurements are done at the steady state.

The reviewers have added some comments (see the full reviews attached below) to which you could briefly answer.

Reviewer #1:

The authors have made new experiments, new analysis and the text has improved. Previous works are now better described and discussed. The statistics are more appropriate.

The new experiments and analysis done in response to comments #2 and #3 are interesting but they do not fully address the issues raised. This concerns primarily RBC velocity measurements. The good news is that it could be easily done with simple analysis without any further experiment.

The authors initially used the assumption of an identical average size of RBCs to base other calculations, in particular RBC speed. They now show new experiments which results are summarized in several "R1" plots. The plots show that RBC longitudinal size is very variable, increasing very significantly with RBC speed and spreading from 3 to 14 µm (R1C1261 c plot (<30% RBC line-density)). This clearly indicates that RBC shadows measured during PO2 acquisitions cannot be used to estimate RBC speed. Note that the authors should give the "n" for each of the groups of capillaries in all the new "R1" plots.

This variability of RBC size is unfortunately masked in the R1C2-2 plot. This plot needs to show paired measurements in specific capillaries, the question being whether or not similar values of RBC velocity are recorded by the two methods when (presumably) similar real RBC velocities are measured. Showing population averages for the 58 capillaries assessed occludes the similarity/difference on a capillary by capillary basis. The important point here is that all the data are already acquired, for capillaries of known diameters. So the authors could now easily compare RBC values for paired measurements (with the 2 methods) in capillaries of different diameters. Please indicate the "n" for each of the groups of capillaries and plot, for each group, all RBC speed values measured with the 2 methods. I suspect that the authors will find differences with the two techniques. This would invalidate all RBC measurements obtained with point scan PO2 acquisitions.

It is important that the authors clarify the point as fluctuations of RBC shadows, whether measured in distance or time from the center of the shadow, will modify the RBC PO2 value. In fact, it will decrease RBC PO2 and thus the EAT amplitude. Could the authors measure the decays as a function of time, but after an alignment at the RBC border? This would solve the problem.

Reviewer #2:

The authors have addressed all previous concerns and submitted a more concise revised manuscript. Well done.

Reviewer #4:

To the editors:

Overall the authors improved their manuscript by clarifying various methodological issues and by providing a more detailed introduction and discussion. Nonetheless, some major issues remain. In my opinion the evidence for some of the major results is not strong enough or to put it differently the claims are currently too strong for the presented results. To be more precise: (1) I am still not convinced by the RBC speed calculation (comment #1a). (2) Oxygen extraction and saturation difference are not necessarily equivalent (comment #4). (3) The analysis of the depth dependent EATs should be more rigorous (comment #3). Nonetheless, I believe that this work is relevant and builds onto a large body of experimental work. It can be further improved by a more rigorous analysis of the available data and a more concise discussion of the uncertainties in the presented results. However, this may require that some of the conclusions of the manuscript are slightly weakened/adapted. More details on the major issues are provided in the detailed reply, which follows below.

I thank the authors for the additional explanations and the adjustments made. Below I list the comments where additional clarification is necessary in order to answer the initial question. Only the comments where further adjustments are necessary are listed. The ones where major issues remain are highlighted and positioned at the beginning.

I also read the comments of reviewers 1 and 2 as well as the subsequent changes to the manuscript. As some of the points raised by the other reviewers are very relevant, I added an additional comment for some of them.

The additional studies are an important step to judge the accuracy of the RBC velocity measurements.

However, the following major concerns remain:

- Author response image 2: a scatter plot that directly compares the RBC velocity from the line-scan and the point measurement would be more appropriate. Additionally, the average relative difference between the two measurements should be provided.

- Author response image 7: The results clearly show that there is significant variability in the longitudinal RBC size (CV = 0.4, longitudinal sizes ranging from 4-14 µm). Moreover, the RBC longitudinal RBC size is correlated with the RBC speed and the RBC Line-Density. It is impossible to estimate the impact of these dependencies on the presented RBC speed results.

Author response image 7. Correlation between the line-scan and point-scan RBC-speed values in the capillaries having the diameter of 2-3 µm (left panel) and 3-5 µm (right panel).

Author response image 7.

I thank the authors for the additional explanations regarding IVR and I believe that the changes in the discussion are very valuable. However, some aspects of my initial comment have not been addressed.

The EAT is computed from the RBC-PO2 and the interRBC-PO2. As such I believe that EAT, RBC-PO2 and interRBC-PO2 should always be analysed and discussed hand in hand. Thus, it would be valuable for the manuscript to add the plot for the interRBC-PO2 over depth to the supplementary figures and to discuss RBC-PO2 and interRBC-PO2. Moreover, I suggest to add and discuss the EAT STD & CV plots over depth as it is done for all other quantities.

As stated in my original comment it is a surprising results that RBC-PO2 increases over depth and I don't know which mechanism could explain this increases (Figure 3—figure supplement 1). The same holds for interRBC-PO2 (which has to increase more than RBC PO2 in order to explain the EAT drop over depth). I do not ask for additional experiments, but I believe that is important to discuss these trends.

In my initial question I asked how the author's ensured that the depth-dependent differences are not affect by the position of the chosen capillaries along the capillary pathway or to put it differently how the capillaries were chosen over depth to guarantee an equal distribution of "upstream" and "downstream" capillaries. I kindly ask the author to describe if this has been considered in some way? If it has not been considered the possible impact on the depth dependent results should be discussed.

The EAT drop over depth is one of the major results of this manuscript and as the authors state in the discussion "EAT measurements are typically much noisier" (Discussion section). Consequently, I believe that the available data should be analysed as rigorously as possible.

I disagree with the given explanations why RBC flux in layer IV is supposed to be higher than in layer I. What matters here is not the average RBC flux and the higher capillary density per layer but the flux into the capillary bed per layer or to put it differently the flux out of the diving arterioles per layer.

The given arguments connecting average RBC flux and capillary density are not plausible. I try to explain this with a simplified example. Imaging two similar tissue volumes: One with a single vessel and flow rate q1 through that vessel. The second one also has an inflow rate of q1 but the vessel splits in two vessels. In both cases the inflow (and thus the oxygen availability) per tissue volume is the same. The vessel density is however higher in the second one. The authors now argue that the macroscopic flow rate would be larger in the second example, which is not true.

Of course, higher vessel density, i.e. more flow pathways, might have an effect on the overall flow rate. However, many open questions remain regarding these issues and simply relating RBC flux and capillary density to estimate the overall flow is not correct.

The referenced figures (Suppl. Figure 7b in Sakadazic et al., 2014 and Figure 2c in Gould et al., 2017) show the number of capillary segments, which is not the same as vessel density.

In the original work from Blinder et al., 2013 Figure 2c the capillary density increased from ~4% in layer I to ~5% in layer IV, which is an increase by ~20% but not by 50%.

Taken together, my initial question remains, i.e. the depth-dependent blood flow/oxygen availability has a strong impact on the actual oxygen extraction per layer. This should be discussed properly. Maybe it would good to change the variable name to depth-dependent saturation difference or comparable, because the term oxygen extraction seems to be misleading.

I believe the impact statement should be improved. "Homogenization", "Mechanism" and "adapts" suggest that the presented study looks at active mechanisms or dynamic changes. However, the work is a detailed description of the steady state flow and oxygen distribution.

[Editors’ note: further revisions were suggested before acceptance, as shown below.]

Thank you for resubmitting your work entitled "More homogeneous capillary flow and oxygenation in deeper cortical layers correlate with increased oxygen extraction" for further consideration at eLife. Your revised version has been discussed by the peer reviewers that raised some issues about your previous version and overseen by Serge Charpak as the guest Reviewing Editor and Timothy Behrens as the Senior Editor.

All acknowledged your efforts in responding to their comments. Most of your responses are satisfactory but some reviewers raised the concerns that your manuscript does not reflect at all the intense and fruitful discussion that occurred during the reviewing process. As the Reviewing Editor, I am pleased to inform you that your work is suitable for publication in eLife, providing that you include in the manuscript your responses to some of the questions/responses raised during the process of reviewing (see below). Note that most controversial points have been discarded. This will not take you more than a couple of hours and I will be pleased to address your revised version to the production department.

Please add in the manuscript:

Measurements of RBC velocity:

Several reviewers are still not fully convinced but accepted that the data are included in supplementary figures, providing that you add your work done to estimate the RBC size. The sole sentence line 145 (RBC speed calculation was model based …) and the discussion on RBC size are not fully satisfactory.

To end the controversy, I propose the following:

1) Subsection “Oxygen extraction fraction increases in the deeper cortical layers”: substitute the sentence by something like: "Note that as the instantaneous RBC shadow varies with both RBC speed, position and vessel size (see Figure 1—figure supplement 1), RBC speed calculation was model-based by assuming a constant RBC size (6µ)(Unekawaet al., 2010).

2) In Figure 1—figure supplement 1 (it will replace the current supplementary figure 1 which is not informative) please add the following plots which are interesting, justify the model based-choice and explain the problem of point measurements to estimate the RBC speed:

Add the plot from your summary comment (Title comparison between the RBC speed measurements by the line-scan and point-scan method.)

Add the new Author response image 7 plot (title Correlation between the line-scan and point-scan RBC-speed values in the capillaries having the diameter of 2-3 μm (left panel) and 3-5 μm (right panel)).

Add the plot Author response image 1 from your former response (Title a-c. RBC longitudinal size vs. capillary diameter, RBC speed, and line-density, respectively.)

Author response image 1. RBC longitudinal size vs. capillary diameter, RBC speed, and line-density, respectively.

Author response image 1.

The measurements were performed in 58 capillaries in two awake mice, within the cortical depth of 0-200 µm. The statistical comparison in panel a was carried out using Student’s t-test. The statistical comparisons in panels b-c were carried out using ANOVA followed by a Tukey-HSD post-hoc test. The asterisk symbol indicates P<0.05.

3) Add the comments on these findings in the Discussion section.

Smaller EATs in layer IV:

Include in the discussion your detailed responses to the following points:

The increase in interRBC-PO2 and RBC-PO2 over depth, which is a very surprising result, as generally the most saturated RBCs enter the vasculature at the surface.

The impact of the sampling of "upstream" and "downstream" vessels and their distribution over depth.

Saturation difference/oxygen extraction:

As oxygen extraction, saturation difference and total blood flow are related quantities, it is important to add this information at two locations:

- where the depth-dependent oxygen extraction fraction is introduced (subsection “Oxygen extraction fraction increases in the deeper cortical layers”) and

- where the calculation of the depth-dependent OEF is described (subsection “Calculation of SO2 and depth-dependent OEF.”).

eLife. 2019 Jul 15;8:e42299. doi: 10.7554/eLife.42299.035

Author response


[Editors’ note: the author responses to the first round of peer review follow.]

The reviewers have discussed the reviews with one another. All appreciated the quality of the data, however several analysis, hypothesis and statistical problems were raised, casting doubts on the article conclusion. As the amount of work required to improve the manuscript in a 2-month time period seems too important, the Reviewing and Senior Editors have taken the decision to reject the manuscript.

Thank you for giving our manuscript an opportunity to be reviewed by three experts in the field. They raised several important questions and provided valuable suggestions how to improve the manuscript. While we understand the reasons behind this decision, we would like to reassure you that we can fully address the comments within the 2-month time period.

Please find below the detailed reviewer comments:

Reviewer #1:

Li's paper reports 2PLM measurements of PO2 in cortical vessels distributed from layer I-5, in awake mice. Using the new 2P phosphorescence probe PtTAPIP, synthesized by the group of S. Vinogradov (one of the co-authors) and which has an excellent 2PA cross section, the authors succeed in detecting all capillary parameters: mean-PO2, RBC flux and velocity and also erythrocyte-associated transients i.e. RBC PO2, Inter RBC-PO2. These measurements are reported for each layer of the cortex.

The work is interesting but lacks novelty and the analysis is not rigorously done. The Introduction requires a paragraph describing previous theoretical and experimental demonstrations of EATs and the scientific reasons for which the authors could not detected EATs previously. The community of 2PLM users is now expanding and it is important to mention all the flaws the initial labs working with this approach have been through. The introduction should properly describe previous 2PLM works reporting PO2 in mouse cortical layers. Surprisingly, the statistical tests are not adapted to the data preventing the interpretation of most comparisons. To conclude, the new dye is certainly a technical improvement, but the present manuscript requires major rewriting, analysis and does not reach the standards of eLife.

We added the following text to the Introduction to include more details about the previous EATs modeling and measuring:

“The development of 2PLM of oxygen also enabled measurements of erythrocyte-associated transients (EATs) in cortical capillaries (Lecoq et al., 2011). EATs were first theoretically predicted by Hellums (Hellums, 1977) and extensively investigated over the last four decades using analytical and numerical approaches (Federspiel and Popel, 1986; Hellums, 1977; Lücker et al., 2015, 2017; Popel, 1989). Originally, they were experimentally observed in peripheral capillaries (Barker et al., 2007; Golub and Pittman, 2005), but the full confirmation within the more challenging three-dimensional cortical capillary network was made possible only recently with advent of 2PLM (Lecoq et al., 2011; Lyons et al., 2016; Parpaleix et al., 2013). Since EATs are tightly related to the intravascular resistance to oxygen transport to tissue, their direct measurements are critical for better understanding of the oxygen delivery through the capillary network. However, the dependence of EATs on cortical layer has not been fully explored.”

We respectfully disagree with the comment about the novelty. Our measurements not only probed deeper cortical layers than previously reported, but, importantly, we have found evidence that several parameters relevant for O2 transport to tissue are more homogeneous in deeper, presumably more energy demanding cortical layers, at rest. This has been proposed as a mechanism that facilitates O2 transport to tissue by several recent theoretical works. In addition, several new types of measurements in awake mice are presented in our manuscript, including O2 extraction in different cortical layers, arteriolar contribution to O2 delivery, and correlations between the fluctuations of capillary blood flow parameters. Having said that, we do agree with the reviewer that Introduction and Discussion section should be updated to better clarify these points as well as to provide better referencing and comparison with the previous findings. For the related changes in the manuscript text, please see our response to comment #7 by reviewer 3, who had similar requests for updating the text.

In the revised manuscript we applied ANOVA test to all the data whenever appropriate. The new statistical analysis did not change most important conclusions from the original submission. We revised the text in the Method section, subsection Statistical analysis, and it now reads:

“Statistical comparisons were carried out using ANOVA or t-test (MATLAB, MathWorks Inc). P value less than 0.05 was considered statistically significant. Details about the statistical analysis and measurement information are provided in the figure legends and/or text, where relevant.”

We agree that it is helpful to provide more details about the differences between previous EATs measurements by using the same imaging technology. The following sentences were added to Discussion section:

“We would also like to mention that some discrepancy exists between the magnitudes of EATs measured using 2PLM by different groups. For example, rather large EATs were reported in (Lecoq et al., 2011; Lyons et al., 2016; Parpaleix et al., 2013) with the PtP-C343 probe. Much smaller EATs (only a few mmHg) were reported in (Sakadžić et al., 2014) using the same probe, and moderate EATs are reported in the present work based on the measurements using the new probe – Oxyphor2P. It should be mentioned that the data underlying the EATs measurements are typically much noisier than those used to derive mean intravascular and tissue PO2's, since to quantify EATs the signals have to be split into multiple bins at different spatial or temporal distances from RBCs. In addition, the previously used probe PtP-C343 has intrinsically non-single-exponential phosphorescence decay and much lower emission quantum yield. These limitations, in combination with potentially slightly different implementations of acquisition protocols and algorithms for fitting the phosphorescence decay data, are likely to be the dominant factor contributing to the differences in the reported EATs magnitudes. By using Oxyphor2P, which has much stronger signal and much better defined single-exponential decay, making data analysis much more robust, here we greatly reduced uncertainty in the measurements of EATs, which was inherent to the previous probe PtP-C343. Nevertheless, we still would like to emphasize the importance of aligning the acquisition and data analysis protocols across the labs as well as using the same data acquisition protocols during measurement as used for probe calibration.”

Technical comments:

Subsection “Calculation of capillary RBC flux, speed, and hematocrit”: The authors estimate RBC velocity as "v = ø/Δt, where Δt is the time for the RBC to pass through the focal zone, and ø is RBC diameter, assumed to be 6 μm (Unekawa et al., 2010). RBC diameter cannot assume to be 6 µm: in capillaries, RBC orientation and thus "RBC size" varies with capillary diameter, RBC density and velocity. As the shadow size in time, Δt, depends on the "RBC size", and thus velocity, it cannot be used to calculate velocity. All velocity measurements should be removed from the paper.

This also raises a problem in the way EATs are defined, as v.Δt is used to determine the distance to the nearest RBC center. I suggest that the authors reanalyze their data considering time and not distance to extract EATs.

In addition, in response to the Appeal Letter, the editors provided suggestions closely related to the above technical comments.

“The Reviewing Editor and the Senior Editor have carefully read your appeal letter and agreed that you could send a revised version of your manuscript provided that you succeed in responding to all the points raised by the reviewers. Still, the reviewing editor stresses that in view of the strong concerns raised about your estimation of RBC velocity, you should perform a series of experiments that could be easily done and would test the validity of your hypothesis: you should select several groups of capillaries, with large (5-6 m) and small (2-3 m) diameters, with low (0.2-0.5 mm/s) and high (1-1.5 mm/s) velocities (for both small and large capillaries), and measure the instantaneous longitudinal size of RBC shadows using the line scan approach. This would allow you to verify the extent to which the RBC shadow size varies with time, as well as with the capillary type and velocity (and density, if possible) (See the study in rats by Chaigneau et al., 2003). Depending of your findings, i.e. the level of RBC "size" stability, you should be able to conclude whether your estimation of RBC velocity and its use to detect EATs will remain valid. You could also perform paired point-scan based measurements and line scan measurements in capillaries with stable flow and directly compare whether a similar value of mean RBC velocity is obtained. Note that this latter approach would not tell whether fast (instantaneous) changes of RBC shadow are too frequent to allow the use of RBC velocity to detect EATs.”

We agree with reviewer that the point-scan based RBC speed measurement (also referred to as the RBC-passage method) has limitation imposed by assuming the constant RBC diameter and thank the reviewer for suggesting the appropriate experiments to better clarify this issue. Below, we followed the reviewer’s suggestion to validate the point-scan-based RBC speed estimation with additional measurements.

We performed line-scan measurements in two awake C57BL/6 mice (3-5 months old, female, 20-25 g, Charles River Laboratories). The cranial window was prepared following the same protocol as described in the manuscript. We injected dextran-conjugated Sulforhodamine-B (0.1 ml at 5% W/V in saline, Σ R9379) to label the blood plasma. The RBC speed was measured in 58 capillaries by the line-scan technique (2-s-long acquisition in each capillary with the line-scan frequency 2000 Hz). In addition, we extracted the fluorescence intensity time courses from the same parallel line-scan images, and then the RBC flux and speed were calculated with the procedures described in the manuscript. For each capillary, we also estimated the capillary diameter by fitting the transversal intensity profile to a Gaussian. The diameters were calculated as the full width at half maximum of the Gaussian profiles. Data with R2<0.5 were not considered for analysis. The RBC line density and RBC longitudinal size were calculated by following the procedures described in (Chaigneau et al., 2003).

By averaging over all RBCs in each capillary and then across all 58 capillaries, we obtained the mean RBC longitudinal size (6.9 ± 3.0 µm; Mean ± STD). We also quantified the variation of the longitudinal sizes of RBCs passing through the capillary during 2 s. First, we computed for each capillary the standard deviation (STD) and coefficient of variance (CV) of the longitudinal sizes of all the RBCs measured during the 2-s-long acquisition, where CV was calculated as the ratio of STD to mean RBC longitudinal size within the capillary. Then, we averaged obtained STD and CV values across the 58 capillaries (mean STD = 2.3 ± 0.6 µm; mean CV = 0.4 ± 0.1).

Measurements of the RBC longitudinal size vs. capillary diameter, RBC speed, and line-density are presented Figure Author response image 1. The mean RBC longitudinal size in capillaries with smaller diameter (2-3 µm) was just slightly larger than in capillaries with diameters equal 4-6 µm, which may be expected due to more squeezing of the RBCs in the thinner capillaries, although the difference was not statistically significant in our measurements (Author response image 1A). Here, the larger-diameter group included capillaries with diameters equal 4-6 µm instead of suggested 5-6 µm. This was done in order to increase the number of capillaries in the larger-diameter group. We observed a trend of increased mean RBC longitudinal size with the RBC speed (Author response image 1B), where the RBC longitudinal size in the fastest group of capillaries (1-1.5 mm/s) was statistically significantly different than in the other two groups with the lower RBC speed. Finally, capillaries with the lower-line-density had more elongated RBC size than the capillaries with the median- and higher-line-density (Author response image 1C; no statistically significant differences).

Finally, paired measurements of the RBC speed by the line-scan and point-scan method are presented in Author response image 2. Median RBC speeds measured by the line-scan and point-scan method were 0.61 mm/s and 0.69 mm/s, respectively. The difference between the RBC speed values obtained by two methods did not reach statistical significance.

Altogether, the RBC longitudinal size varied both in the same capillary as well as between different capillaries as a function of capillary diameter, RBC line-density, and RBC speed. The differences between the mean RBC longitudinal sizes when measurements were grouped by capillary diameter, RBC line-density, and RBC speed were generally not large, reaching statistical significance only in the case of the high RBC speed group (Author response image 1B), although with the limited sample size of our measurements. However, the fluctuation of the RBC longitudinal size over time in each capillary was moderate (STD = 2.3 ± 0.6 µm). Therefore, we believe that for the purpose of providing mean values and conducting group comparisons, our RBC-passage based RBC speed measurements, while limited by assuming the constant RBC longitudinal length, are still reasonably accurate, as evidenced by the small difference between the mean RBC speed obtained in paired measurements (Author response image 2). However, as Reviewer correctly pointed out, instantaneous RBC speeds obtained by the RBC passage method may have larger measurement error.

Since the major findings related to Figure 3 and Figure 4 are sufficiently supported by the RBC flux measurements alone, in the revised manuscript we present the RBC speed measurements from these figures in the Supplementary data, as we believe that they represent a valuable additional support to our findings and may also be of general interest to the research community interested in cortical capillary blood flow distributions.

Regarding the effect of the RBC speed measurements on the EATs estimation, we would like to clarify that RBC-PO2, InterRBC-PO2 and EATs were calculated without involving RBC speed (e.g., the results in Figure 6B,C and Figure 7C in the original manuscript). Instead, peaks and valleys of the phosphorescence intensity recordings (Figure 1C) were directly used such that RBC-PO2 was calculated with all the phosphorescence decays in the valleys (RBC-passages) in the segmented phosphorescence intensity time course (Figure 1C), InterRBC-PO2 was calculated with the decays in the central 40% of the peaks (plasma), and EATs were calculated as RBC-PO2 – InterRBC-PO2. In the revised manuscript, we better clarified this in subsection “Calculation of capillary PO2 gradients and EATs”, by stating that:

“RBC-PO2 was calculated with all the phosphorescence decays in the valleys (RBC-passages) in the segmented phosphorescence intensity time course (Figure 1C). InterRBC-PO2 was calculated with the decays in the central 40% of the peaks (plasma). EATs were calculated as RBC-PO2 – InterRBC-PO2.”

We agree with the reviewer that, because EATs were estimated based on average RBC-PO2 and InterRBC-PO2 from the passage of multiple RBCs (Lecoq et al., 2011), EATs estimation represents an average EATs value from the file of RBCs passing through the capillary segment during measurement.

Finally, Figure 6A in the original manuscript presented the only EATs-related data that was dependent on the RBC speed measurements. As suggested, we replaced it with the equivalent figure where PO2 was presented as a function of time from the RBC center (instead of distance that relies on instantaneous RBC speed measurement). Two versions of the Figure 6A are presented in Author response image 3 for comparison. The earlier version of Figure 6A is now presented in the Supplementary data, as we believe it presents a valuable complementary view on the PO2 distributions between RBCs. The potential effect of the instantaneous RBC speed measurement error on the presented data was discussed in the Supplementary text that accompanies the figure.

Author response image 3.

Author response image 3.

The following text was added to Discussion section to better clarify the use of RBC speed measurements by the RBC passage method:

“Besides, the RBC speed was calculated by assuming a constant RBC size along the capillary axis, without considering its potential variation due to RBC speed, hematocrit and capillary diameter. In a separate set of measurements (n = 2 awake mice), we performed line-scan measurements (Kleinfeld et al., 1998) in 58 capillaries (2-s-long measurements, 2 kHz line-scan rate) and obtained very close mean RBC speed values by processing the data using two methods: by estimating the angle of the RBC-shadow stripes (mean RBC speed = 0.61 mm/s) and by the RBC-passage technique used in this manuscript (mean RBC speed = 0.69 mm/s). The mean RBC longitudinal size was estimated by following the procedures described in (Chaigneau et al., 2003), and it did not vary significantly as a function of RBC speed, line-density and capillary diameter, except for the fast RBCs (>1 mm/s), which are also associated with the noisier measurements by both techniques. However, the fluctuation of the RBC longitudinal size over time in each capillary was moderate (STD = 2.3 ± 0.6 µm). Therefore, group comparison of the mean RBC speed values measured by the RBC-passage method may be performed with the reasonable accuracy, but instantaneous RBC speeds obtained by this method may have larger measurement errors. These limitations of the technique should be considered for particular experimental designs.”

Subsection “Calculation of capillary RBC flux, speed, and hematocrit”: The authors make the same mistake as Parpaleix et al., (2013) and Lyons et al., (2016) in the way they estimate hematocrit, which is normally a measure of blood volume percentage: "Hematocrit was estimated as the ratio of the combined duration of all valleys associated with the RBC passages to the duration of the entire time course." Because RBC elongation varies with velocity (see first comment), the hematocrit calculated in the paper will depend on velocity. The authors should name differently what is actually measured.

It is difficult to understand how RBC PO2 was determined. Could the authors elaborate on their approach: did they consider the first bin ("micron") or an average several bins to determine RBC PO2? Additionally, the use of the criterion of "the central 40% of the peaks in the binary segmented time course" to extract InterRBC-PO2 could be prone to error. Given that the InterRBC-PO2 is defined at the lowest value of plasma PO2 reached between the passage of RBCs, when the RBC flux is low, the use of the central 40% criterion could yield an accurate value of the this parameter, but is likely to become less accurate with increasing RBC flux, as the period when the plasma PO2 is at its minimum will be shorter, and the inflection will be sharper. The use of this criterion should be validated, comparing the InterRBC-PO2 value it provides with those values that are extracted from more restricted windows at greater distance from the RBCs.

All statistics are based on Student's t-test whereas in almost all comparisons, ANOVA test with multiple comparison analysis should be used.

A similar concern about ‘hematocrit’ calculation was raised in comment #1b by reviewer 3. As suggested by reviewer 3, in the revised manuscript, we replaced the word hematocrit with the RBC line-density, which more accurately reflect our measurements.

EATs were calculated. The selection of the phosphorescence decays for InterRBC-PO2 calculation is illustrated in Author response image 4. To investigate the effect of applied window on the calculated InterRBC-PO2 values, we recalculated the InterRBC-PO2 by using the central 40%, 30%, 20% and 10% of the phosphorescence decays in the peaks of the segmented phosphorescence intensity time course. The EATs were also recalculated by using the InterRBC-PO2 values based on different selection window sizes (e.g., 10%-40%). The results are shown in Author response table 1. As the reviewer speculated, the InterRBC-PO2 exhibits a trend of increasing with the enlargement of the selection window. However, differences between the InterRBC-PO2 (and also between EATs) for selection window sizes between 10% and 40% are very small (within 1 mmHg), which is generally below the measurement error and it doesn’t affect any conclusions involving EATs in the manuscript.

Author response image 4. Illustration of the selection of phosphorescence decays for the calculation of InterRBC-PO2.

Author response image 4.

Author response table 1. InterRBC-PO2 and EATs dependence on the size of the selection window.

The measurements were acquired in 373 capillaries in n = 7 awake mice. Data are expressed as mean ± SEM.

Selection window size InterRBC-PO2 (mmHg) EATs (mmHg)
40% 38.0 ± 3.7 12.0 ± 1.7
30% 37.7 ± 3.7 12.2 ± 1.7
20% 37.4 ± 3.7 12.4 ± 1.8
10% 37.0 ± 3.6 12.7 ± 1.8

Our RBC-PO2 calculation is also slightly different from the protocol used in (Parpaleix et al. 2013). In (Parpaleix et al. 2013), the RBC-PO2 was calculated using the phosphorescence decays at the border of the RBCs within 4-ms-wide window, while in this work we used all the phosphorescence decays in the valleys of the segmented phosphorescence intensity time course. We recalculated all RBC-PO2 values by following the procedure outlined by (Parpaleix et al., 2013). This resulted in the average RBC-PO2 equal to 52.3 ± 4.0 mmHg, which is almost the same as the average RBC-PO2 reported in our manuscript (54.0 ± 4.0 mmHg).

In the revised manuscript we applied ANOVA test to all data where appropriate. For details, please see our response to comment #1.

Subsection “Calculation of capillary PO2 gradients and EATs” and subsection “Accumulated oxygen extraction fraction increases in deeper cortical layers”: The authors estimate layer-specific oxygen extraction fraction by comparing the PO2 in arterioles and venules at a given depth. This approach tacitly assumes that a layer-specific network of microvessels connects arterioles and venules in this layer, and that all RBCs which leave arterioles in the given FOV and layer flow into venules in that same field of view and layer. The authors should cite which theoretical and experimental papers support the hypothesis. In addition, as they have the tools to reconstruct easily the vascular angiograms, they should trace a series of pathways from the pre-capillary arteriole to the post-capillary venule in order to verify the hypothesis, which is key for the paper. They could potentially limit their investigation to layer I and IV pathways, which are likely to differ.

We agree that this is an important question. In some of our previous publications we have done the reconstruction of vascular angiograms (i.e. segmentation and graphing), but this procedure and the analysis needed to validate this hypothesis are not easy, and it may take long time to complete. However, in a recent theoretical paper by Schmid et al., (Schmid et al., 2017), it was shown based on large mouse brain microvascular angiograms acquired by David Kleinfeld’s group at UCSD that RBCs are predominantly moving in-plane and that “no significant movement in the direction of the cortical depth takes place.” In the same work, Schmid et al., found layer-specific differences in the flow and pressure distributions in the cortical vasculature. To better clarify this important point, we added the following text into Discussion section:

“We estimated the depth-dependent OEF, which implies existence of a laminar flow pattern in the brain cortical microvascular network. This was recently confirmed by Schmid et al. (Schmid et al., 2017), who applied numerical modeling of blood flow and tracking of the trajectories of individual RBCs in realistic mouse cortical vasculature, which led to conclusion that RBCs predominantly flow in plane and no significant RBC flow in the direction of cortical depth takes place.”

Is the mouse's head rotated around the rostro-caudal axis during the 2PLM sessions? If not (and unless the objective lens can be inclined, thought this doesn't appear to be the case in Supplementary Figure 1(b)), due to the inclination of the cortical surface at the coordinates of the barrel field it is probable that there is a discrepancy between the reported measurement depths and the true depth of measurement in the cortex. As illustration, the approximately 40-45 degree inclination of the cortex relative to the horizontal at the level of the S1 barrel field (as per Paxinos and Watson), would mean that the maximum reported imaging depth of 600 micros would in fact correspond to a true cortical depth of approximately 460 microns. Thus, the assignation of the measurements to different layers will be compromised. Conversely, if the mouse head is rotated, could the authors note this and comment on the likely effect on the comfort and behavioural state of the mouse during the imaging sessions.

In our experiments, the mouse head was rotated to make the cortical surface perpendicular to the optical axis. The center of the cranial window in our preparation is 2 mm posterior from Bregma and 3 mm lateral from the midline. We estimated that the rotation angle was ~35°. However, mice were habituated during training to such rotation and they exhibit normal and relaxed behavior during experiments. Therefore, we do not expect that head rotation had adverse effect on the results of our experiments. In the revised manuscript, we clarified this point in subsection “Animal preparation”, which now reads:

“The training was conducted while mice were resting on a suspended soft fabric bed in a home-built platform, under the microscope. Mice were gradually habituated to longer periods (from 10 minutes to 2 hours) of head-restraint with the head slightly rotated (~35°) to make the cortical surface perpendicular to the optical axis. All mice were rewarded with sweetened milk every 15 minutes during both training and experiments. While head-restrained, the mice were free to readjust their body position and from time to time displayed natural grooming behavior.”

Biological:

3D projections of PO2 maps (Figure 1G) are made with acquisitions lasting only 0.6 seconds (2000 decays). This is really short as PO2 varies with time. It is clearly shown in Figure 5. PO2 may change by more than a factor 2 within 9 s. Therefore, PO2 maps using such brief acquisitions will change dramatically from one acquisition to the other. What is the scientific value of such 3D map? In addition, it artificially increases the number of vessels imaged.

If this approach was also used to build Figure 2, it strongly decreases its significance.

In the absence of proper statistics, Figure 3, Figure 4, Figure 5, Figure 6 and Figure 7 cannot be interpreted.

In their 2014 paper, the authors reported that PO2 decreases with the capillary order. Could the author verify if their findings hold true in the awake mouse? This would require a simple analysis regrouping A1, A2 and A3 capillaries.

Given the concerns raised above about the definition of RBC-PO2 in capillaries and the method for estimation of OEF by comparing arterioles and venules (and indeed A1-A3 and V1-V3 capillaires) in the same layer, it follows that the estimation of the relative contribution of different vascular compartments and the related conclusions (Subsection “Low oxygen extraction along the superficial capillary paths contributes to an increase in the mean venular SO2 towards cortical surface”) are questionable.

We do not anticipate that temporal fluctuations of PO2 and blood flow confound mean values of our measurements based on relatively short measurement intervals but in a large number of capillaries at rest. It is also not entirely clear why longer acquisitions are needed and how they may help. Longer acquisition intervals in each capillary would also force us to reduce number of sampled capillaries, which is a typical trade-off in in vivo measurements. Since the blood flow (and PO2) differ significantly between different capillary branching orders (likely more than the amplitude of temporal fluctuations in individual capillary segments), reducing the number of sampled capillaries while increasing the acquisition time per capillary may lead to less accurate estimates of the mean values from the capillary populations.

Figure 1G does not represent a 3D PO2-distribution ‘snapshot’ and we expanded the Figure 1 caption to better clarify this point. However, we believe it is still very valuable to present this PO2 distribution in the complex 3D microvascular network. With all the imperfections due to temporal fluctuations correctly pointed by the reviewer, the PO2 distribution in Figure 1G from arterioles to capillaries to venules is still very reasonable and we believe that it will be very useful to the readers to grasp the concept of cortical microvascular oxygenation. Please note that interpolated PO2 values were only used in Figure 1G.

In the revised manuscript we applied proper statistical analysis. Please see our response to comment #1.

In this study, capillary branching orders were manually identified in a limited number of segments per branching order, which prompted us to group the A1-A3 or V1-V3 capillaries together for analysis. Expanding the data set to respond to reviewer’s suggestion may require significant additional effort, but we believe that this is out of the scope of this manuscript.

Finally, we believe that by responding to the reviewer’s previous comments we alleviated concerns raised at the end of comment #6. For the details about RBC-PO2 calculation and validation, please see the response to comment #3. For the concerns about existence of the laminar blood flow in the cortex, please see the response to comment #4.

Reviewer #2:

The article presents novel data on hemodynamic states in the different layers of the whisker barrel cortex of awake mice. in vivo data are acquired using a novel oxygen probing technique with two-photon phosphorescence lifetime microscopy. Specifically, steady averaged oxygen pressures and red blood cell (RBC) flux counts were acquired. In addition, temporal variations within a 9s observation window were collected. A detailed statistical analysis of the layer dependence of oxygenation and RBC fluxes is presented. The main conclusions include the experimental observation of depth dependence of oxygen extraction, and a reduction in the RBC flux variability with increasing cortical depth. This study presents an invaluable experimental body of work that will help to elucidate oxygen extraction mechanisms in the mouse cortex and create in vivo data for mechanistic models to explain the physiochemical principles that drive and control cerebral blood flow and metabolism. This is a significant piece of work which I highly recommend for publication after modifications listed below:

Technical comments:

Introduction. The EAT is used to characterize the heterogeneity of the oxygen extraction within capillaries. What is the physical rationale for correlating oxygen point measurements to intracapillary resistance to oxygen delivery? Are these measurements for erythrocyte bound versus unbound oxygen in plasma? How is this EAT related to oxygen saturation?

Our EATs measurements were conducted with the goals to: (i) enable SO2 estimation in the capillaries, for which we needed RBC-PO2 measurements, (ii) explore the capabilities of the novel oxygen probe to provide faster and/or more accurate EATs measurements, and (iii) explore EATs dependence on the capillary branch order, RBC line density, cortical layer, etc. The particulate or discrete nature of RBC flow in capillaries causes EATs. Modelling studies (Hellums, 1977; Golub and Pittman, 2005; Barker et al.,. 2007) showed that larger difference between RBC-PO2 and InterRBC-PO2 (i.e., larger EATs) is associated with an increase in the intracapillary resistance to oxygen transport to tissue from capillaries. Due to non-zero EATs, mean capillary PO2 cannot be used in the Hill equation to compute capillary SO2. Instead, RBC-PO2 measured in the plasma in close proximity of the RBCs was used for that purpose, as an approximation of the mean PO2 inside the RBC.

It appears that measurements of RBC fluxes (RBC counts) assume that signals are generated from individual RBCs that are sharply separated. Figure 1C shows signals with different durations (and intensity). Is it possible that two aligned RBCs (two or more RBCs in file) may cause a longer signal that is indistinguishable from a single slow RBC? How would this affect the analysis of RBC fluxes?

The RBC-touching phenomenon may cause underestimation of RBC flux. In a subset of capillaries, we identified ~6% of valleys that appear to be ‘touching’ RBCs, indicated by relatively larger width and small spikes in the middle of the valley (please see an example valley denoted by an arrow in Author response image 5).

Author response image 5. A representative 0.4-s-long recording of the RBC passages.

Author response image 5.

The blue curve is the experimental time course, and the red curve is the fitted time course. The black arrow points to a small intensity ‘spike’, suggesting that 2 contiguous RBCs passed through the focal volume.

In the Introduction, the authors cite the next generation of biophysical models, which with the exception of Gagnon's 2016 paper do not correspond to the anatomical detail presented in this study. Layer specific oxygen consumption has been predicted by recent biophysical models that match the detailed anatomical scope and three-dimensional resolution of the proposed experimental study. For example, three dimensional predictions of depth dependent oxygen gradients in mouse are given in Gould et al., 2017. Biophysical models to predict depth dependent oxygen gradients in humans are presented in Linninger et al., 2013 and Gould and Linninger, 2015. These studies have been successful in solving oxygen delivery to brain tissue coupled with biphasic blood flow in a realistic cortical microanatomy and are therefore perfectly aligned with the scope of the current study. These advancements should therefore be incorporated and discussed.

We thank the reviewer for the suggestion. In the revised manuscript, we referred to the above manuscripts in Introduction and Discussion section.

Subsection “Accumulated oxygen extraction fraction increases in deeper cortical layers”. The data in Figure 2 seem to refer to steady magnitudes or levels, the use of the word "amplitudes" seems ambiguous.

We thank the reviewer for the suggestion. In the revised manuscript, we replaced the word ‘amplitudes’ in in subsection “Accumulated oxygen extraction fraction increases in deeper cortical layers” in original manuscript with the word ‘levels’.

Subsection “Capillary RBC flux and oxygenation homogenize in deeper cortical layers”. The prediction that homogenization of RBC flow velocity enhances the oxygen extraction is made based on a single segment analysis in the cited biophysical model. Here, experiments are presented for a three-dimensional vascular network. I am uncertain whether the two scopes are really "in line" with each other as suggested in the current text.

In the revised manuscript, we changed the text, which now reads:

“This result suggests that RBC flux in the deeper cortical layers is more homogeneous, which may facilitate oxygen extraction as theoretically predicted (Hartung et al., 2018; Jespersen and Østergaard, 2012; Schmid et al., 2017).”

Figure 5. The trend line in Figure 5 does not intersect at zero. What does the non-zero intercept of roughly 16-18mmHg pO2 mean? Should the trend have a zero intercept?

Non-zero intercept likely means that PO2 is not zero when RBC flux is zero, which is not physiologically impossible, as plasma may still be flowing even when the RBCs are not. In addition, capillary may be close to one or several more oxygenated vessels (arterioles or capillaries), creating the oxygen influx from the tissue into the capillary. In fact, in Figure 7—figure supplement 4, we reported a capillary having stalled RBC flow, and the PO2 was measured to be 15 mmHg, close to the intercept PO2 value.

Subsection “Capillary RBC flux and oxygenation homogenize in deeper cortical layers”. The number of segments in layer IV and V have only half the segments than layer I-III. Could this affect the statistics? If not, this observation should be listed in the limitations.

At larger cortical depths, expanding shadows below large pial vessels, partial obstruction of the optical paths by the edge of the cranial window, and gradual loss of resolution, contributed to lower number of reported measurements in the capillary segments. However, more than 100 capillary segments contributed to data analysis even from the deepest layer that we investigated and reported statistically significant differences between different cortical layers were obtained by applying proper statistical analysis. It is still possible that due to smaller number of measured capillaries in the deeper cortical layers, some investigated variables did not show statistically significant difference between cortical layers. We commented on this limitation in the Discussion section, which now reads:

“Another limitation is that at greater cortical depths, expanding shadows below large pial vessels, partial obstruction of the optical paths by the edge of the cranial window, and gradual loss of resolution, contributed to the smaller sampling size. It is possible that due to the smaller number of measured capillaries in the deeper cortical layers (e.g., 104 capillaries in layer V vs. 400 capillaries in layer I; Figure 3), some investigated variables did not show statistically significant difference between cortical layers.”

The assignment of upstream capillaries A1-A3 and downstream capillaries V1-V3 was done manually. Is it hard to imagine that roughly hundred segments (=according to subsection “Low oxygen extraction along the superficial capillary paths contributes to an increase in the mean venular SO2 towards cortical surface”, the analysis included 97 segments for all mice specimen) were identified by hand without the aid of image filters (e.g. Blinder et al., 2013; Hsu et al., 2017) in combination with automatic segmentation.

The identification of the branching orders in 97 capillaries in this manuscript was indeed performed manually by visual inspection.

In subsection “Low oxygen extraction along the superficial capillary paths contributes to an increase in the mean venular SO2 towards cortical surface” it is argued that the manual method provides statistical power. It is not clear what statistical power is referred to? I suspect that the results could come out quite differently, if labels were assigned differently. Is there any data on operator dependence of the labeling method? I recommend to consider writing the Discussion section more cautiously to reflect that results are based on an operator dependent method with high uncertainty in segmentation, and that major results would not be affected by uncertainty associated with operator dependence in upstream and downstream labeling. This point is optional to the discretion of the authors.

We apologize for the confusion. We wanted to say that grouping data from 3 consecutive branching orders (e.g., A1-A3 and V1-V3), instead of individual ones, helped with reducing the data variance in the presence of limited sample sizes for individual branching orders. In the revised manuscript, we rephrased the sentences in subsection “Low oxygen extraction along the superficial capillary paths contributes to an increase in the 251 mean venular SO2 towards cortical surface” in the original manuscript, which reads now:

“Due to a limited number of capillary segments with assigned branch order, A1-A3 and V1-V3 capillaries were grouped together to enable group comparisons with stronger statistical power.”

We verified the results in Figure 7 by randomly choosing 2 branching orders from A1-A3 and 2 branching orders from V1-V3, e.g. A1,2 vs. V1,2, A1,3 vs. V1,2, A1,3 vs. V2,3, etc. The final values were slightly different, but the main conclusions were the same. We discussed how the manual selection was done and the operator dependence. However, in light of current uncertainty how to define precapillary arterioles and where true capillaries start, automatic selection may not be more helpful. In the revised manuscript, we updated the relevant text in the Discussion section, which now reads:

“The capillaries were identified based on their morphology, without taking into account the smooth muscle cell coverage and pericyte types (Attwell et al., 2016; Hall et al., 2014; Hartmann et al., 2015; Hill et al., 2015; Mishra et al., 2014; Peppiatt et al., 2006; Secomb, 2017), and the assignment of capillary branching order indices was performed manually, which may be operator dependent. In principle, misclassifying vessel types and/or branching orders could potentially influence our analysis. However, based on the overwhelmingly larger number of capillaries compared to the non-penetrating arterioles and venules, our conclusions in general are unlikely to be different.”

Subsection “Low oxygen extraction along the superficial capillary paths contributes to an increase in the mean venular SO2 towards cortical surface”. The hematocrit changes were reported between upstream (A1-A3) and downstream capillaries (V1-V3). Why did the study not explore layer dependence or branch hierarchy dependence (Strahler order analysis) of hematocrit?

We did not observe statistically significant difference between RBC line-density values in the upstream (A1-A3) and downstream (V1-V3) capillaries, and between different cortical layers. Limited size of the sample with the labeled branch order prevented us from exploring the hematocrit dependence on the capillary branch hierarchy. In the revised manuscript, in subsection “Capillary RBC flux and PO2 are more homogenous in the deeper cortical layers”, we stated that:

“We did not find statistically significant difference in the values of the absolute RBC line-density, and its STD and CV between different cortical layers.”

Discussion section. The RBC flux is equal to the product of bulk flow rate and hematocrit (volume fraction). How should we understand the variance reduction in RBC flux without any relation to variations in hematocrit, since the quantities are directly related?

It is possible that changes in the RBC flux are balanced by similar changes in the RBC speed, as these two variables are highly positively correlated (for example, see Figure 7—figure supplement 3C and Figure 7—figure supplement 4C). In this case, relative hematocrit changes may be significantly smaller than the relative RBC flux and speed changes. We agree that it is plausible that some hematocrit changes may accompany the RBC flux changes, but were not resolved in our measurements.

Discussion section. The wide variability of hemodynamic states (high heterogeneity of capillary flow and oxygenation) was predicted previously in a biophysical model by Gould et al.,.2017. It would be helpful if the experimental results could be aligned with already completed theoretical work that aims at addressing the same points as those that are here so elegantly presented experimentally.

We thank the reviewer for the suggestion. In the revised manuscript, we expanded the Discussion section to better address findings in this and other suggested studies. For details, please see the response to comment #3.

In the same vein, it is worth mentioning that a main finding of the reduced variance of RBC fluxes was just recently predicted covering the whisker barrel mouse cortex with extension to the entire MCA territory (Hartung et al., 2018). The experiments confirm several findings so that the predictive model results are highly relevant for this study and should be discussed.

Yes, we agree, and we are thankful to the reviewer for pointing us to this reference. The new text was added in the Discussion section, which states:

“Layer-dependent homogenization of blood flow has been predicted by modelling the blood flow distribution in large-scale mouse brain microvasculature covering the whisker barrel cortex (Hartung et al., 2018).”

Reviewer #3:

The work addresses highly relevant questions (depth-dependent difference, homogeneity/heterogeneity of microvascular flow and oxygenation). The amount of measurements performed is significant and the capabilities of the new oxygen probe PtTAPIP to measure a variety of blood flow characteristics in large cortical depths is nicely demonstrated. However, we have major concerns regarding some of the analysis performed and some of the conclusions drawn (listed below). Furthermore, there is a significant shortcoming in referencing earlier work. It remains unclear, where the current work goes beyond what was published before.

Essential revisions:

1) Calculation of capillary RBC flux, speed and hematocrit (subsection “Calculation of capillary RBC flux, speed, and hematocrit”):

As the authors are well aware, the methods presented to compute RBC flux, RBC speed and hematocrit are only valid in vessels where single file flow persists. The authors write that those measurements were performed in "capillaries". However, it remains unclear how capillaries were identified as capillaries. Were diameter measurements performed? As the RBC diameter of the mouse is 6 µm, single file flow can only be expected for vessel diameters < 6 µm. This aspect is key for the validity of the results.

We propose that the authors come up with a table describing the measured vessels (type, depth, number) for clarity.

The capillary size permitting single-file flow may not be limited to <6 µm, due to the glycocalyx thickness and, possibly, an additional plasma layer between RBCs and glycocalyx ((Kim et al., 2009; Fedosov et al., 2010), SfN 2018 poster presentation 318.14/VV10). Variability of reported capillary diameters is relatively high, while some measurements estimate even the mean cortical capillary diameter of a mouse above 7 µm (Cai et al., 2018). Such variability in measurements, to some extent, may be attributed to a problem of defining a capillary (Hall et al., 2014; Mishra et al., 2014; Hartmann et al., 2015; Hill et al., 2015; Attwell et al., 2016; Secomb, 2017). Selection of capillaries based on identification of smooth muscle cells and pericytes (and their subtypes) was not performed in our study due to significant complexity that such procedure will add, especially considering a large sample size used in our analysis. Importantly, it may not provide more accurate results, as the debate on what is a proper classification of vessel-types is still ongoing. Instead, we relied on vascular morphology as a guide. Capillaries were typically identified starting one or two segments away from the diving arterioles and surfacing venules based on their morphology (i.e. smaller diameters and higher tortuosity). Importantly, the deep modulation of the phosphorescence intensity time courses indicate that RBCs are flowing in a single-file in capillaries we selected for measurement of PO2 and RBC flux (e.g., Figure 1C). The segmentation of the phosphorescence intensity time courses was evaluated by the coefficient of determination (R2) between the experimental and fitted time course, and the data with R2<0.5 was rejected according to the previously established protocol (Lee et al. 2013). We updated the Methods section to better describe selection of capillaries and processing of the phosphorescence intensity time courses.

In the legend of each figure, we provided the information about animal number, sample size, and imaging depth. By following the reviewer’s suggestion, we also include a Supplementary Table with the detailed information in one place about sample sizes, vessel types, imaging depths, and animal numbers (Author response table 2).

Author response table 2. Measurement information for the main analysis in Figures 2-7.

Parameters Depth Numbers of samples/mice
Capillaries Arterioles Venules
Mean-PO2 0-600 µm 978/15 11/7 14/7
RBC Flux 0-600 µm 978/15 N.A. N.A.
Temporal Fluctuation 0-600 µm 373/7 N.A. N.A.
EATs 0-600 µm 373/7 N.A. N.A.
Branching Orders 0-300 µm 97/5 N.A. N.A.

1a) Additional Concern regarding velocity calculations (subsection “Calculation of capillary RBC flux, speed, and hematocrit”):

Characteristics Mouse RBC: Diameter 6 µm, Volume: 45.5 µm3 (Windberger et al., 2013), Thickness: 1.6 µm.

Assuming that each RBC is 6 µm is not correct. Especially, in larger vessels the RBC orientation makes a significant difference in the proposed velocity calculation (by a factor of ~4).

For vessel diameters <5.5 µm the applied velocity calculation is more suitable, because here RBCs need to squeeze into the vessel. However, also here we need to account for changes in RBC length depending on the vessel diameter.

In summary, the presented approach gives at best a rough estimate of the RBC velocity and it remains unclear, why the authors have not chosen line scans that would be so much more appropriate.

This is a very good point raised by the reviewer. We addressed this concern in response to comment #2 by reviewer 1.

1b) Additional Concern regarding hematocrit calculations (subsection “Calculation of capillary RBC flux, speed, and hematocrit”):

The hematocrit computation is based on the assumption that plasma and RBCs have the same velocity. However, RBCs travel on average faster than plasma (Fahraeus effect). This velocity difference can cause an underestimation of hematocrit. Even so this approach is used frequently this assumption should be described and the term "line-density" should be used instead of "hematocrit".

We agree and thank the reviewer for the suggestion. In the revised manuscript, we replaced word ‘hematocrit’ with ‘RBC line-density’.

1c) Additional Concern regarding flux and velocity calculation (subsection “Calculation of capillary RBC flux, speed, and hematocrit”):

For the flux and velocity computation it is crucial that individual RBCs can be distinguished from another. Can this be guaranteed for all hematocrit levels? Some discussion/comments should be added.

A similar comment was raised by reviewer 2 (comment #2). For details, please see our response to that comment.

1d) Selection of vessels for analysis (Subsection “Capillary RBC flux and oxygenation homogenize in deeper cortical layers”, subsection “Imaging of EATs and capillary RBC flow”):

The selection criterion for the vessels that have been chosen to analyse flow properties are not described. Moreover, it remains unclear why the number of vessels investigated per layer differs so significantly (400, 356, 118, 104).

The flow properties (e.g., RBC flux, speed and line-density) were measured only in capillaries. Please see our response to comment #1 for details about capillary identification.

At larger cortical depths, expanding shadows below large pial vessels, partial obstruction of the optical paths by the edge of the cranial window, and gradual loss of resolution, contributed to lower number of reported measurements in the capillary segments. Please see our response to related comment #7 by reviewer 2.

2) Quantification of the temporal fluctuations of capillary Mean-PO2, RBC flux, speed and hematocrit (subsection “Quantification of the temporal fluctuations of capillary Mean-PO2, RBC flux, speed, and hematocrit”, Discussion section):

On the one hand, the chosen measurement time is rather short for a good averaging of the readouts. On the other hand, an averaging interval of 0.6 s is too large to resolve fluctuations in the capillary bed. An RBC with an average velocity of 1mm/s would travel 600 µm during that time. So, for the overall statistics, longer periods should be measured, but for describing the fluctuations over time, those segments should be split up into smaller than 0.6 s intervals, so that the fluctuations are dampened too much due to the averaging.

The arguments given in the discussion for the chosen interval seem to be motivated by dynamics on a larger scale but not by microvascular fluctuations. Why is the rate of oxygen consumption relevant for the capturing microvascular flow dynamics?

Alternatively, it has to be described more clearly that only fluctuations on the time scale of seconds are analysed and that faster fluctuations persist but are not of interest in the current study.

It is correct that both faster and slower fluctuations are present in the microvascular network. For example, resting state connectivity studies typically probe frequencies below 0.1 Hz, and respiration and heartbeat introduce frequency components that were smoothed out by our measurements. The temporal resolution and recording interval of our measurements are therefore limited to capturing fluctuations at a rate of oxygen consumption, as described in the original submission, and it is also sufficient for resolving the blood flow transient responses to short neuronal activation (typically within a few seconds for a short stimulus). In the revised manuscript, we expanded the Discussion section to better explain the scope of measurements of temporal fluctuations:

“The temporal resolution of our measurements (0.6 s) ensured that the blood flow and PO2 fluctuations due to cardiac and respiratory cycles, as they occurred in awake mice, were averaged out, but it is sufficient to capture the dynamics related to the rate of oxygen consumption, which could be estimated as the time for tissue PO2 to drop to zero after blood flow stoppage. As reported in cats, that time was at least several seconds (Acker and Lübbers, 1977; Whalen and Nair, 1975). In addition, blood flow responses to neuronal activation could typically be resolved with such temporal resolution (Uhlirova et al., 2016). However, it is important to note that our experiments probed just one frequency window within a wide range of both faster and slower fluctuations present in the microvascular network.”

3) Analysis of EATs:

Intracapillary resistance of oxygen transport to tissue decreases in deeper cortical layers (subsection “Intracapillary resistance of oxygen transport to tissue decreases in deeper cortical layers”) and Low oxygen extraction along the superficial capillary paths contributes to an increase in the mean venular SO2 towards cortical surface (subsection “Low oxygen extraction along the superficial capillary paths contributes to an increase in the mean venular SO2 towards cortical surface”):

In order to understand the observed EAT trends, it is crucial to also analyse RBC-PO2 and interRBC-PO2. This aspect has been neglected for most EAT results. As such, possible reasons for the observed EAT drop in Figure 6C and the EAT increase in V1-V3 segments have not been analysed sufficiently (Based on "Supplementary Figure 3a" RBC-PO2 does not drop? Thus interRBC-PO2 should rise for deeper layers to explain the EAT drop? How can a rise in RBC-PO2 and interRBC-PO2 for deeper cortical layers be explained? A higher interRBC-PO2 would however suggest a "higher intercapillary resistance to oxygen transport" instead of a lower one.)

Moreover, the EAT strongly depends on the distance of the capillary to the arteriole/venule (see Figure 7C). This impact should be discussed, e.g. how do you make sure that your depth-dependent EAT average is not affected by a larger number capillaries close to arterioles?

In an earlier work by the same authors, they did not observe EATs. The authors should discuss in detail where this discrepancy originates from.

The increase in interRBC-PO2 may not necessarily mean higher intravascular resistance (IVR) to oxygen transport to tissue. For example, increase in RBC line-density reduces IVR (Federspiel and Popel, 1986), but it is associated with an increased interRBC-PO2 (Lyons et al., 2016). The EATs may be affected by multiple parameters, such as RBC spacing, shape, and wall-to-RBC spatial clearance (Popel, 1989; Golub and Pittman, 2005; Lücker et al., 2017). In addition, our measurements provide average values from multiple RBC passages, not accounting for fluctuations of parameters influencing EATs, which may differ between cortical layers and/or proximal and distal capillaries and differentially affect the EATs measurements. The EATs did show a trend of dependency on the branching order (Figure 7C in the original manuscript), but the difference between EATs (as well as the RBC line-density) in proximal and distal capillaries did not reach statistical significance in our measurements. Altogether, this leaves a number of possibilities to address in order to understand the detailed mechanisms behind EATs changes across cortical layers and capillary branches. We believe that such work goes beyond the scope of this manuscript, but we are very interested to pursue it in the future studies. We added the following sentences at the end of the paragraph about EATs findings in the Discussion section to better address these points:

“However, it is important to note that mechanisms that govern the EATs values are multifactorial. The EATs may be affected by multiple parameters, such as RBC spacing, shape, and wall-to-RBC spatial clearance (Popel, 1989; Golub and Pittman, 2005; Lücker et al., 2017). In addition, our EATs measurements provide average values based on multiple RBC passages. Therefore, they do not account for fluctuations of parameters that are affecting EATs, which may differ between cortical layers and/or proximal and distal capillaries, and differentially affect the EATs measurements.”

Regarding the previous measurements of EATs by us and other groups, please see our response to comment #1 By reviewer 1.

4) Depth-dependent oxygen extraction (subsection “Accumulated oxygen extraction fraction increases in deeper cortical layers”, Discussion section):

We generally agree with the idea to use the difference in oxygen saturation as an indicator of oxygen extraction. However, as also shown in this work here, many factors have an impact on the oxygen saturation. Thus, saturation difference is not always equal to oxygen extraction. For example, higher blood flow in layer I leads to a higher oxygen availability in layer I and thus to higher SO2 values in the venules, even if the oxygen extraction is constant over depth.

"Benefitting from the improved sensitivity of the new oxygen probe, we were able to measure intracapillary longitudinal PO2 gradients in a larger number of capillaries…" why does the application of the improved probe help to increase the number of vessels measured?

In this study, we did not directly measure total blood flow in different cortical layers. Without knowing the blood flow, as reviewer suggested, it is difficult to tell how much oxygen was extracted. It is also worth pointing that hypothetical case that reviewer created to illustrate his point, namely that blood flow is higher in layer I than, presumably, in layer IV, is probably opposite in the mouse whisker barrel cortex. While our experimental results do indicate that capillary RBC flux is somewhat (~13%) smaller in layer IV than in layer I (Figure 3A), measurements by us and others reported significantly higher capillary density in layer IV than in layer I (~83% higher based on Suppl. Figure 7b in Sakadzic et al., 2014; >50% higher based on Figure 2C, Gould et al., 2017). Combined, these measurements suggest that macroscopic blood flow in layer IV is higher than in layer I, which may be expected as other indicators imply higher oxygen metabolic rate in layer IV. Then, higher blood flow and OEF in layer IV than in superficial cortical layers suggest that oxygen extraction may be much larger in layer IV than closer to the cortical surface. We updated the text in the Discussion section to better clarify these points, which now reads:

“A faster decrease in SO2 with cortical depth in the ascending venules than in the penetrating arterioles resulted in a higher depth-dependent OEF in the deeper cortical layers, reaching the maximum in layer IV (Figure 2B). In addition, the total blood flow may be higher in layer IV than in layer I, as suggested by the measurements of capillary RBC flux (~13% lower in layer IV than in layer I; Figure 3A) and capillary density (>50% higher in layer IV than in layer I; (Sakadzic et al., 2014; Gould et al., 2017)). Altogether, this implies that oxygen extraction was higher in deeper cortical layers, which would be in agreement with the finding that layer IV has the highest neuronal and capillary density in mouse cortex (Blinder et al., 2013; Lefort et al., 2009; Patel, 1983; Wu et al., 2016), and that the cells in layer IV exhibit the highest cytochrome oxidase labeling activity, suggestive of the highest oxidative metabolism (Land and Simons, 1985).”

Comparing to the old version of the probe, Oxyphor2P (Esipova et al., 2019) has more red-shifted 2-photon excitation and emission, higher quantum yield, larger 2-photon absorption cross-section (overall, it is ~100X brighter probe), and more single-exponential decay. These improved properties enabled deeper imaging, reduced rejection of data with poor SNR, faster selection of capillaries due to improved contrast of survey scan images, and shorter acquisition times (we collected 30,000 phosphorescence decays per capillary to extract EATs, comparing to the 40,000-60,000 phosphorescence decays per capillary using PtP-C343).

[Editors’ note: the author responses to the re-review follow.]

The reviewers have discussed the reviews with one another and the Reviewing editor has drafted this decision to help you prepare a revised submission. All reviewers believe that the work is interesting. They however raised a number of questions that I ask you to address and which would clarify the manuscript. No new data is required. I have summarized the key questions:

1) The demonstration that RBC size can be estimated from the 2PLM measurements is still not convincing. The way you analyzed your new data is not informative: Comparing the mean RBC values from 58 capillaries measured with Line-Scan and Point-Scan (Author response image 1) does not solve the problem, in particular as the variability is large. Please show the plot in Author response image 2A, with lines joining each values, capillary per capillary. It is important as Author response image 1B and C already seem to demonstrate that RBC longitudinal size varies a lot. The 3 reviewers believe that if your new analysis reveals that RBC size cannot be accurately estimated, all RBC velocity data should be removed from the paper and the resulting uncertainty of RBC PO2 measurements be carefully addressed in the discussion.

In our previous response, we presented Author response image 2 (Comparison between the RBC speed measurements by the line-scan and point-scan methods), where the mean values were reasonably close, but the instantaneous speeds differed sometimes significantly, and the interquartile ranges were large. Therefore, our conclusion was that for the purpose of conducting group comparisons with the mean values, our RBC-passage based RBC speed measurements are still reasonably accurate. However, in agreement with reviewers, we concluded that instantaneous RBC speeds obtained by the RBC-passage method may have larger measurement error. While this conclusion about the instantaneous RBC speed measurements was reasonable and based on the differences between the simultaneously measured RBC speeds by the two methods, we agree that only the box-plot presentation of the data may not be the most appropriate in this case since large interquartile ranges may possibly result from perfectly pairwise-matched measurements, which was not the case here. As suggested by reviewers, we now provide both pairwise connections between RBC speed data points obtained by the two methods and the corresponding box plots (Author response image 6). We hope that this figure can help with clarifying the issue. Some additional results are also provided in the response to the comment #2 raised by the reviewer #1.

Author response image 6. Comparison between the RBC speed measurements by the line-scan and point-scan method.

Author response image 6.

The individual RBC speed values estimated by two methods from each capillary (green circles) are connected by green lines. Boxplots of the line-scan and point-scan RBC-speed values indicate the median values, 1st and 3rd quartiles, and maximum and minimum values. No statistically significant difference was found between the mean values (Student’s t-test). The regression slope between the paired RBC-speed measurements is 0.87 (not shown). The measurements were performed in 58 capillaries across two mice within the cortical depth range of 0-200 μm.

Based on the above results, we still think that for the purpose of providing mean values and conducting group comparisons, our point-scan RBC-speed measurements are reasonably accurate. We agree with reviewers, as we did in the previous response, that instantaneous RBC speed measurements may have larger measurement errors. Pairwise comparisons (Author response image 6) demonstrate this variability, which seems to be larger for larger RBC speeds (please note that line-scan method also has reduced accuracy at larger RBC speeds). Our RBC speed results may be of general interest to the research community interested in cortical capillary blood flow distributions and we would like to keep them in the Supplementary data. In the revised manuscript, the original Figure 7E that presents the mean RBC speed values in the upstream and downstream capillary branches was moved into the figure supplement. The limitation of the RBC speed estimation was previously explained in the Discussion section and, to further clarify it, we added the following sentence in the Results section:

“Here, please note that the RBC speed calculation was model-based by assuming a constant RBC size (6 µm) (Unekawa et al., 2010).”

Regarding the ‘resulting uncertainty of the RBC-PO2 measurements,’ we would like to clarify that, in this study, RBC-PO2 was calculated using the phosphorescence decays corresponding to the valleys (RBC-passages) in the phosphorescence intensity time course. The measured temporal width of the valleys is dictated by the instantaneous size of the RBC passing through the optical focus. The temporal width was estimated by directly fitting for a simple binary pattern, and it doesn’t involve assumption of the constant RBC size used in calculation of the RBC speed.The only EAT-related PO2 result that involved RBC-speed estimation is the distance-resolved PO2 gradients (Figure 6—figure supplement 1). Please note that the PO2 gradients and assumption about constant RBC size were not used to calculate any other PO2-related properties (e.g., Mean-PO2, RBC-PO2, InterRBC-PO2 and EAT).

Some uncertainty of the RBC-PO2 estimation may come from the fact that within each valley in the phosphorescence intensity time course, plasma PO2 likely continuously decreases as a function of distance from the RBC center (valley center). Due to spatial dimensions of the RBC and the excitation beam, when the excitation beam overlaps with the RBC center, measured PO2 likely best represents the PO2 in the space between the RBC and the capillary wall. As the RBC center moves away from the beam focus, the excited volume fraction of plasma region that is more distant from the RBC surface continually increases (assuming very simplistic ellipsoid shape of the RBC). In addition, the thickness of the plasma layer between the RBC and the capillary wall may be slightly different in capillaries with different diameter and for different RBC speeds, which may result in slightly different PO2 in this plasma layer. While the PO2 at the center of the valley likely best represents the PO2 at the surface of the RBC, measurement of PO2 when using the current imaging tools will be noisier if we consider only a very narrow central valley range.

As we previously described, we averaged the decays in the entire valley to calculate RBC-PO2. However, the PO2 change from the center to the edge of the valley may not be large, as evidenced by a PO2 plateau in the vicinity of the RBC (Figure 6—figure supplement 1). Importantly, prompted by the previous reviewer 1’s comment, we compared the RBC-PO2 calculations using the phosphorescence decays from the entire valley (mean RBC-PO2 calculated from 373 capillaries across n = 7 mice is 54.0 ± 4.0 mmHg (mean ± SEM)) and by following the protocol used in (Parpaleix et al. 2013), where PO2 was calculated using the decays at the border of the valley (mean RBC-PO2 = 52.3 ± 4.0 mmHg). The observed small PO2 difference is not statistically significant, it is inconsequential for the results presented in this manuscript, and further confirms that PO2 change across the valley is not large. Therefore, both approaches (averaging across the entire valley or close to its edge) may provide valid results.

We further clarified these points in the Discussion section by adding the following text:

“We averaged all the phosphorescence decays within the valleys (i.e., RBC-passages) in the segmented phosphorescence intensity time courses to calculate RBC-PO2. This approach does not consider that within the valley PO2 may vary as a function of distance to the center of the valley, and the extent of this variation may be different among capillaries of different diameter and/or RBC speeds.”

2) Please address in the discussion the issue that a saturation difference may depend on several factors.

We expanded the discussion about the oxygen extraction change across the cortical layers by adding the following sentence:

“Since oxygen extraction depends on both total blood flow and arterio-venous oxygen saturation difference, it will be important in the future to further experimentally investigate the total blood flow differences across different cortical layers.”

Please also see our answer to the comment #4 raised by reviewer 4.

3) Add the plot for interRBC-PO2 over depth to the supplementary figures.

We thank the reviewers for this suggestion. In the revised manuscript, plots for InterRBC-PO2 were added, and presented in Figure 3—figure supplement 1.

4) Add in the Impact Statement that the measurements are done at the steady state.

We thank the reviewers for this suggestion. In the revised version, the impact statement was updated, and it now reads:

“Resting-state capillary blood flow and oxygenation are more homogeneous in the deeper cortical layers, underpinning an important mechanism by which the microvascular network adapts to an increased local oxidative metabolism.”

The reviewers have added some comments (see the full reviews attached below) to which you could briefly answer.

Reviewer #1:

The authors have made new experiments, new analysis and the text has improved. Previous works are now better described and discussed. The statistics are more appropriate.

The new experiments and analysis done in response to comments #2 and #3 are interesting but they do not fully address the issues raised. This concerns primarily RBC velocity measurements. The good news is that it could be easily done with simple analysis without any further experiment.

The authors initially used the assumption of an identical average size of RBCs to base other calculations, in particular RBC speed. They now show new experiments which results are summarized in several "R1" plots. The plots show that RBC longitudinal size is very variable, increasing very significantly with RBC speed and spreading from 3 to 14 µm (R1C1261 c plot (<30% RBC line-density)). This clearly indicates that RBC shadows measured during PO2 acquisitions cannot be used to estimate RBC speed. Note that the authors should give the "n" for each of the groups of capillaries in all the new "R1" plots.

This variability of RBC size is unfortunately masked in the R1C2-2 plot. This plot needs to show paired measurements in specific capillaries, the question being whether or not similar values of RBC velocity are recorded by the two methods when (presumably) similar real RBC velocities are measured. Showing population averages for the 58 capillaries assessed occludes the similarity/difference on a capillary by capillary basis. The important point here is that all the data are already acquired, for capillaries of known diameters. So the authors could now easily compare RBC values for paired measurements (with the 2 methods) in capillaries of different diameters. Please indicate the "n" for each of the groups of capillaries and plot, for each group, all RBC speed values measured with the 2 methods. I suspect that the authors will find differences with the two techniques. This would invalidate all RBC measurements obtained with point scan PO2 acquisitions.

It is important that the authors clarify the point as fluctuations of RBC shadows, whether measured in distance or time from the center of the shadow, will modify the RBC PO2 value. In fact, it will decrease RBC PO2 and thus the EAT amplitude. Could the authors measure the decays as a function of time, but after an alignment at the RBC border? This would solve the problem.

We agree that only box-plot representation of the data in the previous response may not be sufficient to assess pairwise differences in the RBC speed measurements by the two methods. Please see our response to the summary comment #1 for additional details and the updated plot that includes pairwise connections between measurements. We believe that the previous written response addressed this limitation and hope that updated plot will provide additional clarification.

Regarding the extreme values of estimated RBC longitudinal sizes, please note that they were obtained from the fitted widths of the shadows and the RBC speeds, both of which were extracted from the line-scan images. Measurements of both these parameters have limitations. The line-scan method is less accurate for high RBC speeds, while RBC shadows sometimes may be due to stacked RBCs (as we pointed out previously) and they were noisier when acquired with the line-scan method (due to shorter dwelling time per time-point) than with the point-scan method. This is still not negating that there is an increased error of the instantaneous RBC speed measurements by the point-scan method. However, we contend the mean RBC speed values from the population of capillaries obtained by the two methods are reasonably close. We hope our explanation of this limitation in the manuscript is clear so that readers can be well aware of it while still having a benefit of assessing these measurements in the Supplementary data.

As reviewer requested, in Author response image 7 we compare the RBC speed values estimated by the two methods. The comparison was conducted separately with two groups of capillaries based on capillary diameter. The data scatter is notable, but the regression slopes in both groups are reasonably close to 1.

Regarding the RBC-PO2 measurements, we believe that averaging the phosphorescence decays in the entire valley in the segmented phosphorescence intensity time course is likely going to provide slightly larger RBC-PO2 values than with the decays only close to the valley edge (please see our answer to the summary comment #1), and that both measurement approaches are likely affected by the RBC shape (when RBC elongates at high speed, plasma layer between the RBC and the capillary wall becomes thicker and mean PO2 in this plasma layer likely slightly decreases). Therefore, it is not clear to us that measuring the decays as a function of time after aligning with the RBC border will solve the problem. However, the difference between RBC-PO2 values obtained by the two approaches are rather small comparing to the RBC-PO2 (please see our answer to the summary comment #1) and it looks to us that they both provide valid estimates of PO2 in the plasma adjacent to the RBC.

Reviewer #4:

[…] The additional studies are an important step to judge the accuracy of the RBC velocity measurements.

However, the following major concerns remain:

- Author response image 2: a scatter plot that directly compares the RBC velocity from the line-scan and the point measurement would be more appropriate. Additionally, the average relative difference between the two measurements should be provided.

- Author response image 7: The results clearly show that there is significant variability in the longitudinal RBC size (CV = 0.4, longitudinal sizes ranging from 4-14 µm). Moreover, the RBC longitudinal RBC size is correlated with the RBC speed and the RBC Line-Density. It is impossible to estimate the impact of these dependencies on the presented RBC speed results.

Please see our answers to the summary comment #1 and the comment #2 from reviewer 1.

I thank the authors for the additional explanations regarding IVR and I believe that the changes in the discussion are very valuable. However, some aspects of my initial comment have not been addressed.

The EAT is computed from the RBC-PO2 and the interRBC-PO2. As such I believe that EAT, RBC-PO2 and interRBC-PO2 should always be analysed and discussed hand in hand. Thus, it would be valuable for the manuscript to add the plot for the interRBC-PO2 over depth to the supplementary figures and to discuss RBC-PO2 and interRBC-PO2. Moreover, I suggest to add and discuss the EAT STD & CV plots over depth as it is done for all other quantities.

As stated in my original comment it is a surprising results that RBC-PO2 increases over depth and I don't know which mechanism could explain this increases (Figure 3—figure supplement 1). The same holds for interRBC-PO2 (which has to increase more than RBC PO2 in order to explain the EAT drop over depth). I do not ask for additional experiments, but I believe that is important to discuss these trends.

In my initial question I asked how the author's ensured that the depth-dependent differences are not affect by the position of the chosen capillaries along the capillary pathway or to put it differently how the capillaries were chosen over depth to guarantee an equal distribution of "upstream" and "downstream" capillaries. I kindly ask the author to describe if this has been considered in some way? If it has not been considered the possible impact on the depth dependent results should be discussed.

The EAT drop over depth is one of the major results of this manuscript and as the authors state in subsection "EAT measurements are typically much noisier"Discussion section. Consequently, I believe that the available data should be analysed as rigorously as possible.

In the revised manuscript, we included the InterRBC-PO2 plot in Figure 3—figure supplement 1, and we also included the STD and CV of EATs in Figure 6 —figure supplement 1. Smaller difference between RBC-PO2 and InterRBC-PO2 and, consequently, smaller EATs at greater depths are likely a consequence of more narrowly distributed capillary blood flow and oxygenation. It remains unclear to us how EAT STD and CV are related to oxygen delivery, and as a result, we are hesitant to include extensive comments on these parameters in the manuscript. Nevertheless, we are happy to provide these results as figure supplements.

We can only hypothesize as to why the mean capillary RBC-PO2 and InterRBC-PO2 increase with depth was observed. As reviewer mentioned, change in proportion of upstream to downstream capillaries with depth may contribute. The observed increase in mean values may be in part due to more homogeneous flow and PO2, since in the networks in which vascular oxygen content and blood flow are strongly positively correlated (which is the case here), mean vascular segment PO2 may be higher when PO2 and blood flow distribution is more homogeneous even for the same total blood flow and total oxygen flux through the tissue volume. Other mechanisms may also contribute, but we are not sure that discussion based on our available data will be insightful.

Regarding the proper sampling of the upstream and downstream capillaries, we believe that our measurement protocol (i.e., measuring PO2 in all capillaries identified within the field of view at each imaging plane) together with the large number of capillaries interrogated at each depth, ensured that upstream and downstream capillaries were sampled equally proportional to their natural number densities. Consequently, by following our measurement protocol, we could not guarantee an equal distribution of interrogated upstream and downstream capillaries unless the equal number of upstream and downstream capillaries is already naturally occurring across the cortical layers. However, regardless of the potential depth-dependent differences in the densities of upstream and downstream capillaries, we believe that our approach (i.e., sampling a large fraction of segments without discriminating them by branching order) is appropriate for obtaining the mean values at different depths. Please see our response to comment #1d from reviewer 4 and the updated subsection “Measurement of RBC-PO2, InterRBC-PO2, EAT, and RBC flow in capillaries” for clarification of the sampling protocol. Please also note that the ratio of the number of upstream to downstream capillaries may contribute to the mean value across all the capillaries at one depth, and that this ratio may be changing with depth.

I disagree with the given explanations why RBC flux in layer IV is supposed to be higher than in layer I. What matters here is not the average RBC flux and the higher capillary density per layer but the flux into the capillary bed per layer or to put it differently the flux out of the diving arterioles per layer.

The given arguments connecting average RBC flux and capillary density are not plausible. I try to explain this with a simplified example. Imaging two similar tissue volumes: One with a single vessel and flow rate q1 through that vessel. The second one also has an inflow rate of q1 but the vessel splits in two vessels. In both cases the inflow (and thus the oxygen availability) per tissue volume is the same. The vessel density is however higher in the second one. The authors now argue that the macroscopic flow rate would be larger in the second example, which is not true.

Of course, higher vessel density, i.e. more flow pathways, might have an effect on the overall flow rate. However, many open questions remain regarding these issues and simply relating RBC flux and capillary density to estimate the overall flow is not correct.

The referenced figures (Suppl. Figure 7b in Sakadazic et al., 2014 and Figure 2c in Gould et al., 2017) show the number of capillary segments, which is not the same as vessel density.

In the original work from Blinder et al., 2013 Figure 2c the capillary density increased from ~4% in layer I to ~5% in layer IV, which is an increase by ~20% but not by 50%.

Taken together, my initial question remains, i.e. the depth-dependent blood flow/oxygen availability has a strong impact on the actual oxygen extraction per layer. This should be discussed properly. Maybe it would good to change the variable name to depth-dependent saturation difference or comparable, because the term oxygen extraction seems to be misleading.

We agree that what matters is the total blood flow that supplies the cortical layer. We also agree with the conceptual example that reviewer presented, but we believe that flow parameters used by reviewer in this example do not agree with our measurements. To better clarify it, let’s consider the same example with two similar tissue volumes: One with a single vessel and the flow rate q1, and the second one in which the vessel splits in two vessels but each of these two vessels has the flow rate q1 identical as in the single vessel in the first tissue volume. In this case the inflow (and thus the oxygen availability) per tissue volume is two-fold higher in the second sample. We believe that this example more closely represents the blood flow and capillary density in cortical layers I and IV. We measured only a small to moderate decrease (~13%) of the mean capillary RBC flux from layer I to layer IV, but capillary segment density in layer IV is much higher than in layer I (~50%, as measured by us and others). We believe that this supports our statement made in the manuscript that blood flow may be higher in layer IV than in layer I.

Regarding the measurements of the capillary densities in layers I and IV, probability density of capillary segments as a function of depth was presented in Figure 2C in (Gould et al., 2017) and number of capillary segments as a function of depth was presented in Suppl. Figure 7B in (Sakadzic et al., 2014), which are both directly proportional to the density of the capillary segments. It is correct that the capillary segment density is not the same as the vessel density, but we believe that capillary segment density is even more relevant for considerations of the relation between the mean capillary flow and the total flow (i.e. that considering the length of individual segments may be less important than the number of branching segments off the main supplying vessel). Nevertheless, in Figure D2 in (Blinder et al., 2013), average of the first two bars (layer I extends to ~100 µm depth in the mouse barrel cortex) is close to 50% smaller than the bars in the layer IV.

While we believe that measurements of the capillary RBC flux and segment density provide strong indication that blood flow in layer IV is larger than in the superficial layers, it will be important to validate this conclusion in the future by direct layer-dependent CBF measurements. Prompted by the reviewer’s comments, we expanded the Discussion section to better clarify that blood flow, oxygen extraction, and arterio-venous saturation difference are mutually dependent observables, and to point out that future direct measurements of CBF in different cortical layers will further strengthen our conclusions (please see the answer to summary comment #2 for details about the inserted text).

I believe the impact statement should be improved. "Homogenization", "Mechanism" and "adapts" suggest that the presented study looks at active mechanisms or dynamic changes. However, the work is a detailed description of the steady state flow and oxygen distribution.

We thank the reviewer for this suggestion. Please see the response to the summary comment #4.

[Editors’ note: further revisions were suggested before acceptance, as shown below.]

[…] To end the controversy, I propose the following:

1) Subsection “Oxygen extraction fraction increases in the deeper cortical layers”: substitute the sentence by something like: "Note that as the instantaneous RBC shadow varies with both RBC speed, position and vessel size (see Supplementary Figure 1), RBC speed calculation was model-based by assuming a constant RBC size (6µ)(Unekawaet al., 2010).

2) In Supplementary Figure 1 (it will replace the current supplementary figure 1 which is not informative) please add the following plots which are interesting, justify the model based-choice and explain the problem of point measurements to estimate the RBC speed:

Add the plot from your Summary Comment (Title Comparison between the RBC speed measurements by the line-scan and point-scan method.)

Add the new Author response image 7 plot (title Correlation between the line-scan and point-scan RBC-speed values in the capillaries having the diameter of 2-3 μm (left panel) and 3-5 μm (right panel)).

Add the plot Author response image 1 from your former response (Title a-c. RBC longitudinal size vs. capillary diameter, RBC speed, and line-density, respectively.)

3) Add the comments on these findings in the Discussion section.

Thank you for this suggestion. We updated the text in subsection “Oxygen extraction fraction increases in the deeper cortical layers”, which now reads:

“Please note that the RBC speed estimation in this work was model-based by assuming a constant RBC size (6 µm) (Unekawa et al., 2010). However, the RBC size may vary with RBC speed, line-density and capillary diameter (Chaigneau et al., 2003). The comparisons between the RBC speed measurements obtained by using the model-based point-scan method and more direct measurements by the line-scan method (Kleinfeld et al., 1998) are presented in Figure 1—figure supplement 2.”

To preserve the flow of this paragraph, this expanded text was added at the end of the first paragraph of sunsection “Oxygen extraction fraction increases in the deeper cortical layers” in the revised manuscript.

In the revised manuscript, the original Figure 1—figure supplement 1 was replaced and Discussion section was updated as suggested. Please note that Supplementary Figures 1 and 2 exchanged their positions due to their order of appearance in the manuscript text.

Smaller EATs in layer IV:

Include in the discussion your detailed responses to the following points:

The increase in interRBC-PO2 and RBC-PO2 over depth, which is a very surprising result, as generally the most saturated RBCs enter the vasculature at the surface.

The impact of the sampling of "upstream" and "downstream" vessels and their distribution over depth.

Saturation difference/oxygen extraction:

As oxygen extraction, saturation difference and total blood flow are related quantities, it is important to add this information at two locations:

-where the depth-dependent oxygen extraction fraction is introduced (subsection “Oxygen extraction fraction increases in the deeper cortical layers”) and

-where the calculation of the depth-dependent OEF is described (subsection “Calculation of SO2 and depth-dependent OEF.”).

We accepted all suggestions in this comment and updated the manuscript text accordingly.

Associated Data

    This section collects any data citations, data availability statements, or supplementary materials included in this article.

    Supplementary Materials

    Figure 1—source data 1. Measurements of Mean-PO2 acquired in 6544 microvascular segments over n = 15 mice.
    elife-42299-fig1-data1.xlsx (351.7KB, xlsx)
    DOI: 10.7554/eLife.42299.005
    Figure 3—source data 1. Measurements of Mean-PO2, RBC-PO2, InterRBC-PO2 and RBC flux acquired in 978 microvascular segments over n = 15 mice.
    elife-42299-fig3-data1.xlsx (119.1KB, xlsx)
    DOI: 10.7554/eLife.42299.009
    Supplementary file 1. Measurement information for the main analysis in Figures 27.
    elife-42299-supp1.docx (13.6KB, docx)
    DOI: 10.7554/eLife.42299.022
    Transparent reporting form
    DOI: 10.7554/eLife.42299.023

    Data Availability Statement

    All data generated or analyzed during this study are included in this paper and the supporting files.

    All data generated or analyzed during this study are included in this paper and the supporting files.


    Articles from eLife are provided here courtesy of eLife Sciences Publications, Ltd

    RESOURCES