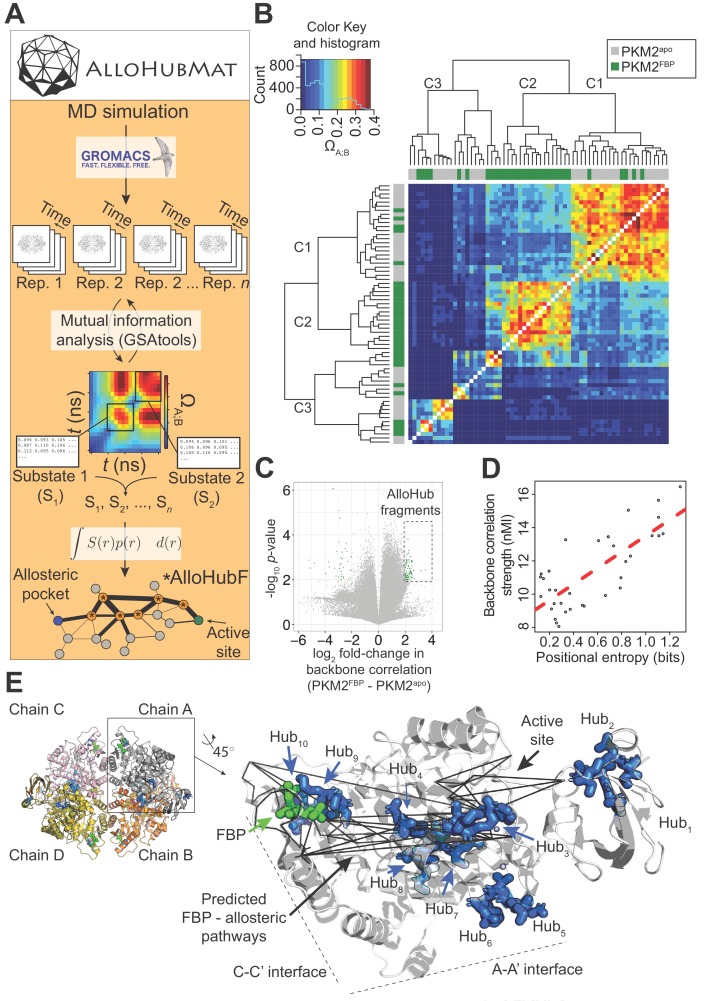
Figure 5. AlloHubMat predicts candidate residues that mediate the allosteric effect of FBP on PKM2, from molecular dynamics (MD) simulations.
(A) Schematic of the AlloHubMat computational pipeline, developed to identify residues that are involved in the transmission of allostery between an allosteric ligand pocket and the active site. Multiple replicate molecular dynamics (MD) simulations are seeded from the 3D protein structure using the GROMACS molecular dynamics engine. All MD simulations are encoded with the M32K25 structural alphabet (Pandini et al., 2010), and the protein backbone correlations over the MD trajectory are computed with GSAtools (Pandini et al., 2013) using information theory mutual information statistics. The backbone correlations are explicitly used to identify and extract configurational sub-states from the MD trajectories. A global allosteric network is then constructed by integrating over the correlation matrices, and their respective probabilities, from which allosteric hub fragments (AlloHubFs) are extracted. Each AlloHubF comprises four consecutive amino acid residues. (B) Correlation matrices cluster according to the liganded state of PKM2 in the MD simulations. AlloHubMat, described in (A), was used to identify correlation matrices of the conformational substates from five separate 400 ns MD simulations of PKM2apo (grey) and PKM2FBP (green). In total, we identified eight sub-states for all simulations of PKM2apo and eight for PKM2FBP. For every sub-state, the network of correlations from each of the four protomers is presented individually. To investigate whether the correlated motions for each sub-state could be attributed to the liganded state of PKM2, the correlation matrices were compared with a complete-linkage hierarchical clustering (see Materials and methods). The matrix covariance overlap (ΩA;B) was used as a distance metric, represented by the colour scale. A high ΩA;B score indicates high similarity between two correlation matrices, and a low ΩA;B score indicates that the correlation matrices are dissimilar. The clustering analysis revealed three clusters, denoted C1-C3. Cluster C1 was dominated by correlation matrices extracted from PKM2apo simulations, and cluster C2 was exclusively occupied by PKM2FBP correlation matrices. C3 consisted of correlation matrices from PKM2apo and PKM2FBP simulations. (C) A volcano plot showing difference in protein backbone correlations – derived from the AlloHubMat analysis – between PKM2apo and PKM2FBP. Each point corresponds to a correlation between two distal protein fragments; points with a positive log2 fold-change represent correlations that are predicted to increase in strength upon FBP binding. Correlations with a log2fold-change ≥ 2 and a false discovery rate ≤ 0.05% (determined from a Wilcoxon ranked-sum test) between PKM2apo and PKM2FBP were designated as AlloHubFs, highlighted in green. A total of 72 AlloHubFs were predicted from this analysis. (D) The positional entropy of the PKM2 fragment-encoded structure correlates linearly with the correlation strength of the fragment. The total mutual information content was computed by summing over the correlations for each of the top AlloHubFs. nMI: normalised mutual information. (E) Left: PKM2 structure depicting the spatial distribution of the top ten predicted AlloHubFs. Right: zoom into a single protomeric chain shown in cartoon representation. AlloHubFs (blue) and FBP (green) are shown as stick models. Black lines indicate minimal distance pathways between the FBP binding pocket and the active site, predicted using Dijkstra’s algorithm (see Materials and methods) with the complete set of correlation values as input.


