

Abstract
Computational metabolite annotation in untargeted profiling aims at uncovering neutral molecular masses of underlying metabolites and assign those with putative identities. Existing annotation strategies rely on the observation and annotation of adducts to determine metabolite neutral masses. However, a significant fraction of features usually detected in untargeted experiments remains unannotated, which limits our ability to determine neutral molecular masses. Despite the availability of tools to annotate, relatively few of them benefit from the inherent presence of in-source fragments in liquid chromatography-electrospray ionization-mass spectrometry. In this study, we introduce a strategy to annotate in-source fragments in untargeted data using low energy tandem MS spectra from the METLIN library. Our algorithm, MISA (METLIN-guided in-source annotation), compares detected features against low energy fragments from MS/MS spectra, enabling robust annotation and putative identification of metabolic features based on low energy spectral matching, The algorithm was evaluated through an annotation analysis of a total 140 metabolites across three different sets of biological samples analyzed with liquid chromatography-mass spectrometry. Results showed that in cases where adducts were not formed or detected, MISA was able to uncover neutral molecular masses by in-source fragment matching. MISA was also able to provide putative metabolite identities via two annotation scores, These scores take into account the number of in-source fragments matched and the relative intensity similarity between the experimental data and the reference low energy MS/MS spectra. Overall, results showed that in-source fragmentation is a highly frequent phenomena that should be considered for comprehensive feature annotation, Thus, combined with adduct annotation, this strategy adds a complementary annotation layer, enabling in-source fragments to be annotated and increasing putative identification confidence. The algorithm is integrated into the XCMS Online platform and is freely available at http://xcmsonline.scripps.edu.
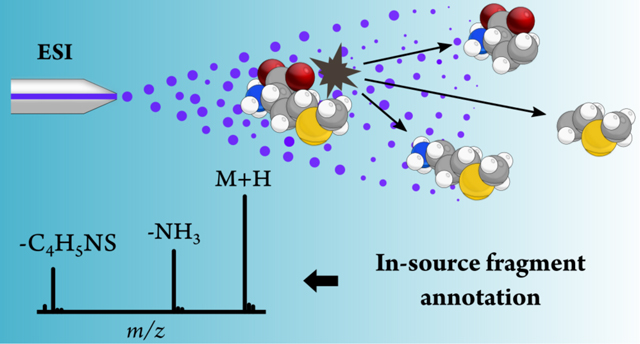
Graphical Abstract
Metabolite annotation in liquid chromatography-electrospray ionization-mass spectrometry (LC-ESI-MS) aims at finding m/z relationships among features that allow the determination of neutral masses of the underlying metabolites, This process facilitates finding putative metabolite identities based on accurate mass search, and more importantly, it facilitates finding protonated/deprotonated species or other adducts that can be fragmented via tandem MS to confirm their identities. However, a significant portion of features in untargeted experiments remains unannotated after the application of established annotation algorithms1. This results in peak redundancy, where a single analyte yields multiple MS peaks (e.g., adducts, dimers, isotopes or in-source fragments)2 hampers this annotation process and leads also to false annotations3.
In-source fragmentation is a natural phenomenon in LC–ESI–MS as a large number of metabolites readily dissociate in the source4. Unlike adducts, m/z values of in-source fragments (ISF) are generally specific for each metabolite, but only common neutral losses as a result of in-source fragmentation are typically annotated by established annotation methods. By only detecting common neutral losses, current tools are missing available information that could improve putative identification of metabolites. Despite the existence of a wide range of tools for computational annotation, reviewed elsewhere5–7, relatively few of them focus on the annotation of in-source fragments8,9. Existing tools and algorithms to annotate ISF in LC–ESI–MS rely on computer-generated in silico fragments or small databases containing low energy MS/MS spectra8,9. However, the relatively low accuracy of in silico spectral data still precludes them from serving as a reference for annotation purposes.
ISF typically occurring in LC, or in other pre-ionization separation techniques such as supercritical fluid chromatography (SFC)10, or capillary electrophoresis (CE) 11, coupled to ESI–MS are usually similar to those fragments in low energy collision-induced dissociation (CID) MS/MS spectra9. Both in-source and low-energy fragmentations are similar as they are generated by collision under electric fields. In that sense, metabolite identification could be performed similarly as in gas chromatography-mass spectrometry (GC-MS), where the electron impact (El) source yields multiple fragments that are matched against reference spectral data12. Analogously, peaks observed in LC–ESI–MS data could be matched against low energy MS/MS spectra for the same purpose. Despite ESI yields a smaller number of fragments compared to electron impact (El), as ESI was designed to minimize fragmentation13, more than 80% of molecules in METLIN readily dissociate into multiple fragments at low collision energies6, which implies that a considerable fraction of features usually observed in untargeted experiments are ISF. This suggests that it is possible to achieve a more comprehensive annotation by leveraging the presence of ISF in LC–ESI–MS experiments, particularly when adducts are not formed, detected or annotated.
In this work, we report the METLIN-guided in-source annotation (MISA) algorithm that annotates ISF using experimental low energy MS/MS spectra from the METLIN library14. Currently, METLIN contains experimental MS/MS spectra for more than 200,000 molecular standards in both positive and negative mode and at different collision energies. Features detected after XCMS Online15 data processing are interrogated by MISA, and features corresponding to protonated/deprotonated or adducts ion species from available MS/MS spectra in METLIN are assigned with a putative identity when their respective ISF are observed, This new workflow is integrated into XCMS Online, and it reports annotated ISF and putative metabolite identities together with adducts, isotopes and common neutral losses reported by CAMERA16. We validated the algorithm by the annotation a total of 140 compounds across three different datasets, This strategy provided a complementary layer of information that enabled unraveling neutral masses and putative metabolite identities with higher confidence as a result of more metabolite-specific information provided by in-source fragmentation.
EXPERIMENTAL SECTION
Materials.
Three different datasets were analyzed, The first dataset was generated from 39 mice plasma samples and the second dataset corresponded to the analysis of 39 mice brain. Both plasma and brain were analyzed using reversed-phase (RP) and hydrophilic interaction liquid chromatography (HILIC) in a Bruker Impact II (Bruker Corp., Billerica, MA) and a Synapt G2-Si quadrupole time-of-flight mass spectrometer (Waters Corp. Milford, MA). The third dataset was taken from an independent study published elsewhere17, which raw data was made public (Metabolights accession number MTBLS20). This dataset consisted of human urine samples analyzed in RP-LC coupled to an LTQjOrbitrap MS (Uermo Fisher Scientific, Waltham, MA) in both positive and negative mode. Pure standards to confirm metabolite identities were purchased from Sigma-Aldrich (St. Louis, MO).
Metabolite extraction.
Metabolites from mice plasma and brain were extracted as described elsewhere18. Briefly, samples were homogenized in a cold mixture of acetonitrile/methanol/water 2:2:1. Protein was precipitated through 3 cycles of freeze/thawing and an incubation at −20 C for 1 hour. Finally, samples were centrifuged at 13,000 rpm for 15 minutes at 4 C and supernatants containing metabolites were dried down and stored at −80 C prior to LC–MS analysis.
LC-MS analysis.
Plasma and tissue extracts were analyzed in both RP and HILIC using UPLC columns ACQUITY BEH C18 (2.1 × 100 mm, 1.7 μm) and ACQUITY BEH Amide (2.1 × 100 mm, 1.7 μm, Waters Corp. Milford, MA). The gradient for RP analysis consisted of (400 μL/min flow rate) 1% B for 1 minute, 99% B over 9 minutes and held at 99% B for 3 minutes, The gradient for HILIC analysis consisted of (400 μL/min flow rate) 99% B for 1 minute, 65% B over 13 minutes, 40% B over 3 minutes and held at 40% B for 1 minute. All analyses were carried out in positive ion mode, The composition for the mobile phases A and B consisted of water + 0.1% formic acid and acetonitrile + 0.1% formic acid, respectively.
Data processing and analysis.
Datasets 1 and 2 were processed by XCMS Online, This processing consisted of peak picking, retention time alignment and feature grouping, following annotation with CAMERA. This processing resulted in a set of features, defined as a molecular entity with a unique m/z and a specific retention time, The list of metabolites used to demonstrate MISA’s performance consisted of metabolites with a broad range of physicochemical properties and metabolites involves in key metabolic pathways (e.g., amino acids, vitamins, lipids, coenzymes and acylcarnitines, to name a few). All identifications (a total of 140 metabolites across datasets) were confirmed by the analysis of pure materials: a total of 45 and 37 metabolites were detected by MISA and confirmed for dataset 1 and 2, respectively. For dataset 3, a total of 58 metabolites (35 in positive mode and 23 in negative mode) were detected by MISA and confirmed, The following parameters were used: cent-Wave peak picking algorithm (ppm =15 and minimum and maximum peak width of 2 s and 25 s respectively), obiwarp retention time correction (profStep = 0.1) and alignment (mzwid = 0.01, min-frac = 0.5 and bw = 2). CAMERA parameters were: error = 5 ppm and m/z absolute error = 0.015 Da. Parameters for dataset 3 are described in the original study17.
RESULTS AND DISCUSSION
Computational workflow.
METLIN-guided in-source fragment annotation (MISA) is integrated into XCMS Online15, where LC-MS data is processed for peak picking and alignment, resulting in a set of features (m/z and retention time). It is worth to noting that CAMERA (which annotates adducts and some common neutral losses) and MISA annotations are independent and the results of the two tools are reported separately. In order to annotate ISF, MISA uses the output generated by XCMS Online to compare the observed features in MS1 data with the low energy MS/MS spectra in the METLIN library, The latter has been generated by the analysis of analytical standards at different collision energies. Given the low fragmentation yield of ESI as discussed above, only low collision energies (0 and 10 eV) are taken into account for ISF annotation.
First, the m/z value of each detected feature is searched, within a user-defined m/z error (in ppm), against precursor adduct ions of metabolites with experimental MS/MS spectra in METLIN. In the cases where a match is found, co-eluting features (i.e. different m/z but with the same retention time), are searched against the low energy fragmentation products for that particular metabolite. Co-eluting features are determined based on a user-defined retention time window in seconds. If one or more matches are found to a particular metabolite, the feature is assigned a putative metabolite identity, and the features corresponding to ISF are annotated as such of the corresponding molecule (Figure 2). Considering the large number of features detected in LC–MS metabolomics experiments, features can be assigned several putative identifications, with different levels of annotation confidence (Figure 2). Examples of these annotations are shown below.
Fig. 2.
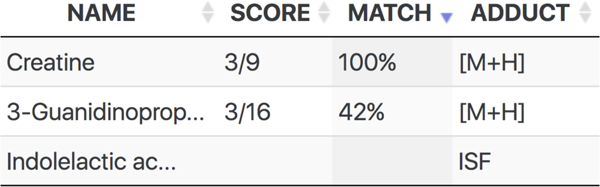
Screenshot of MISA’s output. For a given feature selected by the user in the XCMS Online results table, MISA will output all putative identities. In this example, this feature could be attributed to the protonated species (M+H) of creatine or 3-guanidinopropanoate, since three of their in-source fragments have been observed. The score (match score) and the match (match factor) are two scores computer by MISA used to assess the likelihood of that feature stemming from the metabolite reported by MISA. It could be that this features is in fact an in-source fragment of another molecule, in this case it could be an in-source fragment (ISF) of indolelactic acid. This means that there is another feature in the dataset that has been annotated by MISA as the protonated species of indolelactic acid and this feature has been annotated as its in-source fragment.
For each putative metabolite identification, MISA computes two scores called the ratio score and match factor, The scores are collectively used to assess the likelihood of that feature stemming from the metabolite reported by MISA. The ratio score is provided as a fraction (Figure 2). The numerator is the number of peaks in MS1 that matched to low energy spectrum fragments, i.e., the number of ISF found in the sample data, The denominator indicates the total number of fragments in the low energy MS2 reference spectrum, without considering the precursor, This ratio score takes only the presence of ISF in MS1 into account. On the other hand, the match factor is calculated using the dot product operation, The dot product is a spectral similarity score widely used for MS spectral comparisons that does take relative peak intensities into account, The dot product compares the spectral similarity of the in-source fragment peaks found in MS1 against the low energy spectrum. Specifically, we compute the so-called reverse dot product19, where peaks in MS1 that do not match any peak in the library spectrum are not considered, i.e., only matched peaks are considered, The dot product value ranges from 0 to 100, being 100 the highest similarity possible. For both the ratio score and match factor computation, the reference low energy spectra consist of the 10 eV spectra, and additional fragments unique to 0 eV spectra. Precursors are excluded from the spectra and therefore from the score computation, The match factor is only computed if the low-energy spectrum is composed of at least three fragments.
Application of MISA for the annotation of metabolites in un-targeted experiments.
To illustrate the capabilities of the proposed approach, two datasets, the first comprising mice plasma samples (dataset l) and the second comprising mice brain tissue samples (dataset 2) were analyzed by UPLC-MS in RP and HILIC chromatography in positive mode. Raw data files were uploaded into the XCMS Online platform and processed for peak-detection and alignment in addition to annotation via CAMERA and the METLIN-guided in-source annotation (MISA) algorithm. CAMERA and MISA were independently applied i.e., CAMERA was used to annotate adducts and common losses whereas MISA was used to annotate ISF and provide with a putative metabolite identification. Overall, the complete processing and annotation workflow yielded the detection of 16421 (dataset l) and 9163 (dataset 2) features in RP, and 23651 (dataset l) and 18696 (dataset 2) features in HILIC. MISA assigned a putative metabolite identity to 1061 (dataset l) and 606 (dataset 2) features in RP, and 1294 (dataset l) and 970 (dataset 2) features in HILIC. Identities of a total of 84 compounds across datasets and chromatographic methods were confirmed via tandem MS and comparison with spectral reference data and the use of pure materials (see Data Processing and Analysis section). Table 1 shows the list of correctly annotated metabolites by MISA for datasets 1 and 2. The table also includes the ratio score and the match factor, the number of adducts reported by CAMERA, and the number of ISF detected by MISA that corresponded to common neutral losses in positive ion mode (-H2O, -NH3, -HCOOH, as these have been shown to be the most common6).
Table 1.
List of correctly annotated metabolites by MISA for Datasets 1 and 2.a
| Dataset 1 | Dataset 2 | |||||||||
|---|---|---|---|---|---|---|---|---|---|---|
| No. | Name | Ratio S | No.A | No.L | M.F | Name | Ratio S | No.A. | No.L | M.F |
| 1 | Docosahexaenoic acid | 41/94 | 5 | 1 | 87 | Diethyltoluamide | 1/5 | 100 | ||
| 2 | Oleic Acid | 35/84 | 4 | 1 | 66 | Methionine | 7/13 | 2 | 21 | |
| 3 | Palmitic acid | 22/49 | 5 | 43 | Sphinganine | 1/12 | 1 | 1 | 94 | |
| 4 | Methionine | 4/12 | 2 | 85 | Guanidylic acid | 3/7 | 3 | 71 | ||
| 5 | Myristic acid | 13/44 | 4 | 16 | Sphingosine | 4/9 | 2 | 1 | 100 | |
| 6 | Linoleic acid | 63/100 | 5 | 1 | 77 | 1-AG | 6/61 | 70 | ||
| 7 | Arachidonic Acid | 8/58 | 4 | 1 | 67 | Guanine | 2/3 | 1 | 85 | |
| 8 | Myristoleic acid | 1/53 | 1 | Trigonelline | 1/7 | 1 | 71 | |||
| 9 | 2-Linoleoyl Glycerol | 11/66 | 3 | 1 | 87 | Phosphocholine | 3/5 | 2 | 88 | |
| 10 | Proline | 1/2 | 1 | Betaine | 1/2 | |||||
| 11 | Leucine | 1/2 | 1 | NADP+ | 6/10 | 13 | ||||
| 12 | Glutamine | 3/7 | 1 | 79 | NAD | 9/14 | 2 | 6 | ||
| 13 | Histidine | 1/7 | 1 | 100 | Tryptophan | 7/12 | 2 | 100 | ||
| 14 | Phenylalanine | 2/7 | 1 | 100 | Arginine | 9/10 | 5 | 2 | 87 | |
| 15 | Ectoine | 1/8 | 1 | 99 | Argininosuccinic acid | 1/16 | 2 | 1 | 43 | |
| 16 | Methionine | 6/14 | 2 | 81 | Citrulline | 4/12 | 1 | 98 | ||
| 17 | Hippuric acid | 1/11 | 100 | Tryptophan | 8/12 | 2 | 99 | |||
| 18 | 4-Hyd roxyisoleucine | 3/16 | 1 | 17 | N-Acetyl-D-phenylalanine | 4/17 | 1 | 87 | ||
| 19 | Ornithine | 3/15 | 3 | 2 | 39 | NAD | 7/14 | 2 | 58 | |
| 20 | Arginine | 4/10 | 5 | 2 | 35 | Glutathione, oxidized | 10/16 | 1 | 87 | |
| 21 | Methionine S-oxide | 4/19 | 3 | 22 | Cystine | 1/39 | 84 | |||
| 22 | N-Acetyl-L-lysine | 2/6 | 2 | 1 | 92 | Cystathionine | 4/13 | 1 | 100 | |
| 23 | Isoleucine | 1/4 | 1 | 99 | Guanidylic acid | 2/7 | 9 | 100 | ||
| 24 | Tryptophan | 10/12 | 2 | 99 | Lysine | 5/14 | 3 | 3 | 57 | |
| 25 | Glutamine | 5/8 | 5 | 2 | 67 | Histidine | 4/7 | 1 | 100 | |
| 26 | Carnitine | 2/9 | 71 | Carnosine | 11/28 | 6 | 3 | 59 | ||
| 27 | Propionylcarnitine | 1/13 | 28 | Phosphocholine | 2/5 | 9 | 98 | |||
| 28 | Citrulline | 9/12 | 3 | 2 | 95 | Methionine S-oxide | 3/18 | 3 | 1 | 90 |
| 29 | Leucine | 1/3 | 1 | 100 | Threonine | 2/10 | 1 | 97 | ||
| 30 | Phenylalanine | 5/7 | 2 | 100 | Taurine | 1/4 | 1 | 99 | ||
| 31 | Acetylcarnitine | 3/6 | 3 | 52 | Thiamine | 3/5 | 99 | |||
| 32 | Kojibiose | 4/40 | 75 | N-Methylglutamic acid | 3/6 | 2 | 71 | |||
| 33 | Cystine | ¾1 | 2 | 1 | 72 | N2-Acetyl-L-ornithine | 3/17 | 26 | ||
| 34 | Histidine | 4/7 | 1 | 100 | Glutamic acid | 5/5 | 3 | 84 | ||
| 35 | Acetyl-DL-Leucine | 4/7 | 2 | 51 | DL-o-Tyrosine | 6/9 | 2 | 75 | ||
| 36 | Glycerophosphocholine | 2/6 | 3 | 100 | m-Coumaric acid | 5/6 | 3 | 78 | ||
| 37 | 5-L-Glutamyl-L-alanine | 3/12 | 1 | 30 | Sphingosine-1-phosphate | 4/36 | 2 | |||
| 38 | trans-Cinnamic acid | 4/29 | 2 | 59 | ||||||
| 39 | Asparagine | 3/13 | 2 | 40 | ||||||
| 40 | LysoPC(16:0) | 2/3 | 1 | 64 | ||||||
| 41 | Theanine | 4/17 | 2 | 10 | ||||||
| 42 | Lysine | 3/14 | 2 | 36 | ||||||
| 43 | Tyrosine | 7/14 | 2 | 96 | ||||||
| 44 | Gamma-glutamylglycine | 2/14 | 1 | 44 | ||||||
| 45 | Creatine | 3/9 | 2 | 100 | ||||||
Metabolite identities together with their MISA ratio score (Ratio S) computed as the number of fragments found out of the total number of fragments in the low energy spectra, The number of adducts reported by CAMERA (No.A) and the number of fragments that correspond to common neutral losses (No. L) are also noted, The match factor (M.F) denoting the spectral similarity is also shown. Metabolite names appear duplicated in some cases as they have been detected in both RP and HILIC. Also in some cases, the same metabolite in a different mode (RP/HILIC) have a different total number of fragments (Ratio S.). This is because MISA determines the total number of fragments within the MS acquisition range, Therefore, if a MS is configured to acquire in a narrower range, which does not cover the entire low energy MS/MS range, a smaller total number of fragments will be reported in the ratio score.
MISA increases feature annotation performance.
Adducts play an important role in peak annotation, as their observation allows the “triangulation” of protonated/deprotonated or other ion adduct species and therefore the neutral masses of underlying metabolites. At the same time, this annotation of protonated species facilitates the preparation of subsequent targeted tandem MS experiments to identify these features. In 54 cases from a total of 82 metabolites in datasets 1 and 2, no adducts were formed or detected/annotated by XCMS/CAMERA (Table 1). This implies that the feature corresponding to the protonated/deprotonated species could not be annotated by adduct-based annotation approaches such as CAMERA. Instead, MISA was able to annotate a larger number of protonated species, and thus neutral masses, due to the presence of ISF (Figure 3a). Specifically, a total of 72 metabolites dissociated into at least one specific fragment i.e., not a common loss. Also, as observed in Table 1, only a 19% of all the ISF detected by MISA (across datasets) corresponded to common neutral losses, i.e. low-specificity ISF. This demonstrates that adduct-based annotation tools lack the capability to annotate an important fraction of ISF, as only common neutral losses as a result of in-source fragmentation can be annotated via adduct-based annotation, This is also supported by the data shown in Figure 3b, which shows that MISA annotated twice the number of features corresponding to the identified metabolites in comparison to adduct-based annotation. Next, we compared the number of putative metabolite hits between the hits reported by MISA with the hits by accurate mass search of the observed protonated species neutral mass. Figure 3c shows that MISA was able to reduce the list putative identities up to a 32%. As discussed in the following section, manual curation using the MISA annotation scores can be used to further reduce the list and putative metabolites.
Fig. 3.
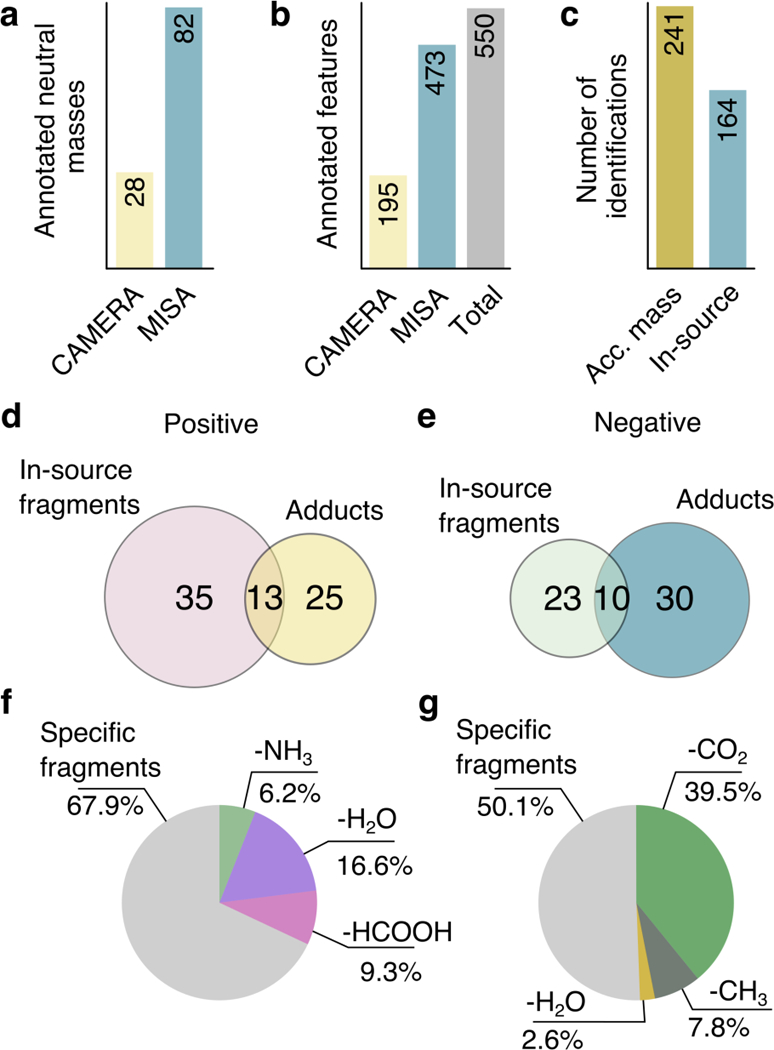
Among all features associated to identified molecules (datasets 1 and 2), panel a exhibits the number of neutral masses that were annotated by CAMERA (due to the detection of adducts or common losses), and by MISA (due to in-source annotation). Panel b shows the total number features stemming from the identified metabolites (including adducts, common losses and specific ISF) that were annotated by CAMERA, MISA and in total (both methods). Panel c shows the number of putative identifications retrieved based on accurate mass search and based on in-source fragment matching; of note, for both methods, only metabolites in METLIN with experimental data were considered. Panels d,e show the overlap between the number of protonated/deprotonated species annotated due to the detection of formed adducts and ISF, in positive and negative mode, respectively, for dataset 3. In f,g the amount of specific fragments and common losses in positive and negative mode is shown, as percentage of all detected ISF.
Due to low intensity peaks and noise, adducts and common losses might not be detected by XCMS or annotated by CAMERA. To demonstrate the advantage of our approach, we additionally evaluated the algorithm through the annotation of human urine samples analyzed by UPLC in RP coupled to a linear quadrupole ion trap-Orbitrap MS in both positive and negative mode (dataset 3, previously published elsewhere17). This dataset underwent a manual inspection of peaks, and common adducts and losses that were not detected by XCMS or annotated by CAMERA were searched in the raw data. From all the metabolites identified in the original study17, a total of 65 (positive mode, +) and 58 (negative mode, -) had experimental MS/MS data in METLIN. From those, MISA’s putative identification reported the correct identity for 35 (+) and 23 (−) metabolites, based on ISF. On the other hand, 25 of 65 (+) and 30 of 58 (−) from all the metabolites with spectral data in METLIN formed common adducts (K+, Na+, Cl-, etc.) or dimers (Figure 3d,e). It is important to highlight that some molecules did not form any adduct, but dissociated into ISF, and vice versa (Figure 3d,e). This demonstrates that each type of annotation (iSF-based and adduct-based) provide a complementary annotation coverage, and that the combination of adduct and in-source fragment annotation is more effective than traditional computational annotation strategies relying on adducts and common neutral losses alone. Finally, more than 67% (+) and 50% (−) of fragments detected by our approach corresponded to specific ISF of each metabolite, whereas the remaining corresponded to common neutral losses (Figure 3f,g).
Robust metabolite annotation based on low-energy fragmentation.
As mentioned before, the combined use of adduct and in-source annotation allowed uncovering a larger number of neutral masses compared to adduct annotation alone, These neutral masses could be searched against databases to find putative metabolite identifications. However, this is considered as a weak metabolite annotation method20. Instead, MISA provides with robust putative identifications based on in-source fragment matching, consisting of the name of the candidate with two matching scores namely ratio score and match factor (see Computational workflow), The ratio score reported by MISA (number of fragments found out of the total number of fragments in low energy spectra in METLIN) is given as a fraction and it serves as an indicator of how reliable putative identifications are. Intuitively, there is a high likelihood that a putative identity is correct in cases where a molecule dissociates into multiple fragments and the majority of those fragments in low energy spectra are found in MS1 data (e.g., tryptophan (10/12), citrulline (9/12), NAD (9/14) or oxidized glutathione (10/16) in Table 1). This is also supported by the false discovery rate (FDR) decrease at high score ratios (see Supplementary Figure S1, and Supplementary Data for details on the FDR calculation). However, not all metabolites readily dissociate into multiple fragments and these are usually low-intensity peaks that can be easily masked by noise. For all these reasons, it is not possible to establish a score threshold to consider a putative identification as correct, and all tentative identifications have to be confirmed via tandem MS.
Next, we focused on intensity similarities between ISF and low energy MS/MS spectra, These intensity similarities are assessed by the match factor score calculated by MISA. Figure 4 shows examples of correct identifications provided by MISA of compounds with multiple ISF together with their corresponding low energy MS/MS spectra. Some metabolites like tyrosine, citrulline or linoleic acid readily dissociate in the source into multiple fragments. As observed in the figure, fragment relative intensities between MS/MS low energy spectra (0 eV or 10 eV) and MS1 pseudo-spectra can vary. In these examples, most ISF are observed in the 10 eV spectra. While relative intensities are similar in some cases (sphingosine, oxidized glutathione, phosphocholine, and thiamine), these are not similar for other metabolites (citrulline). It might occur that the best intensity similarity is at 0 eV (coumaric acid). Other metabolites such as tyrosine and linoleic acid show the best similarity at 5 eV (for illustrative purposes, we computed the 5 eV spectra by intensity interpolation between 0 and 10 eV). These similarities will depend on experimental conditions and instruments. Co-elution of compounds with similar structures, mass selective transmission, ESI needle and lens voltages or temperature can also affect relative intensities.
Fig. 4.
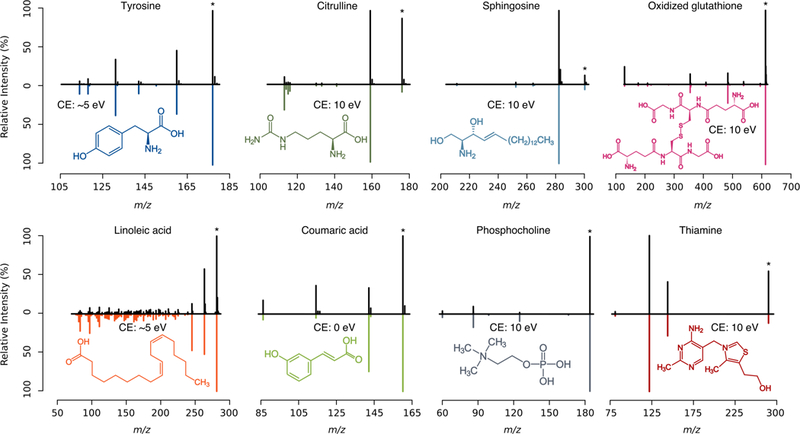
Examples of spectral similarity between MS1 pseudo-spectra (black) and low energy MS/MS spectra extracted from METLIN (color, negatively rotated), for eight metabolites. Protonated ion/precursor (*) together with MS/MS collision energy (CE) are noted. Low energy MS/MS spectra at 5 eV were calculated by fragment intensity interpolation between 0 and 10 eV.
Despite the variability of relative intensities, the match factor provided by MISA can be used to rank candidates sharing the same fragments. Similar compounds like glutamic acid, acetylserine and 3-methylaspartic acid considerably dissociate at low energy and at the same time they share common fragments (Figure 5). These three metabolites will have different elution times; however without the analysis of pure standards, the retention time remains unknown and cannot be taken into account by MISA. In these cases, MISA will report multiple candidates per feature, as peaks found in MS1 might originate from any of those three metabolites. In these cases the match factor can be used to rank the candidates. As an example. Figure 5 shows glutamic acid has a high similarity between its ISF and the low energy spectrum (84%) whereas the other two candidates, acetylserine and 3-methylaspartic acid show a low similarity and low match factor values (7% and 13%, respectively). Glutamic acid was confirmed as the correct identity using MS/MS on the annotated feature. It is worth noting that the match factor measures spectral similarity and, in effect, it performs a correlation between ISF and low-energy spectra. It is well known that the correlation reliability depends on how many data points are used; i.e., how many ISF are being compared, This might lead to non-significant match factors in cases where molecules dissociate into a few fragments at low energy, or few ISF are detected. Examples of this include isoleucine or leucine (Table 1, row number 23 and 29), that dissociate into three fragments at low energy. Other cases include histidine or phenylalanine (Table 1, row number 13 and 14), where despite that they dissociate into multiple fragments, only one or two ISF were detected, since the remaining fragments in the low energy spectrum are low intensity fragments, This is why it is important to use the match factor in combination with the ratio score, as the ratio score indicates the number of fragments involved in the match factor computation.
Fig. 5.
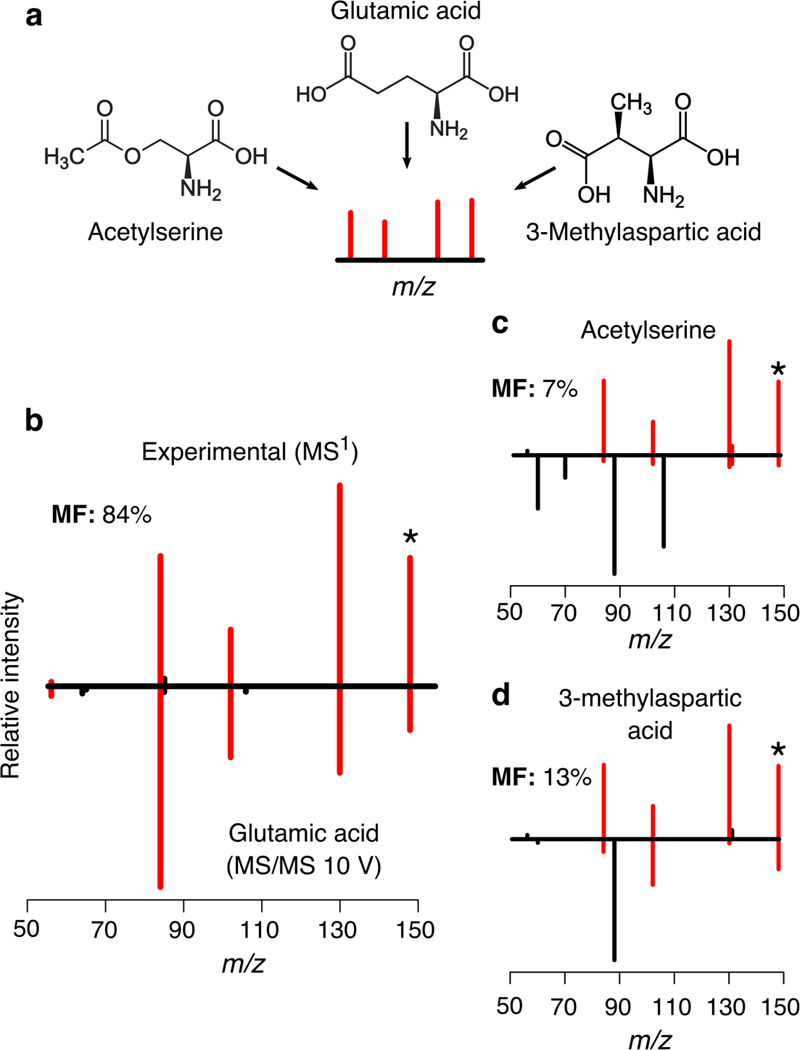
For a given feature, three putative identities, glutamic acid, acetylserine and 3-methylaspartic acid are reported by MISA based on in-source fragment matching. As their chemical structures are similar, they share common fragments (a). Despite being glutamic acid the correct identity (b), false positives might be also reported (c, d). The match factor (MF) can be used to asses spectral similarity.
Some limitations of MISA include the report of false positive putative identifications. Examples of false positives reported by MISA are shown in Table 2, where the correct identifications together with false positive identifications are reported for the same feature. When the same ISF are shared by different molecules, all these molecules are going to be reported as putative identifications. In many cases, these molecules will be similar or will share a substructure, This can be illustrated also with the same example shown in Figure 5, where similar compounds like glutamic acid, acetylserine and 3-methylaspartic acid are reported as potential identity candidates for the observed feature. Following the same example, it could also occur that none of the candidates proposed by MISA corresponds to the true metabolite identity, This will occur when a molecule that lacks of experimental spectral data in METLIN is being detected and shares fragments with similar molecules in METLIN (e.g., if glutamic acid spectra were not included in METLIN, MISA would only report acetylserine and 3-methylaspartic acid as putative candidates). In this case, the detection of four distinctive fragments shared by these molecules would have suggested that the true molecule shared a certain degree of similarity or a common substructure with molecules reported by MISA. Another scenario where false positives are likely to occur is during short LC gradients. In such cases, co-elution of different molecules would increase both the number of features and possible ISF, increasing the match possibilities.
Table 2.
Examples of false positive identifications.b
| No. | True Molecule | False Positive | Score |
|---|---|---|---|
| 1 | Creatine (3/9 – 100%) | 3-Guanidinopropanoate | 3/16 – 42% |
| 2 | L-Theanine (4/17 – 10%) | N2-Acetyl-L-ornithine | 3/17 – 8% |
| Acetylproline (M+NH4) | 3/18 – 7% | ||
| 3 | Acetylcarnitine (3/6 – 52%) | Acetyl-L-carnitine hydrochloride | 3/5 – 39% |
| 4 | Isoleucine (1/4 – 99%) | Leucine | 1/3 – 100% |
| Norleucine | 1/4 – 100% | ||
| Alloisoleucine | 1/5 – 99% | ||
| 5 | N-Methylglutamic acid (3/6 – 71%) | 2-Aminoadipic acid | 5/8 – 53% |
In cases where multiple metabolites share common fragments, MISA will report both the true and false positive identities. In these examples, the true molecule together with their ratio score (fraction) and match factor (percentage) are listed. For each true identity, the table indicates the false positives reported by MISA also with their respective scores.
Overall, according to the guidelines by the Metabolomics Standards Initiative (MSI)21, MISA can be used to retrieve level 2 putative identifications in cases where diagnostic fragments or neutral losses consistent with a specific structure are observed22. Moreover, despite the fact that METLIN is one of the largest libraries of experimental MS/MS spectra, an extensive number of metabolites lack of experimental spectra23,24. For these reasons, MISA putative identifications require a level 1 confirmation21,25 using tandem MS using standard materials in combination with orthogonal techniques under identical analytical conditions.
CONCLUSIONS
Despite the existence of computational annotation algorithms, a large number of features observed in untargeted metabolomics profiling still remain unannotated. More than 80% of molecules included in spectral databases readily dissociate into multiple fragments at low collision energy6, which implies that a considerable fraction of those features corresponds to in-source fragments. Here, we present a strategy to annotate in-source fragments via comparison with METLIN’s experimental low energy MS/MS spectra. We demonstrated that the combined use of adduct and in-source annotation allowed uncovering a larger number of neutral masses compared to adduct annotation alone. More importantly, MISA enabled the annotation of neutral masses even when adducts were not observed. At the same time, MISA enabled a robust putative metabolite annotation based on low energy spectral comparison, These annotations can be used to reduce the number of possible metabolite candidates that can be attributed to a feature.
Overall, the presented strategy performs a complementary annotation layer by leveraging the information from experimental low energy spectra in METLIN, currently covering more than 200,000 molecules, This strategy allows in-source fragments to be annotated, increasing in turn metabolite annotation confidence. Ultimately, our autonomous strategy contributes to streamlining feature annotation and identification in untargeted metabolomics.
Supplementary Material
Fig. 1.
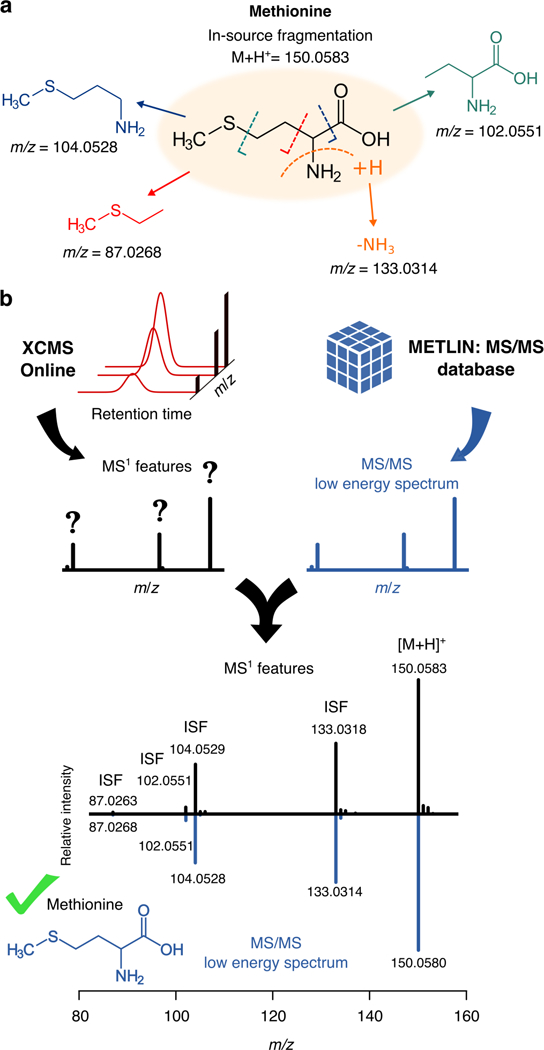
In a, the dissociation pathway of methionine at low collision energy is illustrated, which shows how multiple fragments can be observed as in-source fragments. In b, MS1 features obtained after XCMS Online processing are matched against low energy MS/MS spectra (0 and 10 eV) from METLIN. This fragment comparison enables the annotation of these in-source features as in-source fragments (ISF) or e.g., protonated/deprotonaded or other ion adduct species, and it provides with a putative identity of the feature based on low energy fragmentation.
ACKNOWLEDGMENTS.
This research was partially funded by Ecosystems and Networks Integrated with Genes and Molecular Assemblies (ENIGMA), a Scientific Focus Area Program at Lawrence Berkeley National Laboratory for the US Department of Energy, Office of Science, Office of Biological and Environmental Research under contract number DE-AC02-05CH11231; and National Institutes of Health grants ROI GM114368-03, P30 MH062261-17, and P01 DA026146-02.
Footnotes
Code availability: The full implementation of MISA is integrated in http://xcmsonline.scripps.edu. The source code for developers is available at https://github.com/xdomingoal/misaR
Supporting Information Available: Methods to determine the true and false positive (FP) distributions and false discovery rate (FDR) for both ratio and dot product scores, together with the respective figure showing the FP distribution and FDR.
REFERENCES.
- 1.Chaleckis R, Meister I, Zhang P, Wheelock CE Challenges, progress and promises of metabolite annotation for LC-MS-based metabolomics. Curr Opin Biotechnol. 2019, 55, 44–50. [DOI] [PubMed] [Google Scholar]
- 2.Vinaixa M; Samino S; Saez I; Duran J; Guinovart JJ; Yanes O A Guideline to Univariate Statistical Analysis for LC/MS-Based Untargeted Metabolomics-Derived Data. Metabolites 2012, 2, 775–95. [DOI] [PMC free article] [PubMed] [Google Scholar]
- 3.Mahieu NG, Spalding JL, Gelman SJ, Patti GJ Defining and Detecting Complex Peak Relationships in Mass Spectral Data: The Mz.unity Algorithm. Anal. Chem. 2016, 88, 2273–2281. [DOI] [PMC free article] [PubMed] [Google Scholar]
- 4.Xu YF; Lu W; Rabinowitz JD Avoiding misannotation of in-source fragmentation products as cellular metabolites in liquid chromatography-mass spectrometry-based metabolomics. Anal. Chem. 2015, 87, 9037–9046. [DOI] [PMC free article] [PubMed] [Google Scholar]
- 5.Spicer R; Salek RM;Moreno P; Cañueto D; Steinbeck C Navigating freely-available software tools for metabolomics analysis. Metabolomics 2017, 13:106. [DOI] [PMC free article] [PubMed] [Google Scholar]
- 6.Domingo-Almenara X et al. Annotation: A Computational Solution for Streamlining Metabolomics Analysis. Anal. Chem. 2018, 90, 480–489. [DOI] [PMC free article] [PubMed] [Google Scholar]
- 7.Misra BB New tools and resources in metabolomics: 2016–2017. Electrophoresis 2018, 39, 909–923. [DOI] [PubMed] [Google Scholar]
- 8.Lynn KS; Cheng ML; Chen YR; Hsu C; Chen A; Lih TM; Chang HY; Huang CJ; Shiao MS; Pan WH; Sung TY; Hsu WL Metabolite identification for mass spectrometry-based metabolomics using multiple types of correlated ion information. Anal. Chem. 2015, 87, 2143–2151. [DOI] [PubMed] [Google Scholar]
- 9.Broeckling CD; Ganna A; Layer M; Brown K; Sutton B; Ingelsson E; Peers G; Prenni JE Enabling Efficient and Confident Annotation of LC—MS Metabolomics Data through MS1 Spectrum and Time Prediction. Anal. Chem. 2016, 88, 9226–9234. [DOI] [PubMed] [Google Scholar]
- 10.Montenegro-Burke JR; Sutton JA; Rogers LM; Milne GL; McLean JA; Aronoff DM Lipid profiling of polarized human monocyte-derived macrophages. Prostaglandins Other Lipid Mediat. 2016, 127, 1–8. [DOI] [PMC free article] [PubMed] [Google Scholar]
- 11.Zamfir A; Peter-Katalinić J Capillary electrophoresis-mass spectrometry for glycoscreening in biomedical research. Electrophoresis 2004, 25, 1949–1963. [DOI] [PubMed] [Google Scholar]
- 12.Domingo-Almenara X; Brezmes J; Vinaixa M; Samino S; Ramirez N; Ramon-Krauel M; Lerin C; Díaz M; Ibáñez L; Correig X; Perera-Lluna A; Yanes O eRah: A Computational Tool Integrating Spectral Deconvolution and Alignment with Quantification and Identification of Metabolites in GC/MS-Based Metabolomics. Anal. Chem. 2016, 88, 9821–9829. [DOI] [PubMed] [Google Scholar]
- 13.Fenn JB Angew Chem Int Ed Engl. 2003, 42, 3871–3894. [DOI] [PubMed] [Google Scholar]
- 14.Guijas C et al. METLIN: A Technology Platform for Identifying Knowns and Unknowns. Anal. Chem. 2018, 90, 3156–3164. [DOI] [PMC free article] [PubMed] [Google Scholar]
- 15.Tautenhahn R; Patti GJ; Rinehart D; Siuzdak G XCMS Online: a web-based platform to process untargeted metabolomic data. Anal. Chem. 2012, 84, 5035–5039. [DOI] [PMC free article] [PubMed] [Google Scholar]
- 16.Kuhl C; Tautenhahn R; Bottcher C; Larson TR; Neumann S CAMERA: An integrated strategy for compound spectra extraction and annotation of LC/MS data sets. Anal. Chem. 2012, 84, 283–289. [DOI] [PMC free article] [PubMed] [Google Scholar]
- 17.Roux A; Xu Y; Heilier J-F; Olivier M-F; Ezan E; Tabet J-C; Junot C Annotation of the Human Adult Urinary Metabolome and Metabolite Identification Using Ultra High Performance Liquid Chromatography Coupled to a Linear Quadrupole Ion Trap-Orbitrap Mass Spectrometer. Anal. Chem. 2012, 84, 6429–6437. [DOI] [PubMed] [Google Scholar]
- 18.Ivanisevic J; Zhu Z-J; Plate L; Tautenhahn R; Chen S; O’Brien PJ; Johnson CH; Marietta MA; Patti GJ; Siuzdak G Toward ‘Omic Scale Metabolite Profiling: A Dual Separation–Mass Spectrometry Approach for Coverage of Lipid and Central Carbon Metabolism. Anal. Chem. 2013, 85 (14), 6876–6884. [DOI] [PMC free article] [PubMed] [Google Scholar]
- 19.Wachsmuth CJ, Vogl FC, Oefner PJ, Dettmer K Chromatographic Methods in Metabolomics. The Royal Society of Chemistry 2013. [Google Scholar]
- 20.Kind T; Fiehn O Metabolomic database annotations via query of elemental compositions: mass accuracy is insufficient even at less than 1 ppm. BMC Bioinf. 2006, 7, 234. [DOI] [PMC free article] [PubMed] [Google Scholar]
- 21.Sumner LW; Amberg A; Barrett D; Beale MH; Beger R; Daykin CA; Fan TW; Fiehn O; Goodacre R; Griffin JL; Hankemeier T; Hardy N; Harnly J; Higashi R; Kopka J; Lane AN; Lindon JC; Marriott P; Nicholls AW; Reily MD; Thaden JJ; Viant MR Proposed minimum reporting standards for chemical analysis Chemical Analysis Working Group (CAWG) Metabolomics Standards Initiative (MSI). Metabolomics 2007, 3,211–221. [DOI] [PMC free article] [PubMed] [Google Scholar]
- 22.Schrimpe-Rutledge AC; Codreanu SG; Sherrod SD McLean, J.A. Untargeted Metabolomics Strategies—Challenges and Emerging Directions. J. Am. Soc. Mass Spectrom. 2016, 27:1897. [DOI] [PMC free article] [PubMed] [Google Scholar]
- 23.Vinaixa M; Schymanski EL; Neumann S; Navarro M; Salek RM; Yanes O Mass spectral databases for LC/MS and GC/MS-based metabolomics: State of the field and future prospects. Trends Analyt. Chem. 2016, 78, 23–35. [Google Scholar]
- 24.Frainay C; Schymanski EL; Neumann S; Merlet B; Salek RM; Jourdan F; Yanes O Mind the Gap: Mapping Mass Spectral Databases in Genome-Scale Metabolic Networks Reveals Poorly Covered Areas. Metabolites 2018, 8, 51. [DOI] [PMC free article] [PubMed] [Google Scholar]
- 25.Blaženović I; Kind T; Ji J; Fiehn O Software Tools and Approaches for Compound Identification of LC-MS/MS Data in Metabolomics. Metabolites 2018, 8, 31. [DOI] [PMC free article] [PubMed] [Google Scholar]
Associated Data
This section collects any data citations, data availability statements, or supplementary materials included in this article.