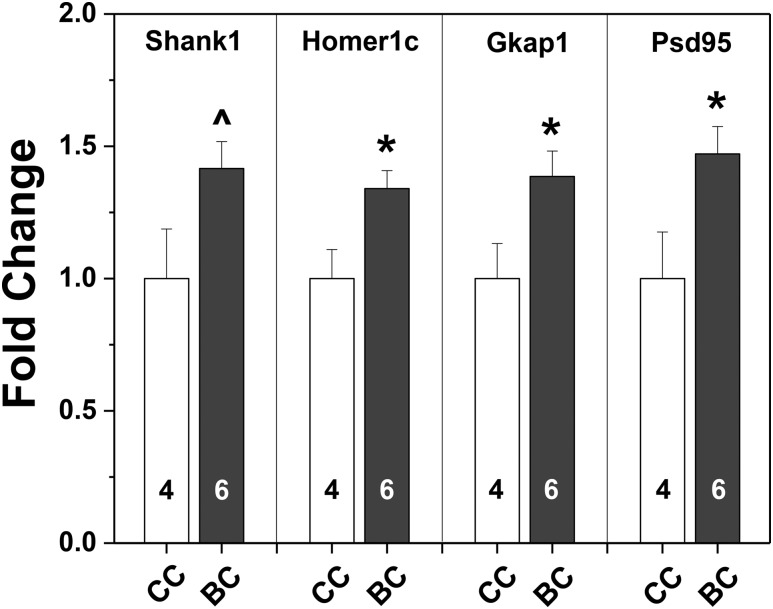
Figure 5.
Mean + SEM fold-changes in gene expression in the whole brains of F1 male mice collected on the day of birth (PN0) from control (CC white bars) or BPA-exposed dams (BC black bars). Control male data were set to 1.0. Numbers per group are given in the histograms. *Significantly different from controls (BC), P < 0.05. ^Significantly different from controls using one-tailed t test, P < 0.03.

