

Abstract
Objective:
This article describes an approach to a metrics-based evaluation of public space in hospitals using cross-disciplinary qualitative and quantitative analyses. The method, Indoor Public Space Measurement (IPSM), is well suited to researchers and designers who intend to evaluate user-centered spatial solutions in hospitals and similar facilities.
Background:
Healthcare is transiting toward a value-based policy at all levels. Choosing the right set of qualitative and quantitative analyses to support value-based design solutions is not always an easy journey for healthcare design consultants. This article seeks to pull together the key analyses to evaluate the impact of the hospital indoor public space on the psychosocial well-being of the hospital users.
Method:
A step-by step guide to performing key analyses to evaluate the impact of hospital indoor public space environment on the users’ psychosocial well-being is provided. A case study from the authors’ research is utilized to illustrate the application of the method.
Results:
Interpolating the results of all the analyses, the reader can identify where in the layout most of interactions among users occur, identify their typology and evaluate the contribution to the general psychosocial well-being, and know which group of users is more exposed to a specific typology of interaction.
Conclusions:
The IPSM method can help design consultants to measure the impact of the built environment of hospital public space on its occupants’ psychosocial well-being: factual knowledge about the users’ behavioral response with respect to wayfinding and social interaction. The application of the method is not limited to healthcare settings only.
Keywords: evidence-based design, healthcare design, behavioral analysis, spatial analysis, psychosocial, healthcare service design, public space system design, value-based healthcare
While payers are increasingly pushing healthcare systems to shift from a volume-based to a value-based healthcare service provision, hospital executives are having a difficult time in finding solutions that truly respond to the value-based vision. The challenge is to go beyond the overwhelmingly positive conceptual statements advanced by design practitioners but very rarely supported by metrics that validate the added value of the solution developed (World Economic Forum, 2017). Concepts need to be validated with metrics, otherwise from the perspective of hospital executives, it becomes difficult to justify the positive impact of proposed concepts. The difficulty with developing value-based solutions is, the way value is measured. When the impact to measure includes social issues, health science researchers tend to use qualitative measurement methods such as grounded theory, case study, narrative, phenomenological, ethnography, and qualitative description (Colorafi & Evans, 2016; Creswell, 2014). Social issues or experiential processes are based on complex interrelations of factors which for the majority are linked to the emotional sphere of the users: a domain which often reflects irrational beliefs. The use of quantitative statistical analysis methods may therefore be limited to understanding the complexity of the irrational interrelations that impact the emotional sphere of the users. For this reason, a mixed-method approach involving triangulation between qualitative and quantitative methods is considered to be the most complete measurement methodology. This strategy particularly applies to the measurement of the built environment’s impact on human behavior and social aspects.
Concepts need to be validated with metrics, otherwise from the perspective of hospital executives, it becomes difficult to justify the positive impact of proposed concepts.
In this article, we present a methodology to measure the impact of hospital indoor public spaces (IPSs) on the psychosocial well-being of hospital users. Hospital IPS are all those areas of the hospital’s ground floor which are subject to the highest and most diverse degree of public accessibility. IPS areas are the settings of public life within the hospital, meaning that they include all the aspects of social life and interaction which occur in public outside the medical context. The IPS engagement often includes interactions with arts exhibitions and multimedia stations, seating, walking, passive watching, grocery buying, and so on. The psychosocial well-being of hospital IPS users refers to the combined influence that the built environment has on the psychological and social well-being of the users. Wayfinding and social interaction are two of the most important parameters that impact psychosocial well-being in IPS (Devlin, 2014).
How can we evaluate the impact that the functional solution of the IPS environment has on the users’ psychosocial state? This article offers a complete step-by-step methodology to evaluate the impact of hospital IPS on wayfinding and social interactions of hospital users. Thus, it provides the analyst (a researcher or a designer) with important tools that will help him or her to drive solid insights concerning the built environment’s support for hospital users’ psychosocial well-being. The methodology consists of six-step analyses: (1) architectural functional analysis, (2) observational mapping, (3) evaluation of the visual quality and imageability potential, (4) user behavioral mapping, (5) space syntactical analysis: visibility and accessibility maps, and (6) psychometric survey. The intersection of the outcomes derived from each of the analyses leads to the elaboration of the final result. To illustrate the application of the indoor public space measurement (IPSM) method, the indoor public space of the University Medical Center of Groningen (UMCG) in the Netherlands has been utilized as case study. The groups of hospital users considered for the study are patients, visitors/family members, medical staff, and general support hospital staff.
How can we evaluate the impact that the functional solution of the IPS environment has on the users’ psychosocial state?
Architectural Functional Analysis
Architectural analysis is a mean to research the built environment and achieve a deep understanding of its qualities contributing to extract the underlying strategies of planning. The functional dimension represents the nerves of the system or “building.” Functions add content, meaning, and identity to a space. “Function expresses the purpose of a thing,” according to the definition of the Oxford dictionary (Function, n.d., para. 1). Adapting this definition to the architectural context of hospital IPS, we can say that function(s) express the purpose of a space or public space in our case. The functional dimension of an indoor public space should respond to the needs of the users who move within the built environment and where the functions themselves are ultimately allocated. To discover the system properties at the functional level, it is of crucial importance to reference to the system’s architectural model. Such a model helps us to trace back to the planning strategies adopted to structurally organize the functions in the layout, to have a glimpse about their dimensional program, and, lastly, to analyze the order of importance of each function among the others. Usually, the functional analysis is applied at the very beginning of the design process, during the concept development phase; however, as indicated in this article, it may also be applied retrospectively after the project execution to analyze the criticality of certain issues. To functionally analyze a healthcare public space system postconstruction, in the absence of a proper in-depth functional planning and programming documentation specifically addressing the public areas, the steps to follow are: (1) on-site observation, (2) mapping of the functions on the system’s architectural plan, (3) establishing a rating of importance scale of the functions, and (4) checking the eventual compliance with building codes (if any). Each of these steps is discussed in more detail in the following section.
The functional dimension represents the nerves of the system or “building.” Functions add content, meaning, and identity to a space.
On-Site Observation
This step familiarizes the researcher/designer with the type and quality of the built environment under analysis (Cyril, 2006). Walking through the public space to analyze and taking notes of each function which is associated to any sort of public life is the goal of this phase.
Mapping the Functions on the System’s Architectural Plan
This represents the next step. For this analysis, location and typological classification of the functions identified need to be listed and represented in the form of a graphical map overlapped to the original system’s architectural plan. To do so, the list of functions we have produced with the on-site observation phase need to be grouped into macro-categories such as main circulation routes, food and beverage (F&B) shops, vertical circulation/staircase/elevator, indoor gardens, clinical waiting areas, lobby and reception areas, clinical areas, and buffer/transition areas. Successively, it is useful to assign a different color to each of the categories to facilitate their identification on the system’s architectural plan. Plotting both macro-categories and assigned colors in a graphic legend, and noting the date in which the observation occurred, will facilitate the readability of the information reported in the plan and the identification of future functional layout changes that may occur over the time (see Figures 1 and 2).
Figure 1.

Architectural functional analysis (macro level).
Figure 2.

Architectural functional analysis (microlevel).
In order to get quantitative information of what has been mapped graphically, the functional mapping analysis needs to be complemented by a spreadsheet indicating the area measurements in square meters/feet of the internal gross floor area of each of the functions identified. This operation allows the collection of dimensional data that can be used to build further analytical insights about the relations (in proportions) between the areas dedicated to public life/space against the ones addressed to clinical services. Such a step in the analysis allows us to quantitatively evaluate the overall interest that the hospital management and the planners have dedicated to the support of users’ needs for public life within their facility.
Establishing a Rating Importance Scale of the Functions
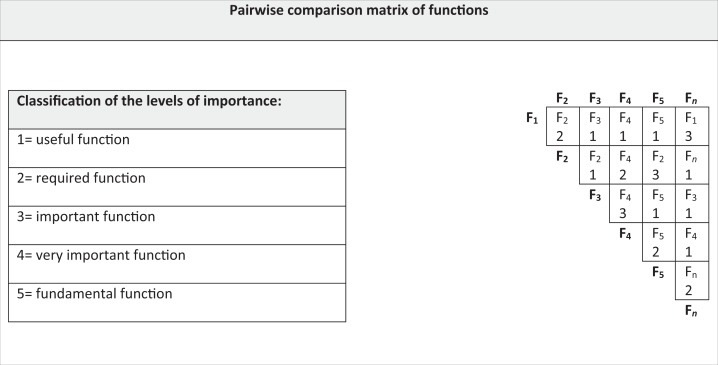
After the identification and typological classification of the functions, it may be useful to evaluate the level of importance of functions in relationship to each other and to the built environment context in which they are allocated. This objective can be accomplished with the elaboration of a rating scale based on the attribution of an importance score for each of the functions that have been previously identified. The model in Table 1 shows the scoring system for the classification of the functions. In the presence of a high number of functions to rate, it is suggested to opt for a pairwise comparison matrix analysis, which is a useful method for the evaluation of the functions compared with each other.
Table 1.
Pairwise Comparison Matrix of Functions.
|
In this matrix, the same list of functions is plotted both on the x and y axes. The interpolation of x and y coordinates identifies a slot where the name of the most important function between the two analyzed must be reported, followed by the associated importance score value. The selection of the scores should not be the results of a personal self-evaluation. Focus groups and short surveys are useful tools to avoid the subjectivity of the analyst in choosing the right score for a function. Reaching a statistical relevance of the answers is the ideal scenario to obtain. The sum of the values given to each function with the same name in the matrix allows one to organize the functions in order of importance. For instance, in the example described in Table 1, the final result is F4 (7), F2 (6), F5 (3), F1 (3), and F3 (2).
Based on this value-based list of functions, it is possible to proceed with further analysis of the functions depending on the needs of the investigator/designer. For example, integrating the values of the matrix above with parameters related to costs or risk, we could elaborate a cost and risk analysis of the functional domain.
Checking the Eventual Compliance with Building Codes
This step is undoubtedly a necessary step and helps in the understanding of both the functional plan and space program of the hospital IPS under analysis including any spatial requirements that have been respected, underestimated, or even violated.
Visual Experience Maps (VEM)
Photography, conceived as an analytical tool aimed at reporting the characteristics of the surrounding built environment, is among the most used methods in healthcare design research. VEM is a type of analysis that is based on infield observations. Photographs are a receptacle from which individual viewers deduce meaning (Schwartz, 1989). Thus, photographs are a powerful means of communication and reality detection. In the context of VEM analysis, photographs are viewed as records which represent the reality captured by the camera’s lens and provide an unmediated and unbiased visual report. Such an objective report, in our case, aims at providing a detailed sequence of visual impressions of the character of the site we are analyzing. The final goal should be the documentation of the visual experience that the average users have within the hospital indoor public space. As Gehl and Gemzøe (2000; Gehl & Rogers, 2010; Gehl and Koch, 2011; Gehl & Svarre, 2013) point out photographic analyses are frequently used to study public life and its complex articulation within public settings. In the case of healthcare public spaces, such as within large hospitals, this kind of analysis is often limited to the depiction of the site’s character rather than the interaction between the architectural context and the users’ public life. This situation occurs because of privacy restrictions in favor of hospital users and rules that impose the complete absence of any sort of users within the photographs. VEM analyses occur on-site, and its main components are detection of visual impressions via any device that allows one to capture photographs (i.e., mobile phones, cameras, etc.) and annotation of the self-impression of what has been captured. As a rule of thumb, all the photographs with their associated notes are given a number and organized in a progressive sequence in a folder. In order to link this documentation to the system’s architectural plan and facilitate its understanding, it is useful to highlight on the architectural plan the location of what the photograph has captured and the corresponding perspective cone of vision of the lens, making sure to report within each cone the appropriate number that recalls the corresponding photograph captured from that position (see Figure 3).
Figure 3.

Visual experience map example.
Evaluation of the Visual Quality and Imageability Potential
Several studies (Paivio, 1969, 1986; Paivio et al., 1968) define “imageability” as the ease with which a word gives rise to a sensory mental image. Adapting this concept to the architectural domain, we may refer to imageability as the ease with which a space gives rise to a sensory mental image. The way this process occurs leverages on the (typological) characters of the space and the symbolic/iconic power of the architectural and design elements hosted in the space. Such details impact at various levels of the user perception such as visual, auditory, olfactory, and tactile perceptions. User perception tends to organize in a systemic logical categorization the information captured from the surrounding physical space in the form of symbols and typological characters. The capability of capturing those inputs and their ease of “legibility” to the user perception is directly linked to the ease of generating sensory mental images in the users’ minds. A series of single mental images aggregated together, in a logical structure, form mental maps in the users’ mind. Such mental constructs directly impact space navigability and orientation, also known as wayfinding, and the associated psychological sense of space such as the feeling (i.e., stress or comfort) that the user develops when interacting with the surrounding environment. This process was well known to Kevin Lynch, who already in the 1960s elaborated the “theory of imageability of space,” arguing and proving that space recognition at urban scale relates to the organizational degree of legible street networks, connected by the nodes of squares, edges that mark out important places, facilitating wayfinding and identification (Lynch, 1960).
Many conceive large hospital complexes as “cities in a city,” designed and functionally structured as urban projects with corridor networks comparable to urban street networks, nodes generated by the intersection of corridors similar to urban squares or largos, and functional departmental divisions evoking city districts differentiation each with its own peculiarity. It is not difficult to establish a parallelism between the structure of a city and that of a large hospital (Lacanna & Wagenaar, 2018). It follows that the Lynch’s theory of imageability can be extended to the healthcare built environment. Its application acquires a particular importance in the analysis of the public spaces of hospital facilities because urban public spaces and hospital public spaces often have a very similar functional structure (Carmona, 2010). This is particularly true for large healthcare facilities. An easy-to-read environment is generated through easy-to-read symbols and architectonical typological characters: elements which should ultimately respond to a logical structure. A missing logical order of these elements induces perceptual confusion in the user or something that often leads to disorientation, which is recognized to be one of the most serious environmental stressors perceived by users in hospital settings (Ulrich et al., 1991). Thus, it is critically important to ensure the ease of legibility of such elements to generate a positive user perception of the surrounding space.
An easy-to-read environment is generated through easy-to-read symbols and architectonical typological characters: elements which should ultimately respond to a logical structure.
In this methodology article, the imageability analysis is limited to the visual perception of the average user of hospital IPS. The evaluation of the imageability potential of the hospital IPS should aim at mapping, researching, and evaluating the visual quality and the logical order of those architectural design elements characterizing the built environment of the IPS. For this analysis, the frameworks suggested by the Kevin Lynch’s imageability theory (paths, edges, districts, nodes, and landmarks) offer a good reference model for the categorization of the design elements identified in the layout (Lynch, 1960).
Paths
In hospital public spaces, paths recall corridors of different order. Primary paths are characterized by high-density users’ flows and generally with width ≥5.00 meters (mt); secondary paths are characterized by medium-density users’ flows and generally with width 2.40 ≤ mt ≤ 5.00; and tertiary paths are characterized by low-density users’ flows and generally with width ≤ 2.40 mt. Paths characterized by long distances tend to generate focal points such as central points of attraction and interest positioned along the line of sight of the user. It is important to identify these points in order to evaluate the correct position and impact of those architectural elements that may act as guiding reference landmarks.
Edges
Edges mark the boundaries between the public areas and the more private domain, such as the clinical and administrative zones. Typical examples are walls, other partition surfaces (homogeneous or not), and floors. These are all elements that with the strategic use of the design of their morphology and properties of materials can support the differentiation between different zones and functional domains of the hospital. When mapping the edges, we suggest to identify in the layout three major categories: (1) strong/solid, that is, solid walls, (2) soft/transparent walls such as glass or plexiglass partitions, and (3) elements of surface décor with relevant aesthetic value. It is possible that some elements identified in the layout belong to more than one category. A glass wall decorated with appealing laser-printed biophilic elements would be categorized as both soft/transparent edge and surface with relevant aesthetic value. Depending on the objectives of the investigator and the depth of his or her analysis, the categorization above suggested may be further extended.
Districts
Districts, better referred as “zones” in healthcare settings, respond to the macro departmental functional division in public, semipublic zones (the front office and waiting areas of policlinics), and private clinical/administrative zones (treatment areas). At the level of the public domain only, a further in-depth zoning analysis may be useful in order to immediately recognize areas such as F&B, retail and shopping, relax, spirituality and culture, and entertainment.
Nodes
Nodes are conceived as the portion of space generated by the intersection of two or more paths. They give birth to squares and “largos” or spaces that can be the ideal setting for collective activities.
Landmarks
Landmarks are the architectonical/artistic elements that with their level of aesthetic relevance and dimensional scale play a decisive role in creating the identity of the place where they are located. Landmarks can support wayfinding and can be of four types: dominant, positive, neutral, and negative.
Dominant Landmarks
Dominant landmarks positively contribute to give character to the place where they are located and play a crucial role both at the level of place identification and user perception. Dominant landmarks can be seen from long distances and are generally pieces of art, such as statues or fountains, and whose monumental and aesthetic impact associated to an overscaled size enhance the ease of space legibility and wayfinding experience of the users. Lastly, they may contribute to create positive memorable user experiences due to their capacity of stimulating human senses.
Positive Landmarks
Positive landmarks fulfill the same purposes of the “dominant” landmarks, but they differ in scale. Positive landmarks' sizes are much more modest, yet their aesthetic value makes them outstanding, positive landmarks help users find their way across a building.
Neutral Landmarks
Neutral landmarks are those landmarks that even though they are located at the right place, they do not make a strong impact in the area where they are located. Neutral landmark’s contribution to the identification of the surrounding area is quite mild, and some users realize their presence, while others do not. Their removal would not impact too much the cognitivity of the place or space.
Negative Landmarks
Negative landmarks are those which, due to their location (out of direct sight), size, lack of chromatic contrast, or sharp aesthetic value, are almost irrelevant for the support of the users’ readability of the space. Often users do not pay attention to them or do not even realize their presence. Figure 4 illustrates how the imageability analysis looks when applied to the layout of a hospital IPS setting.
Figure 4.

Imageability analysis map of hospital indoor public spaces.
Place-Centered Behavioral Mapping and Patterns of Use Analysis
How users make use of the space which surrounds them is heavily shaped by functional content and the organization of the functions in the layout. User’s behavior in a physical space is not always congruent with the purpose for which the space was designed. The behavioral patterns of use analysis is a powerful tool (Glenn, 2007) in understanding how healthcare IPSs are actually used by the users and how the space can better support their psychosocial well-being and positive experiences. At the final stage, the outcomes of the analysis need to be synthesized into a graphical map. The place-centered behavioral mapping analysis can generate different outputs depending on what user behaviors the researcher or designer considers relevant for the investigation.
How users make use of the space which surrounds them is heavily shaped by functional content and the organization of the functions in the layout.
Given that in hospital public spaces, user psychosocial well-being and positive experiences are linked to social interactions (type and quality) and stress levels associated to the ease of space readability and orientation (wayfinding), we consider appropriate to track in these spaces three categories of user interactions: (1) patient to patient, (2) patient to medical staff, and (3) patient to other hospital staff/person (Lee, Boltz, Lee, & Algase, 2017). Two types of actions are generally observed such as hand gestures and movements referring to the description of indications about the way to take and social interactions, such as engaging in simple talks and gestures of conviviality with other people.
. . . in hospital public spaces, user psychosocial well-being and positive experiences are linked to social interactions (type and quality) and stress levels associated to the ease of space readability and orientation . . .
The analysis process is divided into two branches. The first is conducted in the field and needs the researcher to be equipped with a click counter and a printed system’s architectural map. The system’s architectural drawing needs to be (earlier) divided into a series of small convex spaces in order to facilitate the computation of observations and the identification of correlations with the syntactical graphs of visibility and accessibility. Spatial analyses, as illustrated in the next paragraph, are also conducted based on a division of the spatial layout in convex spaces (Bafna, 2003). It is ideal that the same division of the spatial layout in convex spaces corresponds to both the place-centered behavioral analysis and the spatial syntactical analyses. The goal of the researcher is observing, computing, and noting on the architectural map all the user interactions (type by type) noticed within each of the convex spaces where the layout is divided, and proceeding until completion of all the convex spaces plotted on the system’s architectural drawing. The computation of the users’ interactions is performed with a click counter helping the researcher to check the number of interactions belonging to the same typology (patient to patient, patient to medical staff, and patient to other hospital staff/person). The researcher can also note on the map the position where the interaction took place for additional precision. It is advised to conduct the observations at regular time intervals during the day, ideally not less than 3 times per day (Grajewski & Vaughan, 2001). The number of days of observation depends on the number of interactions the investigator considers sufficient to achieve a statistical relevance of the observations’ outcomes. The scope should be to reach a sample of users who are representative of the entire population of hospital IPS’ users which may be challenging due to the strict regulations that hospital organizations may impose on the performance of external research in their premises. Therefore, a right balance should be found. It is also important that this type of analysis is unobtrusive, conducted from a distance, and not requiring user consent or any physical interaction with the user; otherwise, ethical protocol approvals may need to be obtained.
The map in Figure 5 illustrates the application of the place-centered behavioral analysis and is the result of 10 days of observations taking place at regular intervals of 4 hr from 08:00 to 19:00. The second branch of the analysis consists in organizing the data collected on-site and synthesizing the data graphically on a map, which reports the average and most occurring types of interactions and the average density of interactions for each of the convex spaces plotted on the system architectural drawing. Establishing a color-coded scale representing the density of interactions may be a useful representation method to facilitate the readability of the behavioral map. In Figure 5, six intervals of density have been identified and associated to different colors. The total computation of the interaction types observed is reported on a separate chart. The final output of the analysis will show the reader where most of the interactions are occurring in the IPS layout and to which typology they belong to (see Figure 5).
Figure 5.

Place-centered behavioral mapping of hospital indoor public spaces layout.
Space Syntactical Analysis: Visibility and Accessibility Maps
Creating a spatial configuration that responds to the highest standards of the design creativity, and making sure to balance it with the experience and knowledge collected over years of practice, is a common and good practice among experienced architects. To test the efficiency of their designed solutions, many rely on qualitative analyses which are often limited to self-developed survey questionnaires. However, researchers have also developed methods to quantitatively analyze the spatial configuration of an architectural layout with regard to the topological interconnectivity of each room, the users’ step depth, visibility, and space accessibility. The spatial configuration analysis, also known as space syntax, is often seen as a threat for the freedom of creativity of the design development process. Performing space syntax analyses helps to provide relevant metrics-based quantitative insights of the impact that the built environment has on a variety of users’ psychologic and physical responses such as users’ place cognitivity and perception, behavioral interactions, and people’s movement. The major space syntax analysis techniques are known as convex, axial, and isovist maps.
Convex Maps
Convex maps are mainly used to analyze the topological interconnectivity of each space/room of the layout. Convex mapping starts with a preliminary subdivision of the layout to analyze into a series of small convex spaces, each identified with a numbered node, and whose connections to other adjacent spaces is defined by an edge (Hillier & Hanson, 1984).
Axial Maps
Axial maps capture metrics that help to understand people’s physical movements within the layout to analyze the core metric, known as step depth, which describes the level of connectivity between all users’ lines of sight that pass through all the open spaces in the study area (Sadek & Shepley, 2016). Through the axial mapping process, it is possible to obtain a value that shows the level of integration of a certain space as compared to a couple or the entire system of spaces that make the layout under analysis. Axial mapping offers the opportunity of deducting further insights about the intelligibility of the entire system of spaces (Haq & Girotto, 2003).
Isovist Maps
Isovist maps provide insights about accessibility, visual connectivity, and integration based on measurements of the visual properties of the built environment. As first step, the analysis consists of laying on the 2-D computer-aided drawing (CAD/DWG) model a grid of regular square tiles, whose dimensions can be setup by the analyst, until arriving to simulate the average dimension of a human head; thus, each tile represents one user in the space.
The second step consists of running the computation of the interdependencies between the tiles that cover the entire layout of the system of spaces to analyze. The connectivity and integration values for each tile can then be calculated. This process can lead to two different outcomes depending on the height level to which the square tiles grid is applied at the user’s eye or knee-level.
In the first case, the outcome of the analysis generates a visibility graph. In this type of analysis, also known as visibility graph analysis (VGA), the only boundaries computed for the measurement of the tiles’ interrelationships are walls and full height partitions. The resulting color-coded diagram provides a measure of visual connectivity between tiles and associated spaces of the layout. In the second case, the physical boundaries computed also include furniture, and the results of the analysis provide insights about the accessibility of each space of the layout under analysis (Turner, Doxa, O’Sullivan, & Penn, 2001). In the IPSM method, to evaluate the impact of the hospital public spaces’ built environment on the users’ spatial orientation and space imageability, the VGA has been used at both the eye and knee-level, thus obtaining a color-coded map representing the distributed values of spatial accessibility and visual connectivity (see Figures 6 and 7).
Figure 6.

Spatial connectivity map of hospital indoor public spaces.
Figure 7.

Spatial accessibility map of hospital indoor public spaces.
Psychometric Tested Surveys
Once all the analyses illustrated in the previous paragraphs have been performed, the investigator has enough data to establish and evaluate associations between the hospital IPS users’ patterns of use and the characteristics of the surrounding built environment. To further strengthen the evaluation and validity of the associated deduced from the technical analyses, we suggest a final step to give the users an opportunity to discuss their perceptions of the issues identified in the hospital IPS. In order to accomplish this objective, the investigator should include open-ended questions in a survey questionnaire that will be submitted to the users. Given the difficulties in obtaining permission from the hospital management to interact with hospital users, the application of traditional qualitative methods, such as focus groups or interviews, is very challenging. The most viable way to obtain both users’ insights and measurements of the IPS spatial user perception is a survey questionnaire. This tool offers indeed the opportunity of getting quantitative data complemented by further qualitative data or vice versa. For the analysis of the IPS user perception, an adaptation of intervention mapping theory and methods (Bartholomew, Parcel, & Kok, 2001) might be particularly indicated. A first step would be to link barriers and facilitators to space use found in earlier stages to concrete behaviors (based on quantitative analyses) and deriving objectives for quality improvement (based on qualitative analyses). This process could be used as an opportunity to reframe both problem behaviors and positive experiences found in earlier stages into desirable behaviors in practice or performance objectives. The content of the survey questionnaire must be based on psychometrically validated measures. Self-developed questionnaires must be avoided. However, the investigator can always identify novel, yet no validated, measures in the existing literature and proceed to validate scores on those measures prior to its further use into a questionnaire. This strategy aims at validating, problematizing, or invalidating the correlations that have been deduced as consequence of the interpolation of the outcomes of the previous technical analyses. In addition to being psychometrically validated, the questionnaire should be randomly assigned to representative sampling of the hospital IPS users’ population. Not complying with these rules will compromise the outcomes of the survey.
The content of the survey questionnaire must be based on psychometrically validated measures. Self-developed questionnaires must be avoided.
Additionally, the survey project (including the use of a survey design and the items included in the survey) should always be approved by the relevant Ethics Committee: typically, the Ethics Committee internal to the hospital. Survey research is considered as an excellent method to capture people’s thoughts, feelings, and perceptions (Shaughnessy, Zechmeister, & Jeanne, 2011) through a set of predetermined questions that is given to a sample of the population to assess (in this case, the users of hospital public space). By computing the results of a survey questionnaire administered to a random sample representative of wider hospital public space user populations of the same country, it is possible to drive conclusions that can be extended to the entire population of users of that hospital. Some generalizability may apply to other hospitals with similar characteristics. Recent studies (Lacanna, 2018) report the need for healthcare design researchers to use psychometric surveys in their research studies. This approach directly impacts the significance and extended applicability of the research outcomes. Valid and reliable scores on measures indicate that the survey correctly measures what intends to measure in a given population and confirms that the constructs being considered are valid and reliable. These last two aspects play a decisive role for the credibility of a survey questionnaire. While reliability measures the degree of results’ consistency in reiterative applications of the survey questionnaire, validity ensures that the survey and its questions correctly address the survey concept of interest and the results that the researcher wants to achieve (Terhorst, Leach, Bussières, Evans, & Schneider, 2016).
Previous experiences of the authors in designing surveys in the Dutch healthcare facilities context suggest not to exceed the total amount of five questions per questionnaire; plus, three basic demographic questions such as gender, age, and typology of user group (patient, family, medical/clinical staff, and nonmedical/clinical staff). This recommendation is based upon several confrontations with different hospital Ethics Committees in the Netherlands. Although it is always required to keep the questionnaire as short and concise as possible, in other countries, the number of questions allowed by the relevant Ethics Committees may be less stringent. The questions of the survey questionnaire should aim at measuring (1) the perception of support that the surrounding hospital public space built environment provides for ease of wayfinding and overall building navigability, (2) the importance for the users of feeling empowered of their own actions and not interrupting the continuity with daily activities outside the hospital (leisure and daily routines), and (3) the overall user satisfaction of the surrounding built environment. Lastly, it is highly recommended to avoid “yes–no” questions in the questionnaire. This will depend on the question being asked and whether a validated measure is being used. Sometimes, validated measures use dichotomous response scales. In the IPS case, the adoption of a scaling system to quantitatively evaluate the responses, typically a Likert-type scale response system, is preferred. This system provides a deeper understanding of the issues associated to each of the questions asked, and it provides concrete quantitative data for the measurement of the response.
Conclusions
To evaluate and understand how the built environment impacts the psychosocial well-being of the occupants of a hospital IPS, healthcare design researchers and practitioners cannot solely rely on functional analyses and observations of the designed space. The same can be said for psychometric surveys and behavioral analysis. In both cases, a selective choice of the analysis method would limit the outcomes to either the psychological or architectural domain. A methodology that includes a set of analyses rooted in both the architectural design and the psychosocial sector is considered to give a more complete evaluation of the impact of the built environment that we want to measure. In order to elaborate the final conclusions, it is necessary to overlap the results obtained from each of the analyses performed.
For the explanation of the IPSM method, the indoor public spaces of the UMCG in the Netherlands have been used as a case study. The psychometric survey that emerged for hospital’s IPS users is quite important. The survey results indicated the users wanted to be able to engage in a conversation and be surrounded by a social environment while being in a hospital, to maintain a sort of continuity with the normal daily life conducted outside the hospital, and to easily understand the routes to follow to reach their destination within the hospital or ease of wayfinding. Looking at the results of the other analyses, it emerged that where the density of interactions among users was higher (see behavioral map), the built environment offered opportunities for social engagement (see functional analysis) in areas such as the coffee shop, a lounge area, or space for exhibition. Furthermore, comparing the behavioral map with both the functional analysis and the imageability map, it emerged that the functions supporting social interaction were located in a central and more visible position corresponding to those areas where the intensity of social interactions was higher. The high visual accessibility of the identified key functional areas was also confirmed by the outcomes of the space syntactical visual analysis. These elaborations led to the inference that if healthcare planners want to achieve a high degree of social interaction among hospital users, they must not only provide an appropriate variety of functional solution that foster social interaction. It is crucial to also consider the position where the functions will be allocated and the compliance with a proper organizational structure which strategically supports clear visibility and physical accessibility. Locating, a potentially good function out of the users’ way of sight, may mean underusage resulting in loss of financial revenue such as lack of use of the coffee shop or sales in the retail store.
It is crucial to also consider the position where the functions will be allocated and the compliance with a proper organizational structure which strategically supports clear visibility and physical accessibility.
A similar process can be applied to evaluate the ease of wayfinding. Concerning the structural organization of the functions, the UMCG’s hospital IPS layout is very much in line with the imageability theoretical framework. The outcomes of the psychometric survey, field observations, and behavioral map reveal that hospital users recognized the importance of the built environment on their perception of wayfinding, the users in this hospital tended to ask less for directions to reach their destinations. Considering this information, the layout’s conformity to the imageability framework, its high degree of syntactical physical and visual accessibility, and the provision of a variety of diverse design elements used to differentiate areas in the IPS layout, the overall design solution of the UMCG’s IPS can be evaluated as positively impacting the ease of wayfinding of the users. Reaching these conclusions, we can look back at the UMCG’s functional plan, space program, and its structural organization in the layout and extrapolate valuable insights that can be applied as quality standards for future hospital IPS projects where the impact on the users’ psychosocial well-being and wayfinding is considered as a central focus.
The set of analyses described in this article as part of the IPSM method serves to introduce the analyst (a researcher or a designer) to methods for spatial and place-centered behavioral analysis, which when combined together lead to a more reliable data-based evaluation about the impact of the built environment on occupants’ behavior. Thus, it promotes the adoption of an evidence-based design (EBD) approach to the design of healthcare facilities. The EBD approach remains close to concrete data while moving from a theoretical intuitive framework. Such an approach avoids arbitrary evaluations and weak high-inference evaluation techniques about the impact of the built environment on its users. Instead, it addresses the complexity of a dialogic relationship between the application of an intuitive theoretical framework to hospital IPS planning and the adoption of more rigid scientific analyses at both spatial and behavioral level. The practical step-by-step nature of this methodology article should serve as a reference guide to researchers and designers interested in developing and evaluating evidence-based spatial solutions supporting users’ psychosocial well-being in, and not only, healthcare IPS settings.
Implications for Practice
The IPSM offers a useful tool to evaluate the psychosocial impact of hospital IPS on its users.
The IPSM can be applied also to other public space contexts, where the psychosocial dimension of the users is considered relevant.
The IPSM method can be applied during the planning phase of facility design or for postconstruction evaluations.
- Healthcare designers and researchers can assess and measure the impact hospital’s or healthcare facility’s IPS on
- users psychosocially supportive functional solutions,
- space intelligibility and support of wayfinding,
- promotion of a deinstitutionalized character of hospital IPS that builds continuity with the daily routines users have outside the healthcare settings,
- patterns of spatial use, and
- efficiency of functional solutions that support social interaction among users.
Footnotes
Declaration of Conflicting Interests: The authors declared no potential conflicts of interest with respect to the research, authorship, and/or publication of this article.
Funding: The authors received no financial support for the research, authorship, and/or publication of this article.
References
- Bafna S. (2003). Space syntax: A brief introduction to its logic and analytical techniques. Health Environments Research & Design Journal, 35(1), 17–29. [Google Scholar]
- Bartholomew L. K., Parcel G. S., Kok G. (2001). Intervention mapping designing theory and evidence-based promotion programs. Mountain View, CA: Mayfield. [Google Scholar]
- Carmona M. (2010). Public places, urban spaces: The dimensions of urban design (2nd ed). Oxford, England: Architectural Press/Elsevier. [Google Scholar]
- Cyril M. H. (2006). Dictionary of architecture and construction (4th ed). New York, NY: McGraw-Hill. [Google Scholar]
- Colorafi K. J., Evans B. (2016). Qualitative descriptive methods in health science research. Health Environments Research & Design Journal, 9(4), 16–25. [DOI] [PMC free article] [PubMed] [Google Scholar]
- Creswell J. W. (2014). Research design: Qualitative, quantitative and mixed methods approaches (4th ed). Thousand Oaks, CA: Sage. [Google Scholar]
- Devlin A. S. (2014). Wayfinding in healthcare facilities: Contributions from environmental psychology. Behavioral Sciences, 4(4), 423–436. [DOI] [PMC free article] [PubMed] [Google Scholar]
- Function. (n.d). In Oxford English Dictionary. Retrieved from https://en.oxforddictionaries.com/definition/function
- Gehl J., Gemzøe L. (2000). New city spaces. Copenhagen, Denmark: Danish Architectural Press. [Google Scholar]
- Gehl J., Koch J. (2011). Life between buildings: Using public space. Washington, DC: Island Press. [Google Scholar]
- Gehl J., Rogers R. (2010). Cities for people. Washington, DC: Island Press. [Google Scholar]
- Gehl J., Svarre B. (2013). How to study public life. Washington, DC: Island Press. [Google Scholar]
- Glenn R. (2007). Bringing user experience to healthcare improvement: The concepts, methods and practices of experience-based design. London, England: Radcliffe. [Google Scholar]
- Grajewski T., Vaughan L. (2001). Space syntax observation manual. London, England: UCL Press. [Google Scholar]
- Haq S., Girotto S. (2003). Ability and intelligibility: Wayfinding and environmental cognition in the designed environment. Space Syntax 4th Symposium, University College, London. [Google Scholar]
- Hillier B., Hanson J. (1984). The social logic of space. Cambridge, England: Cambridge University Press. [Google Scholar]
- Lacanna G. (2018). Commentary on Jeffrey Voigt et al.’s article, “private rooms in low acuity settings: A systematic review of literature.” Health Environments Research and Design Journal, 11(1), 78–81. [DOI] [PMC free article] [PubMed] [Google Scholar]
- Lacanna G., Wagenaar C. (2018). Public spaces in and around the hospital: Streets, squares, patios, waiting areas, healing gardens: A design manual In Cor W., Mens N. (Eds.), Hospitals: A design manual. Basel, Switzerland: Birkhäuser. [Google Scholar]
- Lee K. H., Boltz M., Lee H., Algase D. L. (2017). Does social interaction matter psychosocial well-being in persons with Dementia? American Journal of Alzheimer’s Disease & Other Dementias, 32(4), 207–212. [DOI] [PMC free article] [PubMed] [Google Scholar]
- Lynch K. (1960). The image of the city. Cambridge, England: Harvard University Press. [Google Scholar]
- Paivio, (1969). Mental imagery in associative learning and memory. Psychological Review, 76(3), 241–263. [Google Scholar]
- Paivio, (1986). Mental representations: A dual coding approach. New York, NY: Oxford. [Google Scholar]
- Paivio A., Yuille J. C., Madigan S. A. (1968). Concreteness, imagery, and meaningfulness values for 925 nouns. Journal of Experimental Psychology, 76(1, Pt. 2), 1–25. [DOI] [PubMed] [Google Scholar]
- Sadek A. H., Shepley M. M. (2016). Space syntax analysis: Tools for augmenting the precision of healthcare facility spatial analysis. Health Environments Research & Design Journal, 10(1), 114–129. [DOI] [PubMed] [Google Scholar]
- Schwartz D. (1989). Visual ethnography: Using photography in qualitative research. Qualitative Sociology, 12(3), 119–154. [Google Scholar]
- Shaughnessy J., Zechmeister E., Jeanne Z. (2011). Research methods in psychology (9th ed, pp. 161–175). New York, NY: McGraw-Hill. [Google Scholar]
- Terhorst L., Leach M., Bussières A., Evans R., Schneider M. J. (2016). Evaluating the psychometric properties of the evidence-based practice attitude and utilization survey. Journal of Alternative and Complementary Medicine, 22(4), 328–335. [DOI] [PMC free article] [PubMed] [Google Scholar]
- Turner A., Doxa M., O’Sullivan D., Penn A. (2001). From isovists to visibility graphs: A methodology for the analysis of architectural space. Environment and Planning B: Urban Analytics and City Science, 28(1), 103–121. [Google Scholar]
- Ulrich R. S., Simons R. F., Losito B. D., Fiorito E., Miles M. A., Zelson M. (1991). Stress recovery during exposure to natural and urban environments. Journal of Environmental Psychology, 11(3), 201–230. [Google Scholar]
- World Economic Forum. (2017). Value in healthcare: Laying the foundation for health system transformation. Report. Retrieved from https://www.weforum.org/reports/value-in-healthcare-laying-the-foundation-for-health-system-transformation