

Abstract
Frequently, the number of circulating tumor cells (CTC) isolated in 7.5 mL of blood is too small to reliably determine tumor heterogeneity and to be representative as a “liquid biopsy”. In the EU FP7 program CTCTrap, we aimed to validate and optimize the recently introduced Diagnostic LeukApheresis (DLA) to screen liters of blood. Here we present the results obtained from 34 metastatic cancer patients subjected to DLA in the participating institutions. About 7.5 mL blood processed with CellSearch® was used as “gold standard” reference. DLAs were obtained from 22 metastatic prostate and 12 metastatic breast cancer patients at four different institutions without any noticeable side effects. DLA samples were prepared and processed with different analysis techniques. Processing DLA using CellSearch resulted in a 0–32 fold increase in CTC yield compared to processing 7.5 mL blood. Filtration of DLA through 5 μm pores microsieves was accompanied by large CTC losses. Leukocyte depletion of 18 mL followed by CellSearch yielded an increase of the number of CTC but a relative decrease in yield (37%) versus CellSearch DLA. In four out of seven patients with 0 CTC detected in 7.5 mL of blood, CTC were detected in DLA (range 1–4 CTC). The CTC obtained through DLA enables molecular characterization of the tumor. CTC enrichment technologies however still need to be improved to isolate all the CTC present in the DLA.
Keywords: circulating tumor cells, liquid biopsy, CellSearch, diagnostic leukapheresis, filtration
Short abstract
What's new?
Circulating tumor cells (CTC) can mirror tumor heterogeneity but a standard blood sample (7.5 mL) is too small to truly represent the tumor. To increase the yield of CTC, the authors used Diagnostic LeukApheresis in which liters of blood are screened for the presence of CTC in metastatic cancer patients. They report a significant increase in CTC yield and consequently, a better molecular characterization of the tumor, encouraging further research into the use of leukapheresis as “liquid biopsy” in cancer patients.
Abbreviations
- CTC
circulating tumor cells
- DLA
diagnostic leukapheresis
- MNC
mononuclear cells
- RT
room temperature
- SOP
standard operating procedure
- WBC
white blood cells
INTRODUCTION
The presence of circulating tumor cells (CTC) in blood is associated with poor prognosis in patients with metastatic and nonmetastatic disease.1, 2, 3, 4, 5, 6, 7 The numbers of CTC isolated in 7.5 mL of blood are frequently too low to obtain a “liquid biopsy” representative for the tumor, determine tumor heterogeneity and assess the optimal treatment strategy. Extrapolation of the CTC frequency distribution in 7.5 mL of blood from patients with metastatic breast, colon and prostate cancer showed that, probably, all these patients had tumor cells in circulation, but the sample volume was not sufficient to detect them in all patients.8 In recent years, numerous assays to detect CTC have been described. EpCAM‐based technologies have offered requisites of robustness, reproducibility and cost effectiveness, providing the first in vitro diagnostic CTC assay. However, one of the major drawbacks in the use of CTC for the selection of personalized therapies in individual patients is that CTC are rare events. It was calculated that at a level of 1000 in vivo CTC, there is a probability of 95% that at least one CTC will be detected in 1 out of 5 samples of 7.5 mL of blood with the current technologies; below this tumor burden the accuracy of the detection at a time point is limited by the blood volume that can be obtained from a patient.9, 10 One solution to overcome this problem is the use of leukapheresis to obtain the mononuclear cell (MNC) fraction believed to contain the majority of CTC from liters of blood. This procedure introduced by Fisher et al.11 was baptized diagnostic leukapheresis (DLA). The concept and feasibility of DLA was demonstrated by processing a small aliquot (~5%) of the DLA using the CellSearch® system, which represents the current gold standard for CTC detection. Our first aim was to validate the use of DLA for isolation of CTC in metastatic breast and prostate cancer within the EU FP7 program CTCTrap at multiple centers. Then, we evaluated different technologies to increase the percentage of the DLA that could be processed for the isolation of CTC.
PATIENTS AND METHODS
Patients
Twelve patients with metastatic breast cancer were enrolled in the study at the University Hospital of Duesseldorf and 22 patients with castration resistant prostate cancer; two at the University hospital of Padova, seven at the Institute Gustave Roussy and 13 at the Royal Marsden hospital. All patients provided written informed consent and the study was approved by the institutional review boards at each participating center.
Diagnostic leukapheresis procedure
Leukapheresis were performed at the clinics in Padua, Villejuif, Duesseldorf and Sutton using the Spectra Optia® (Terumo BCT Inc., Lakewood, CO) according to manufacturer's instructions. For DLA, the program of the apheresis device was set to the MNC collection procedure and set at a collection flow rate of 1.0 mL/min. Concurrent plasma collection was set to a volume of 0 mL. The objective was to collect a minimum volume of 40 mL DLA that was reached in approximately 90 min.
Post DLA sample handling
Samples were divided into aliquots immediately after the DLA procedure, under sterile conditions. White blood cell (WBC) counts and MNC counts were determined using an automated flow‐cytometric based hematology analyzer. For CellSearch® analysis an aliquot of the DLA product containing 2 × 10⁸ WBC was diluted to a final volume of 8 mL with CellSearch Circulating Tumor Cell Kit Dilution Buffer (Menarini Silicon Biosystems, Huntingdon Valley, PA) stored at room temperature (RT) and transferred into a CellSave® tube containing CellSave preservative reagent (Menarini). For direct filtration 50 × 106 WBCs were diluted in 7.5 mL dilution buffer and then transferred into a CellSave tube. For RosetteSep™ (Stemcell Technologies, Vancouver, Canada) 18 mL of DLA product was transferred to a 50 mL tube and CellSave preservative reagent from two CellSave tubes was added to the tube. All tubes were kept at RT, at least overnight, until analysis.
CellSearch sample processing
CellSave whole blood was run with CellSearch using the CTC kit (Menarini) according to manufacturer's instructions. For the DLA product, containing 2 × 10⁸ WBC, the sample was processed using the CellTracks Autoprep system using the CTC kit. The cartridge from the DLA product was scanned, using the CellTracks analyzer II.
Filtration
For filtration, 50 × 106 WBC diluted in CellSearch dilution buffer was filtered using a pump and filtration unit including a microsieve with 5 μm pores (VyCAP B.V., Deventer, The Netherlands). The sample was loaded onto the microsieve and a −100 mbar pressure was applied. Filtration was continued until the entire sample passed the microsieve, or for a duration of maximum 10 min. The successfully filtered sample volume was recorded and used to calculate recoveries. After filtration, the microsieve was removed from the filtration unit and was washed once with a PBS/1% BSA/0.15% Saponin solution. A permeabilization buffer, containing PBS/1% BSA/0.15% Saponin, was added onto the microsieve and was incubated for 15 min at room temperature. Subsequently, a staining solution was added containing anti‐CD45‐PerCP (Life Technologies, MHCD4531, clone HI30) at a final concentration of 4 μg/mL and anti‐CKpan‐NanoParticles 575 (AcZon, clone C11 and AE1/AE3) at a final concentration of 3.5 μg/mL in PBS/1% BSA/0.05% Saponin. Staining was performed for 15 min at 37 °C. After removal of the staining cocktail, the microsieve was washed twice using PBS/BSA 1%. The sample was then fixed using PBS/formaldehyde 1% (Sigma, St. Louis, MO) for 10 min at room temperature. Removal of the fluid during each of the staining and washing steps was done using a staining holder including a disposable sponge (VyCAP B.V.). Finally, the sieve was mounted using ProLong® Diamond Antifade Mountant with DAPI (ThermoFisher, Carlsblad, CA, P36971) and a custom cut coverslip (2 × 0.85 cm2 custom cut, thickness #1 0.13–0.16 mm) was added to the filter (Menzel‐Gläser, Braunschweig, Germany).
Leukocyte depletion
Eighteen milliliters of DLA was depleted from unwanted white blood cell populations using the RosetteSep CTC Enrichment Cocktail Containing Anti‐CD36 (Stemcell Technologies, Catalog# 15167). First erythrocytes were isolated by centrifugation of two 9 mL EDTA blood tubes from each patient at 800×g for 10 min. The plasma and buffy coat were then removed and the erythrocytes from both tubes were pooled. Erythrocytes were then added to the DLA product to reach a final WBC to erythrocyte ratio of 1:40. Fifty microliters of the RosetteSep cocktail was then added for each 1 mL of sample and incubated for 20 min at RT. After incubation, the sample was diluted with an equal volume of PBS/2% FBS. The solution was then carefully layered on top of a Ficoll‐Paque PLUS density gradient (GE Healthcare, Chalfont St. Giles, UK) and centrifuged at 1200×g for 20 min at RT without brake. The enriched cells where then collected and washed by adding two volumes of PBS/2% FBS and centrifuging for 8 min at 300×g. For filtration, cells were resuspended in 9 mL of 1× PBS and filtered through a 5 μm microsieve (VyCAP BV) at −100 mbar. Staining of the microsieves was performed as described above. For CellSearch analysis after leukocyte depletion 9 mL of sample was transferred to a conical tube and CellSearch dilution buffer was added to a final volume of 14 mL. This sample was then processed as control within the CellTracks Autoprep system using the CTC kit.
Scanning
All CellSearch cartridges, with enriched CTC, were scanned using the CellTracks Analyzer II (Menarini). All microsieves were scanned using an automated fluorescence microscope available at each site. Each system should match the minimal requirements of having 10 times objective with a minimal numerical aperture of 0.45. In addition, the following filters for fluorescence detection were used: DAPI with excitation 377/50 nm, dichroic 409 nm LP, emission 409 nm LP (Spectra Physics Newport, Santa Clara, CA), PE with excitation 543/22 nm, dichroic 562 nm LP, emission 593/40 nm (Spectra Physics Newport, Santa Clara, CA) and PerCP with excitation 435/40 nm, dichroic 510 nm LP, emission 676/29 nm (Spectra Physics Newport, Santa Clara, CA).
Image analysis
CellSearch fluorescence images were analyzed according to manufacturer's instructions. The fluorescent images from the microsieves were analyzed using the open‐source software ICY.12 Operators were asked to annotate every DAPI+, CK+, CD45− event. In addition, raw images of both cartridges and microsieves were analyzed by the open source imaging program ACCEPT.13, 14, 15 The total number of nucleated events was determined to investigate the number of leukocytes present in the background during image analysis. To improve the detection of nucleated events even in images with crowded areas or images with background artifacts, we applied a high‐pass Fourier filter to remove the background beforehand. This feature can be used in future versions of ACCEPT to improve image analysis results.
Statistical analysis
Statistical analysis was performed using OriginPro 9.1 (OriginLab Corporation, Northampton, MA) using the paired sample t‐test.
RESULTS
CTC in 7.5 mL of blood versus 200 × 106 cells (~5%) of DLA product
DLAs were obtained from 22 metastatic prostate cancer patients and 12 metastatic breast cancer patients at four different European academic medical institutions. Before starting the DLA procedure, 7.5 mL of whole blood was drawn and processed with the “gold standard” reference CellSearch® to obtain the CTC counts from whole blood. DLA samples were processed through the analysis techniques shown in Figure 1 and described in detail in the Standard Operating Procedures (SOP) developed for DLA in the CTCTrap consortium (https://www.utwente.nl/tnw/mcbp/protocolsandtools/).
Figure 1.
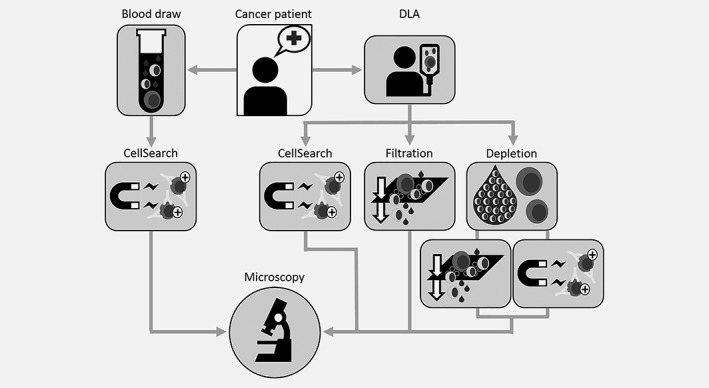
Sample workflow. Metastatic cancer patients have undergone DLA for about 90 min. Additionally 7.5 mL whole blood was collected in CellSave tubes. Blood was processed with CellSearch to obtain a CTC count from whole blood. DLA was aliquoted for several analysis technnologies. About 200 × 106 cells were processed with CellSearch, 50 × 106 cells were analyzed using filtration, 18 mL of DLA product was depleted of leukocytes and then divided into two aliquots to further enrich CTC by filtration or CellSearch. All samples were analyzed for the presence of CTC by fluorescence microscopy.
In short, 200 × 106 MNC of the DLA product (on average 3.7 mL) were analyzed using CellSearch, 50 × 106 cells were analyzed using filtration and 18 mL of the DLA product was depleted of its white blood cells, allowing analysis of a larger part of the DLA product, followed by CTC enumeration by either filtration or CellSearch.
DLAs from metastatic cancer patients were performed for ~90 min without any noticeable side effects. DLA products had an average volume of 53 mL (range 21–98 mL, SD 16 mL) containing an average of 3.3 × 10⁹ (range 1.5 × 10⁷–9.0 × 10⁹; SD 2.0 × 10⁹) MNC representing ~1.6 L (range 0.03–3.5 L, SD 0.7 L) of blood. Figure 2a illustrates the concentration of MNC per mL of whole blood and DLA product. The average MNC count in whole blood was 2.0 × 10⁶/mL (range 0.3 × 10⁶/mL–4.3 × 106/mL, SD = 0.9 × 10⁶/mL) and in DLA product 64.0 × 10⁶/mL (range 0.4 × 10⁶/mL–164.3 × 106/mL, SD = 36.8 × 10⁶/mL). In Figure 2b, the ratio of the concentration of MNC in DLA to MNC in blood is shown.
Figure 2.
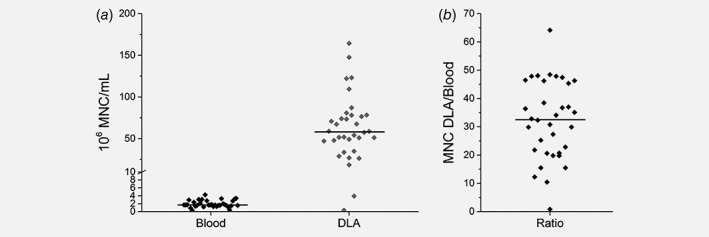
(a) MNC counts per mL blood and per mL of DLA from 34 metastatic cancer patients. The horizontal line represents the median. (b) Ratio dot plot showing the ratio of concentration MNC in DLA to MNC in blood, horizontal line is representing the median ratio.
The number of CTC in 7.5 mL of blood ranged from 0 to 324 (mean 67, median 18) and CTC in DLA ranged from 0 to 2913 (mean 362, median 160) resulting in a significant increase in CTC yield (p = 0.003). The increase in CTC yield ranged from 0× to 32× (mean 6, median 5). The analyzed DLA volume represented 7– 212 mL of blood (mean 98, median 97). In Figure 3, the absolute number of CTC in 7.5 mL of peripheral blood and in 200 × 106 MNC of the DLA product measured by CellSearch is illustrated for each patient. Extrapolation of the number of CTC obtained when the complete DLA volume could have been processed with CellSearch for each patient is also shown in the figure. The complete DLA volume represented 7–212 mL of blood (mean 98, median 97). The entire DLA product would comprise 0–9037 CTC (mean 3304, median 2873) or a 0× to 417× increase (mean 104, median 77) compared to 7.5 mL of blood.
Figure 3.

Absolute CTC counts in 7.5 mL of blood, 200 × 106 cells of DLA product processed by CellSearch and the CTC count in the total DLA product by extrapolation of the DLA CTC counts, lines connect measurements from the same patient.
CTC in 2–18 mL (~5–45%) of DLA product
The identification of CTC within enriched cell suspensions becomes increasingly more difficult when the number of leukocytes are so large that they are in close proximity to each other. In Figure 4a, representative microscopic images are shown after processing blood by CellSearch (Fig. 4a1), after processing DLA with CellSearch (Fig. 4a2), after filtration of DLA (Fig. 4a3) and after depletion of leukocytes in DLA product followed by either filtration (Fig. 4a4) or CellSearch (Fig. 4a5). From the images, it is clear that identification of CTC in DLA product directly processed by CellSearch or filtration is more difficult because of the larger background of leukocytes. To quantify the number of nucleated cells in the images, we used the open source imaging program ACCEPT. Gates were set to find all nucleated events by looking at the mean intensity of the DAPI signal and gates for the perimeter and eccentricity were set to identify cell like morphologies.16, 17, 18 The gate used to define nucleated cells was a DNA mean intensity >5, a DNA perimeter >16 and a DNA eccentricity ≤0.95. The average number and standard deviation of nucleated cells present after isolation are shown in the top left part of the image. Blood volumes of 7.5 mL processed with CellSearch had on average 27,513 nucleated events in the background (SD = 6,716; n = 7), DLA products processed with CellSearch had 50,778 nucleated events (SD = 40,486; n = 8), directly filtered DLA exhibited 88,142 nucleated events (SD = 13,338; n = 8), DLAs depleted followed by filtration had 11,929 nucleated events (SD = 3,337; n = 8) and DLAs depleted followed by CellSearch 3702 nucleated events (SD = 1,729; n = 5). The number of CTCs in samples with more than 100,000 WBC in the background is most likely underestimated as they may be obscured by leukocytes. To illustrate the similarities between the morphological characteristics of CTC in blood and DLA, a gallery of images from four patients is shown in Figure 4b.
Figure 4.
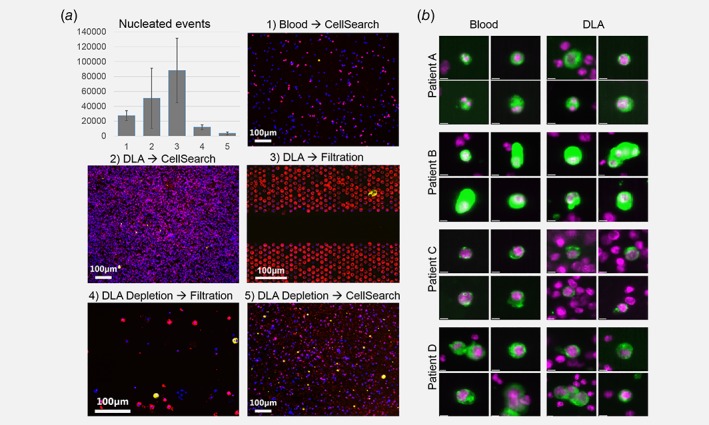
(a) Typical microscopic images obtained after CTC enrichment and detection with the different techniques. Top left, the average number of nucleated cells in the enriched CTC samples assessed by ACCEPT. (b) CellSearch images from CTC detected in both blood and DLA from four patients. Cells show similar morphological characteristics (nucleus = purple, cytokeratin = green) [Color figure can be viewed at wileyonlinelibrary.com]
Filtration of 50 × 106 MNC from the DLA in 7.5 mL of buffer, through 5 μm‐pores microsieves yielded only 0–12 CTC (mean = 2, median = 0, n = 16). Leukocyte depletion of 18 mL of DLA product followed by filtration yielded 0– 178 CTC (mean 40, median 4, n = 22) not yielding a relative increase compared to analysis of 2 mL DLA product in CellSearch. Leukocyte depletion followed by CellSearch yielded 271– 1.620 CTC (mean 660, median 484; n = 5) also not yielding a relative increase versus direct analysis of 2 mL DLA product in CellSearch, but resulted in almost a doubling of absolute CTC numbers (Fig. 5). However, if we use the counts detected in 200 × 106 cells of DLA product and calculated the expected CTC numbers for each of the other DLA analyses techniques we noted relative loss for all other methods.
Figure 5.
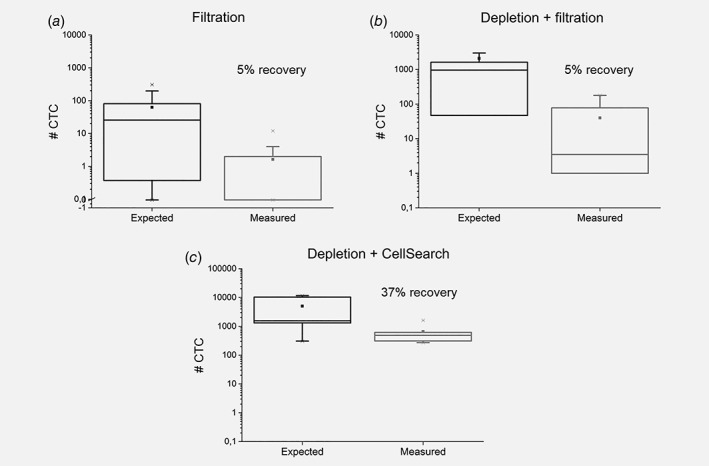
Expected number of CTC based on CellSearch CTC count in 200 × 106 cells of DLA product plotted against the actual measured CTC count for each of the analysis techniques. (a) CTC recovery after filtration (n = 16). (b) CTC recovery after depletion of DLA product followed by filtration (n = 22). (c) CTC recovery of depletion of DLA product followed by CellSearch analysis (n = 5).
CTC in patients with 0 CTC detected in 7.5 mL of blood
In seven patients, 0 CTC were detected in 7.5 mL of blood. In 4 out of these 7 patients CTC were detected in the DLA product. In one patient, 1 CTC was detected by processing 2 mL DLA by CellSearch and in one patient, 1 CTC was detected after leukocyte depletion of 18 mL of DLA product followed by filtration. In the remaining two patients, 2 and 4 CTC where detected respectively after direct filtration of DLA.
DISCUSSION
In this European multicenter study we showed that in 34 metastatic cancer patients the DLA procedure was well tolerated and a DLA product could be obtained. The mononuclear blood fraction obtained represented 0.03–3.5 L of blood (mean = 1.6, SD = 0.7 L). In one patient the represented blood volume was only 30 mL whereas in all other patients, volumes represented 400 mL or more peripheral blood. Due to the high MNC concentration resulting in high leukocyte‐carry‐over impeding CTC detection, only around 5% (200 × 106 cells) of the DLA product can be directly processed in a CellSearch run. Processing of 200 × 106 cells with CellSearch can already result in a carryover that is too high for accurate identification of CTC. A simple solution to this problem is to dilute the sample and divide it over multiple cartridges for scanning and image analysis. However, this approach would lead to a practical problem consisting in the availability of empty cartridges.
For a thorough molecular characterization of the tumor an assessment of heterogeneity is important, thereby implying the need for an assessment of the individual cells. A question that cannot be answered is how many molecular characterized tumor cells from how many tumor sites are needed. However, we do know that the tumor cells present in the blood can come from a variety of metastatic sites, enabling their direct analysis. Extensive heterogeneity has been observed in CTC that match the findings in the metastatic sites to various degrees.19, 20, 21 The molecular characterization of single CTC requires technology for their isolation, which can be performed by FACS,22, 23 DEPArray,24, 25 Punch26, 27 or micromanipulation28. However, employing these methods, cell loss is inevitable. Another problem, if only very few cells are available for analysis is that CTCs are frequently in poor condition disabling their further DNA and/or RNA analysis.29 Therefore, there is agreement that the more tumor cells are available the better the chance to accurately characterize them. With DLA, the increase in CTC yield after processing 5% of the DLA product with CellSearch ranged from 0 to 32 fold (mean 6, median 5) compared to analysis of 7.5 mL of matched PB. In 23% of the patients >100 CTC were detected in 7.5 mL of blood and this increased to 53% of patients in 2 mL of DLA and to 68% if all the DLA could have been processed. A lower number may be sufficient for molecular characterization and for example in 59% of the patients >10 CTC were detected in 7.5 mL of blood and this increased to 65% of patients in 2 mL of DLA and to 79% if all the DLA could have been processed. Molecular characterization and expansion of CTC through in vivo culture in mice is being explored in some of these samples.30, 31
Clearly, some improvements have to be made before the use of DLA can become practice in a clinical setting. For example, methodologies for molecular characterization of CTC isolated from DLA need to be standardized. Also, to proceed with molecular characterization, more effective methods need to be established to process the whole DLA product, e.g. processing of 20 CellSearch runs is accompanied by practical and economical limitations. We therefore evaluated other means of CTC enrichment in DLA products. The use of DLA filtration through microsieves was also limited by overwhelming number of leukocytes, which restricted the use of only ~1.25% (50 × 106 cells) of the DLA product. Depletion of leukocytes prior to filtration or CellSearch enrichment indeed resulted in a number of leukocytes that could be handled by the image recognition of CTC but the depletion procedure itself was accompanied by CTC losses. The overall number of CTC obtained however increased (Fig. 5) thereby raising the ability to characterize the different tumor cells. We conclude that the use of DLA increases the number of CTC that can be isolated. However, further improvements on CTC enrichment technologies are needed to truly gain advantages of DLA as a means to obtain sufficient CTC for the characterization of the tumor and ultimately to guide therapy.
ACKNOWLEDGEMENTS
This work was supported by the EU FP7 HEALTH.2012.1.2‐1 program #305341 ‘Circulating tumor cells TheRapeutic Apheresis (CTCTrap): a novel biotechnology enabling personal therapy for all cancer patients’ and the EU IMI # 115749‐1 CANCER‐ID project.
Conflict of interest: The authors have declared no conflicts of interest.
[Correction added on July 10, 2019 after first online publication: copyright updated.]
REFERENCES
- 1. Bidard F‐C, Peeters DJ, Fehm T, et al. Clinical validity of circulating tumour cells in patients with metastatic breast cancer: a pooled analysis of individual patient data. Lancet Oncol 2014;15:406–14. [DOI] [PubMed] [Google Scholar]
- 2. Cohen SJ, Punt CJA, Iannotti N, et al. Relationship of circulating tumor cells to tumor response, progression‐free survival, and overall survival in patients with metastatic colorectal cancer. J Clin Oncol 2008;26:3213–21. [DOI] [PubMed] [Google Scholar]
- 3. de Bono JS, Scher HI, Montgomery RB, et al. Circulating tumor cells predict survival benefit from treatment in metastatic castration‐resistant prostate cancer. Clin Cancer Res 2008;14:6302–9. [DOI] [PubMed] [Google Scholar]
- 4. Krebs MG, Sloane R, Priest L, et al. Evaluation and prognostic significance of circulating tumor cells in patients with non‐small‐cell lung cancer. J Clin Oncol 2011;29:1556–63. [DOI] [PubMed] [Google Scholar]
- 5. Hiltermann TJN, Pore MM, van den Berg A, et al. Circulating tumor cells in small‐cell lung cancer: a predictive and prognostic factor. Ann Oncol 2012;23:2937–42. [DOI] [PubMed] [Google Scholar]
- 6. Janni WJ, Rack B, Terstappen LWMM, et al. Pooled Analysis of the Prognostic Relevance of Circulating Tumor Cells in Primary Breast Cancer. Clin Cancer Res 2016;22:2583–93. [DOI] [PubMed] [Google Scholar]
- 7. van Dalum G, Stam G‐J, Scholten LFA, et al. International journal of oncology. Int J Oncol 2015;46:1361–8. [DOI] [PubMed] [Google Scholar]
- 8. Coumans FAW, Ligthart ST, Uhr JW, et al. Challenges in the enumeration and phenotyping of CTC. Clin Cancer Res 2012;18:5711–8. [DOI] [PubMed] [Google Scholar]
- 9. Tibbe AGJ, Miller MC, Terstappen LWMM. Statistical considerations for enumeration of circulating tumor cells. Cytometry A 2007;71:154–62. [DOI] [PubMed] [Google Scholar]
- 10. Stoecklein NH, Fischer JC, Niederacher D, et al. Challenges for CTC‐based liquid biopsies: low CTC frequency and diagnostic leukapheresis as a potential solution. Expert Rev Mol Diagn 2016;16:147–64. [DOI] [PubMed] [Google Scholar]
- 11. Fischer JC, Niederacher D, Topp SA, et al. Diagnostic leukapheresis enables reliable detection of circulating tumor cells of nonmetastatic cancer patients. Proc Natl Acad Sci U S A 2013;110:16580–5. [DOI] [PMC free article] [PubMed] [Google Scholar]
- 12. de Chaumont F, Dallongeville S, Chenouard N, et al. Icy: an open bioimage informatics platform for extended reproducible research. Nat Methods 2012;9:690–6. [DOI] [PubMed] [Google Scholar]
- 13. Zeune, Leonie L. https://github.com/LeonieZ/ACCEPT. 2014 [cited 2018 Jan 18]
- 14. Zeune L, van Dalum G, Terstappen LWMM, et al. Multiscale Segmentation via Bregman Distances and Nonlinear Spectral Analysis. SIAM J Imaging Sci 2017;10:111–46. [Google Scholar]
- 15. Zeune L, van Dalum G, Decraene C, et al. Quantifying HER‐2 expression on circulating tumor cells by ACCEPT. PLoS One 2017;12:e0186562. [DOI] [PMC free article] [PubMed] [Google Scholar]
- 16. Nanou A, Coumans FAW, van Dalum G, et al. Circulating tumor cells, tumor‐derived extracellular vesicles and plasma cytokeratins in castration‐resistant prostate cancer patients. Oncotarget 2018;9:19283–93. [DOI] [PMC free article] [PubMed] [Google Scholar]
- 17. de Wit S, Zeune LL, Terstappen LWMM. Improving identification of cells enriched by CellSearch. In: 3rd Advances in Circulating Tumour Cells. Rhodes: 2017.
- 18. de Wit S, Rosii E, Heitzer E, et al. Single tube liquid biopsy for NSCLC, in Advances in Circulating Tumour Cells. In: 3rd Advances in Circulating Tumour Cells. Rhodes: 2017.
- 19. Meng S, Tripathy D, Shete S, et al. HER‐2 gene amplification can be acquired as breast cancer progresses. Proc Natl Acad Sci U S A 2004;101:9393–8. [DOI] [PMC free article] [PubMed] [Google Scholar]
- 20. Meng S, Tripathy D, Shete S, et al. uPAR and HER‐2 gene status in individual breast cancer cells from blood and tissues. Proc Natl Acad Sci U S A 2006;103:17361–5. [DOI] [PMC free article] [PubMed] [Google Scholar]
- 21. Attard G, Swennenhuis JF, Olmos D, et al. Characterization of ERG, AR and PTEN gene status in circulating tumor cells from patients with castration‐resistant prostate cancer. Cancer Res 2009;69:2912–8. [DOI] [PubMed] [Google Scholar]
- 22. Neves RPL, Raba K, Schmidt O, et al. Genomic high‐resolution profiling of single CKpos/CD45neg flow‐sorting purified circulating tumor cells from patients with metastatic breast cancer. Clin Chem 2014;60:1290–7. [DOI] [PubMed] [Google Scholar]
- 23. Swennenhuis JF, Reumers J, Thys K, et al. Efficiency of whole genome amplification of single circulating tumor cells enriched by CellSearch and sorted by FACS. Genome Med 2013;5:106. [DOI] [PMC free article] [PubMed] [Google Scholar]
- 24. Hodgkinson CL, Morrow CJ, Li Y, et al. Tumorigenicity and genetic profiling of circulating tumor cells in small‐cell lung cancer. Nat Med 2014;20:897–903. [DOI] [PubMed] [Google Scholar]
- 25. De Luca F, Rotunno G, Salvianti F, et al. Mutational analysis of single circulating tumor cells by next generation sequencing in metastatic breast cancer. Oncotarget 2016;7:26107–19. [DOI] [PMC free article] [PubMed] [Google Scholar]
- 26. Yang Y, Rho HS, Stevens M, et al. Microfluidic device for DNA amplification of single cancer cells isolated from whole blood by self‐seeding microwells. Lab Chip 2015;15:4331–7. [DOI] [PubMed] [Google Scholar]
- 27. Swennenhuis JF, Tibbe AGJ, Stevens M, et al. Self‐seeding microwell chip for the isolation and characterization of single cells. Lab Chip 2015;15:3039–46. [DOI] [PubMed] [Google Scholar]
- 28. Neumann MHD, Schneck H, Decker Y, et al. Isolation and characterization of circulating tumor cells using a novel workflow combining the CellSearch® system and the CellCelector™. Biotechnol Prog 2017;33:125–32. [DOI] [PubMed] [Google Scholar]
- 29. Swennenhuis JF, Tibbe AGJ, Levink R, et al. Characterization of circulating tumor cells by fluorescence in situ hybridization. Cytometry A 2009;75:520–7. [DOI] [PubMed] [Google Scholar]
- 30. Lambros MB, Seed G, Sumanasuriya S, Gil V, Crespo M, Fontes MS, Chandler R, Mehra N, Fowler G, Ebbs B, Flohr PR, Miranda S, et al. Single Cell Analyses of Prostate Cancer Liquid Biopsies Acquired by Apheresis. Clin Cancer Res; clincanres.0862. 2018. [DOI] [PubMed] [Google Scholar]
- 31. Faugeroux V, Pailler E, Deas O, et al. Establishment and characterization of a unique circulating tumor cells‐derived xenograft (CDX) in prostate cancer. In: AACR annual meeting. Chicago: 2018. 5600/3.