

Summary
Xanthomonas contains a large group of plant‐associated species, many of which cause severe diseases on important crops worldwide. Six gluconate‐operon repressor (GntR) family transcriptional regulators are predicted in Xanthomonas, one of which, belonging to the YtrA subfamily, plays a prominent role in bacterial virulence. However, the direct targets and comprehensive regulatory profile of YtrA remain unknown. Here, we performed microarray and high‐resolution chromatin immunoprecipitation‐exonuclease (ChIP‐exo) experiments to identify YtrA direct targets and its DNA binding motif in X. citri ssp. citri (Xac), the causal agent of citrus canker. Integrative microarray and ChIP‐exo data analysis revealed that YtrA directly regulates three operons by binding to a palindromic motif GGTG‐N16‐CACC at the promoter region. A similar palindromic motif and YtrA homologues were also identified in many other bacteria, including Stenotrophomonas, Pseudoxanthomonas and Frateuria, indicating a widespread phenomenon. Deletion of ytrA in Xac abolishes bacterial virulence and induction of the hypersensitive response (HR). We found that YtrA regulates the expression of hrp/hrc genes encoding the bacterial type III secretion system (T3SS) and controls multiple biological processes, including motility and adhesion, oxidative stress, extracellular enzyme production and iron uptake. YtrA represses the expression of its direct targets in artificial medium or in planta. Importantly, over‐expression of yro3, one of the YtrA directly regulated operons which contains trmL and XAC0231, induced weaker canker symptoms and down‐regulation of hrp/hrc gene expression, suggesting a negative regulation in Xac virulence and T3SS. Our study has significantly advanced the mechanistic understanding of YtrA regulation and its contribution to bacterial virulence.
Keywords: bacterial virulence, ChIP‐exo, GntR, microarray, type III secretion system, Xanthomonas
Introduction
Up to 10% of genes in the bacterial genome encode transcription factors (TFs) which can be grouped according to their type of DNA binding and conserved binding domain (Pabo and Sauer, 1992; Rodionov, 2007). The most studied group is helix–turn–helix (HTH) TFs which have a conserved DNA binding domain containing an α‐helix, a turn and a second α‐helix (Rigali et al., 2002). The GntR family of TFs are named after the gluconate‐operon repressor in Bacillus subtilis (Haydon and Guest, 1991) and are one of the most common TFs. GntR regulators contain a DNA binding HTH domain at the N‐terminus of the protein and an effector binding and/or oligomerization (E‐b/O) domain at the C‐terminus. A conformation change occurs in the regulator on binding to an effector molecule, affecting the subsequent regulation of target genes. GntR usually forms a dimer and binds to two‐fold symmetric DNA operator sequences (palindromic motif) so that each monomer recognizes a half‐site (Konig et al., 2009). The N‐terminal DNA binding domain of GntR regulators is highly conserved, whereas the E‐b/O domain at the C‐terminus is diverse and heterogeneous (Rigali et al., 2002; Vindal et al., 2007). Based on the E‐b/O domain topology and secondary structure, the GntR family can be divided into seven subfamilies, including AraR, DevA, FadR, HutC, MocR, PlmA and YtrA (Hoskisson and Rigali, 2009; Suvorova et al., 2015; Vindal et al., 2007).
Proteins in the YtrA subfamily possess a conserved HTH DNA binding domain, but a reduced E‐b/O domain with only two α‐helices. The average length of the E‐b/O domain in YtrA proteins is about 50 amino acids. Generally, ytrA is located at the beginning of a self‐regulated operon encoding the ATP binding cassette (ABC) transport systems in several bacterial species (Rigali et al., 2002; Salzberg et al., 2011; Vindal et al., 2007). In B. subtilis, YtrA responds to ramoplanin, a cell wall‐targeted antibiotic, and thus is predicted to be a regulator of cell envelope stress responses (Salzberg et al., 2011).
Xanthomonas citri ssp. citri (Xac) is an important bacterial pathogen that severely affects citrus production worldwide by causing citrus canker disease. Many virulence‐associated factors contribute to the bacterial proliferation in planta, suppression of plant defences and symptom development, including extracellular polysaccharide (EPS) (Rigano et al., 2007), lipopolysaccharide (LPS) (Casabuono et al., 2011; Li and Wang, 2011), type II secretion system (T2SS) (Baptista et al., 2010; Yan and Wang, 2012), type III secretion system (T3SS) and effectors (Dunger et al., 2005; Laia et al., 2009; Swarup et al., 1992; Zhou et al., 2015) and rpf‐mediated quorum sensing system (Guo et al., 2012). Among them, T3SS plays a critical role in bacterial infection in both plant and animal pathogens (Alfano and Collmer, 2004; Buttner, 2012; Buttner and He, 2009; Galan et al., 2014). In Xanthomonas, T3SS is encoded by hrp/hrc genes and regulated by two key regulators, HrpG and HrpX. A putative cognate sensor kinase, named HpaS, phosphorylates HrpG during Xanthomonas campestris pv. campestris infection (Li et al., 2014). The phosphorylation results in the activation of HrpG and up‐regulation of HrpX which binds to a PIP (plant‐inducible promoter) box conserved in the promoters of most hrp/hrc operons. YtrA has been reported to regulate bacterial virulence, the hypersensitive response (HR) and T3SS in Xanthomonas campestris pv. campestris (An et al., 2011). However, the mechanistic understanding of YtrA regulation of its targets remains elusive.
Previously, we have identified a YtrA transcriptional regulator XAC1548 (named YtrA hereafter), which is a key regulator of bacterial virulence in Xac, through EZ‐Tn5 transposon mutagenesis (Yan and Wang, 2012). In this study, we aim to probe the direct targets of YtrA and its binding motif. We employed microarray and chromatin immunoprecipitation‐exonuclease (ChIP‐exo) for such a purpose. The predicted YtrA binding motif and its interaction with YtrA were confirmed using electrophoretic mobility shift assay (EMSA). The regulation of YtrA was further investigated in the light of its involvement in virulence.
Results
YtrA is crucial for Xac pathogenicity and HR induction
As reported previously (Yan and Wang, 2012), the EZ‐Tn5 insertional mutant 414H4 of ytrA is a non‐polar mutant and EZ‐Tn5 does not affect the downstream genes of ytrA. To confirm the critical role of YtrA in bacterial virulence, a ytrA deletion mutant was generated by double‐crossover recombination. The ytrA deletion mutant failed to cause canker pustules, whereas the wild‐type strain induced typical canker symptoms (Fig. 1A). Ectopic expression of YtrA‐FLAG (hereafter) in the ytrA mutant complemented the impaired bacterial virulence to the wild‐type level. Expression of YtrA‐Flag was confirmed by immunoblot (Fig. 1D). The bacterial population of the ytrA mutant in the plant is significantly lower (P < 0.01) than that of the wild‐type and complemented strains (Fig. 1B). The insertion mutant 414H4 (Yan and Wang, 2012) and the deletion mutant (Fig. 1A) showed the same phenotype and both could be complemented by the wild‐type ytrA, confirming the critical role of YtrA in bacterial virulence. To test whether ytrA downstream genes are involved in virulence, XAC1547, XAC1546 and XAC1545, which are located downstream of ytrA, were mutated. Mutation of XAC1547, XAC1546 and XAC1545 had no effect on bacterial virulence (Fig. S1, see Supporting Information). To test whether YtrA also contributes to HR induction, the wild‐type, ytrA mutant and complemented strains were inoculated in the non‐host plant tobacco. As shown in Fig. 1C, the ytrA mutant was deficient in HR induction. The deficiency in HR induction was restored by constitutive expression of YtrA in the mutant. These results indicate that YtrA is a key regulator of bacterial virulence and HR induction.
Figure 1.
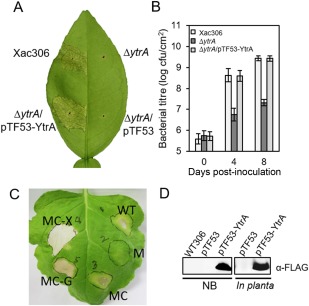
YtrA is crucial for Xanthomonas citri ssp. citri (Xac) virulence and for induction of the hypersensitive response (HR). (A) Bacterial pathogenicity on citrus plant. Xac wild‐type, ytrA mutant (ΔytrA), complementation strain (ΔytrA/pTF53‐YtrA) and ytrA mutant expressing the empty vector (ΔytrA/pTF53) were infiltrated into citrus leaves at 108 colony‐forming units (cfu)/mL. The leaves were photographed at 4 days post‐inoculation (dpi). (B) Bacterial population in the plant. Xac cells were recovered from the inoculated leaves at 0, 4 and 8 dpi, and the values are the means of three repeats. Means ± standard deviations are plotted. (C) HR induction on Nicotiana benthamiana. Xac strains were inoculated in tobacco [optical density at 600 nm (OD600) = 0.8]. WT, wild‐type 306 with empty vector pUFR053; M, ytrA mutant with pUFR053; MC, ytrA mutant with complementary vector p53‐YtrA; MC‐X, ytrA mutant with p53‐HrpX; MC‐G, ytrA mutant with p53‐HrpG. (D) Detection of protein expression from strain containing pTF53‐YtrA in nutrient broth (NB) medium and in planta.
Genome‐wide transcriptional and binding profiles of YtrA
To experimentally identify YtrA regulated genes and binding sites, we first performed a whole‐genome Xac oligonucleotide microarray analysis to obtain the regulatory profile of YtrA via comparison of the ytrA EZ‐Tn5 mutant and wild‐type strain. In addition, ChIP‐exo was conducted to identify the YtrA DNA binding motif with near single‐nucleotide resolution in medium and host (Rhee and Pugh, 2012).
To characterize the expression of the genes associated with the bacterial T3SS and other virulence‐related traits that are not expressed in rich medium, a plant‐mimic medium (XVM2 medium) was used to grow Xac for microarray assay. Two time points representing the middle exponential growth stage [T1, optical density at 600 nm (OD600) = 0.31] and the late exponential growth stage (T2, OD600 = 0.45) of Xac were selected. Based on the following cut‐off with a false discovery rate (FDR) < 0.05 and absolute value of the log2 fold change > 1.585 (equivalent to a fold change of 3.0), a total of 342 and 251 genes were differentially regulated by YtrA at T1 and T2, respectively (Fig. 2A). A total of 169 overlapping genes was identified in both T1 and T2 with a similar regulatory pattern (Table S1, see Supporting Information). Overall, the expression of 232 and 192 genes was up‐regulated and down‐regulated, respectively, in the ytrA mutant compared with the wild‐type at both time points. To validate the microarray result, 15 down‐regulated genes and 13 up‐regulated genes were selected for quantitative reverse transcription‐polymerase chain reaction (QRT‐PCR) analysis. The relative transcription ratios generated from microarray and QRT‐PCR were compared. The QRT‐PCR results are highly consistent with the microarray data with a coefficient of determination R 2 = 0.9134 (Fig. 2B).
Figure 2.
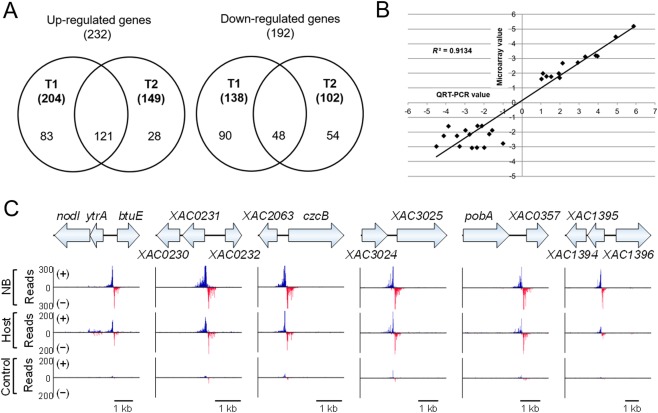
YtrA regulon and DNA binding sites. (A) Venn diagram shows the overlap of genes differentially regulated by YtrA at the two time points (T1, T2). (B) Validation of the microarray data by quantitative reverse transcription‐polymerase chain reaction (QRT‐PCR). The relative expression of 28 genes determined by microarray and QRT‐PCR was compared. The R2 value is shown. (C) Six putative YtrA DNA binding sites identified by chromatin immunoprecipitation‐exonuclease (ChIP‐exo) experiments in nutrient broth (NB) and host plant. Strain expressing YtrA without a tag was used as a control. (+) (blue) and (–) (red) in ChIP‐exo data indicate reads mapped on forward and reverse strands, respectively.
The genome‐wide binding profile of YtrA was assessed using ChIP‐exo. YtrA‐Flag restored the deficient phenotype of the ytrA mutant, indicating that YtrA‐Flag is fully functional and suitable for ChIP‐exo experiments (Fig. 1). Peak‐pairs were mapped to the Xac 306 genome and manually analysed. YtrA binds to its own promoter in X. campestris pv. campestris (An et al., 2011). Consistently, we identified a strong peak‐pair at the ytrA promoter region in Xac (Fig. 2C). The intensity of the peak‐pair located at the ytrA promoter region was used as a reference for the identification of other peak‐pairs. In total, six peak‐pairs were identified, located at the promoter region of ytrA (XAC1548), XAC0231, czcB (XAC2064), XAC3025, XAC0357 and XAC1396 in rich medium (NB medium) and in host (Fig. 2C). A complementation strain without Flag‐tag was used as a negative control. No peak was identified in the control.
Combined ChIP‐exo/microarray analysis reveals direct targets of YtrA and a conserved palindromic motif GGTG‐N16‐CACC
To identify direct targets of YtrA, the ChIP‐exo data and YtrA transcriptome profile were compared. Three operons whose promoters interacted with YtrA (Fig. 2C) were also identified to be significantly regulated by microarray at both time points (Fig. 3A, Table S1). Herein, we named the three operons yro1 (YtrA regulated‐operon 1) (including ytrA, nodI, XAC1546, XAC1545, XAC1544 and XAC1543), yro2 (including czcB, XAC2065 and XAC2066) and yro3 (including XAC0231 and XAC0230) (Fig. 3A). The other three operons (Fig. 2C) that have YtrA binding peaks were not identified in the microarray results and were excluded from further analysis. A conserved palindromic motif GGTG‐N16‐CACC was identified in the three YtrA binding sequences (Fig. 3B) and other Xanthomonas spp. (Table S2, see Supporting Information). The putative YtrA binding motif was also identified in Stenotrophomonas maltophilia, Pseudoxanthomonas suwonensis and Frateuria aurantia based on the phylogenetic tree (Fig. S2, Table S2, see Supporting Information).
Figure 3.
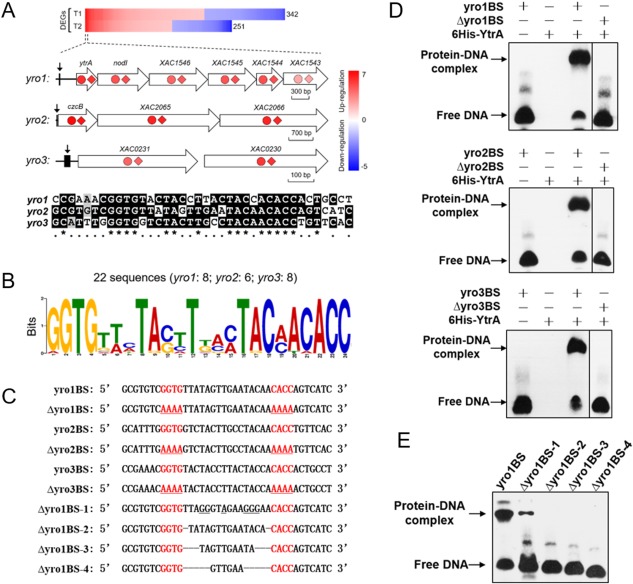
YtrA regulates yro1, yro2 and yro3 regulons and binds to the GGTG‐N16‐CACC palindromic motif. (A) Combined chromatin immunoprecipitation‐exonuclease (ChIP‐exo) and microarray data analysis revealed three operons directly regulated by YtrA. The genes identified by ChIP‐exo were present in the top 30 differentially expressed genes (DEGs) of the microarray data at both T1 and T2 time points. Red represents up‐regulation and blue represents down‐regulation. The fold changes of genes in the three operons at T1 and T2 are illustrated by coloured circles and diamonds, respectively. The YtrA binding positions are marked with arrows. Sequence alignment of YtrA binding sites is shown below the schematic graph. A 38‐bp sequence between two peaks generated by ChIP‐exo was extracted from each regulon. Conserved nucleotides are marked with asterisks. (B) Sequence logo representation of the YtrA binding motif. In total, 22 sequences were submitted to MEME for motif identification. Sequences are listed in Table S2. (C) Sequences of probes used in electrophoretic mobility shift assay (EMSA). Underlined nucleotides indicate the mutations. (D) YtrA binds to motifs located at promoter regions of yro1, yro2 and yro3, respectively. EMSA experiments were conducted in the presence of purified 6His‐YtrA and the corresponding probes listed in (C). (E) Influences of mutated nucleotides on YtrA–DNA interaction. The sequences of the indicated probes are listed in (C). Straight lines indicate deletion of the corresponding nucleotides.
To verify whether YtrA binds to the GGTG‐N16‐CACC motif in vitro, purified 6His‐YtrA and 38‐bp double‐stranded oligonucleotide probes containing the YtrA binding motif corresponding to yro1, yro2 and yro3 promoter regions (Fig. 3C) were used to ascertain DNA–protein interaction by EMSA. Motility shift was observed for the DNA probes with addition of the purified 6His‐YtrA (Fig. 3D). Mutation of the motif GGTG‐N16‐CACC to AAAA‐N16‐AAAA abolished the motility shift (Fig. 3C,D), suggesting that the palindromic motif GGTG‐N16‐CACC is critical for YtrA binding (Fig. 3C,D). In addition, ‘GGTG’ and ‘CACC’, ‘TA’, ‘T’ and ‘TAC’ were also conserved within the 16 nucleotides between the palindromic sequences. Mutation of these conserved nucleotides significantly decreased protein–probe binding (Fig. 3E), indicating that these nucleotides are required for efficient binding of YtrA to its motif. We also tested whether the length of nucleotides between the palindromic sequences contributes to DNA–protein binding. A series deletion of nucleotides abolished YtrA binding to the probe (Fig. 3E). Taken together, these results suggest that YtrA specifically binds to a palindromic motif GGTG‐N16‐CACC in the promoters of target genes. The intermediate sequence also plays an important role in DNA–protein interaction.
YtrA plays multiple roles in cellular processes
Based on the annotation from the J. Craig Venter Institute (JCVI) role categories, 424 differentially expressed genes (DEGs) identified by microarray were classified into 16 functional groups (Fig. S3, see Supporting Information). Analysis of the microarray data revealed that YtrA was involved in the regulation of multiple cellular processes, including motility and adhesion, oxidative stress, extracellular enzyme production and iron uptake (Table 1).
Table 1.
Selected genes regulated by YtrA.*
| Functional groups † | Gene or ID locus ‡ | log2 FC, M/W § |
|---|---|---|
| Regulatory functions | ||
| Two‐component system | XAC1228, XAC1229 | 3.6–4.4 |
| Sigma factor | fliA, rpoN | −1.7 to −2.7 |
| Sigma factor | prtI | 2.1 |
| Other | XAC0807, pcaQ, XAC1548, salR | 1.8–6.1 |
| Other | phoU, XAC2166 | −1.6 to −2.4 |
| Cellular process | ||
| Chemotaxis and motility | flgBCDEFGHIJKL, fliEFGHILMNOPQR, fliC, flhF, fleN, tsrXAC1893, tsrXAC1894, tsrXAC1895, tsrXAC1897, tsrXAC1899, tsrXAC1900, cheAXAC1903, cheAXAC1930, cheAXAC2865, cheWXAC1906, cheWXAC2867, cheYXAC1904, cheYXAC1932, cheRVZ, motBC, mcpXAC1996, mcpXAC2448, mcpXAC2866, mcpXAC3132 | −1.6 to −3.1 |
| Detoxification | katE, btuE, yapH, XAC0540 | −1.6 to −3.6 |
| Iron uptake | ||
| Iron binding and transport | pfeA, fhuAXAC2941, fpvA, fecA, fhuAXAC1435, fhuEXAC3370, fhuEXAC3498, phuRXAC2829, phuRXAC0823, feoB, XAC0492 | 1.9–4.2 |
| Siderophore biosynthesis | lysA, iucA, yceE, XAC3177, XAC3178 | 1.7–4.1 |
| Iron binding and transport | fhuAXAC2830, fyuA, btuB, brf, XAC1149 | −1.6 to −2.6 |
| Type III secretion system (T3SS) and T3SS effectors | ||
| T3SS key regulators | hrpG, hrpX | 1.7–1.9 |
| T3SS | hrcCJNQRTUV, hrpB1B2B4B5B7D5D6, hpa1, hpa2, hpaABFP, XAC0395 | 1.6–2.7 |
| T3SS effectors | avrXacE2, avrBs2, hrpW, XAC0277, XAC0754, XAC1208, XAC2009, XAC3085, XAC3090, XAC3230, XAC3666, XAC4213, XAC4333 | 1.6–2.3 |
| T3SS effectors | XAC1209 ¶ , XAC1210 ¶ | −1.6 to −1.7 |
| Energy metabolism and central intermediary metabolism | ||
| Extracellular enzymes | amy, egl, engXCA | −1.7 to −3.1 |
| The tricarboxylic acid (TCA) cycle | mls, aceA | −3.0 to −5.0 |
| Oxidoreductase | yagRS, petABC, vanB, aslB, XAC3738 | −1.6 to −4.0 |
| Oxidase | cox3, cox11, ctaCD | −1.7 to −1.9 |
| Dehydrogenase | yagT, fdh, ybdR, gcd | −1.6 to −4.4 |
| Dehydrogenase | acdA | 2.2 |
| DNA metabolism | ||
| DNA recombination, replication and repair | lig3, XAC0035 | −2.0 to −2.2 |
| DNA recombination, replication and repair | XAC3006 | 1.7 |
| Fatty acid and phospholipid metabolism | ||
| Degradation | paaF, fedE9, XAC0375 | 1.8–2.0 |
| Other | mdoB | 1.6 |
| Protein fate | ||
| Folding and stabilization | groESL, htpX, hslVU | 1.6–1.8 |
| Secretion and trafficking | tolC | 3.8 |
| Modification and repair | pcm | 3.1 |
| Degradation | XAC2832, XAC0609, XAC3309, dcpXAC1456, dcpXAC0249, XAC0262, XAC0591, XAC0628, ptrB, pepNXAC1159, pepNXAC3318, XAC1204, XAAC2745, XAC2999, sppA, XAC4106 | 1.6–6.1 |
| Degradation | pfpI, rrpX, XAC0465 | −1.7 to −3.3 |
*Data were selected from the microarray results. Detailed information is provided in Table S3.
†Functional groups were manually modified based on the result of Fig. S3 for the easy understanding of the content.
‡Genes annotated with the same name are indicated by their specific ID locus.
§FC, fold change; M/W, mutant vs. wild‐type.
¶Inactive/pseudogene.
To test whether mutation of ytrA affects bacterial motility and adhesion, bacterial swimming and biofilm formation were tested. The swimming motility of the ytrA mutant was significantly reduced compared with the wild‐type. The motility deficiency of the mutant was restored to the wild‐type level by expression of YtrA in the mutant (Fig. S4A, see Supporting Information). Compared with the wild‐type and complementation strain, the ytrA mutant formed a reduced biofilm in a glass tube (Fig. S4B).
The expression of katE, a monofunctional catalase which contributes to the virulence of Xac (Tondo et al., 2010), was down‐regulated in the ytrA mutant. The catalase activity of the ytrA mutant was significantly lower than that of the wild‐type and complementation strains (Fig. S5A, see Supporting Information). In addition, the resistance of Xac to hydrogen peroxide (H2O2) was significantly affected by the mutation of ytrA (Fig. S5B). The living cell population of the ytrA mutant was reduced more than 1000 times by incubation for 30 min with H2O2. However, less than a 10‐fold population reduction was observed for the wild‐type and complementation strains (Fig. S5B).
Extracellular enzymes, e.g. pectate lyase and α‐amylase, are involved in the development of canker symptoms and multiplication of Xac in citrus (Lin et al., 2010, Yamazaki et al., 2008). The mutation of ytrA significantly down‐regulated the expression of amy, egl and engXCA, which encode an α‐amylase and cellulases, respectively (Table 1). Consistently, the ytrA mutant was deficient in the production of amylase and cellulose, whereas the complementation strain produced similar amylase and cellulose to the wild‐type (Fig. S6A,B, see Supporting Information).
Iron is an essential nutrient for bacterial growth and plays an important role in the virulence of pathogenic bacteria (Litwin and Calderwood, 1993). Mutation of ytrA resulted in the over‐expression of lysA, iucA, yceE, XAC3177 and XAC3178, which are located in a Xanthomonas siderophore synthesis (xss) gene cluster in X. oryzae pv. oryzae (Pandey and Sonti, 2010). In addition, the expression of multiple genes encoding iron siderophore receptors, e.g. pfeA, fhuA, fpvA, fecA, fhuE and phuR, was significantly up‐regulated in the ytrA mutant (Table 1). To test whether YtrA regulates siderophore production, the bacterial strains were examined on chrome‐azurol S‐agar (CAS) medium. The ytrA mutant produced a larger halo zone than the wild‐type and complementation strains on the plate (Fig. S7A, see Supporting Information), which typically indicates an overproduction of siderophore (Schwyn and Neilands, 1987). Moreover, a significant reduction in growth rate of the ytrA mutant compared with the wild type and complementation strains was observed in PS medium (see Experimental procedures) with the addition of the ferrous iron chelator 2,2′‐dipyridyl (DP) at final concentrations of 100 and 150 μm (Fig. S7B).
YtrA regulates the expression of T3SS and type III effectors (T3Es)
Microarray data showed that YtrA regulates T3SS and T3Es, which are determinants of bacterial pathogenicity. All of the 25 hrp genes, two key regulators hrpG and hrpX, and 13 T3E genes were up‐regulated in the ytrA mutant (Table 1). As the up‐regulated T3SS and T3Es in XVM2 could not explain the impaired virulence of the ytrA mutant, expression of hrp genes in planta was monitored using QRT‐PCR. YtrA positively regulated the expression of hrpX, hrpG, hrpB1, hrcU and hrcQ at 48 and 72 h post‐inoculation (hpi) in the host plant (Fig. 4A).
Figure 4.
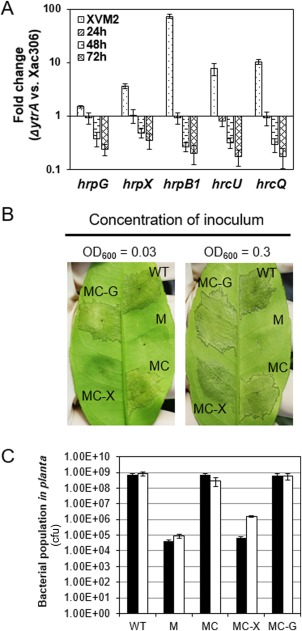
YtrA regulates the expression of the bacterial type III secretion system (T3SS) and type III effectors (T3Es). (A) YtrA positively regulates T3SS in Xanthomonas citri ssp. citri (Xac) in planta. The wild‐type and mutant were inoculated in Duncan grapefruit. The relative expression (mutant vs. wild‐type) of the genes of interest at different time points is shown as relative values on a logarithmic scale. (B) Ectopic expression of hrpG and hrpX restored the deficient virulence in the ytrA mutant. Xac strains were inoculated in the host plant grapefruit with starting concentrations of OD600 = 0.3 or 0.03. Inoculated leaves were photographed at 3 days post‐inoculation (dpi). (C) The bacterial population in planta was tested at 6 dpi. Black and white columns indicate that strains were inoculated with starting concentrations of OD600 = 0.03 and 0.3 respectively. WT, Xac 306 with empty vector pUFR053; M, ytrA mutant with pUFR053; MC, ytrA mutant with p53‐YtrA; MC‐X, ytrA mutant with p53‐HrpX; MC‐G, ytrA mutant with p53‐HrpG.
In the light of the down‐regulation of T3SS in the ytrA mutant in the citrus plant, we investigated whether the virulence deficiency in the ytrA mutant could be restored by constitutive expression of hrpG or hrpX, as HrpG and HrpX are key virulence regulators responsible for the expression of T3SS. Ectopic expression of hrpG fully restored the virulence of the ytrA mutant to the wild‐type level (Fig. 4B,C). Constitutive expression of hrpX partially restored the virulence of the ytrA mutant (Fig. 4B,C). Consistently, deficient virulence of the ytrA mutant in HR induction was restored by constitutive expression of hrpG or hrpX (Fig. 1C). Taken together, our results suggest that YtrA transcriptionally regulates T3SS and T3Es. The regulation is probably indirect as the YtrA binding motif was not identified in the promoter regions of T3SS and T3E genes (Fig. 2C).
Critical residues of YtrA required for bacterial virulence
Several conserved residues, including residues at the N‐terminal HTH domain, were mutated by site‐direct mutagenesis. PIY (11–13), PSVR (36–39), LNPIT (47–51) and RRGLG (68–72) were mutated to AIA, ASAA, ANAIA and ARALA, respectively (Fig. S8A, see Supporting Information). The expression of all mutated proteins was subjected to immunoblot analysis to rule out the influence of mutations on protein stability (Fig. S8C). The ytrA mutants expressing different YtrA mutations were inoculated on citrus plants. YtrA mutations failed to restore the ytrA mutant (Fig. S8B), whereas the wide‐type YtrA fully complemented the virulence of the ytrA mutant (Fig. 1A), suggesting that these conserved residues are required for YtrA‐regulated bacterial virulence.
YtrA regulatory activity in the host and medium
Previous reports have shown that YtrA in X. campestris pv. campestris negatively regulates itself in XVM2 medium, but positively regulates itself in the host (An et al., 2011). We tested whether a similar phenomenon also occurs in Xac. The expression levels of all tested genes (XAC1547, XAC1546 and XAC1545 representing the yro1 operon, czcB representing the yro2 operon, and XAC0231 and XAC0230 representing the yro3 operon) were greater in the ytrA mutant than in the wild‐type strain in both medium (NB and XVM2 media) and in planta (Fig. 5A). To confirm that YtrA is a constant repressor of the aforementioned genes (Fig. 5A) in both medium and host, native and mutant promoters (GGTG to AAAA) (Fig. S9A,B, see Supporting Information) of yro1, yro2 and yro3 were fused with the β‐glucuronidase (GUS) reporter gene. The resulting GUS constructs were introduced into the wild‐type and ytrA mutant, and GUS activities were assayed. The lac promoter was used as a control to ascertain no GUS expression preference between the wild‐type and mutant (Fig. 5B). Consistent with our QRT‐PCR results, GUS expression driven by the native promoters of the three different YtrA regulons was apparently higher in the ytrA mutant than in the wild‐type strain according to histochemical staining and quantification of GUS activity (Fig. 5B). GUS activities driven by mutant promoters were higher than those driven by native promoters in the wild‐type strain in NB and XVM2 medium and in planta, further confirming that YtrA represses the expression of yro1, yro2 and yro3 (Fig. 5B,C).
Figure 5.
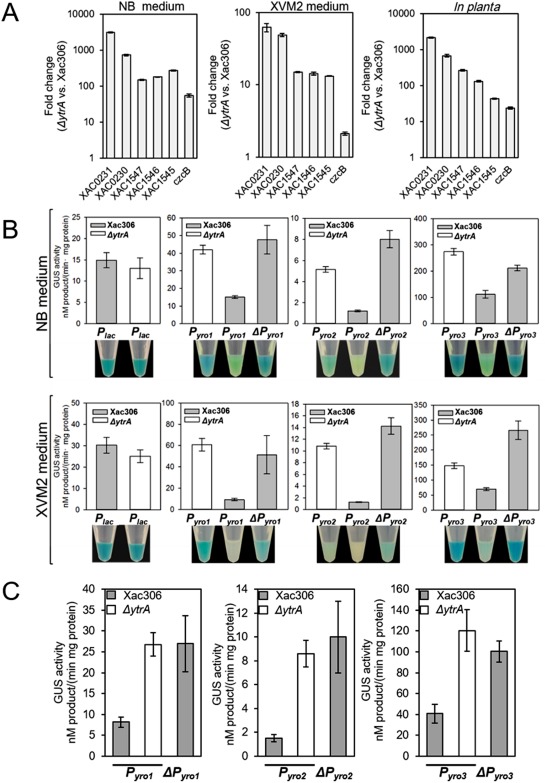
YtrA is a transcriptional repressor in medium and host. (A) Relative expression of YtrA‐regulated genes in nutrient broth (NB), a plant‐mimic medium (XVM2) and in planta. Cells were collected from overnight culture or recovered from inoculated leaves at 5 days post‐inoculation (dpi). Fold change values are plotted as relative values on a logarithmic scale. (B) Quantification of β‐glucuronidase (GUS) activity and histochemical staining of GUS expression in Xanthomonas citri ssp. citri (Xac) cells grown in NB and XVM2 medium. Promoter length and sequences are shown in Fig. S9. Four replicates were performed and one tube is presented. (C) Quantification of GUS activity of Xac cells grown in planta.
Over‐expression of yro3 operon attenuates Xac virulence and T3SS expression
To investigate whether yro regulons are involved in the regulation of bacterial virulence, three yro regulons were over‐expressed in the wild‐type strain under the control of the trp promoter. The over‐expression constructs were introduced into the wild‐type strain for pathogenicity assay in planta. Empty vector was used as a negative control. The expression of individual genes from all three different operons was confirmed by QRT‐PCR (Fig. 6C). Intriguingly, over‐expression of yro3 attenuated Xac virulence, whereas over‐expression of yro1 and yro2 did not (Fig. 6A). The growth of the yro3‐expressing strain was significantly (P < 0.01) slower than that of strains expressing yro1, yro2 and empty vector (Fig. 6B). To test whether an individual protein located in the yro3 operon was a crucial factor in the decrease in bacterial virulence, XAC0231 and XAC0230 were over‐expressed in the wild‐type and protein expression was confirmed by immunoblot (Fig. S10B, see Supporting Information). Cells expressing XAC0231 or XAC0230 showed similar canker symptoms to cells harbouring empty vector (Fig. S10A). To rule out the possibility of delayed bacterial growth caused by over‐expression of yro operons, we assessed the growth rates of strains over‐expressing yro1, yro2 and yro3 in NB and XVM2 medium. Over‐expression of the three operons did not affect bacterial growth (Fig. S11A,B, see Supporting Information). Expression of T3SS was down‐regulated by QRT‐PCR in the yro3 over‐expressing strain when cells were grown in planta (Fig. 6D). Taken together, our results indicate that XAC0231 and XAC0230 play a role in the negative regulation of T3SS and bacterial virulence.
Figure 6.
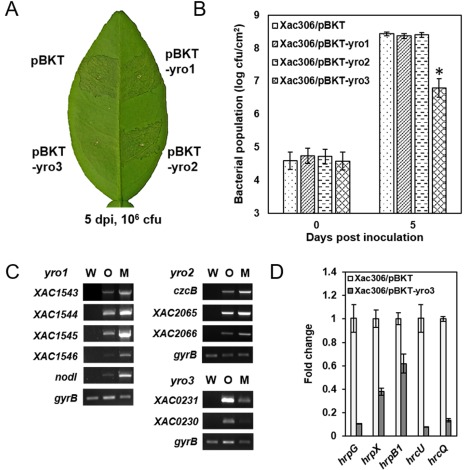
Over‐expression of the yro3 operon attenuates bacterial virulence. (A) Bacterial pathogenicity on citrus plant. Xanthomonas citri ssp. citri (Xac) wild‐type strains containing pBKT, pBKT‐yro1, pBKT‐yro2 and pBKT‐yro3 were infiltrated into citrus leaves at an initial concentration of 106 colony‐forming units (cfu/mL). Leaves were photographed at 5 days post‐inoculation (dpi). (B) Bacterial population in planta. Bacterial cells were recovered from the inoculated leaves at 0 and 5 dpi, and the values are the means from three repeats. Means ± standard deviations are plotted. Asterisks indicate a statistically significant difference (Student's t‐test, P < 0.01 versus the wild‐type). (C) Verification of gene expression using semi‐quantitative reverse transcription‐polymerase chain reaction (QRT‐PCR). (D) Relative gene expression determined by QRT‐PCR. Fold change values are shown and normalized using the expression of gyrB.
Discussion
In this study, we have identified the direct targets of YtrA in Xac using both microarray and ChIP‐exo analyses. Microarray assay identified a total of 424 genes regulated by YtrA (Fig. 2A), whereas ChIP‐exo identified a total of six direct targets (Fig. 2C). Although microarray analysis provides a comprehensive view of the genome‐wide gene expression profile of YtrA, it could not distinguish between direct targets and indirectly regulated genes. ChIP‐exo delivers near single‐nucleotide resolution to target identification and decreases the background noise by digesting contaminating DNA; therefore, it has become a widely applied tool in the identification of DNA binding sites and targets of regulators (Mahony and Pugh, 2015; Rhee and Pugh, 2011). Among the six direct targets of YtrA identified by ChIP‐exo, only three (yro1, yro2 and yro3) were identified by microarray analysis. The palindromic GGTG‐N16‐CACC binding motif of YtrA was identified and confirmed in the promoter regions of yro1, yro2 and yro3 (Fig. 3B,D), but not in the other three genes (Fig. 2C), which further indicates that yro1, yro2 and yro3 are the direct targets of YtrA. We reasoned that the other three genes identified in ChIP‐exo (Fig. 2C) might result from non‐specific interaction in ChIP as they are not identified in the microarray data.
We further defined and experimentally validated the YtrA binding motif, the palindromic GGTG‐N16‐CACC motif (Fig. 3A–D), compared with previous predictions (Rigali et al., 2002; Suvorova et al., 2015). We found the yro2 operon to be a new YtrA direct target that has not been predicted previously. The yro2 operon consists of czcB, XAC2065 and XAC2066, which might encode a putative cation efflux system involved in resistance to multiple heavy metals, e.g. cadmium, cobalt, zinc, nickel, chromate, and to antimicrobial agents (Nies, 2003; Stahler et al., 2006; Venter et al., 2015; Vila et al., 2007). Interestingly, the palindromic GGTG‐N16‐CACC motif was not only identified in Xanthomonas, but also in many other bacteria, e.g. S. maltophilia, P. suwonensis and F. aurantia, whose YtrA shares 92%, 89% and 68% identity with YtrAXac, respectively (Fig. S2, Table S2). Taken together, these data suggest that YtrA binding to the palindromic motif GGTG‐N16‐CACC is a widespread phenomenon.
Multiple factors contribute to the virulence deficiency of the ytrA mutant. First, expression of katE, a monofunctional catalase, was down‐regulated in the ytrA mutant (Fig. S5A). KatE is critical for Xac to resist H2O2, a reactive oxygen species (ROS) (Tondo et al., 2010). Consistently, resistance of Xac to H2O2 was significantly affected by the mutation of ytrA (Fig. S5B). Xac needs to overcome ROS, which plants employ to defend against invading phytopathogens (Hammond‐Kosack and Jones, 1996). The reduced tolerance of the ytrA mutant to ROS probably contributes to its reduced growth in planta (Fig. 1B). Second, the reduced expression of the genes responsible for extracellular enzymes, e.g. pectate lyase and α‐amylase (Table 1), and the corresponding decrease in enzyme production (Fig. S6A,B), also contribute to the reduced virulence of the ytrA mutant. Pectate lyase and α‐amylase are involved in the development of canker symptoms and the multiplication of Xac in citrus (Lin et al., 2010; Yamazaki et al., 2008). Lastly, YtrA positively regulates the expression of T3SS genes, e.g. hrpX, hrpG, hrpB1, hrcU and hrcQ, in the host plant (Fig. 4A). Over‐expression of the T3SS regulator HrpX failed to fully restore virulence in the yrtA mutant, which further confirms that the deceased virulence in the ytrA mutant is not only caused by a down‐regulated T3SS.
One puzzle was observed for the YtrA regulation of T3SS genes in planta and in vitro. YtrA represses T3SS genes in vitro, but positively regulates T3SS genes in planta. As the YtrA binding motif was not identified in the promoters of T3SS genes (Fig. 2C), we reasoned that YtrA regulation of T3SS genes is via an indirect mechanism. An elegant hypothesis has been proposed to address a similar phenomenon in X. campestris pv. campestris (An et al., 2011). In their hypothesis, An et al. (2011) proposed that a plant signal molecule induces the expression of an unknown regulator which suppresses hpaR1 expression. However, this suppression can be inactivated by HapR1, so that the hpaR1 gene can be expressed in the wild‐type cells, but not in the hpaR1‐deficient mutant cells. In medium, hpaR1 can be expressed without HpaR1 because of the lack of the specific plant signal molecule. It remains to determine whether a similar mechanism exists in Xac.
Interestingly, the over‐expression of the yro3 operon attenuates Xac virulence and T3SS expression. The yro3 operon contains two open reading frames (ORFs): XAC0230 and XAC0231. XAC0230 encodes TrmL, a tRNA modification enzyme catalysing the methyl transfer from S‐adenosyl‐l‐methionine to the 2′‐OH of the ribose at the nucleotide 34 wobble position of two isoacceptors and (Benitez‐Paez et al., 2010). Notably, the crystal structure revealed that TrmL forms a homodimer and can independently catalyse methyl transfer through the conserved C‐terminal half of the SPOUT domain for catalysis and less conserved N‐terminal domain for tRNA recognition (Liu et al., 2013). XAC0231 encodes a hypothetical protein without a known function. A signal peptide is predicted for XAC0231 by SignalP 4.1 at the N‐terminal 26 residues, suggesting that XAC0231 is likely to be secreted into the bacterial periplasm. Our results showed that the over‐expression of the yro3 operon attenuated Xac virulence, whereas individual expression of TrmL or XAC0231 did not affect pathogenicity (Fig. S10). Therefore, although tRNA modification has been reported to be implicated in bacterial virulence in several plant and animal pathogens (Cho and Caparon, 2008; Durand et al., 2000; Kinscherf and Willis, 2002; Shippy and Fadl, 2015; Shippy et al., 2013), the mechanism of Xac virulence regulation mediated by the yro3 operon remains unknown.
In conclusion, we experimentally identified YtrA direct targets and comprehensively analysed YtrA‐associated phenotypes in Xac. Combining microarray and ChIP‐exo data, we revealed that YtrA, as a transcriptional repressor in NB, XVM2 medium and host, binds to a palindromic motif GGTG‐N16‐CACC located at the promoter regions of the yro1, yro2 and yro3 operons. YtrA also plays a pivotal role in bacterial virulence and HR induction. Considering the critical role of YtrA in bacterial pathogenicity, we can design novel disease control approaches by the identification of compounds targeting YtrA. In addition, we experimentally confirmed that the abolished virulence of the ytrA mutant is caused by the over‐expression of the yro3 operon via an unknown mechanism. Studies are needed to further elucidate the role of the yro3 operon in bacterial virulence.
Experimental Procedures
Bacterial strains, grown conditions, plasmids and primers
The bacterial strains and plasmids used in this work are listed in Table S3 (see Supporting Information). Primers are listed in Table S4 (see Supporting Information). The Escherichia coli strain was cultured at 37 ºC in Luria–Bertani (LB) medium. Xac strains were cultured at 28 ºC on nutrient agar (NA) plates, in nutrient broth (NB) or XVM2 medium. Plasmids in this work were constructed in JM109 cells. BL21(DE3) was used for YtrA purification. The ytrA EZ‐Tn5 mutant was used in microarray analysis and the deletion mutant was used for ChIP‐exo. When required, growth media were supplemented with ampicillin (50 μg/mL), gentamycin (5 μg/mL), kanamycin (50 μg/mL), rifamycin (50 μg/mL) and spectinomycin (100 μg/mL).
ChIP‐exo
ChIP‐exo experiments were carried out by Peconic LLC (State College, PA, USA) essentially as described previously (Reja et al., 2015). The procedure consists of an immunoprecipitation step with magnetic beads, followed by DNA polishing, a step of Illumina adaptor ligation (ExA2) and a digestion by lambda and RecJ exonuclease on the beads. A primer was then annealed to the EXA2 adaptor and extension was performed using Φ29 DNA polymerase. Products were A‐tailed and ligated with a second Illumina adaptor for PCR amplification and gel purification. Sequencing was performed using an Illumina HiSeq 2000, San Diego, CA, USA. Uniquely aligned sequence tags were mapped to the Xac 306 genome using BWA (version 0.5.9‐r16) (Li and Durbin, 2009).
RNA extraction and microarray assay
A single colony of wild‐type and mutant was inoculated in XVM2 broth and incubated at 28 ºC and 200 rpm overnight. Cells were re‐inoculated into fresh XVM2 broth with a starting concentration of OD600 = 0.03 and incubated at 28 ºC and 200 rpm. Bacterial cells were collected at two time points in the exponential growth stage and were treated immediately with two volumes of RNA protect bacterial reagent (Qiagen, Valencia, CA, USA). RNA was extracted using an RNeasy mini kit (Qiagen). Contaminated genomic DNA was removed by a TURBO DNA‐free kit (Ambion, Austin, TX, USA). The RNA quality was assessed using an Agilent 2100 bioanalyser (Agilent Technologies, Palo Alto, CA, USA).
The 8‐by‐15‐K DNA Xac oligonucleotide microarray chip covering the whole genome of strain 306 was used in this study. The microarray experiment was conducted at the Interdisciplinary Center for Biotechnology Research Microarray Core Facility, University of Florida, FL, USA. The extracted RNA (5 μg) was used to generate cDNA and then labelled with either cy3 or cy5 using a Fairplay III microarray labelling kit (Agilent Technologies). A total of 300 ng of labelled cDNA per sample was used for hybridization employing a Gene Expression Hybridization Kit (Agilent Technologies). Four independent biological replicates were performed for two time point comparisons with dye‐swap design. The arrays were scanned using a dual‐laser DNA microarray scanner (Model G2505C; Agilent Technologies). The data were extracted from a scanned image using Feature Extraction 10.1.1.1 software (Agilent Technologies).
The microarray data were analysed as described previously (Guo et al., 2011). Briefly, the raw data were imported into the R environment and statistical tests were performed using BioConductor statistical software (Gentleman et al., 2004). Log2‐transformed fold change values were used for statistical analysis. The P values were adjusted using the Benjamini–Hochberg method, designated as FDR (Benjamini and Hochberg, 1995). DEGs were ranked based on FDR and log2 fold change. Genes with FDR < 0.05 and a minimum absolute value of log2 fold change > 1.585 (equivalent to three‐fold) were considered to be significant DEGs.
Stress resistance assay
The resistance assay against H2O2 was performed as reported previously (Yan et al., 2012) with modifications. Wild‐type, mutant and complemented strains were cultured to stationary phase (24 hpi) in XVM2 broth in a 28 ºC growth shaker. The bacterial population was adjusted to OD600 = 0.3. H2O2 was added to the bacterial suspension with a final concentration of 20 mM. The challenged bacterial cells were sampled at different time points and the living cell population was determined by serial dilution on an XVM2 plate.
To test the bacterial survival under iron‐limited conditions, the Xac strains were cultured in PS medium (for l L broth: 10 g peptone, 10 g sucrose and 1 g sodium glutamate) with a starting concentration of OD600 = 0.03. For iron‐limited growth conditions, DP (a specific Fe2+ chelator) was added with final concentrations of 50, 100, 150 and 200 μm. The bacterial cultures were incubated at 28 ºC with shaking at 200 rpm. The growth of each strain was determined at 24 hpi by checking the OD600 value.
Cell extract preparation and catalase activity assay
The catalase activity assay was performed as described previously (Yan and Wang, 2011) with modifications. Briefly, Xac strains were cultured to stationary phase (24 hpi) in XVM2 broth. Cells were washed twice and re‐suspended in ice‐cold 50 mM potassium phosphate buffer (pH = 7.0) and then sonicated for 3 min with a sonicator (Misonix, Sonicator 3000 Newtown, CT, USA). The bacterial lysate was clarified by centrifugation at 13 000 g for 20 min at 4 ºC. The protein concentration was determined using a BCA protein assay kit (Novagen, San Diego, CA, USA). Catalase activity was measured spectrophotometrically by following the rate of decrease in absorbance at 240 nm caused by the decomposition of H2O2 (Beers and Sizer, 1952). The reaction was performed in 50 mm potassium phosphate buffer (pH = 7.0) containing 50 mM H2O2 at room temperature. The absorption coefficient at 240 nm for H2O2 was taken to be 43.6 m −1 cm−1 (Hildebrandt and Roots, 1975) to calculate the specific activity. One unit of catalase activity was defined as the amount of protein required to decompose 1 μmol H2O2/min under the assay conditions.
Extracellular enzymes activity and production of siderophore
Extracellular amylase and cellulase activity assays were performed as described previously with modifications (Andro et al., 1984; Yan and Wang, 2012). Bacterial cells were collected from the overnight cultures and re‐suspended in fresh XVM2 broth to give a final concentration of OD600 = 0.3. For extracellular amylase activity assay, 2 μL of the cell suspension were inoculated onto an XVM2 plate containing 1% (w/v) starch (Acros Organics, Fair Lawn, NJ, USA), and the plate was incubated at 28 ºC for 3 days. The plate was stained using Gram's iodine solution. A transparent halo surrounding the colony against the blue background of the plate indicated the secretion of extracellular amylase. For extracellular cellulase activity assay, 2 μL of the cell suspension were inoculated onto an XVM2 plate containing 0.5% (w/v) carboxymethyl cellulose sodium salt (Santa Cruz Biotechnology, Santa Cruz, CA, USA), and the plate was incubated at 28 ºC for 3 days. The plate was stained using 0.1% Congo Red. A transparent halo surrounding the colony against the red background of the plate indicated the secretion of extracellular cellulase. All assays were repeated three times with three replicates. Only one of the results was presented. To test the production of siderophore, 2 μL of the cell suspension were spot inoculated onto CAS medium (Schwyn and Neilands, 1987), and the plates were incubated for 6 days at 28 °C. The development of an orange halo around the bacterial colony indicated siderophore production. All experiments were repeated more than twice with three replicates each time.
QRT‐PCR
The gene‐specific primers used in QRT‐PCR are listed in Table S4. To assay bacterial gene expression in planta, cells were infiltrated into citrus leaves with an initial OD600 value of 0.6 and leaves were sampled at the corresponding time points. Total RNA was extracted directly from inoculated leaves. The RNA obtained was subjected to a one‐step QRT‐PCR assay with a 7500 fast real‐time PCR system (Applied Biosystems, Foster City, CA, USA) using a QuantiTect SYBR green RT‐PCR kit (Qiagen). The gyrB gene was used as an endogenous control. The relative fold change in target gene expression was calculated using the 2–ΔΔCT method (Livak and Schmittgen, 2001).
Plant inoculation and bacterial population
Pathogenicity assay on citrus and the measurement of the bacterial population were performed as described previously (Zhou et al., 2015). The induction of HR by Xac cells was performed on Nicotiana benthamiana as described previously (Zhou et al., 2015).
Electrophoretic mobility shift assay (EMSA)
The ytrA gene was cloned into pET‐28a. Protein was induced and purified according to the manufacturer's instructions (Ni‐NTA Agarose Kit, Qiagen). Probe oligonucleotides were synthesized by IDT, Inc (Coralville, IA, USA). DNA labelling was performed using a Pierce™ Biotin 3′ End DNA Labelling Kit (Thermo Fisher). EMSA was conducted using a LightShift™ Chemiluminescent EMSA Kit (Thermo Fisher, Waltham, MA, USA).
GUS assay
For the histochemical staining of Xac cells with 5‐bromo‐4‐chloro‐3‐indolyl‐β‐d‐glucuronide cyclohexylammonium salt (X‐Gluc), stationary cell cultures were adjusted to an OD600 of 1. Then, 1 mL of adjusted culture was pelleted and re‐suspended in staining solution containing phosphate‐buffered saline (PBS) with 10 mm ethylenediaminetetraacetic acid (EDTA), 0.1% Triton X‐100 and 2 mm X‐Gluc. Samples were incubated at 37 °C and photographed at specific time points. For measurement of GUS activity, 10 mL of cell cultures with OD600 = 1 were harvested and re‐suspended in PBS buffer in the presence of protease inhibitor cocktail Sigma‐Aldrich (St. Louis, MO, USA). Cells were lysed using sonication, and the cleared bacterial lysate was assayed for GUS activity. The total protein amount was determined using a Bio‐Rad protein assay kit (Bio‐Rad Laboratories, Hercules, CA, USA). A 1.5‐mL tube containing 800 μL of GUS assay buffer [50 mm PBS buffer, pH 7.0, 1 mm EDTA, 5 mm dithiothreitol (DTT), 1.25 mm p‐nitrophenyl‐β‐d‐glucuronide] and 200 μL of cell lysate was incubated at 37 °C. At the specific time points, a 25‐μL reaction aliquot was removed from each sample into a 96‐well plate containing 175 μL of stop solution (0.4 m Na2CO3). The absorbance was measured at 405 nm for each sample against a stopped blank reaction. The linear graph of OD405 (y‐axis) vs. time (x‐axis) was plotted and the slope S was characterized. The rate of reaction R (nm product/min/mg total protein) was calculated using the equation: R = S/(0.02 × 0.005 × protein concentration).
Supporting information
Additional Supporting Information may be found in the online version of this article at the publisher's website:
Fig. S1 Deletion analysis of YtrA downstream genes. The gene arrangement of ytrA and the downstream genes encoding a putative ABC transporter system are shown schematically. The single‐headed arrows represent the locations and orientations of the genes. The EZ‐Tn5 insertions in the mutant are indicated by inverted triangles. The location of each gene in the Xanthomonas citri ssp. citri 306 chromosome is indicated by numbers. The function domain was predicted by the SMART program (http://smart.emblheidelberg.de/). The relative expression change of the genes is indicated by the log2 fold change (FC) value (mutant/wild‐type, M/WT). The genes XAC1547, XAC1546 and XAC1545 were individually mutated by in‐frame deletion. The locations of the deleted fragments in the chromosome are shown by the black bars. The pathogenicity of the generated mutants was tested in grapefruit using a bacterial inoculum [around 106 colony‐forming units (cfu)/mL]. The inoculated leaf was photographed at 16 days post‐inoculation. The experiment was repeated three times with similar results.
Fig. S2 Phylogenetic tree of the ytrA gene family. The orthologous sequences from related genomes were extracted from the Kyoto Encyclopedia of Genes and Genomes Sequence Similarity Database (KEGG SSDB) database with default parameters. The amino acid sequences of the top 100 hits were selected and aligned using clustalW, and the phylogenetic tree was constructed using mega6 with the neighbour‐joining method. One thousand bootstrap replicates were made and bootstrap values greater than 50% are shown at each node. The scale bar indicates 5% amino acid sequence divergence.
Fig. S3 Functional classification of the differentially regulated genes based on the J. Craig Venter Institute (JCVI) database.
Fig. S4 YtrA is involved in swimming motility on a semi‐solid plate (A) and in biofilm formation in a glass tube (B). (A) Swimming motility assay. Bacterial strains were inoculated on a nutrient agar (NA) plate with 0.3% agar with a starting concentration at an optical density at 600 nm (OD600) of 0.3. The motility of each strain was monitored by measuring the diameter of the colony edge. The movement of cells was photographed at 4 days post‐inoculation. (B) One millilitre of bacterial solution [OD600 = 0.3 in nutrient broth (NB)] was incubated at 28 °C for 24 h in a glass tube without shaking. Biofilm formation was visualized by crystal violet staining. The stained cells were dissolved in 97% ethanol and quantified by measuring the OD590 value. The experiments were performed in triplicate and repeated three times with similar results. WT, wild‐type strain 306/p53; M, ytrA mutant/p53; MC, ytrA mutant/p53‐YtrA.
Fig. S5 YtrA controls catalase activity (A) and contributes to resistance against hydrogen peroxide (B). (A) Xanthomonas citri ssp. citri (Xac) strains were cultured for 24 h in plant‐mimic medium (XVM2). The crude cell extract was used to test catalase activity. (B) Strains were cultured for 24 h in XVM2. The bacterial population was adjusted to an optical density at 600 nm (OD600) of 0.3 and challenged with 20 mm hydrogen peroxide. The living cell population of each strain was examined at different time points. The experiments were performed in triplicate and repeated more than twice with similar results. WT, wild‐type strain 306/p53; M, YtrA mutant/p53; MC, ytrA mutant/p53‐YtrA. *Statistically significant difference between WT and M (P < 0.05, analysed by Student's two‐sample t‐test).
Fig. S6 YtrA positively regulates the production of extracellular amylase and cellulase. (A) Extracellular amylase activity assay. A transparent halo surrounding the colony against the blue background of the plate indicates the secretion of extracellular amylase. (B) Extracellular cellulase activity assay. A transparent halo surrounding the colony against the red background of the plate indicates the secretion of extracellular cellulase. The experiments were performed in triplicate and repeated three times with similar results. WT, wild‐type strain 306/p53; M, ytrA mutant/p53; MC, ytrA mutant/p53‐YtrA.
Fig. S7 YtrA regulates iron uptake in Xanthomonas citri ssp. citri. (A) Production of siderophore was tested on a chrome‐azurol S‐agar (CAS) plate. An orange halo around the colony indicates siderophore production. (B) The mutation of ytrA resulted in deficiency in growth under iron‐limited conditions. The final concentrations of 2,2′‐dipyridyl (DP) are shown. WT, wild‐type strain 306/p53; M, ytrA mutant/p53; MC, ytrA mutant/p53‐YtrA.
Fig. S8 YtrA DNA binding activity is required for bacterial virulence. (A) Protein sequence of the YtrA protein with predicted secondary structure. The helix–turn–helix motif is shown in bold. The conserved residues subjected to mutation are underlined and the mutated residues are shown in red. (B) Pathogenicity assay. Wild‐type 306, ytrA mutant and ytrA mutants expressing YtrA mutations were inoculated on citrus leaves with an initial concentration of 108 colony‐forming units (cfu/mL). Leaves were photographed at 3 days post‐inoculation. (C) Detection of expression of YtrA mutation proteins using immunoblotting.
Fig. S9 Mutation of promoters. (A) Schematic views of the native and mutated promoters selected from yro operons with their corresponding length fused with the β‐glucuronidase (GUS) reporter gene. (B) Mutations of half‐sites of palindromic sequences were confirmed by DNA sequencing. YtrA binding motifs are underlined. Red boxes indicate the mutated nucleotides.
Fig. S10 Over‐expression of XAC0230 or XAC0231 does not affect bacterial virulence. (A) Pathogenicity assay. Wild‐type 306 harbouring the empty vector, pTF53‐czcB, pTF53‐0231 and pTF53‐0230 were inoculated on citrus leaves with an initial concentration of 108 colony‐forming units (cfu)/mL. Leaves were photographed at 3 days post‐inoculation. (B) Detection of protein expression of XAC0231, XAC0230 and CzcB using immunoblotting.
Fig. S11 Bacterial growth in nutrient broth (NB) medium (A) and plant‐mimic medium (XVM2) (B).
Table S1 Strains and plasmids used in this study.
Table S2 Primers used in this study (underlining shows the restriction enzyme site).
Table S3 Summary of DEGs in microarray analysis.
Table S4 GntR binding motifs of three different operons in multiple bacterial species.
Acknowledgements
This study was partially supported by grants from the Florida Citrus Research and Development Foundation and the US Department of Agriculture‐National Institute of Food and Agriculture (USDA‐NIFA).
References
- Alfano, J.R. and Collmer, A. (2004) Type III secretion system effector proteins: double agents in bacterial disease and plant defense. Annu. Rev. Phytopathol. 42, 385–414. [DOI] [PubMed] [Google Scholar]
- An, S.Q. , Lu, G.T. , Su, H.Z. , Li, R.F. , He, Y.Q. , Jiang, B.L. , Tang, D.J. and Tang, J.L. (2011) Systematic mutagenesis of all predicted GntR genes in Xanthomonas campestris pv. campestris reveals a GntR family transcriptional regulator controlling hypersensitive response and virulence. Mol. Plant–Microbe Interact. 24, 1027–1039. [DOI] [PubMed] [Google Scholar]
- Andro, T. , Chambost, J.P. , Kotoujansky, A. , Cattaneo, J. , Bertheau, Y. , Barras, F. , Van Gijsegem, F. and Coleno, A. (1984) Mutants of Erwinia chrysanthemi defective in secretion of pectinase and cellulase. J. Bacteriol. 160, 1199–1203. [DOI] [PMC free article] [PubMed] [Google Scholar]
- Baptista, J.C. , Machado, M.A. , Homem, R.A. , Torres, P.S. , Vojnov, A.A. and do Amaral, A.M. (2010) Mutation in the xpsD gene of Xanthomonas axonopodis pv. citri affects cellulose degradation and virulence. Genet. Mol. Biol. 33, 146–153. [DOI] [PMC free article] [PubMed] [Google Scholar]
- Beers, R. and Sizer, I. (1952) A spectrophotometric method for measuring the breakdown of hydrogen peroxide by catalase. J. Biol. Chem. 195, 133–140. [PubMed] [Google Scholar]
- Benitez‐Paez, A. , Villarroya, M. , Douthwaite, S. , Gabaldon, T. and Armengod, M.E. (2010) YibK is the 2′‐O‐methyltransferase TrmL that modifies the wobble nucleotide in Escherichia coli tRNA(Leu) isoacceptors. RNA, 16, 2131–2143. [DOI] [PMC free article] [PubMed] [Google Scholar]
- Benjamini, Y. and Hochberg, Y. (1995) Controlling the false discovery rate: a practical and powerful approach to multiple testing. J. R. Stat. Soc. B. Met. 57, 289–300. [Google Scholar]
- Buttner, D. (2012) Protein export according to schedule: architecture, assembly, and regulation of type III secretion systems from plant‐ and animal‐pathogenic bacteria. Microbiol. Mol. Biol. Rev. 76, 262–310. [DOI] [PMC free article] [PubMed] [Google Scholar]
- Buttner, D. and He, S.Y. (2009) Type III protein secretion in plant pathogenic bacteria. Plant Physiol. 150, 1656–1664. [DOI] [PMC free article] [PubMed] [Google Scholar]
- Casabuono, A. , Petrocelli, S. , Ottado, J. , Orellano, E.G. and Couto, A.S. (2011) Structural analysis and involvement in plant innate immunity of Xanthomonas axonopodis pv. citri lipopolysaccharide. J. Biol. Chem. 286, 25 628–25 643. [DOI] [PMC free article] [PubMed] [Google Scholar]
- Cho, K.H. and Caparon, M.G. (2008) tRNA modification by GidA/MnmE is necessary for Streptococcus pyogenes virulence: a new strategy to make live attenuated strains. Infect. Immun. 76, 3176–3186. [DOI] [PMC free article] [PubMed] [Google Scholar]
- Dunger, G. , Arabolaza, A. , Gottig, N. , Orellano, E. and Ottado, J. (2005) Participation of Xanthomonas axonopodis pv. citri hrp cluster in citrus canker and nonhost plant responses. Plant Pathol. 54, 781–788. [Google Scholar]
- Durand, J.M. , Dagberg, B. , Uhlin, B.E. and Bjork, G.R. (2000) Transfer RNA modification, temperature and DNA superhelicity have a common target in the regulatory network of the virulence of Shigella flexneri: the expression of the virF gene. Mol. Microbiol. 35, 924–935. [DOI] [PubMed] [Google Scholar]
- Galan, J.E. , Lara‐Tejero, M. , Marlovits, T.C. and Wagner, S. (2014) Bacterial type III secretion systems: specialized nanomachines for protein delivery into target cells. Annu. Rev. Microbiol. 68, 415–438. [DOI] [PMC free article] [PubMed] [Google Scholar]
- Gentleman, R.C. , Carey, V.J. , Bates, D.M. , Bolstad, B. , Dettling, M. , Dudoit, S. , Ellis, B. , Gautier, L. , Ge, Y. and Gentry, J. (2004) Bioconductor: open software development for computational biology and bioinformatics. Genome Biol. 5, R80. [DOI] [PMC free article] [PubMed] [Google Scholar]
- Guo, Y. , Figueiredo, J.F. , Jones, J. and Wang, N. (2011) HrpG, together with HrpX, play global roles in coordinating different virulence traits of Xanthomonas axonopodis pv. citri . Mol. Plant–Microbe Interact. 24, 649–661. [DOI] [PubMed] [Google Scholar]
- Guo, Y. , Zhang, Y. , Li, J.L. and Wang, N. (2012) Diffusible signal factor‐mediated quorum sensing plays a central role in coordinating gene expression of Xanthomonas citri subsp. citri . Mol. Plant–Microbe Interact. 25, 165. [DOI] [PubMed] [Google Scholar]
- Hammond‐Kosack, K.E. and Jones, J.D. (1996) Resistance gene‐dependent plant defense responses. Plant Cell, 8, 1773–1791. [DOI] [PMC free article] [PubMed] [Google Scholar]
- Haydon, D.J. and Guest, J.R. (1991) A new family of bacterial regulatory proteins. FEMS Microbiol. Lett. 63, 291–295. [DOI] [PubMed] [Google Scholar]
- Hildebrandt, A. and Roots, I. (1975) Reduced nicotinamide adenine dinucleotide phosphate (NADPH)‐dependent formation and breakdown of hydrogen peroxide during mixed function oxidation reactions in liver microsomes. Arch. Biochem. Biophys. 171, 385–397. [DOI] [PubMed] [Google Scholar]
- Hoskisson, P.A. and Rigali, S. (2009) Chapter 1: variation in form and function of the helix‐turn‐helix regulators of the GntR superfamily. Adv. Appl. Microbiol. 69, 1–22. [DOI] [PubMed] [Google Scholar]
- Kinscherf, T.G. and Willis, D.K. (2002) Global regulation by gidA in Pseudomonas syringae . J. Bacteriol. 184, 2281–2286. [DOI] [PMC free article] [PubMed] [Google Scholar]
- Konig, B. , Muller, J.J. , Lanka, E. and Heinemann, U. (2009) Crystal structure of KorA bound to operator DNA: insight into repressor cooperation in RP4 gene regulation. Nucleic Acids Res. 37, 1915–1924. [DOI] [PMC free article] [PubMed] [Google Scholar]
- Laia, M. , Moreira, L. , Dezajacomo, J. , Brigati, J. , Ferreira, C. , Ferro, M. , Silva, A. , Ferro, J. and Oliveira, J. (2009) New genes of Xanthomonas citri subsp. citri involved in pathogenesis and adaptation revealed by a transposon‐based mutant library. BMC Microbiol. 9, 12. [DOI] [PMC free article] [PubMed] [Google Scholar]
- Li, H. and Durbin, R. (2009) Fast and accurate short read alignment with Burrows–Wheeler transform. Bioinformatics, 25, 1754–1760. [DOI] [PMC free article] [PubMed] [Google Scholar]
- Li, J. and Wang, N. (2011) The wxacO gene of Xanthomonas citri subsp. citri encodes a protein with a role in lipopolysaccharide biosynthesis, biofilm formation, stress tolerance and virulence. Mol. Plant Pathol. 12, 381–396. [DOI] [PMC free article] [PubMed] [Google Scholar]
- Li, R.F. , Lu, G.T. , Li, L. , Su, H.Z. , Feng, G.F. , Chen, Y. , He, Y.Q. , Jiang, B.L. , Tang, D.J. and Tang, J.L. (2014) Identification of a putative cognate sensor kinase for the two‐component response regulator HrpG, a key regulator controlling the expression of the hrp genes in Xanthomonas campestris pv. campestris. Environ. Microbiol. 16, 2053–2071. [DOI] [PubMed] [Google Scholar]
- Lin, H.C. , Hsu, S.T. , Chang, H. and Tzeng, K.C. (2010) A pectate lyase homologue Pel1 from Xanthomonas axonopodis pv. citri is associated with the water‐soaked margins of canker lesions. J. Plant Pathol. 92, 149–156. [Google Scholar]
- Litwin, C.M. and Calderwood, S.B. (1993) Role of iron in regulation of virulence genes. Clin. Microbiol. Rev. 6, 137–149. [DOI] [PMC free article] [PubMed] [Google Scholar]
- Liu, R.J. , Zhou, M. , Fang, Z.P. , Wang, M. , Zhou, X.L. and Wang, E.D. (2013) The tRNA recognition mechanism of the minimalist SPOUT methyltransferase, TrmL. Nucleic Acids Res. 41, 7828–7842. [DOI] [PMC free article] [PubMed] [Google Scholar]
- Livak, K. and Schmittgen, T. (2001) Analysis of relative gene expression data using real‐time quantitative PCR and the 2‐DeltaDeltaCT method. Methods, 25, 402–408. [DOI] [PubMed] [Google Scholar]
- Mahony, S. and Pugh, B.F. (2015) Protein–DNA binding in high‐resolution. Crit. Rev. Biochem. Mol. Biol. 50, 269–283. [DOI] [PMC free article] [PubMed] [Google Scholar]
- Nies, D.H. (2003) Efflux‐mediated heavy metal resistance in prokaryotes. FEMS Microbiol. Rev. 27, 313–339. [DOI] [PubMed] [Google Scholar]
- Pabo, C.O. and Sauer, R.T. (1992) Transcription factors: structural families and principles of DNA recognition. Annu. Rev. Biochem. 61, 1053–1095. [DOI] [PubMed] [Google Scholar]
- Pandey, A. and Sonti, R.V. (2010) Role of the FeoB protein and siderophore in promoting virulence of Xanthomonas oryzae pv. oryzae on rice. J. Bacteriol. 192, 3187–3203. [DOI] [PMC free article] [PubMed] [Google Scholar]
- Reja, R. , Vinayachandran, V. , Ghosh, S. and Pugh, B.F. (2015) Molecular mechanisms of ribosomal protein gene coregulation. Genes Dev. 29, 1942–1954. [DOI] [PMC free article] [PubMed] [Google Scholar]
- Rhee, H.S. and Pugh, B.F. (2011) Comprehensive genome‐wide protein–DNA interactions detected at single‐nucleotide resolution. Cell, 147, 1408–1419. [DOI] [PMC free article] [PubMed] [Google Scholar]
- Rhee, H.S. and Pugh, B.F. (2012) ChIP‐exo method for identifying genomic location of DNA‐binding proteins with near‐single‐nucleotide accuracy. Curr. Protoc. Mol. Biol. 100. doi:10.1002/0471142727.mb2124s100. [DOI] [PMC free article] [PubMed] [Google Scholar]
- Rigali, S. , Derouaux, A. , Giannotta, F. and Dusart, J. (2002) Subdivision of the helix‐turn‐helix GntR family of bacterial regulators in the FadR, HutC, MocR, and YtrA subfamilies. J. Biol. Chem. 277, 12 507–12 515. [DOI] [PubMed] [Google Scholar]
- Rigano, L. , Siciliano, F. , Enrique, R. , Sendín, L. , Filippone, P. , Torres, P. , Qüesta, J. , Dow, J. , Castagnaro, A. and Vojnov, A. (2007) Biofilm formation, epiphytic fitness, and canker development in Xanthomonas axonopodis pv. citri . Mol. Plant–Microbe Interact. 20, 1222–1230. [DOI] [PubMed] [Google Scholar]
- Rodionov, D.A. (2007) Comparative genomic reconstruction of transcriptional regulatory networks in bacteria. Chem. Rev. 107, 3467–3497. [DOI] [PMC free article] [PubMed] [Google Scholar]
- Salzberg, L.I. , Luo, Y. , Hachmann, A.B. , Mascher, T. and Helmann, J.D. (2011) The Bacillus subtilis GntR family repressor YtrA responds to cell wall antibiotics. J. Bacteriol. 193, 5793–5801. [DOI] [PMC free article] [PubMed] [Google Scholar]
- Schwyn, B. and Neilands, J.B. (1987) Universal chemical assay for the detection and determination of siderophores. Anal. Biochem. 160, 47–56. [DOI] [PubMed] [Google Scholar]
- Shippy, D.C. and Fadl, A.A. (2015) RNA modification enzymes encoded by the gid operon: implications in biology and virulence of bacteria. Microb. Pathog. 89, 100–107. [DOI] [PubMed] [Google Scholar]
- Shippy, D.C. , Eakley, N.M. , Lauhon, C.T. , Bochsler, P.N. and Fadl, A.A. (2013) Virulence characteristics of Salmonella following deletion of genes encoding the tRNA modification enzymes GidA and MnmE. Microb. Pathog. 57, 1–9. [DOI] [PubMed] [Google Scholar]
- Stahler, F.N. , Odenbreit, S. , Haas, R. , Wilrich, J. , Van Vliet, A.H. , Kusters, J.G. , Kist, M. and Bereswill, S. (2006) The novel Helicobacter pylori CznABC metal efflux pump is required for cadmium, zinc, and nickel resistance, urease modulation, and gastric colonization. Infect. Immun. 74, 3845–3852. [DOI] [PMC free article] [PubMed] [Google Scholar]
- Suvorova, I.A. , Korostelev, Y.D. and Gelfand, M.S. (2015) GntR family of bacterial transcription factors and their DNA binding motifs: structure, positioning and co‐evolution. PLoS One, 10, e0132618. [DOI] [PMC free article] [PubMed] [Google Scholar]
- Swarup, S. , Yang, Y. , Kingsley, M. and Gabriel, D. (1992) An Xanthomonas citri pathogenicity gene, pthA, pleiotropically encodes gratuitous avirulence on nonhosts. Mol. Plant–Microbe Interact. 5, 204–213. [DOI] [PubMed] [Google Scholar]
- Tondo, M.L. , Petrocelli, S. , Ottado, J. and Orellano, E.G. (2010) The monofunctional catalase KatE of Xanthomonas axonopodis pv. citri is required for full virulence in citrus plants. PLoS One, 5, e10803. [DOI] [PMC free article] [PubMed] [Google Scholar]
- Venter, H. , Mowla, R. , Ohene‐Agyei, T. and Ma, S. (2015) RND‐type drug efflux pumps from Gram‐negative bacteria: molecular mechanism and inhibition. Front. Microbiol. 6, 377. [DOI] [PMC free article] [PubMed] [Google Scholar]
- Vila, J. , Marti, S. and Sanchez‐Cespedes, J. (2007) Porins, efflux pumps and multidrug resistance in Acinetobacter baumannii . J. Antimicrob. Chemother. 59, 1210–1215. [DOI] [PubMed] [Google Scholar]
- Vindal, V. , Suma, K. and Ranjan, A. (2007) GntR family of regulators in Mycobacterium smegmatis: a sequence and structure based characterization. BMC Genomics, 8, 289. [DOI] [PMC free article] [PubMed] [Google Scholar]
- Yamazaki, A. , Hirata, H. and Tsuyumu, S. (2008) Type III regulators HrpG and HrpXct control synthesis of α‐amylase, which is involved in in planta multiplication of Xanthomonas axonopodis pv. citri . J. Gen. Plant. Pathol. 74, 254–257. [Google Scholar]
- Yan, Q. and Wang, N. (2011) The ColR/ColS two‐component system plays multiple roles in the pathogenicity of the citrus canker pathogen Xanthomonas citri subsp. citri . J. Bacteriol. 193, 1590–1599. [DOI] [PMC free article] [PubMed] [Google Scholar]
- Yan, Q. and Wang, N. (2012) High‐throughput screening and analysis of genes of Xanthomonas citri subsp. citri involved in citrus canker symptom development. Mol. Plant–Microbe Interact. 25, 69–84. [DOI] [PubMed] [Google Scholar]
- Yan, Q. , Hu, X. and Wang, N. (2012) The novel virulence‐related gene nlxA in the lipopolysaccharide cluster of Xanthomonas citri ssp. citri is involved in the production of lipopolysaccharide and extracellular polysaccharide, motility, biofilm formation and stress resistance. Mol. Plant. Pathol. 13, 923–934 [DOI] [PMC free article] [PubMed] [Google Scholar]
- Zhou, X. , Hu, X. , Li, J. and Wang, N. (2015) A novel periplasmic protein, VrpA, contributes to efficient protein secretion by the type III secretion system in Xanthomonas spp. Mol. Plant–Microbe Interact. 28, 143–153. [DOI] [PubMed] [Google Scholar]
Associated Data
This section collects any data citations, data availability statements, or supplementary materials included in this article.
Supplementary Materials
Additional Supporting Information may be found in the online version of this article at the publisher's website:
Fig. S1 Deletion analysis of YtrA downstream genes. The gene arrangement of ytrA and the downstream genes encoding a putative ABC transporter system are shown schematically. The single‐headed arrows represent the locations and orientations of the genes. The EZ‐Tn5 insertions in the mutant are indicated by inverted triangles. The location of each gene in the Xanthomonas citri ssp. citri 306 chromosome is indicated by numbers. The function domain was predicted by the SMART program (http://smart.emblheidelberg.de/). The relative expression change of the genes is indicated by the log2 fold change (FC) value (mutant/wild‐type, M/WT). The genes XAC1547, XAC1546 and XAC1545 were individually mutated by in‐frame deletion. The locations of the deleted fragments in the chromosome are shown by the black bars. The pathogenicity of the generated mutants was tested in grapefruit using a bacterial inoculum [around 106 colony‐forming units (cfu)/mL]. The inoculated leaf was photographed at 16 days post‐inoculation. The experiment was repeated three times with similar results.
Fig. S2 Phylogenetic tree of the ytrA gene family. The orthologous sequences from related genomes were extracted from the Kyoto Encyclopedia of Genes and Genomes Sequence Similarity Database (KEGG SSDB) database with default parameters. The amino acid sequences of the top 100 hits were selected and aligned using clustalW, and the phylogenetic tree was constructed using mega6 with the neighbour‐joining method. One thousand bootstrap replicates were made and bootstrap values greater than 50% are shown at each node. The scale bar indicates 5% amino acid sequence divergence.
Fig. S3 Functional classification of the differentially regulated genes based on the J. Craig Venter Institute (JCVI) database.
Fig. S4 YtrA is involved in swimming motility on a semi‐solid plate (A) and in biofilm formation in a glass tube (B). (A) Swimming motility assay. Bacterial strains were inoculated on a nutrient agar (NA) plate with 0.3% agar with a starting concentration at an optical density at 600 nm (OD600) of 0.3. The motility of each strain was monitored by measuring the diameter of the colony edge. The movement of cells was photographed at 4 days post‐inoculation. (B) One millilitre of bacterial solution [OD600 = 0.3 in nutrient broth (NB)] was incubated at 28 °C for 24 h in a glass tube without shaking. Biofilm formation was visualized by crystal violet staining. The stained cells were dissolved in 97% ethanol and quantified by measuring the OD590 value. The experiments were performed in triplicate and repeated three times with similar results. WT, wild‐type strain 306/p53; M, ytrA mutant/p53; MC, ytrA mutant/p53‐YtrA.
Fig. S5 YtrA controls catalase activity (A) and contributes to resistance against hydrogen peroxide (B). (A) Xanthomonas citri ssp. citri (Xac) strains were cultured for 24 h in plant‐mimic medium (XVM2). The crude cell extract was used to test catalase activity. (B) Strains were cultured for 24 h in XVM2. The bacterial population was adjusted to an optical density at 600 nm (OD600) of 0.3 and challenged with 20 mm hydrogen peroxide. The living cell population of each strain was examined at different time points. The experiments were performed in triplicate and repeated more than twice with similar results. WT, wild‐type strain 306/p53; M, YtrA mutant/p53; MC, ytrA mutant/p53‐YtrA. *Statistically significant difference between WT and M (P < 0.05, analysed by Student's two‐sample t‐test).
Fig. S6 YtrA positively regulates the production of extracellular amylase and cellulase. (A) Extracellular amylase activity assay. A transparent halo surrounding the colony against the blue background of the plate indicates the secretion of extracellular amylase. (B) Extracellular cellulase activity assay. A transparent halo surrounding the colony against the red background of the plate indicates the secretion of extracellular cellulase. The experiments were performed in triplicate and repeated three times with similar results. WT, wild‐type strain 306/p53; M, ytrA mutant/p53; MC, ytrA mutant/p53‐YtrA.
Fig. S7 YtrA regulates iron uptake in Xanthomonas citri ssp. citri. (A) Production of siderophore was tested on a chrome‐azurol S‐agar (CAS) plate. An orange halo around the colony indicates siderophore production. (B) The mutation of ytrA resulted in deficiency in growth under iron‐limited conditions. The final concentrations of 2,2′‐dipyridyl (DP) are shown. WT, wild‐type strain 306/p53; M, ytrA mutant/p53; MC, ytrA mutant/p53‐YtrA.
Fig. S8 YtrA DNA binding activity is required for bacterial virulence. (A) Protein sequence of the YtrA protein with predicted secondary structure. The helix–turn–helix motif is shown in bold. The conserved residues subjected to mutation are underlined and the mutated residues are shown in red. (B) Pathogenicity assay. Wild‐type 306, ytrA mutant and ytrA mutants expressing YtrA mutations were inoculated on citrus leaves with an initial concentration of 108 colony‐forming units (cfu/mL). Leaves were photographed at 3 days post‐inoculation. (C) Detection of expression of YtrA mutation proteins using immunoblotting.
Fig. S9 Mutation of promoters. (A) Schematic views of the native and mutated promoters selected from yro operons with their corresponding length fused with the β‐glucuronidase (GUS) reporter gene. (B) Mutations of half‐sites of palindromic sequences were confirmed by DNA sequencing. YtrA binding motifs are underlined. Red boxes indicate the mutated nucleotides.
Fig. S10 Over‐expression of XAC0230 or XAC0231 does not affect bacterial virulence. (A) Pathogenicity assay. Wild‐type 306 harbouring the empty vector, pTF53‐czcB, pTF53‐0231 and pTF53‐0230 were inoculated on citrus leaves with an initial concentration of 108 colony‐forming units (cfu)/mL. Leaves were photographed at 3 days post‐inoculation. (B) Detection of protein expression of XAC0231, XAC0230 and CzcB using immunoblotting.
Fig. S11 Bacterial growth in nutrient broth (NB) medium (A) and plant‐mimic medium (XVM2) (B).
Table S1 Strains and plasmids used in this study.
Table S2 Primers used in this study (underlining shows the restriction enzyme site).
Table S3 Summary of DEGs in microarray analysis.
Table S4 GntR binding motifs of three different operons in multiple bacterial species.