Summary
Verticillium wilt (VW) is a fungal disease that causes severe yield losses in alfalfa. The most effective method to control the disease is through the development and use of resistant varieties. The identification of marker loci linked to VW resistance can facilitate breeding for disease‐resistant alfalfa. In the present investigation, we applied an integrated framework of genome‐wide association with genotyping‐by‐sequencing (GBS) to identify VW resistance loci in a panel of elite alfalfa breeding lines. Phenotyping was performed by manual inoculation of the pathogen to healthy seedlings, and scoring for disease resistance was carried out according to the standard test of the North America Alfalfa Improvement Conference (NAAIC). Marker–trait association by linkage disequilibrium identified 10 single nucleotide polymorphism (SNP) markers significantly associated with VW resistance. Alignment of the SNP marker sequences to the M. truncatula genome revealed multiple quantitative trait loci (QTLs). Three, two, one and five markers were located on chromosomes 5, 6, 7 and 8, respectively. Resistance loci found on chromosomes 7 and 8 in the present study co‐localized with the QTLs reported previously. A pairwise alignment (blastn) using the flanking sequences of the resistance loci against the M. truncatula genome identified potential candidate genes with putative disease resistance function. With further investigation, these markers may be implemented into breeding programmes using marker‐assisted selection, ultimately leading to improved VW resistance in alfalfa.
Keywords: fungal disease, genotyping‐by‐sequencing, linkage disequilibrium, marker‐assisted selection, quantitative trait loci
Introduction
Verticillium wilt (VW) of alfalfa (Medicago sativa L.) is a soil‐borne disease caused by the fungal pathogen Verticillium alfalfae (renormalized by Inderbitzin et al., 2011). VW causes severe yield losses in alfalfa production in the USA and Canada (Atkinson, 1981; Gordon et al., 1989; Graham et al., 1977; Grau et al., 1981; Gray and Roth, 1982). Disease symptoms start with leaf tip chlorosis, leaf desiccation and abscission; as the disease progresses, infected plants eventually wilt and senesce prematurely (Leath and Pennypacker, 1990). Agronomic practices, including the eradication of alternative host species, such as broadleaf weeds, together with crop rotation, may be used to control the disease (Leath and Pennypacker, 1990). However, as a result of other biotic and abiotic dispersal mechanisms, including insects, manure, wind and water, agronomic control strategies alone may not be sufficiently efficacious. The preferred method for control of the disease is through the development and use of resistant varieties (Leath and Pennypacker, 1990; Peaden et al., 1985).
Efforts to develop VW‐resistant alfalfa cultivars have focused on traditional breeding methods (Acharya and Huang, 2003).The traditional approach to the selection of resistant individuals is based on plant reaction to the disease (Delwiche, 1991). However, the effect of environmental factors on disease expression leads to difficulty in the accurate screening of alfalfa for resistance to VW. The development and application of molecular markers linked to the disease resistance gene(s) would augment such traditional phenotype‐based approaches (Gupta et al., 1999).
Plant resistance to diseases can be controlled by major, race‐specific, host–pathogen recognition genes or multiple additive minor genes (Knepper and Day, 2010). Sources of resistance based on multiple additive genes, often termed quantitative resistance, may provide more durable resistance (McDonald and Linde, 2002). In alfalfa, quantitative trait loci (QTLs) associated with resistance to several diseases, including Stagonospora leaf spot and root rot (Stagonospora meliloti) (Musial et al., 2007) and anthracnose (Colletotrichum trifolii) (Mackie et al., 2007; Yang et al., 2008), have been reported. Other quantitative traits, such as abiotic stress resistance and morphological characterizations, have also been reported (Brouwer et al., 2000; Robins et al., 2007).
The genetic basis of VW resistance in alfalfa has been investigated. Viands (1985) compared the inheritance of VW resistance in alfalfa plants selected from European cultivars, and found that a major dominant gene controls resistance in cultivar ‘Maris Kabul’, whereas more complex additive effects exist in cultivar ‘Vertus’. Larsen et al. (2007) developed a real‐time polymerase chain reaction (PCR) procedure to quantify the amount of V. alfalfae in plant materials, and found significant quantitative differences in the pathogen load between VW‐resistant and VW‐susceptible cultivars. Our previous investigation applied single nucleotide polymorphism (SNP)‐derived markers to identify multiple loci significantly associated with VW resistance in alfalfa by bulked segregant analysis in susceptible or resistant pools constructed from 13 synthetic populations, and by high‐resolution melting in two F1 populations consisting of 352 individuals (Zhang et al., 2014). Multiple loci at different chromosomal positions of the associated markers suggested that VW resistance is most likely under the control of multiple genes in these alfalfa populations.
Recent advances in next‐generation sequencing and bioinformatics have led to the identification of a number of SNP markers in alfalfa and the development of reliable assays to determine allelic dosage in tetraploid species at higher density and throughput than the high‐resolution melting curve method (Han et al., 2011; Li and Brummer, 2012; Yang et al., 2011).
The use of an integrated framework that merges genome‐wide association (GWA) QTL mapping with genotyping‐by‐sequencing (GBS) provides a statistical basis for the analysis of marker–trait association using linkage disequilibrium. With this approach, traits can be mapped quickly, efficiently and in a relatively inexpensive manner in breeding populations or accessions of germplasm with a wide range of variation. To advance our knowledge, in the present study, we applied GWA and GBS for the identification of loci associated with VW resistance at the genome‐wide level in a panel of elite alfalfa breeding lines.
Results
Analysis of phenotypic data
As described in Experimental Procedures, a panel containing 179 breeding lines of alfalfa from three breeding programmes (subpopulations) was used in this study (Table S2, see Supporting Information). For the phenotyping of VW resistance, the foliar symptoms of individual plants were evaluated after pathogen inoculation in the glasshouse and scored for VW resistance. The resistance rate was calculated for 90 plants in each line. The P value for equality of variances (Levene's test) was more than 0.05, suggesting that no significant difference in variance was obtained (Table 1). However, the t‐test for equality was significant (P < 0.05). A normal distribution with a mean of 0.552 and a standard error of 0.093 was observed (Shapiro–Wilk test, Fig. 1, Table 1). Distributions of the least‐square means of the VW resistance rate in each of the three subpopulations are presented in Fig. S1 (see Supporting Information).
Table 2.
Most significant single nucleotide polymorphism (SNP) markers associated with Verticillium wilt resistance in the Forage Genetics International panel.
| Marker ID | Reference | Variants | Chr | P value | R 2 | Candidate genes |
|---|---|---|---|---|---|---|
| S5_40754497 | A | C | 5 | 4.47E‐04 | 0.11 | TMP |
| S5_40754542 | C | T | 5 | 4.50E‐04 | 0.11 | TMP |
| S5_40754556 | AC | GA, AA | 5 | 1.90E‐04 | 0.09 | TMP |
| contig_92284_538 | TTTTC | CTCTC, CTTTA, CTTTC | 6* | 1.34E‐04 | 0.10 | TIR‐NBS‐LRR |
| contig_67844_1658 | AC | GG, AG | 6* | 2.64E‐04 | 0.10 | NCR |
| S7_708932 | TAGA | CAGG, CAGA | 7 | 3.35E‐04 | 0.10 | PAT1 |
| S8_15421844 | T | C | 8 | 6.15E‐05 | 0.12 | TIR‐NBS‐LRR |
| S8_15870197 | C | T | 8 | 2.20E‐04 | 0.11 | LYST |
| S8_15870215 | CTT | CTTT | 8 | 8.59E‐05 | 0.14 | LYST |
| S8_15870225 | GGTTAATA | AGTTCATT, AGTTCATA, AGTTAATA | 8 | 2.05E‐04 | 0.09 | LYST |
TMP, putative transmembrane protein; PAT1, Scarecrow‐like transcription factor PAT1; TIR‐NBS‐LRR, toll interleukin‐1 receptor‐nucleotide‐binding site‐leucine‐rich repeat protein; NCR, Nodule Cysteine‐Rich (NCR) secreted peptide; LYST, lysosomal trafficking regulator LYST; Chr, marker aligned to Medicago truncatula chromosomes. *Marker position was reassigned based on the homologues by blast search against the M. truncatula genome sequences (Mt4.0 v01). Underlined markers on chromosomes 5 and 8 are closely linked and mapped to the same locus per chromosome. The marker ID numbers refer to the chromosomal positions of the first SNP site of the corresponding markers.
Table 1.
Levene's test, t‐test and the normal distribution of Kolmogorov–Smirnov and Shapiro–Wilk tests.
| Population | n | Mean | Standard error | Levene's test for equality of variances | t‐test for equality of means |
| FGI | 179 | 0.552 | 0.093 | P = 0.095 | P = 0.001 |
| Population | n | Kolmogorov–Smirnov Z | P value | Shapiro–Wilk | P value |
| FGI | 179 | W = 0.632 | 0.820 | D = 0.993 | 0.506 |
FGI, Forage Genetics International; n, number of individuals.
Figure 1.
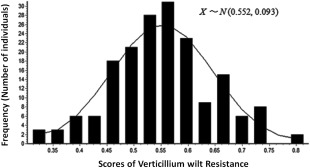
Phenotypic evaluations of Verticillium wilt resistance in 179 alfalfa breeding lines using a 1–5 scale. Resistance scores were normalized as resistance rate = resistant plants (scored 1 or 2)/total plants (scored 1–5). Phenotypic data from three replications were analysed using a mixed model, and least‐square means were calculated and normal distributions were obtained for the trait. The total mean and standard error values were 0.552 and 0.093, respectively.
Genotype calls and allele frequencies
As alfalfa is an autotetraploid species, each locus may have up to five genotypes (AAAA, AAAB, AABB, ABBB and BBBB). To overcome this complexity, we used a haplotype‐based genotype calling in this experiment (see Experimental Procedures). In total, 169 008 polymorphisms were identified, with a minimum of one alternate count in one individual. To be assigned a valid genotype call for a specific variant position, a variant on the basis of read depth (minimum of 15 reads/variant) and QUAL > 20 at that position was required. Among the called genotypes, 19 801 variants were valid. We calculated population‐level allele frequencies for all valid calls (19 801). The minor allele frequencies (MAFs) had an L‐shaped distribution (Fig. 2). The average MAF was 0.14; 27.6% of all variants had MAF < 0.01 and 53.5% had MAF > 0.05. The heterozygosity showed a bimodal distribution with two peaks towards 0.1 and 0.5 (Fig. 3). The mean heterozygosity of the variants was 0.36. We found 19.1% variants with a heterozygosity greater than 0.5 and 4.9% variants with a heterozygosity less than 0.1.
Figure 2.
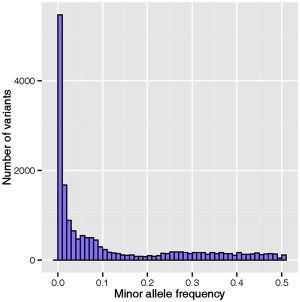
Distribution of minor allele frequency (MAF) of valid variant calls by genotyping‐by‐sequencing.
Figure 3.
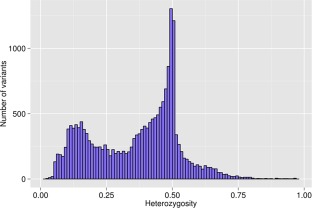
Distribution of heterozygosity of valid variants generated by genotyping‐by‐sequencing in the Forage Genetics International populations. Number of variants and portion of heterozygosity are shown by bars.
Validated SNP markers were analysed by aligning their flanking sequences to the M. truncatula genome (Mt4.0 v1) (http://phytozome.jgi.doe.gov/pz/portal.html). Of 19 801 markers, only 12 938, or 65%, could be positioned on the physical map. The remaining 6863 markers were homologous to different contigs of unknown chromosomal position. The distribution of the 12 938 mapped markers is presented in Fig. 4, with details in Table S1 (see Supporting Information). Among the eight chromosomes, chromosome 5 showed the highest density and chromosome 4 had the greatest length (48 Mb) (Fig. 4). The lowest marker density (983) was found on chromosome 6, with the relative genome range of 0–24 Mb (Fig. 4 and Table S1).
Figure 4.
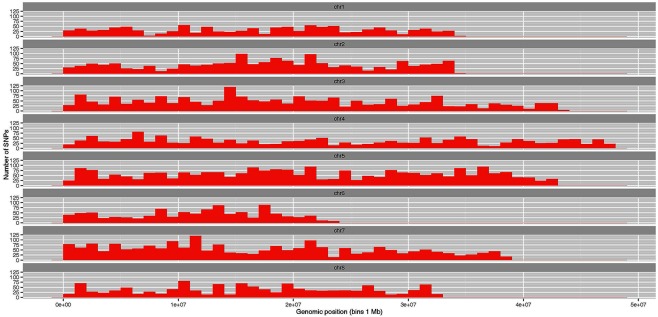
Distribution of single nucleotide polymorphisms (SNPs) across eight chromosomes based on the alignment of target sequences to the reference genome of Medicago truncatula (Mt4.0 v1). Numbers of SNPs (variants) at relative genomic positions are presented by bars with a bin size of 1 Mb.
Population structure
Principal component analysis revealed three major groups corresponding to each of the three breeding programmes [Midwest (MW), Pacific Northwest (PNW) and California (CA)] from which the lines were selected (Fig. 5, clusters 1, 2 and 3, respectively). Interestingly, nine lines from the CA subpopulation formed the fourth minor cluster, which may reflect a low level of intercrossing between autumn‐dormant and non‐dormant breeding programmes in the trait development process.
Figure 5.
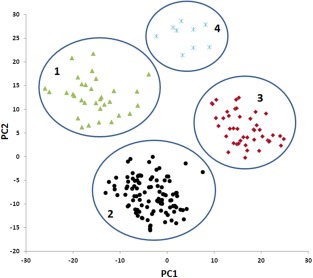
Principal component analysis (PCA) of 179 alfalfa lines (each represented as a data point) using the marker data generated by genotyping‐by‐sequencing (GBS). The first and second principal components (PC1 and PC2) were used to construct the scatter plot. Each data point represents a genotype. Clusters 1, 2 and 3 contain lines from breeding programmes Midwest (MW), Pacific Northwest (PNW) and California (CA), respectively. Cluster 4 contains nine lines diverged from CA.
Marker–trait association
We identified 10 SNP markers significantly associated with VW resistance in the Forage Genetics International (FGI) populations (Fig. 6 and Table 2). Of these 10 SNP markers, three (S5_40754556, S5_40754497 and S5_40754542) were closely linked on chromosome 5, another three (S8_15870197, S8_15870215 and S8_15870225) were closely linked on chromosome 8 and a fourth independent marker (S8_15421844) was also detected on chromosome 8. Only one marker, S7_708932, was identified on chromosome 7. Additional markers were also significantly associated with VW (Table 2). Their chromosomal locations were unknown during the initial alignment (Fig. 6, unknown region). However, when their flanking sequences were queried in a pairwise alignment (blastn) against the M. truncatula genome sequence (Mt4.0 v1) (http://phytozome.jgi.doe.gov/pz/portal.html), we found that both contig_67844_1658 and contig_92284_538 were highly homologous to the sequence fragments on chromosome 6 at loci chr6:5069601‐5069821 and chr6:13719998‐13720218, respectively. Therefore, we reassigned them to chromosome 6 (Table 2, marked with an asterisk).
Figure 6.
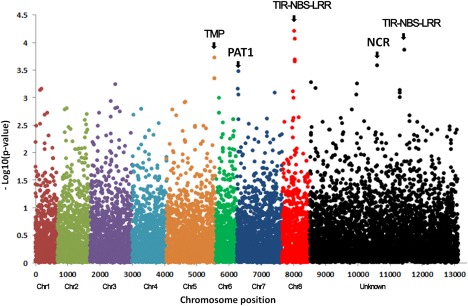
Manhattan plot displaying the results of genome‐wide association (GWA) mapping for Verticillium wilt resistance in the Forage Genetics International populations. Each dot represents a single nucleotide polymorphism (SNP). A false discovery rate of 5% was used for significant cut‐off. Significant markers above the cut‐off value of –log P = 3.5 were identified to be associated with Verticillium wilt (VW) resistance and are listed in Table 2. The chromosome position was based on the reference genome of Medicago truncatula (Mt4.0 v1). Each chromosome is numbered and ‘Unknown’ represents the unknown chromosome. The chromosomal positions are distinguished by colour. The abbreviations at the top of the plots are putative candidate genes linked to corresponding SNPs, and the arrows indicate their genetic positions in the reference genome. TMP, putative transmembrane protein; PAT1, scarecrow‐like transcription factor PAT1; TIR‐NBS‐LRR, toll interleukin‐1 receptor‐nucleotide‐binding site‐leucine‐rich repeat protein; NCR, nodule cysteine‐rich (NCR) secreted peptide.
Assignment of the loci associated with VW resistance to known genes
To identify possible candidate genes linked to the resistance loci, a pairwise alignment using the blastn algorithm was performed employing the flanking sequences of the significant markers against the Phytozome (http://phytozome.jgi.doe.gov/pz/portal.html) M. truncatula genome sequences (Mt4.0 v1) and the National Center for Biotechnology Information (NCBI) (www.ncbi.nlm.nih.gov/) nucleotide acid databases. Two significant loci, contig_67844_1658 on chromosome 6 and S8_15421844 on chromosome 8, were linked to two members of the toll interleukin‐1 receptor (TIR)‐nucleotide‐binding site (NBS)‐leucine‐rich repeat (LRR) gene family (Table 2, Fig. 6) (DeYoung and Innes, 2006). A transmembrane protein (TMP) was linked to the locus with three linked markers (S5_40754497, S5_40754497 and S5_40754542) on chromosome 5. Marker S7_708932 was linked to the scarecrow‐like transcription factor (PAT1). Three linked markers (S8_15870215, S8_15870225 and S8_15970197) on chromosome 8 were linked to a lysosomal trafficking regulator (LYST). Marker contig_92284_538 was linked to nodule cysteine‐rich (NCR) secreted peptide.
Discussion
Markers associated with VW resistance linked to known disease resistance genes
Among the resistance loci identified in the present study, two markers (contig_67844_1658 and S8_15421844) with different locations were linked to members of the same TIR‐NBS‐LRR gene family. The NBS‐LRR gene family has been well documented and can be divided into two subfamilies: TIR‐NBS‐LRR and non‐TIR‐NBS‐LRR (DeYoung and Innes, 2006; McHale et al., 2006). The plant NBS‐LRR gene family contains a large class of disease resistance genes, known as R genes. The TIR‐NBS‐LRR genes play roles in disease resistance in plants (Grau et al. 2006). There is evidence to suggest that the TIR‐NBS‐LRR gene (RCT1) from M. truncatula confers resistance to anthracnose in transgenic alfalfa plants (Yang et al., 2008). The identification of markers linked to the TIR‐NBS‐LRR genes in the present study suggests their contribution to VW resistance. Marker contig_92284_538 was linked to a nodule cysteine‐rich (NCR) secreted peptide, an antimicrobial peptide (AMP) that is naturally synthesized in the ribosome. AMPs are the effector molecules of innate immunity in plants and animals. Their antimicrobial action involves the disruption of microbial membranes, which ultimately leads to cell lysis and thus death of the microbes (Tiricz et al., 2013). Three markers on chromosome 8 were linked to the lysosomal trafficking regulator, LYST. In Arabidopsis, a LYST‐interacting protein, LIP5, is targeted to pathogen‐responsive mitogen‐activated protein kinases (MPKs) and plays a critical role in plant basal resistance (Wang et al., 2014).
Genetic basis of VW resistance in alfalfa
Viands (1985) suggested that complex additive effects contribute to VW resistance in alfalfa cultivar ‘Vertus’. Miller and Christie (1991) reported that general combining ability (GCA) significantly influenced the expression of resistance to VW in ‘Vertus’ alfalfa, and suggested that additive genetic variance is the primary source of VW resistance. Our previous report (Zhang et al., 2014) identified multiple loci (i.e. quantitative resistance) associated with VW resistance in two alfalfa mapping populations. This assumption is supported by the present study in which multiple loci have been shown to contribute to VW resistance in elite breeding populations of alfalfa.
QTLs for VW resistance have been reported in M. truncatula. They include a major QTL on chromosome 7, and two minor QTLs on chromosomes 2 and 6 (Ben et al., 2013). In our previous study, three resistance loci associated with VW resistance were identified on chromosome 7 and one on chromosome 2 (Zhang et al., 2014). In the present study, two were identified on chromosome 6 and one on chromosome 7, suggesting similar locations of loci for VW resistance in M. sativa and M. truncatula. However, additional resistance loci to VW have also been identified in M. sativa by both our previous (Zhang et al., 2014) and present studies, whereas these loci were not found in M. truncatula. For instance, several VW resistance loci were identified on chromosome 8 by both our previous (Zhang et al., 2014) and present studies, whereas no VW resistance locus has been reported on chromosome 8 in M. truncatula.
Using a GBS‐based GWA approach, we have identified 10 SNP markers associated with VW resistance in a panel of alfalfa breeding lines. Sequence alignment to the M. truncatula genome revealed multiple resistance loci, several of which are linked to known resistance genes. These putative resistance loci identified here had similar chromosomal locations as those previously reported in tetraploid alfalfa (Zhang et al., 2014) and in its diploid relative M. truncatula. We plan to validate these putative QTLs in a broader range of alfalfa germplasm. Diagnostic markers co‐segregating with VW resistance will be developed and used for marker‐assisted selection (MAS) and genomic prediction to accelerate the development of new alfalfa cultivars with improved resistance to VW.
Experimental Procedures
Plant materials and phenotyping
Plant materials were provided by FGI. A subpopulation of elite lines was sampled from each of three breeding programmes: MW, PNW and CA (Table S2). A total of 179 elite breeding lines, including 75 from MW, 48 from PNW and 56 from CA, were selected and vegetatively propagated. They were then randomly inter‐mated within subpopulations and harvested to produce half‐sib seed for progeny testing.
Ninety half‐sib seedlings from each breeding line were evaluated for resistance to VW in a glasshouse assay according to the North America Alfalfa Improvement Conference (NAAIC) standard protocol (Grau, 1991). Seedlings were grown for 7 weeks and then inoculated with a homogenized mixture of six V. alfalfae isolates (‘Berg’, ‘Sevcik’, ‘Freitag’, ‘Kunderts’, ‘VP6’, ‘VP11’) in equal concentrations. Inoculation was performed by submerging scissors into the inoculum and clipping stems when they had reached 3 cm in height. To ensure inoculation, scissors were re‐submerged after each clipping. Inoculated plants were removed from propagation flats and transplanted into a pot containing commercial potting soil (Pro‐Mix). Plants were then placed in a randomized complete block design with three replications and grown under optimal conditions for 5 weeks. Plants were scored, on a scale of 1–5, for the severity of foliar symptoms based on the standard protocol (Grau, 1991), with ‘1’ being most resistant and ‘5’ being most susceptible to VW. Only plants scored as ‘1’ and ‘2’ were considered to be resistant, as they showed no chlorosis on terminal leaves, and minimal chlorosis on lower leaves. Scores ‘3’ and ‘4’ applied to plants with well‐developed or severe systemic symptoms, whereas a score of ‘5’ indicated a dead plant. A resistance rating for each line was calculated as the number of resistant plants (scored ‘1’ or ‘2’) divided by the total number of plants tested. Least‐square means were calculated across the three replications (Table S2).
Phenotypic data were first analysed using Levene's and t‐tests to evaluate the equality of variance and means. Based on the assumption of equal variance, a test for normality was performed on the disease resistance rate of the population with the Kolmogorov–Smirnov test using SPSS software (http://www.ibm.com/software/analytics/spss/).
Genotyping‐by‐sequencing (GBS)
High‐molecular‐weight DNA was extracted from leaf tissues using the Qiagen DNeasy 96 Plant kit, according to the manufacturer's procedure (Qiagen, Valencia, CA, USA). DNA was digested by the ApekI restriction enzyme, which recognizes a five‐base‐pair sequence (5′‐GCWGC). Genomic DNA libraries were prepared for GBS by ligating the digested DNA to unique nucleotide adapters (barcodes), followed by PCR amplification (Elshire et al. 2011). The library was sequenced using Illumina HiSeq2000. An initial quality check was performed using FastQC (v0.11.2, http://www.bioinformatics.babraham.ac.uk/projects/fastqc/). Process_Radtags built in Stacks (Catchen et al., 2011) was used for deconvolution and cleaning of sequencing reads. High‐quality reads were aligned to the M. truncatula reference genome (Mt4.0 v1) (www.phytozome.org/M. truncatula) using the Burrow Wheelers Alignment tool (Version 0.5.9) (Li and Durbin, 2009) with default alignment parameters.
Sequence variant detection and genotype calling
Picard MarkDuplicates (version 1.94, http://picard.sourceforge.net/) was used for de‐duplication of the aligned data. The Genome Analysis Toolkit (GATK, v3.1) (McKenna et al., 2010) was used for the extraction of read depth information. In‐house Perl scripts and BEDTools (v2.17.0) (Quinlan and Hall, 2010) were applied to process read depth and coverage data. Duplicated reads from individuals were excluded from sequence variant calling. Variants including single and multiple nucleotide polymorphisms (SNPs and MNPs, respectively), allelic series of tri‐SNPs and tetra‐SNPs, MNPs, and indels with a variable number of nucleotides were identified using FreeBayes (Version 0.9.15) (Garrison and Marth, 2012). To differentiate genotype ‘zygosities’, allele‐specific read depths of all non‐duplicated reads were analysed using FreeBayes, resulting in nulliplex (aaaa), simplex (aaab), duplex (aabb), triplex (abbb) and quadruplex (bbbb) genotypes in the tetraploid individuals. This analysis allows the calling of not only variants differing from the reference, but also variants differing between genotypes. To ensure the quality of genotyping calls, a likelihood estimate was calculated to determine the probability. The R‐package ‘pegas’ (http://ape-package.ird.fr/pegas.html) and custom Perl scripts were used to calculate the heterozygosity of the variants. Raw data were submitted to the NCBI Sequence Read Archive with reference number SRP069098.
Principal component analysis
A principal component analysis was performed on the marker data for all lines in the panel by SAS PROC PRINCOMP (SAS Institute, Cary, NC, USA). A covariance matrix was obtained and used for association analysis. To display results, principal component 2 scores were plotted against principal component 1 scores for each line (Fig. 5).
GWA analysis
Genotypic data were further filtered using a 5% cut‐off value for MAF. The filtered marker data and least‐square means of the phenotypic data were used for GWA analysis employing TASSEL (Bradbury et al., 2007) with a mixed linear model. The marker data were used to generate a marker similarity matrix (Kinship or K matrix) containing all accessions using TASSEL. TASSEL calculates kinship as the proportion of alleles shared between each pair of lines. Once this matrix is calculated, the numbers are rescaled so that the numbers fall between 0 and 2 (Bradbury et al., 2007). The K and Q matrices were used to control population structure during association analysis. A false discovery rate (FDR) of 0.05 was used as a threshold for significance association (Benjamini and Hochberg, 1995).
Supporting information
Additional Supporting Information may be found in the online version of this article at the publisher's website:
Fig. S1 Distribution of Verticillium wilt (VW) resistance among three subpopulations: CA, California; MW, Midwest; PNW, Pacific Northwest.
Table S1 Marker density across eight chromosomes based on the alignment of target sequences to the reference genome of Medicago truncatula (Mt4.0 v1). The numbers of markers with unknown positions are also presented at the end of the table.
Table S2 Normalized Verticillium wilt (VW) resistance rate among 179 breeding lines in three breeding programmes: CA, California; MW, Midwest; PNW, Pacific Northwest.
Acknowledgements
This work was supported by the US Department of Agriculture‐Agricultural Research Service (USDA‐ARS) National Program Project No. 5354‐21000‐015‐00D, USDA NIFA NRSP10, Washington State University and by a partial grant from the National Alfalfa and Forage Alliance to L.‐X. Yu. The authors declare that there are no conflicts of interest.
References
- Acharya, S.N. and Huang, H.‐C. (2003) Breeding alfalfa for resistance to Verticillium wilt: a sound strategy In: Advances in Plant Disease Management (Huang H.‐C. and Acharya S.N., eds), pp. 345–371. ISBN: 81‐7736‐191‐0. Research Signpost.
- Atkinson, T.G. (1981) Verticillium wilt of alfalfa: challenge and opportunity. Can. J. Plant Pathol. 3, 266–272. [Google Scholar]
- Ben, C. , Toueni, M. , Montanari, S. , Tardin, M.C. , Fervel, M. , Negahi, A. , Saint‐Pierre, L. , Mathieu, G. , Gras, M.C. , Noël, D. , Prospéri, J.M. , Pilet‐Nayel, M.L. , Baranger, A. , Huguet, T. , Julier, B. , Rickauer, M. and Gentzbittel, L. (2013) Natural diversity in the model legume Medicago truncatula allows identifying distinct genetic mechanisms conferring partial resistance to Verticillium wilt. J. Exp. Bot. 64, 317–332. [DOI] [PMC free article] [PubMed] [Google Scholar]
- Benjamini, Y. and Hochberg, Y. (1995) Controlling the false discovery rate: a practical and powerful approach to multiple testing. J. R. Stat. Soc. 57, 289–300. [Google Scholar]
- Bradbury, P. , Zhang, Z. , Kroon, D. , Casstevens, T. , Ramdoss, Y. and Buckler E.S. (2007) Tassel: software for association mapping of complex traits in diverse samples. Bioinformatics, 23, 2633–2635. [DOI] [PubMed] [Google Scholar]
- Brouwer, D.J. , Duke, S.H. and Osborn, T.C. (2000) Mapping genetic factors associated with winter hardiness, fall growth, and freezing injury in autotetraploid alfalfa. Crop Sci. 40, 1387–1396. [Google Scholar]
- Catchen, J.M. , Amores, A. , Hohenlohe, P. , Cresko, M. and Postlethwait, J.H. (2011) Stacks: building and genotyping loci de novo from short‐read sequences. G3, 1, 171–82. [DOI] [PMC free article] [PubMed] [Google Scholar]
- Delwiche, P.A. (1991) Comparison of methods to evaluate alfalfa cultivars for reaction to Verticillium albo‐atrum . Plant Dis. 75, 82–85. [Google Scholar]
- DeYoung, B.J. and Innes, R.W. (2006) Plant NBS‐LRR proteins in pathogen sensing and host defense. Nat. Immunol. 7, 1243–1249. [DOI] [PMC free article] [PubMed] [Google Scholar]
- Elshire, R.J. , Glaubitz, J.C. , Sun, Q. , Poland, J.A , Kawamoto, K. , Buckler, E.S. and Mitchell, S.E. (2011) A robust, simple genotyping‐by‐sequencing (GBS) approach for high diversity species. PLoS One, 6, e19379. [DOI] [PMC free article] [PubMed] [Google Scholar]
- Garrison, E. and Marth, G. (2012) Haplotype‐based variant detection from short‐read sequencing. arXiv:1207.3907v2 [q‐bio.GN]. http://arxiv.org/abs/1207.3907. Access date May, 2012.
- Gordon, T.R. , Correll, J.C. , Gilchrist, D.G. and Martensen, A.N. (1989) Verticillium wilt of alfalfa in California. Plant Dis. 73, 18–20. [Google Scholar]
- Graham, J.H. , Peaden, R.N. and Evans, D.W. (1977) Verticillium wilt of alfalfa found in the United States. Plant Dis. Rep. 61, 337–340. [Google Scholar]
- Grau, C.R. (1991) Standard test: Verticillium wilt resistance. North American Alfalfa Improvement Conference. Online publication. http://www.naaic.org/stdtests/verticil.htm March, 1991.
- Grau, C.R. , Delwiche, P.A. , Norgren, R.L. , O'Connell, T.E. and Maxwell, D.P. (1981) Verticillium wilt of alfalfa in Wisconsin. Plant Dis. 65, 843–844. [Google Scholar]
- Grau, C.R. , Nygaard, S.L. , Arny, D.C. , DeYoung, B.J. and Innes, R.W. (2006) Plant NBS‐LRR proteins in pathogen sensing and host. Nat. Immunol. 7, 1243–1249. [DOI] [PMC free article] [PubMed] [Google Scholar]
- Gray, F.A. and Roth, D.A. (1982) Verticillium wilt of alfalfa in Wyoming. Plant Dis. 66, 1080. [Google Scholar]
- Gupta, P.K. , Varshney, R.K. , Sharma, P.C. and Ramesh, B. (1999) Molecular markers and their applications in wheat breeding. Plant Breed. 118, 369–390. [Google Scholar]
- Han, Y. , Kang, Y. , Ivone, T. , Cheung, F. , Town, C.D. , Zhao, P.X. , Udvardi, M.K. and Monteros, M.J. (2011) Genome‐wide SNP discovery in tetraploid alfalfa using 454 sequencing and high resolution melting analysis. BMC Genomics, 12, 350. [DOI] [PMC free article] [PubMed] [Google Scholar]
- Inderbitzin, P. , Bostock, R.M. , Davis, R.M. , Usami, T. , Platt, H.W. and Subbarao, K.V. (2011) Phylogenetics and taxonomy of the fungal vascular wilt pathogen Verticillium, with the descriptions of five new species. PLoS One, 6, e28341. [DOI] [PMC free article] [PubMed] [Google Scholar]
- Knepper, C. and Day, B. (2010) From perception to activation: The molecular‐genetic and biochemical landscape of disease resistance signaling in plants. The Arabidopsis Book 8, e0124. doi:10.1199/tab.0124 elocation‐id: e0124. [DOI] [PMC free article] [PubMed]
- Larsen, R.C. , Vandemark, G.J. , Hughes, T.J. and Grau, C.R. (2007) Development of a real‐time PCR assay for quantifying Verticillium albo‐atrum DNA in resistant and susceptible alfalfa. Phytopathology, 97, 1519–1525. [DOI] [PubMed] [Google Scholar]
- Leath, K.T. and Pennypacker, B.W. (1990) Verticillium wilt. In: Compendium of Alfalfa Diseases (Stuteville D.L. and Erwin D.C., eds), pp. 39–41. St. Paul, MN: American Phytopathological Society Press. [Google Scholar]
- Li, H. and Durbin, R. (2009) Fast and accurate short read alignment with Burrows–Wheeler transform. Bioinformatics, 25, 1754–1760. [DOI] [PMC free article] [PubMed] [Google Scholar]
- Li, X. and Brummer, E.C. (2012) Applied genetics and genomics in alfalfa breeding. Agronomy, 2, 40–61. [Google Scholar]
- Mackie, J.M. , Musial, J.M. , Armour, D.J. , Phan, H.T. , Ellwood, S.E. , Aitken, K.S. and Irwin, J.A. (2007) Identification of QTL for reaction to three races of Colletotrichum trifolii and further analysis of inheritance of resistance in autotetraploid lucerne. Theor. Appl. Genet. 114, 1417–1426. [DOI] [PubMed] [Google Scholar]
- McDonald, B.A. and Linde, C. (2002). Pathogen population genetics, evolutionary potential, and durable resistance. Annu. Rev. Phytopathol. 40, 349–379. [DOI] [PubMed] [Google Scholar]
- McHale, L. , Tan, X. , Koehl, P. , Michelmore, R.W. (2006) Plant NBS‐LRR proteins: adaptable guards. Genome Biol. 7, 212. [DOI] [PMC free article] [PubMed] [Google Scholar]
- McKenna, A. , Hanna, M. , Banks, E. , Sivachenko, A. , Cibulskis, K. , Kernytsky, A. , Garimella, K. , Altshuler, D. , Gabriel, S. , Daly, M. and DePristo, M.A. (2010) The genome analysis toolkit: a MapReduce framework for analyzing next‐generation DNA sequencing data. Genome Res. 20, 1297–1303. [DOI] [PMC free article] [PubMed] [Google Scholar]
- Miller, P.R. and Christie, B.R. (1991) Genetics of resistance to Verticillium wilt in ‘Vertus’ alfalfa. Crop Sci. 31, 1492–1495. [Google Scholar]
- Musial, J.M. , Mackie, J.M. , Armour, D.J. , Phan, H.T. , Ellwood, S.E. , Aitken, K.S. and Irwin, J.A.G. (2007) Identification of QTL for resistance and susceptibility to Stagonospora meliloti in autotetraploid lucerne. Theor. Appl. Genet. 114, 1427–1435. [DOI] [PubMed] [Google Scholar]
- Peaden, R.N. , Gilbert, R.G. and Christen, A.A. (1985) Control of Verticillium albo‐atrum on alfalfa. Can. J. Plant Pathol. 7, 211–214. [Google Scholar]
- Quinlan, A.R. and Hall, I.M. (2010) BEDTools: a flexible suite of utilities for comparing genomic features. Bioinformatics, 26, 841–842. [DOI] [PMC free article] [PubMed] [Google Scholar]
- Robins, J.G. , Bauchan, G.R. and Brummer, E.C. (2007) Genetic mapping forage yield, plant height, and regrowth at multiple harvests in tetraploid alfalfa (Medicago sativa L.). Crop Sci. 47, 11–18. [Google Scholar]
- Tiricz, H.1. , Szucs, A. , Farkas, A. , Pap, B. , Lima, R.M. , Maróti, G. , Kondorosi, É. and Kereszt, A. (2013) Antimicrobial nodule‐specific cysteine‐rich peptides induce membrane depolarization‐associated changes in the transcriptome of Sinorhizobium meliloti . Appl. Environ. Microbiol. 79, 6737–6746. [DOI] [PMC free article] [PubMed] [Google Scholar]
- Viands, D.R. (1985) Comparison of ‘Maris Kabul’ with ‘Vertus’ alfalfa for resistance to Verticillium wilt. Crop Sci. 25, 1096–1100. [Google Scholar]
- Wang, F. , Shang, Y. , Fan, B. , Yu, J.‐Q. and Chen, Z. (2014) Arabidopsis LIP5, a positive regulator of multivesicular body biogenesis, is a critical target of pathogen‐responsive mapk cascade in plant basal defense. PLoS Pathog. 10, e1004243. doi: 10.1371/journal.ppat.1004243. [DOI] [PMC free article] [PubMed] [Google Scholar]
- Yang, S. , Gao, M. , Xu, C. , Gao, J. , Deshpande, S. , Lin, S. , Roe, B.A. and Zhu H. (2008) Alfalfa benefits from Medicago truncatula: the RCT1 gene from M. truncatula confers broad‐spectrum resistance to anthracnose in alfalfa. Proc. Natl. Acad. Sci. USA, 105, 12 164–12 169. [DOI] [PMC free article] [PubMed] [Google Scholar]
- Yang, S.S. , Tu, Z.J. , Cheung, F. , Xu, W.W. , Lamb, J.F. , Jung H.J., Vance, C.P. and Gronwald, J.W. (2011) Using RNA‐Seq for gene identification, polymorphism detection and transcript profiling in two alfalfa genotypes with divergent cell wall composition in stems. BMC Genomics, 12, 199. doi: 10.1186/1471-2164-12-199. [DOI] [PMC free article] [PubMed] [Google Scholar]
- Zhang, T. , Yu, L.‐X. , McCord, P. , Miller, D. , Bhamidimarri, S. , Johnson, D. , Monteros, M.J. , Ho, J. , Reisen, P. and Samac, D.A. (2014) Identification of molecular markers associated with Verticillium wilt resistance in alfalfa (Medicago sativa L.) using high‐resolution melting. PLoS One, 9, e115953. doi: 10.1371/journal.pone.0115953. [DOI] [PMC free article] [PubMed] [Google Scholar]
Associated Data
This section collects any data citations, data availability statements, or supplementary materials included in this article.
Supplementary Materials
Additional Supporting Information may be found in the online version of this article at the publisher's website:
Fig. S1 Distribution of Verticillium wilt (VW) resistance among three subpopulations: CA, California; MW, Midwest; PNW, Pacific Northwest.
Table S1 Marker density across eight chromosomes based on the alignment of target sequences to the reference genome of Medicago truncatula (Mt4.0 v1). The numbers of markers with unknown positions are also presented at the end of the table.
Table S2 Normalized Verticillium wilt (VW) resistance rate among 179 breeding lines in three breeding programmes: CA, California; MW, Midwest; PNW, Pacific Northwest.


