

Abstract
Different patterns of sweet liking exist. For some, liking increases as concentration increases up to a point at which it typically plateaus. These individuals are referred to as sweet likers. How sweet likers’ beverage intake, especially sugar sweetened beverage intake, differs from sweet dislikers’ beverage intake is not well characterized. A total of 953 visitors (650 adults; 62.0% women; 303 children; 58.7% girls) to the Denver Museum of Nature & Science rated the taste intensity and liking of 5 sucrose solutions that spanned concentrations typically encountered in sugar-sweetened beverages (0.0–13.7% w/v) using visual analog scales. Beverage intake by adults was quantified using the validated BEVQ-15 questionnaire. Among adults, hierarchical cluster analysis identified three clusters of liking patterns (likers, dislikers, and neutrals). Among children, two clusters of liking patterns were identified (likers and dislikers). For both adults and children, BMI, percent body fat, age, and sex did not differ between clusters. Concentration by cluster interaction effects were observed for both adults and children. Adult sweet likers consumed more energy from all beverages, more sweetened juice and tea, and less water than those in other clusters. Sweet liker status may be a useful predictor of increased energy intake from beverages, but prospective trials are necessary to confirm this utility.
Keywords: Sweet taste, Sweetness, Sweet preference, Beverages, Sugar-sweetened beverages, Children, Adults
1. Introduction
While humans are born with an innate appreciation for sweetness (Steiner, 1979), the degree of liking can differ from one person to the next. Psychophysical studies testing sucrose or other sweet solutions have established individual variation in sweet liking (Asao et al., 2015; Drewnowski, Henderson, Shore, & Barratt-Fornell, 1997; Kim, Prescott, & Kim, 2014, 2017; Looy, Callaghan, & Weingarten, 1992; Looy & Weingarten, 1991, 1992; Methven, Xiao, Cai, & Prescott, 2016; Pangborn, 1970; Stone & Pangborn, 1990; Thompson, Moskowitz, & Campbell, 1976; Witherly, Pangborn, & Stem, 1980; Yeomans, Tepper, Rietzschel, & Prescott, 2007). For some individuals, as sweetness intensity increases, liking increases, with an eventual plateau for liking if the concentration is sufficiently high enough; for others, as intensity increases, liking may decrease, remain relatively neutral across all tested concentrations, or follow an inverted U-shaped pattern where liking increases up to a point and then decreases (Drewnowski et al., 1997; Kim et al., 2014, 2017; Looy & Weingarten, 1991; Looy et al., 1992; Methven et al., 2016; Pangborn, 1970; Stone & Pangborn, 1990; Witherly et al., 1980; Yeomans et al., 2007). In these studies, the first class of people have been referred to as sweet “likers” while those whose liking decreases as concentration increases are typically classified as sweet “dislikers”. Participants who follow an inverted U-shaped pattern are sometimes categorized as dislikers (e.g. Yeomans et al., 2007), as their own category, (e.g., Stone & Pangborn, 1990), or removed from analysis (e.g., Looy et al., 1992). These sweet liking patterns are observed across a variety of cultures (Holt, Cobiac, Beaumont-Smith, Easton, & Best, 2000; Moskowitz, Kumaraiah, Sharma, Jacobs, &Sharma, 1975; Prescott et al., 1992), suggesting that sweet liker/disliker phenotypes are fairly robust. There is also some data to suggest that sweet liker status determined by sucrose liking also holds for liking of other sweet substances, like stevia (Oleson, 2014). Thus, it could be the case that sweet liker status could be a useful predictor of intake of nutritive and non-nutritive sweeteners across cultures.
Performance during psychophysical testing does not always predict behaviors towards food or intake; yet, sweet liker status has been associated with both liking of other sweet foods and intake of sugars (Holt et al., 2000; Kim et al., 2014). Classification of Korean women based on sweet liker or disliker status produced differences in liking ratings of some, but not all, sweet foods (Kim et al., 2014). In that study, the “disliker” group followed an inverted U-shape pattern of liking and rated the donut, chocolate milk, and non-nutritively sweetened coffee stimuli as less liked, but significant differences in liking were not observed for other foods with similar chemosensory or nutritional profiles like cookies, coffee with sugar, or milkshakes. Findings from studies assessing sweet liker status and dietary intake of sugars have been mixed, with one study observing higher refined sugar intake among sweet likers (Holt et al., 2000) while another found no differences in intake (Methven et al., 2016). Explanations for these differences may include differences in genetics and/or habitual diet as participants in the Holt study were Australian and Malaysian, while participants in the Methven study were Korean. An examination of relationships between sweet liker classification and beverage intake has not been reported previously, and differences between sweet likers and dislikers may be more apparent due to the greater similarity between taste stimuli tested and beverages.
Sugar added to foods often enhances palatability but provides little in the way of nutrition besides energy. For this reason, the 2015 US Dietary Guidelines Committee (Dietary Guidelines Advisory, 2015) recommended reducing added sugar intake to no more than 10% of total calories. Compared to foods sweetened with sugar, sugar-sweetened beverages appear to pose a greater risk for weight gain, as beverages possess lower satiety properties and elicit weaker dietary compensation (Tucker & Mattes, 2013). If sweet liker status influences intake of sweet beverages, then sweet likers could be at increased risk for health problems, including obesity.
Given the correlations between sweet liker status and liking of sweet foods, we sought to determine if there were associations between sweet liker status and beverage intake among adults. We hypothesized that sweet likers would consume more sugar-sweetened beverages. We also examined if there were associations between sweet liker status and body weight, given that some studies find differences in sweet preference between lean and non-lean individuals, e.g., (Bartoshuk, Duffy, Hayes, Moskowitz, & Snyder, 2006; Drewnowski, Brunzell, Sande, Iverius, & Greenwood, 1985) while others do not (Cox, Hendrie, &Carty, 2015). As these studies did not take sweet liker status into account, failing to classify participants by sweet liker status could be contributing to the variability observed. Because children typically demonstrate increased preference for sweetness compared to adults (De Graaf & Zandstra, 1999; Desor, Greene, & Mailer, 1975; Drewnowski, 1997; Liem & de Graaf, 2004), we were curious to see if any relationships observed among adults in our study population regarding sweet liker status would also be noted in children. Data on beverage intake among children was not collected for this study.
2. Materials and methods
2.1. Participants
Participants ages 8 and older were recruited from guests to the Denver Museum of Nature & Science (the Museum), between November 2015 and August 2016. Participants provided informed assent or consent for participation in the Sweet Tasting Study in the Genetics of Taste Lab. The only exclusion criterion was age – children under the ages of 8 were not eligible. Individuals with implanted medical devices did not participate in weight, height, and %BF measures. The study was approved by The Bowling Green State University Human Subjects Review Board (approval # 796133).
2.2. Study design
2.2.1. Taste measures
Sweet taste intensity and liking measures were conducted in a randomized, double-blind manner. Participants sampled five concentrations of sucrose dissolved in deionized (DI) water (0.0% (blank), 2.4% (low), 4.3% (medium), 7.7% (high), 13.7% (highest) w/v) by swishing and spitting 5 mL of each. These concentrations were selected as they: 1) are suprathreshold for most participants (Stevens, Cruz, Hoffman, & Patterson, 1995); 2) span a range of sweetness typically encountered in commercially available beverages (e.g., while products differ, sports drinks contain approximately 5.9% sucrose while sucrose-sweetened sodas contain approximately 11.3% sucrose); and 3) are evenly separated by a quarter-log step. Sweet taste intensity and liking for each solution was performed using 100 mm visual analog scales (VAS) with the anchors: ‘extremely weak,’ and ‘extremely strong’ and ‘dislike extremely’ and ‘like extremely’, respectively. Nose clips were worn during taste testing, and participants rinsed with bottled water between each sample.
2.2.2. Beverage intake
Participants aged 21 and older were asked to complete the BEVQ-15, a validated beverage food frequency questionnaire (Hedrick et al., 2012). The BEVQ-15 asks how much (ounces) and how often (times per day) various common beverages are consumed. Broad categories of the BEVQ-15 include: water; 100% juice; sweetened juice drinks; whole milk; reduced fat milk; low-fat/fat-free milk and milk alternatives; regular soft drinks; diet drinks; sweetened tea; tea and coffee with cream and/or sugar; tea and coffee black; beer and wine coolers; hard liquor; wine; and energy drinks. Energy intake was estimated following the BEVQ-15 protocol (Hedrick, Comber, Estabrooks, Savla, &Davy, 2010). Energy intake from all beverages was summed to determine total energy intake from beverages. Energy intake from sugar-sweetened beverages was determined from the sum of sweetened juice, sweetened tea, regular soft drinks, tea and coffee with cream and/or sugar, and energy drinks. Given that many people consume coffee with cream but not sugar, and because energy drinks come in both sugar-containing and sugar-free varieties, we analyzed sugar sweetened beverage intake without these variables as well.
2.3. Anthropometric measurements
Height, weight, and percent body fat (%BF) were measured using a freestanding stadiometer and bioelectrical impedance analyzer (Tanita TBF-215, Tanita, Tokyo, Japan). Body mass index (BMI) was calculated in both children and adults, with children’s BMI converted to z-scores to normalize across age, sex, and height (Flegal & Ogden, 2011). Children were designated as lean, overweight, or obese based on the z-score classification of the World Health Organization (de Onis et al., 2007).
2.4. Data analysis
Data analysis was completed using IBM SPSS Statistics version 24.0 (Chicago, IL). Results are presented as means ± standard deviations. Hierarchical cluster analysis (HCA) was used to group participants by sweet liker status. HCA was selected because it is a powerful tool for examining the underlying structure of seemingly homogeneous data and does not require a priori decisions regarding number of clusters (Rani & Rohil, 2013; Yim & Ramdeen, 2015). Clusters were determined based on the liking ratings of all five solutions. Appropriate cut-offs for children and adults were based on numerical (agglomeration schedule) and visual (dendrogram) output. Chi-square tests were used to test for differences in cluster composition by demographic or anthropometric measures. Two-way mixed ANOVA analysis was conducted to examine the effects of concentration, cluster, and interaction effects on liking and intensity. Differences in intensity and liking scores by cluster were assessed using one-way Anova and Games-Howell post hoc tests (Ruxton & Beauchamp, 2008; Shingala & Rajyaguru, 2015). Results were considered significant when p < .05. Trends (p < .08) are also noted.
3. Results
3.1. Participant characteristics
A total of 650 adults (N = 246 male (37.8%); N = 403 female (62.0%); N = 1 prefer not to answer, data was not included when analyzing sex effects) and 303 children, ages 8–17, (N = 125 boys (41.3%); N = 178 girls (58.7%)) participated in testing. Average age for adults was 41.8 ± 16.5 years while children were 10.9 ± 2.2 years old. Average BMI and %BF for adults were 27.2 ± 6.0 kg/m2 and 30.1 ± 10.1%, respectively. Average Z-score was 0.16 ± 1.02. Self-reported demographic information from the participants is displayed in Table 1.
Table 1.
Participant demographic information.
| Race | Adults |
Children |
||
|---|---|---|---|---|
| n | % | n | % | |
| White | 523 | 80.5 | 228 | 75.2 |
| Asian | 40 | 6.2 | 21 | 6.9 |
| More than one race | 35 | 5.4 | 31 | 10.2 |
| Other | 32 | 4.9 | 8 | 2.6 |
| Black | 10 | 1.5 | 5 | 1.7 |
| Prefer not to answer | 8 | 1.2 | 6 | 2.0 |
| Native American | 2 | 0.3 | 3 | 1.0 |
| Pacific Islander | 0 | 0 | 1 | 0.3 |
| Total | 650 | 303 | ||
| Ethnicity | ||||
| Hispanic | 72 | 11.1 | 35 | 11.6 |
Breakdown of participants by race, ethnicity, and age group.
3.2. Adults
HCA revealed three clusters of liking patterns in adults. These clusters are shown in Fig. 1. Briefly, cluster 1 (N = 218; 33.5%) followed a sweet-liking pattern: liking increased with increasing concentration. Cluster 2 (N = 377; 58.0%) maintained a largely consistent or neutral liking pattern regardless of sweetness; however, those with an inverted U-shaped liking (N = 115, 30.5%) also fell into this category. For those in cluster 3 (N = 55; 8.5%), liking decreased with increasing concentration, following a “dislike” pattern. BMI, %BF, age, and sex distributions did not differ between groups. Throughout the text, “likers” will refer to cluster 1, “neutrals” to cluster 2, and “dis-likers” to cluster 3. Mean overall liking did not differ between clusters (Table 2).
Fig. 1.
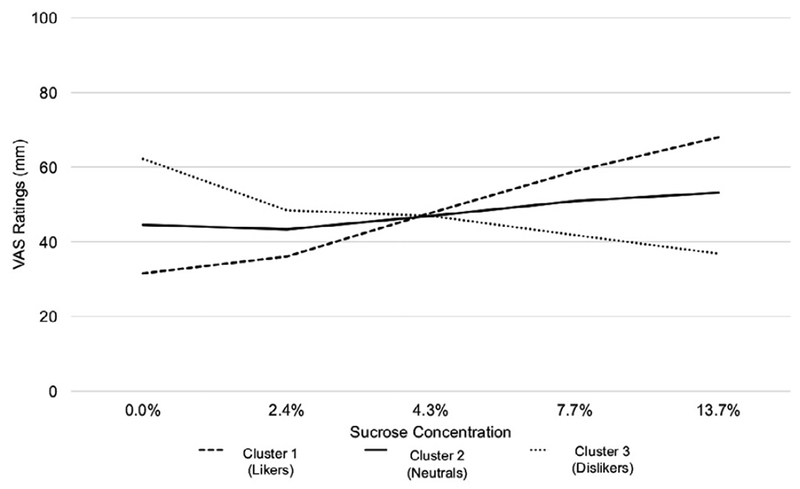
A significant effect of concentration on liking and an interaction effect between concentration and cluster were observed. Sweet liking patterns in adults by cluster.
Table 2.
Liking scores (mm) by cluster (mean ± standard deviation).
| Concentration | Cluster 1 (Likers) | Cluster 2 (Neutral) | Cluster 3 (Dislikers) |
|---|---|---|---|
| 0.0% | 31.5 ± 26.2 | 44.6 ± 23.9 | 62.2 ± 31.6 |
| 2.4% | 36.0 ± 21.4 | 43.4 ± 21.2 | 48.5 ± 22.2 |
| 4.3% | 47.7 ± 23.5 | 47.0 ± 20.3 | 46.9 ± 22.8 |
| 7.7% | 58.9 ± 23.6 | 50.9 ± 22.9 | 41.8 ± 27.3 |
| 13.7% | 68.0 ± 24.5 | 53.2 ± 25.7 | 36.8 ± 33.0 |
| Mean overall liking | 48.1 ± 14.1 | 47.7 ± 14.9 | 47.7 ± 14.8 |
Mean overall liking did not differ between clusters (p > .05).
A main effect of concentration (F(2.99, 1927.34) = 12.73, p < .001) and an interaction effect between concentration and cluster on liking was observed (F(5.98, 1927.34) = 37.50, p < .001) (Fig. 1). Differences in liking ratings by cluster are presented in Fig. 2.
Fig. 2.
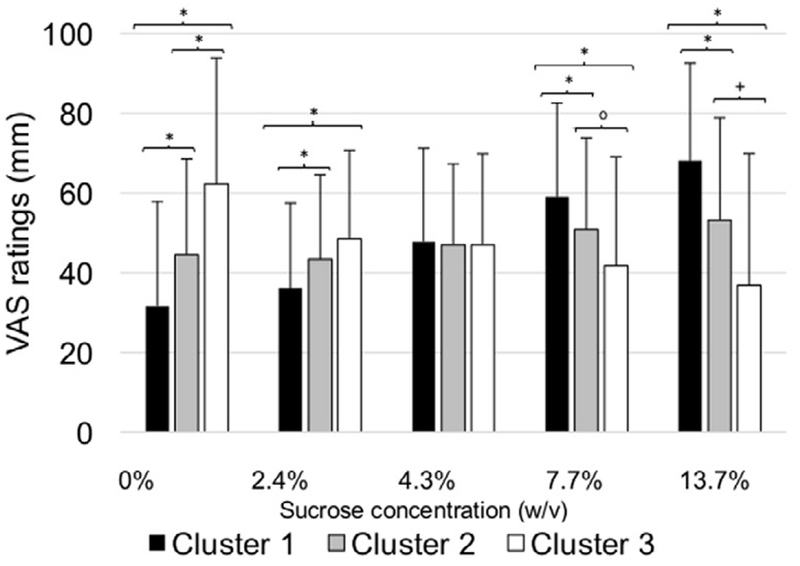
Liking ratings by cluster. Ratings for the middle concentration, 4.3%, did not differ by cluster among adult participants. * denotes p ≤ .001, + denotes p = .002, o denotes p = .055 (trend). Differences in sweet liking by concentration and cluster – adults only.
A main effect of concentration on intensity was observed (F(3.4, 2225.10) = 893.17, p < .001), but there was no effect of cluster or an interaction effect. All clusters rated each successive concentration as more intense than the previous. Dislikers rated the intensity lower than likers (p = .026) and neutrals (p = .007).
3.3. Children
HCA revealed two main clusters for children. As concentration increased, liking also increased among those in cluster 1 (likers) (N = 237; 78.2%). The opposite was observed for children in cluster 2 (N = 66; 21.8%) as concentration increased, liking decreased (dislikers). No differences in sex, age or Z-score were present between clusters.
A main effect of concentration on liking ratings was observed (F(3.57, 1073.31) = 5.61, p < .001), A main effect of cluster on liking was also noted (F(1, 301) = 1282.13, p < .001). Finally, an interaction between concentration and cluster was found (F(3.57, 1073.31) = 114.45, p < .001) (Fig. 3). Liking differed by cluster for all concentrations (p < .001) except for the lowest concentration of sucrose (2.4%). Sweet likers liked water less than sweet dislikers, but likers liked the 4.3%, 7.7%, and 13.7% concentrations more.
Fig. 3.
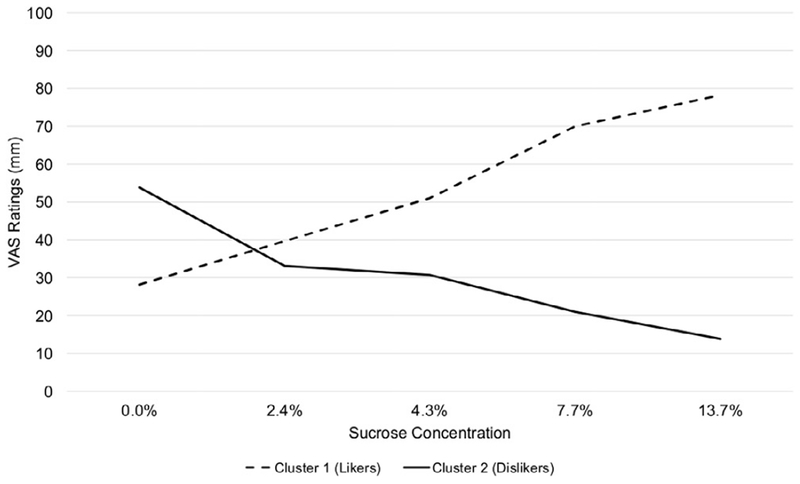
Liking was significantly different at all concentrations (p < .001) except for 2.4%, which did not differ between likers and dislikers. Liking ratings of each solution by cluster in children.
Two-way mixed ANOVA revealed a significant main effect of concentration on intensity ratings (F(3.67, 1075.68) = 21.18, p < .001), intensity ratings increased as concentration increased, but no main effects of cluster or interaction effects were observed. Intensity ratings did not differ between likers and dislikers.
3.4. Beverage intake
Out of the initial 650 adult participants, a total of 418 participants ages 21 and older completed the beverage questionnaire. Cluster sizes for this analysis were as follows: cluster 1 (likers) (N = 142); cluster 2 (neutrals) (N = 249); cluster 3 (dislikers) (N = 27). No differences in age, sex, BMI, or %BF were present between these clusters.
Beverage intake differed between clusters (Table 3). Total mean daily energy intake from all beverages was higher among likers compared to neutrals (p = 0004). Total energy intake by nonlikers did not differ from either likers or neutrals. Likers had greater energy intake from sugar-sweetened beverages compared to neutrals and dislikers (155.6 ± 195 kcals, 139 ± 215 kcals, 100 ± 170 kcals, respectively), but these differences were not significant. When we removed the coffee with cream and/or sugar and energy drinks categories from the analysis, there was a significant difference between likers and dislikers (77 ± 124 vs. 29 ± 60 kcals, p = .008). Neutrals (64 ± 149 kcals) did not differ from either likers or dislikers.
Table 3.
Differences in beverage intake by cluster (adults only).
| Beverage | Likers | Neutrals | Dislikers |
|---|---|---|---|
| Total energy from all (kcals) | 236 ± 210a | 178 ± 158b | 202 ± 204a,b |
| Sweetened juice (kcals) | 22 ± 62a | 21 ± 58a | 6 ± 18b |
| Sweetened tea (kcals) | 22 ± 64a | 13 ± 57a | 5 ± 19b |
| Water (mL) | 1030 ± 492a,b | 991 ± 481a | 1252 ± 467b |
Values with different superscripts indicate significant differences between the groups (p < .05).
In terms of specific beverage intake, differences between clusters were also observed. Less sweetened juice was consumed by dislikers compared to likers (p = .032) as well as neutrals (p = .013). Dislikers also drank less sweetened tea than likers (p = .036). Neutrals drank less water than dislikers (p = .025), while a trend for less water intake by likers compared to dislikers was noted (p = .077). A trend in reduced unsweetened juice intake in dislikers compared to likers (14 ± 30 vs. 35 ± 82 kcals, p = .052) as well as neutrals (32 ± 92 kcals, p = .063) was also observed.
4. Discussion
4.1. Sweet liker status and body composition
Higher concentrations of sweetness are indicative of increased energy density; although, non-nutritive sweeteners serve as an exception to this rule (Bellisle & Drewnowski, 2007). If higher concentrations of sweetness are preferred and consumed, then individuals could be at risk for increased energy intake and weight gain. Results from this cross-sectional study, where neither BMI, %BF, nor Z-score differed across clusters, suggest this might not be the case, but longitudinal experiments must be done to confirm this. Consistent with our findings, previous reports also failed to observe differences in BMI between sweet likers and dislikers (Looy & Weingarten, 1991; Witherly et al., 1980; Yeomans et al., 2007), and a recent systematic review concluded that limited evidence exists to support differences in taste perception between lean, overweight, and obese individuals (Cox et al., 2015).
4.2. Classifying participants
There is a rich literature examining relationships between sweet liking and a variety of variables related to health including alcoholism (Kampov-Polevoy, Garbutt, & Janowsky, 1997; Kranzler, Sandstrom, & Van Kirk, 2001), depression (Dichter, Smoski, Kampov-Polevoy, Gallop, & Garbutt, 2010), and metabolic syndrome (Turner-McGrievy, Tate, Moore, & Popkin, 2013). Unlike the present report, these studies have used liking scores or preference of a single sucrose concentration (cut-off) as the means of determining sweet liker status, rather than HCA to classify an individual as a sweet liker. Sweet liker classification using the cut-off method depends on the concentration selected, which is dependent on the concentrations tested. Methven and colleagues reported that HCA reduced the likelihood of misclassifying sweet likers as dislikers and vice versa compared to an evaluation of mean liking ratings (Methven et al., 2016) and concluded HCA was the superior method for appropriately classifying sweet likers. In this study, overall mean liking did not differ between groups, likely as a function of the concentrations selected; yet, HCA allowed for the identification of different patterns of responses that were meaningful. For these reasons, studies that used cut-off approaches are not considered in this discussion.
4.3. Children
Findings among adults and children were remarkably similar. Intensity ratings were not associated with cluster in either group. This finding was previously reported in adults (Methven et al., 2016). Interaction effects between concentration and cluster on liking ratings were observed for both adults and children, suggesting that the effect of concentration on liking ratings varied differently by cluster. These interactions are consistent with other reports where adults were tested (Drewnowski et al., 1997; Kim et al., 2014; Looy & Weingarten, 1991, 1992; Methven et al., 2016). In the present study, likers and dislikers did not differ in their ratings of the 2.4% solution. Previous reports in adults observed almost identical hedonic ratings of a 4% (w/v) (Drewnowski, 1997) and ~7% (w/v) (Yeomans et al., 2007) sucrose solution between likers and dislikers. We are not aware of any other studies of children that have classified sweet liker status using HCA, so further confirmation is needed in order to suggest that sweet liking patterns differ in adults compared to children when using this method. Given that children typically exhibit greater liking of sweeter stimuli compared to adults (De Graaf & Zandstra, 1999; Desor et al., 1975; Drewnowski, 1997; Liem & de Graaf, 2004), it is possible that the range of concentrations presented did not reach the break point for most children and could explain the lack of a neutral or inverted U-shape pattern that was observed in adults.
4.4. Comparison to previous reports
In this study, liking responses to increasing sucrose concentrations by adult participants fell into three clusters. Cluster 1 (likers) displayed a positive slope while cluster 3 (dislikers) displayed a negative slope. The overall liking pattern displayed by participants in cluster 2 appeared relatively flat; however, approximately 1 in 3 participants had liking patterns that followed the inverted-U shape distribution. For individuals who follow an inverted U-shaped pattern of liking, peak liking of sucrose appears to occur at around 10–12% w/v (Kim et al., 2014, 2017; Stone & Pangborn, 1990; Witherly et al., 1980). While our concentration range was lower than a number of studies that have observed inverted U-shaped distributions (3–36% w/v) (Kim et al., 2014, 2017; Stone & Pangborn, 1990; Witherly et al., 1980), there are multiple reports of individuals with stable liking ratings over a range of concentrations (Looy & Weingarten, 1991; Looy et al., 1992; Witherly et al., 1980). However, these individuals seem to be the exception rather than the rule (e.g., < 6 out of 22 (Looy et al., 1992); 6 out of 28 (Looy & Weingarten, 1991); 11 out of 159 (Drewnowski et al., 1997)) and, as such, are not routinely analyzed. Pangborn used a similar range of concentrations (0–8% w/v, N = 20) and observed inverted U-shaped responses in some participants (N = 4), but peak liking occurred at around 3.2% w/v, much lower than the other reports with larger sample sizes. Our desire to test responses within a range of sweetness encountered in commonly consumed beverages coupled with our large sample size may have contributed to the increased identification of individuals who are more or less indifferent to sweetness at these concentrations. While the previously described studies used different sweetness concentrations and different measurement tools to assess liking, making comparison across studies difficult, one study using similar concentrations and ratings measures also reported similar results (Yeomans et al., 2007). In the current study, the reported mean liking ratings for the highest concentration of sucrose (13.7%) by likers and dislikers are similar to those of likers and dislikers for 0.42 M (14.4%) reported by Yeomans et al. (2007). This agreement supports the validity of the responses we obtained.
4.5. Beverage intake
Beverage intake between clusters differed. Differences in energy intake from all beverages were observed between sweet likers and neutrals, with likers consuming more. Likers also consumed more energy from sugar-sweetened beverages than neutrals or dislikers, but these differences were not significant when all possible sugar-sweetened beverages were examined. While it was somewhat surprising that likers did not differ from dislikers on these measures, these categories comprise beverages with varying degrees of sweetness that span the concentrations of the stimuli tested and possess differing flavor profiles. The fact that sweet liking by neutrals is fairly resistant to changes in concentration may contribute to their reduced beverage intake compared to likers and, while not significant, reduced beverage intake compared to dislikers, as well. It should be noted that while the differences in energy intake between clusters are small, it could be the case that these differences extend to food intake as well (Kim et al., 2014).
While liking scores for water differed between each cluster, with sweet dislikers giving the water stimulus a higher rating than both likers and neutrals, intake did not follow this pattern. Dislikers drank more water than neutrals, and while significance was not achieved between dislikers and likers, consumption for likers was very similar to neutrals, i.e., likers consumed approximately 40 mL of additional water compared to neutrals. So, while sweet likers rated their liking of the water stimulus less than neutrals, intake was very similar. The failure of liking to predict intake results from the complex nature of food choice (Drewnowski, 1997). Other factors like culture, health, habitual dietary exposure, and cost may override sensory input for some individuals, but not others, and not always consistently. Given these intricacies, the identification of quick, reliable proxy measures is desirable. Future work that identifies sweet liker status as well as sensitivity to variables like cost and health may provide a better model for predicting intake of sweet beverages and foods.
Differences in specific beverage intake were also noted. In these cases, dislikers typically differed from both likers and neutrals. It is important to note that while these specific beverages exhibited differences in intake, with the exception of water, not everyone who completed the survey reported drinking each beverage, so these differences should be interpreted with caution. Sweet likers consumed more sweetened juice and sweetened tea than sweet dislikers. Trends for lower water intake and greater unsweetened juice intake by sweet likers compared to dislikers was also observed. These differences did not extend to each sweetened beverage as regular soda intake did not differ between clusters, nor did these differences extend to other unsweetened beverages like black tea or coffee. An earlier study found no differences in soda liking between sweet likers and dislikers but also observed no difference in liking of juice (Kim et al., 2014). As others have noted, liking of specific sucrose concentrations does not necessarily carry over from one food to the next (Holt et al., 2000; Methven et al., 2016) as expectations of appropriate sweetness levels for a particular food are developed through repeated exposure and play a role in hedonic judgments (Pliner, 1982; Sullivan & Birch, 1990). A previous study examined dietary intake of total carbohydrate, sugar, and sucrose grams as well as sugars as a percentage of total energy intake and concluded that there were no differences between sweet likers and dislikers, although sweet likers’ values were higher in each category (Methven et al., 2016). Our use of beverages, which more closely resemble the sucrose solutions used to assess sweet liker status, likely accounts for the differences in intake we observed between clusters.
While BMI and %BF did not differ between sweet likers, dislikers, and neutral participants, sweet likers reported consuming more sweetened juice. The cross-sectional nature of this study does not allow us to determine if these patterns of intake pose an increased risk of developing chronic diseases, but a recent meta-analysis linked increased sweetened juice intake with an increased risk of type 2 diabetes (Xi et al., 2014). Risk was not increased with higher intake of 100% fruit juice, which is not considered a sugar sweetened beverage (Malik et al., 2010). Increased water intake may play a beneficial role in weight maintenance after weight loss (Akers, Cornett, Savla, Davy, & Davy, 2012) and is promoted as a way to displace sweetened beverage consumption to promote weight loss (Daniels & Popkin, 2010). Longitudinal studies investigating sweet liker status and chronic disease risk are necessary to fully understand if sweet liker status is a useful screening tool to predict risk.
We also observed that when the coffee with cream and/or sugar and energy drinks categories were removed from the analysis, there was a significant difference between likers and dislikers, with likers consuming more. Removal of these categories is justified by the fact that some individuals consume coffee with creamer and no sugar and that there are sugar-free varieties of energy drinks on the market. However, the milk categories also do not separate flavored milks from plain, and various non-dairy milk products can contain sugar. Thus, we suggest that total energy intake differences are the best indicator of differences between groups, and differences between individual categories, while illustrative, require further investigation.
4.6. Strengths and limitations
The large sample size to explore if differences in age, sex, BMI, or %BF existed between likers and dislikers, objective measures of body composition, and double-blind presentation of taste stimuli were strengths of the study. In addition, the use of HCA to identify homogeneous groups based on sweet liking responses provided the ability to identify different patterns of responses among participants (Yim & Ramdeen, 2015). These different response patterns resulted in different beverage intake behaviors, making HCA a useful tool in the study of sweet liking and intake. Limitations included the small sample size of sweet dislikers who completed the beverage questionnaire; yet, as noted within the text, a number of studies examining sweet liker status have tested similar numbers of subjects. The lack of beverage intake information from children, and the fact that the beverage intake information was self-reported, and the overly broad beverage categories are also limitations; however, the BEVQ has been shown to be reliable when compared with 4-day diet records (Hedrick et al., 2010).
5. Conclusions
Sweet liker classification contributes to our understanding of ingestive behavior. Sweet liker status was not associated with demographic or anthropometric variables but was associated with beverage intake – specifically juices, sweetened tea, and water. While BMI and %BF did not differ between clusters, the cross-sectional nature of this study does not allow us to determine if sweet liker status puts individuals at risk of developing future chronic health conditions. Further work is needed in this area.
Acknowledgements
The authors wish to thank the volunteer corps of citizen scientists in the Genetics of Taste Lab that helped to conduct this work and the Expedition Health teams at the Museum for their support of this crowd sourced and citizen science research model.
Funding
The Sweet-Tasting Study in the Genetics of Taste Lab was supported by both the Denver Museum of Nature & Science and the Denver Museum of Nature & Science Foundation. This work was also supported by the USDA National Institute of Food and Agriculture and Michigan AgBioResearch.
References
- Akers JD, Cornett RA, Savla JS, Davy KP, & Davy BM (2012). Daily selfmonitoring of body weight, step count, fruit/vegetable intake, and water consumption: A feasible and effective long-term weight loss maintenance approach. Journal of the Academy of Nutrition and Dietetics, 112(5), 10.1016/j.jand.2012.01.022 685–692.e2. [DOI] [PMC free article] [PubMed] [Google Scholar]
- Asao K, Miller J, Arcori L, Lumeng JC, Han-Markey T, & Herman WH (2015). Patterns of sweet taste liking: A pilot study. Nutrients, 7(9), 7298–7311. 10.3390/nu7095336. [DOI] [PMC free article] [PubMed] [Google Scholar]
- Bartoshuk LM, Duffy VB, Hayes JE, Moskowitz HR, & Snyder DJ (2006). Psychophysics of sweet and fat perception in obesity: Problems, solutions and new perspectives. Philosophical Transactions of the Royal Society of London. Series B, Biological Sciences, 361(1471), 1137–1148 https://doi.org/C24WK6G22776400U [pii]. [DOI] [PMC free article] [PubMed] [Google Scholar]
- Bellisle F, & Drewnowski A (2007). Intense sweeteners, energy intake and the control of body weight. European Journal of Clinical Nutrition, 61(6), 691–700. 10.1038/sj.ejcn.1602649. [DOI] [PubMed] [Google Scholar]
- Cox DN, Hendrie GA, & Carty D (2015). Sensitivity, hedonics and preferences for basic tastes and fat amongst adults and children of differing weight status: A comprehensive review. Food Quality and Preference, 41, 112–120. [Google Scholar]
- Daniels MC, & Popkin BM (2010). The impact of water intake on energy intake and weight status: A systematic review. Nutrition Reviews, 68(9), 505–521. 10.1111/j.1753-4887.2010.00311.x. [DOI] [PMC free article] [PubMed] [Google Scholar]
- De Graaf C, & Zandstra EH (1999). Sweetness intensity and pleasantness in children, adolescents, and adults. Physiology & Behavior, 67(4), 513–520. 10.1016/S0031-9384(99)00090-6. [DOI] [PubMed] [Google Scholar]
- de Onis M, Onyango AW, Borghi E, Siyam A, Nishida C, & Siekmann J (2007). Development of a WHO growth reference for school-aged children and adolescents. Bulletin of the World Health Organization, 85(9), 660–667. [DOI] [PMC free article] [PubMed] [Google Scholar]
- Desor JA, Greene LS, & Maller O (1975). Preferences for sweet and salty in 9-yearold to 15-year-old and adult humans. Science, 190, 686–687. [DOI] [PubMed] [Google Scholar]
- Dichter GS, Smoski M, Kampov-Polevoy AB, Gallop R, & Garbutt JC (2010). Unipolar depression does not moderate responses to the sweet taste test. Depression and Anxiety, 27(9), 859–863. 10.1002/da.20690. [DOI] [PMC free article] [PubMed] [Google Scholar]
- Dietary Guidelines Advisory, C. (2015). Scientific report of the 2015 dietary guidelines advisory committee. USDA and US Department of Health and Human Services Retrieved from: http://health.gov/dietaryguidelines/2015-scientific-report/. [Google Scholar]
- Drewnowski A (1997). Taste preferences and food intake. Annual Review of Nutrition, 17, 237–253. [DOI] [PubMed] [Google Scholar]
- Drewnowski A, Brunzell JD, Sande K, Iverius PH, & Greenwood MR (1985). Sweet tooth reconsidered: Taste responsiveness in human obesity. Physiology & Behavior, 35, 617–622. [DOI] [PubMed] [Google Scholar]
- Drewnowski A, Henderson SA, Shore AB, & Barratt-Fornell A (1997). Nontasters, tasters, and supertasters of 6-n-propylthiouracil (PROP) and hedonic response to sweet. Physiology & Behavior, 62(3), 649–655. 10.1016/S0031-9384(97)00193-5. [DOI] [PubMed] [Google Scholar]
- Flegal KM, & Ogden CL (2011). Childhood obesity: Are we all speaking the same language? Advances in Nutrition: An International Review Journal, 2(2), 159S–166S. 10.3945/an.111.000307. [DOI] [PMC free article] [PubMed] [Google Scholar]
- Hedrick VE, Comber DL, Estabrooks PA, Savla J, & Davy BM (2010). The beverage intake questionnaire: Determining initial validity and reliability. Journal of the American Dietetic Association, 110(8), 1227–1232. [DOI] [PMC free article] [PubMed] [Google Scholar]
- Hedrick VE, Savla J, Comber DL, Flack KD, Estabrooks PA, Nsiah-Kumi PA, … Davy BM (2012). Development of a brief questionnaire to assess habitual beverage intake (BEVQ-15): Sugar-sweetened beverages and total beverage energy intake. Journal of the Academy of Nutrition and Dietetics, 112(6), 840–849. 10.1016/j.jand.2012.01.023. [DOI] [PMC free article] [PubMed] [Google Scholar]
- Holt SHA, Cobiac L, Beaumont-Smith NE, Easton K, & Best DJ (2000). Dietary habits and the perception and liking of sweetness among Australian and Malaysian students: A cross-cultural study. Food Quality and Preference, 11(4), 299–312. 10.1016/S0950-3293(99)00076-2 [DOI] [Google Scholar]
- Kampov-Polevoy AB, Garbutt JC, & Janowsky D (1997). Evidence of preference for a high-concentration sucrose solution in alcoholic men. American Journal of Psychiatry, 154, 269–270. [DOI] [PubMed] [Google Scholar]
- Kim J-Y, Prescott J, & Kim K-O (2014). Patterns of sweet liking in sucrose solutions and beverages. Food Quality and Preference, 36, 96–103. 10.1016/j.foodqual.2014.03.009. [DOI] [Google Scholar]
- Kim J-Y, Prescott J, & Kim K-O (2017). Emotional responses to sweet foods according to sweet liker status. Food Quality and Preference, 59, 1–7. [Google Scholar]
- Kranzler HR, Sandstrom KA, & Van Kirk J (2001). Sweet taste preference as a risk factor for alcohol dependence. American Journal of Psychiatry, 158(5), 813–815. 10.1176/appi.ajp.158.5.813. [DOI] [PubMed] [Google Scholar]
- Liem DG, & de Graaf C (2004). Sweet and sour preferences in young children and adults: Role of repeated exposure. Physiology & Behavior, 83(3), 421–429. 10.1016/j.physbeh.2004.08.028. [DOI] [PubMed] [Google Scholar]
- Looy H, Callaghan S, & Weingarten HP (1992). Hedonic response of sucrose likers and dislikers to other gustatory stimuli. Physiology & Behavior, 52(2), 219–225. [DOI] [PubMed] [Google Scholar]
- Looy H, & Weingarten HP (1991). Effects of metabolic state on sweet taste reactivity in humans depend on underlying hedonic response profile. Chemical Senses, 16(2), 123–130. 10.1093/chemse/16.2.123. [DOI] [Google Scholar]
- Looy H, & Weingarten HP (1992). Facial expressions and genetic sensitivity to 6-npropylthiouracil predict hedonic response to sweet. Physiology & Behavior, 52(1), 75–82. 10.1016/0031-9384(92)90435-5. [DOI] [PubMed] [Google Scholar]
- Malik VS, Popkin BM, Bray GA, Despres J-P, Willett WC, & Hu FB (2010). Sugar-sweetened beverages and risk of metabolic syndrome and type 2 diabetes: A meta-analysis. Diabetes Care, 33(11), 2477–2483. 10.2337/dc10-1079. [DOI] [PMC free article] [PubMed] [Google Scholar]
- Methven L, Xiao C, Cai M, & Prescott J (2016). Rejection thresholds (RjT) of sweet likers and dislikers. Food Quality and Preference, 52, 74–80. [Google Scholar]
- Moskowitz HW, Kumaraiah V, Sharma KN, Jacobs HL, & Sharma SD (1975). Cross-cultural differences in simple taste preferences. Science, 190(4220), 1217–1218. [DOI] [PubMed] [Google Scholar]
- Oleson SM (2014). Psychophysical responses and preference for sweetness. San Diego State University; Retrieved from: http://search.proquest.com/openview/c41a355e696245c7c357923ab9bae03a/1?pq-origsite=gscholar&cbl=18750&diss=y. [Google Scholar]
- Pangborn RM (1970). Individual variation in affective responses to taste stimuli. Psychonomic Science, 21(2), 125–126. [Google Scholar]
- Pliner P (1982). The effects of mere exposure on liking for edible substances. Appetite, 3(3), 283–290. [DOI] [PubMed] [Google Scholar]
- Prescott J, Laing D, Bell G, Yoshida M, Gillmore R, Allen S, … Ishii R (1992). Hedonic responses to taste solutions: A cross-cultural study of Japanese and Australians. Chemical Senses, 17, 801–809. [Google Scholar]
- Rani Y, & Rohil H (2013). A study of hierarchical clustering algorithm. International Journal of Information and Computation Technology, 3(11), 113. [Google Scholar]
- Ruxton GD, & Beauchamp G (2008). Time for some a priori thinking about post hoc testing. Behavioral Ecology, 19(3), 690–693. 10.1093/beheco/arn020. [DOI] [Google Scholar]
- Shingala MC, & Rajyaguru A (2015). Comparison of post hoc tests for unequal variance. International Journal of New Technologies in Science and Engineering, 2(5), 22–33. [Google Scholar]
- Steiner JE (1979). Human facial expressions in response to taste and smell stimulation. Advances in Child Development and Behavior, 13, 257–295. [DOI] [PubMed] [Google Scholar]
- Stevens JC, Cruz LA, Hoffman JM, & Patterson MQ (1995). Taste sensitivity and aging: High incidence of decline revealed by repeated threshold measures. Chemical Senses, 20, 451–459. [DOI] [PubMed] [Google Scholar]
- Stone LJ, & Pangborn RM (1990). Preferences and intake measures of salt and sugar, and their relation to personality traits. Appetite, 15(1), 63–79. [DOI] [PubMed] [Google Scholar]
- Sullivan SA, & Birch LL (1990). Pass the sugar, pass the salt: Experience dictates preference. Developmental Psychology, 26(4), 546–551. [Google Scholar]
- Thompson DA, Moskowitz HR, & Campbell RG (1976). Effects of body weight and food intake on pleasantness ratings for a sweet stimulus. Journal of Applied Physiology, 41(1), 77–83. [DOI] [PubMed] [Google Scholar]
- Tucker RM, & Mattes RD (2013). Satiation, satiety: The puzzle of solids and liquids In Blundell JE, & Bellisle F (Eds.). Satiation, satiety and the control of food intake (Vols. 1–Book, Section). Cambridge: Woodhead. [Google Scholar]
- Turner-McGrievy G, Tate DF, Moore D, & Popkin B (2013). Taking the bitter with the sweet: Relationship of supertasting and sweet preference with metabolic syndrome and dietary intake. Journal of Food Science, 78(2), S336–342. 10.1111/1750-3841.12008. [DOI] [PMC free article] [PubMed] [Google Scholar]
- Witherly SA, Pangborn RM, & Stern JS (1980). Gustatory responses and eating duration of obese and lean adults. Appetite, 1, 53–63. [Google Scholar]
- Xi B, Li S, Liu Z, Tian H, Yin X, Huai P, … Steffen LM (2014). Intake of fruit juice and incidence of type 2 diabetes: A systematic review and meta-analysis. PLoS One, 9(3), e93471 10.1371/journal.pone.0093471. [DOI] [PMC free article] [PubMed] [Google Scholar]
- Yeomans MR, Tepper BJ, Rietzschel J, & Prescott J (2007). Human hedonic responses to sweetness: Role of taste genetics and anatomy. Physiology & Behavior, 91, 264–273. 10.1016/j.physbeh.2007.03.011. [DOI] [PubMed] [Google Scholar]
- Yim O, & Ramdeen KT (2015). Hierarchical cluster analysis: comparison of three linkage measures and application to psychological data. The Quantitative Methods for Psychology, 11, 8–21. [Google Scholar]