

Summary
Systemic acquired resistance (SAR) is a potent plant defence system that, in response to a first contact with a plant pathogen, prepares the whole plant for subsequent attacks, so that it becomes more resistant to the same and to other pathogens. BcSpl1, a cerato‐platanin family protein abundantly secreted by Botrytis cinerea, is required for full virulence and elicits the hypersensitive response in the host. Here, we report that BcSpl1 is also able to induce in tobacco systemic resistance to two plant pathogens, Pseudomonas syringae and B. cinerea, which correlates with the induction of two pathogenesis‐related genes, PR‐1a and PR‐5. Levels of salicylic acid were quantified in situ on BcSpl1 infiltration, and a wave of salicylic acid departing from the point of infiltration and running through the leaf was observed, as well as the appearance of this plant hormone in the neighbouring leaves as early as 3 days after infiltration.
Plants defend themselves from pathogen attack by a variety of means, collectively known as the plant immune system (Jones and Dangl, 2006; Katagiri and Tsuda, 2010). A first line of defence usually includes the recognition of microbe‐associated molecular patterns (MAMPs), also referred to as pathogen‐associated molecular patterns (PAMPs), by surface‐exposed pattern recognition receptors. This recognition triggers a first set of defence reactions, known as pattern‐triggered immunity (PTI), which usually restricts the microbe to the site of infection. Successful pathogens, however, secrete effectors which interfere with this primary line of plant defence in order to colonize the plant. Some plants, in turn, have developed a second line of defence which, on detection of the effectors by an intracellular receptor, mounts a more intense defence response, known as effector‐triggered immunity (ETI), which effectively blocks these more sophisticated plant pathogens. This division between PAMPs and effectors, or between PTI and ETI, is, however, blurred and has been challenged recently (Thomma et al., 2011). The intensity of the defence response in ETI, and sometimes also in PTI, can be such that death of the plant cells responding to the pathogen occurs, in a form of programmed cell death, known as the hypersensitive response (HR) (Mur et al., 2008), aimed at preventing the expansion of the infection to neighbouring cells. The detection of the pathogen by the plant and the subsequent immune response have another consequence, which is the generation of an as yet unidentified signal (Vlot et al., 2008a). This travels throughout the plant and systemically induces the expression of defence genes, conferring to the plant enhanced resistance to further infection attempts by the same, or different, pathogens. The latter effect is known as systemic acquired resistance (SAR) (Durrant and Dong, 2004; Hammerschmidt, 2009; Schneider et al., 1996).
The fungus Botrytis cinerea is a widely distributed and successful plant pathogen that attacks a wide range of plants, causing devastating losses in commercially important crops (Williamson et al., 2007). It has been proposed that this necrotroph actively induces HR in plants as a strategy to generate dead tissue to grow on (Choquer et al., 2007; Govrin and Levine, 2000; van Kan, 2006; Williamson et al., 2007). Several metabolites and proteins secreted by this fungus have been shown to produce symptoms and/or markers of HR, such as oxalic acid (Kim et al., 2008), botrydial (Rossi et al., 2011), necrosis and ethylene‐inducing peptide 1 (Nep‐1)‐like proteins (NLPs) (Schouten et al., 2008) and the xylanase Xyn11A (Noda et al., 2010). In agreement with this hypothesis, we have reported recently that the cerato‐platanin BcSpl1 contributes to B. cinerea virulence and causes the appearance of typical HR symptoms and the expression of HR gene markers when applied to plant tissues (Frías et al., 2011). We hypothesized that these effects are caused by the recognition of BcSpl1 as a MAMP by the plant immune system. As cerato‐platanins are widely distributed and well conserved among fungi, this recognition would allow plants to defend against a wide range of biotrophic or hemibiotrophic fungi, but could be exploited by necrotrophs, such as B. cinerea, to generate dead tissue.
It has been reported that some MAMPs, such as flagellin and lipopolysaccharides, are able to induce SAR by themselves (Mishina and Zeier, 2007), implying that one of the effects of the induction of PTI would be the generation of the signal responsible for SAR. As a putative MAMP, the BcSpl1 protein may be able to trigger SAR in plants, even though B. cinerea itself has been reported to be unable to induce SAR in Arabidopsis (Govrin and Levine, 2002). We report here that BcSpl1 indeed induces resistance to B. cinerea and Pseudomonas syringae, and, in addition, induces the synthesis of the SAR‐related hormone salicylic acid (SA).
In order to analyse whether the cerato‐platanin BcSpl1 was able to induce SAR in tobacco, fully mature 4‐week‐old plants (Nicotiana tabacum cv. Havana, maintained at controlled temperature, humidity and photoperiod in a phytotron) were treated with BcSpl1 by infiltration of two 100‐μL aliquots of a 34 μm cerato‐platanin solution, expressed in Pichia pastoris (Frías et al., 2011), at opposite sides of the central vein. At different times after infiltration, the plants were assayed for resistance against B. cinerea and P. syringae pv. tabaci in leaves different from those infiltrated. Botrytis cinerea conidia were prepared and inoculated on plant leaves at the indicated times after the SAR‐inducing treatment, as explained previously (Frías et al., 2011), and the severity of the infection was determined by measuring the growth rate of the radius of the infected area between days 2 and 3 after inoculation. Susceptibility to P. syringae pv. tabaci was assayed by infiltration of a bacterial suspension [1 × 10⁸ colony‐forming units (cfu)/mL in 10 mm MgCl2] in a leaf still attached to the plant. The day after, the leaf was cut and the number of bacteria in the lesions was quantified, as described by Tornero and Dangl (2001).
Apart from the local induction of HR reported previously (Frías et al., 2011), the treatment with BcSpl1 caused a rapid and strong induction of resistance against P. syringae pv. tabaci throughout the plant, and a less intense and delayed resistance to B. cinerea (Fig. 1). It seems, therefore, that BcSpl1 is able to induce SAR in tobacco, although the enhanced resistance level was not equal for the two pathogens tested. At 3 days post‐infiltration, the treated plants had developed a strong resistance to P. syringae pv. tabaci, but remained fully susceptible to B. cinerea. At 8 days post‐infiltration, plants remained equally resistant to P. syringae pv. tabaci and also showed resistance to the fungus. As a positive control for SAR, tobacco plants were infiltrated with P. syringae pv. tomato DC3000, for which tobacco is not a host. As is usual with incompatible interactions, this P. syringae strain resulted in the rapid appearance of a necrotic spot in the infiltrated zone (not shown), 1 day after infiltration, as well as an enhanced systemic resistance to the two pathogens inoculated 8 days after infiltration (Fig. 1). The levels of resistance induced by P. syringae pv. tomato DC3000 were only marginally higher than those obtained with BcSpl1, and in the same range as observed for similar systems (Vlot et al., 2008b).
Figure 1.
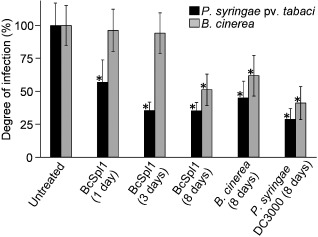
Systemic resistance to Pseudomonas syringae pv. tabaci and Botrytis cinerea induced by infiltration with BcSpl1. Tobacco plants were infiltrated with BcSpl1 at two sites in one of the leaves and, at the indicated times, the following two leaves in the stem were infected with the two plant pathogens. The degree of infection was measured as the number of bacteria in the lesion 1 day after inoculation, in the case of P. syringae, or as the growth rate of the radius of the infected area, in the case of B. cinerea, with a minimum number of inoculations of at least 30. The corresponding values for the untreated plants (100%) were as follows: (1.2 × 10⁷) ± (2.1 × 10⁶) colony‐forming units (cfu)/mg fresh weight for P. syringae and 0.60 ± 0.09 cm/day for B. cinerea. Control experiments were performed by infiltration with the nonhost P. syringae strain pv. tomato DC3000 and by infection with B. cinerea. The leaves initially treated to induce systemic acquired resistance (SAR) were always left on the plant for the whole length of the experiment. Asterisks indicate significant differences by Student's t‐test (P < 0.01) from the respective untreated plants. The three bars for each pathogen at 8 days were also significantly different from each other (Student's t‐test, P < 0.01). The experiment was repeated three times with similar results.
The induction of SAR after infection of tobacco plants with B. cinerea was also analysed (Fig. 1). This experiment was initially conceived as a negative control as Govrin and Levine (2002) had reported previously that B. cinerea does not induce SAR in Arabidopsis thaliana. However, the results were different in our experiments with tobacco, and the infection with B. cinerea was able to induce systemic resistance to itself and to P. syringae pv. tabaci throughout the plant (Fig. 1), although the levels of resistance reached were lower than those induced by BcSpl1 or P. syringae pv. tomato DC3000.
To better characterize the development of SAR, tobacco plants infiltrated with BcSpl1 were assayed for the induction of the two well‐established SAR markers, PR‐1a and PR‐5, in the leaves following that treated in the stem by quantitative real‐time PCR, using the same method and primers as reported previously (Frías et al., 2011). PR‐1a and PR‐5 are pathogenesis‐related genes under the control of the transcription coactivator NPR1, the master regulator of SAR (Wang et al., 2005). Induction was observed for both genes on infiltration with BcSpl1, as compared with the levels found in the untreated plant (Fig. 2). This induction was especially strong in the case of PR‐1a, whose levels reached a maximum of 6608‐fold in comparison with the untreated plant. The transcript levels were determined for three different leaves in each plant, which, remarkably, did not differ from each other to a great extent (see error bars in Fig. 2), suggesting a homogeneous distribution of the SAR signal throughout the plant from its point of origin. Both P. syringae pv. tomato DC3000 and B. cinerea were also able to induce the two SAR markers and, especially in the case of PR‐1a, there was a correlation between the levels of transcript and the levels of resistance (Figs 1 and 2). For example, the induction of PR‐1a by infection with B. cinerea was about 10‐fold lower than the induction caused by the infiltration of BcSpl1 or P. syringae pv. tomato DC3000 (Fig. 2), and also represented the treatment that induced the lowest level of resistance to the two pathogens tested (Fig. 1).
Figure 2.
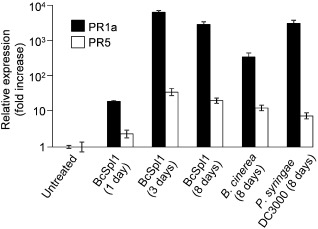
Systemic induction of PR‐1a and PR‐5 by infiltration with BcSpl1. Tobacco plants were infiltrated with 34 μm BcSpl1 in one of the leaves and, at the indicated times, a small fragment was taken from the three following leaves in the stem and used to measure the amount of mRNA for the two genes by quantitative real‐time polymerase chain reaction. Results are shown as the fold increase, with respect to the untreated plant, of the ratio of pathogenesis‐related (PR) mRNAs to actin mRNA. The relative mRNA amounts were calculated by the ΔΔCt method as described previously (Frías et al., 2011) from the mean of nine independent determinations of the threshold cycle (three biological replicates and three polymerase chain reactions with each cDNA). Deviation from the mean was calculated from the standard deviation (SD) in the ΔΔCt value, using the expression 2ΔΔ Ct ± SD.
One of the hallmarks of SAR is the production of the plant hormone SA, which is necessary for SAR to take place (Vlot et al., 2009). In order to quantify the concentration of SA in situ, the SA biosensor strain Acinetobacter sp. ADPWH_lux, developed by Huang et al. (2006), was used. This bacterial strain produces a chemiluminescent signal in the presence of SA in a concentration‐dependent manner. Bacteria were grown and infiltrated in the leaves exactly as described by the authors, chemiluminescence was recorded with a Chemidoc system (Bio‐Rad, Hercules, CA, USA) and images were analysed with ImageJ (Schneider et al., 2012). Using this system, the presence of SA was determined in the plants after infiltration with BcSpl1 (Fig. 3). Plants were infiltrated with 34 μm BcSpl1 or inoculated with P. syringae pv. tomato DC3000 or B. cinerea, and, at the indicated times, the three leaves following that treated in the stem were used to measure SA by infiltration of the biosensor strain. SA could be detected in all plants at 3 days after treatment, although the SA concentrations after B. cinerea inoculation were very low, when compared with those observed after Bcspl1 infiltration or P. syringae pv. tomato DC3000 inoculation. At 8 days after treatment, the SA levels were similar for the treatments with BcSpl1 and P. syringae pv. tomato DC3000, but lower for the infection with B. cinerea (Fig. 3).
Figure 3.
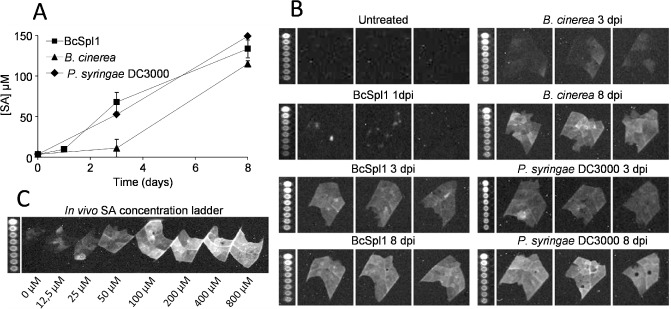
Systemic induction of salicylic acid (SA) by infiltration with BcSpl1. Plants were infiltrated with BcSpl1, or infected with Botrytis cinerea or the nonhost Pseudomonas syringae strain pv. tomato DC3000, in one of the leaves. At the indicated times, the concentration of SA was determined by infiltration of the SA biosensor strain Acinetobacter sp. ADPWH_lux in the leaves following the infiltrated leaf in the stem. (A) Evolution of SA concentration in the upper leaves. (B) Raw chemiluminescence results. Microwell plates containing the same bacterial cultures with known concentration of SA (0, 0.1, 0.2, 0.3, 0.4, 0.5, 1 and 2 μm) are shown to the left of each photograph. (C) Control experiment in which the biosensor bacteria were infiltrated alongside a known concentration of SA in untreated tobacco leaves, necessary for the calculation of the actual SA concentration from the chemiluminescent intensities, as described by Huang et al. (2006).
As a way to investigate how the induction of SA spreads from the site of infiltration of BcSpl1, SA was assayed at shorter time intervals, and at different distances from the site of inoculation, in the same leaf that was treated with the protein. Different tobacco leaves were infiltrated in a region near the petiole with 34 μm BcSpl1 and then used to assay SA at different times and at different positions along the leaf. The results show that, at every position assayed in the leaf, the concentration of SA increased to a maximum and then decreased [Figs 4 and S1 (Supporting Information)]. The time needed to reach the maximum concentration was longer in leaf areas that were more distant from the point of protein infiltration. The pattern of SA induction in space and time resembled a wave (Fig. 4). The concentration of SA reached in the leaves, up to 202 μm, was similar to that obtained in similar studies (Huang et al., 2006). A more intuitive representation of this wave of SA running through the leaf can be seen in Fig. S2 (see Supporting Information), and a rough estimation of the velocity of the wave can be derived from it by assuming that the peak started from the site of infiltration no sooner than day 2, and that its position at day 8 was further away than 15 cm, resulting in a minimum of 2.5 cm/day.
Figure 4.
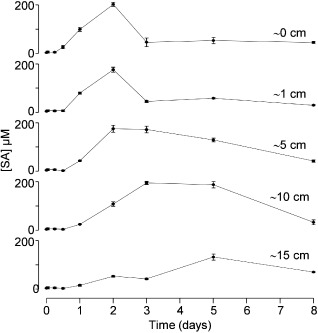
Time course of salicylic acid (SA) accumulation at different distances from the point of BcSpl1 infiltration. A set of tobacco leaves was infiltrated with BcSpl1 and, at the indicated times, the concentration of SA was determined at different positions along the leaves by infiltration of the SA biosensor strain Acinetobacter sp. ADPWH_lux. Distances are approximated; 0 cm corresponds to the area just beside the infiltrated (necrotic) zone. Raw chemiluminescence results can be seen in Fig. S1 (see Supporting Information).
Although it has been assumed classically that SAR is associated with ETI, but not with PTI, this concept has been challenged recently and several reports have shown that the application of isolated MAMPs to plants can result in a systemic defence response having the characteristics of SAR. PTI and ETI may just be different versions of the same phenomenon, but fine tuned for the occasion and usually stronger in ETI (Thomma et al., 2011). Here, we report that the cerato‐platanin BcSpl1, a fungal protein that causes necrosis in plants and is presumed to be perceived as a MAMP by the plant immune system (Frías et al., 2011), is also able to induce a defence response displaying the hallmark features of SAR. These include the systemic induction at a distance from the point of stimulation of: (i) resistance to two different plant pathogens (Fig. 1); (ii) an increase in the transcription rate of two PR proteins (Fig. 2); and (iii) the accumulation of SA (Figs 3 and 4). BcSpl1 induced SAR in tobacco in a manner almost identical to the SAR generated by the nonhost P. syringae pv. tomato DC3000, which may be considered as an archetypal SAR inducer. Both treatments induced similar levels of resistance to the two pathogens, similar induction of the two PR genes and almost identical levels of SA. Therefore, cerato‐platanins seem to be one of a few known examples of isolated microbial molecules which are able to induce the systemic defence response by themselves, as has been proven previously for bacterial flagellin and lipopolysaccharide (Mishina and Zeier, 2007).
The induction of plant defences by other cerato‐platanins has also been reported in the literature. The protein from Ceratocystis fimbriata has been shown to induce the appearance of fluorescent compounds in plants (Pazzagli et al., 1999), as well as the induction of genes involved in defence and stress responses (Fontana et al., 2008). Similarly, induction of autofluorescence was observed for the Leptosphaeria maculans cerato‐platanin Sm1 (Wilson et al., 2002). The protein sm1, from Trichoderma virens, has also been shown to induce, in cotton cotyledons, the synthesis of hydrogen peroxide, autofluorescence and an increased local and systemic transcription of defence genes (Buensanteai et al., 2010; Djonovic et al., 2006). The cerato‐platanin MgSM1 from Magnaporthe grisea has also been shown to induce a systemic defence response when expressed in Arabidopsis via Agrobacterium‐mediated transient expression (Yang et al., 2009). Here, it is shown that this systemic induction of defences by cerato‐platanins indeed results in resistance to two different plant pathogens and in the accumulation of SA throughout the plant.
The induction of SAR in tobacco by infection with B. cinerea was initially included as a negative control, as this fungus has been reported to be unable to produce SAR in Arabidopsis thaliana (Govrin and Levine, 2002). Surprisingly, the situation seems to be different in tobacco, and infection with B. cinerea also induced the three SAR hallmark features described above, although with less intensity than with BcSpl1 or P. syringae pv. tomato DC3000. It is necessary to take into account that inoculation with B. cinerea is slower in inducing symptoms than infiltration with P. syringae pv. tomato DC3000 or BcSpl1. The last two treatments triggered leaf tissue necrosis 1 day post‐infiltration, whereas B. cinerea produced necrotic lesions only 2–3 days post‐inoculation. This difference may well explain the reduced amplitude of SAR produced by B. cinerea at 8 days after infection as a simple delay with respect to the other two. This can be clearly seen in the accumulation of SA, which starts later for the infection with B. cinerea, but seems to be increasing in a similar manner (Fig. 3). We therefore conclude that, contrary to the situation in Arabidopsis, B. cinerea is able to induce SAR in tobacco.
Of particular interest are the results observed for the time course of expansion of SA from the point of application of BcSpl1 (Figs 4, S1 and S2), resembling a wave of SA expanding slowly from the point of application at a speed in agreement with that suggested by the classical experiment of Rasmussen et al. (1991). These authors reported that 8 h were necessary to first observe the appearance of SA in the petiole exudates of cucumber leaves that had been inoculated with P. syringae pv. syringae at multiple sites. Moreover, Rasmussen et al. (1991) also reported that the SA increase in the petiole exudates was followed by a decrease, in accordance with the wave of SA suggested by the results shown here (Figs 4 and S1). It is clear, in conclusion, that BcSpl1 is able to produce SAR by itself when applied to tobacco plants, a property that could be exploited in plant protection. Treatment of plants with low concentrations of cerato‐platanins, or cerato‐platanin‐derived peptides, may be worth exploring as a strategy of disease control.
Supporting information
Fig. S1 Time course of salicylic acid (SA) accumulation at different distances from the point of BcSpl1 infiltration. This figure shows the raw chemiluminescence results from which the SA concentrations displayed in Fig. 4 were obtained. dpi, days post‐infiltration; hpi, hours post‐infiltration.
Fig. S2 Animation showing the wave‐like pattern of salicylic acid (SA) induction in a tobacco leaf infiltrated with BcSpl1. The same data as in Fig. 4 were arranged in a different format to better display the wave of SA.
Acknowledgements
Support for this research was provided by grants from the Ministerio de Educación y Ciencia (AGL2010‐22222) and Gobierno de Canarias (PI2007/009). M.F. was supported by Gobierno de Canarias. We are grateful to Hui Wang for providing the SA biosensor.
References
- Buensanteai, N. , Mukherjee, P.K. , Horwitz, B.A. , Cheng, C. , Dangott, L.J. and Kenerley, C.M. (2010) Expression and purification of biologically active Trichoderma virens proteinaceous elicitor Sm1 in Pichia pastoris . Protein Expr. Purif. 72, 131–138. [DOI] [PubMed] [Google Scholar]
- Choquer, M. , Fournier, E. , Kunz, C. , Levis, C. , Pradier, J.M. , Simon, A. and Viaud, M. (2007) Botrytis cinerea virulence factors: new insights into a necrotrophic and polyphageous pathogen. FEMS Microbiol. Lett. 277, 1–10. [DOI] [PubMed] [Google Scholar]
- Djonovic, S. , Pozo, M.J. , Dagott, L. , Howell, C. and Kenerley, C. (2006) Sm1, a proteinaceous elicitor secreted by the biocontrol fungus Trichoderma virens induces plant defense responses and systemic resistance. Mol. Plant–Microbe Interact. 19, 838–853. [DOI] [PubMed] [Google Scholar]
- Durrant, W.E. and Dong, X. (2004) Systemic acquired resistance. Annu. Rev. Phytopathol. 42, 185–209. [DOI] [PubMed] [Google Scholar]
- Fontana, F. , Santini, A. , Salvini, M. , Pazzagli, L. , Cappugi, G. , Scala, A. , Durante, M. and Bernardi, R. (2008) Cerato‐platanin treated plane leaves restrict Ceratocystis platani growth and overexpress defence‐related genes. J. Plant Pathol. 90, 295–306. [Google Scholar]
- Frías, M. , González, C. and Brito, N. (2011) BcSpl1, a cerato‐platanin family protein, contributes to Botrytis cinerea virulence and elicits the hypersensitive response in the host. New Phytol. 192, 483–495. [DOI] [PubMed] [Google Scholar]
- Govrin, E.M. and Levine, A. (2000) The hypersensitive response facilitates plant infection by the necrotrophic pathogen Botrytis cinerea . Curr. Biol. 10, 751–757. [DOI] [PubMed] [Google Scholar]
- Govrin, E.M. and Levine, A. (2002) Infection of Arabidopsis with a necrotrophic pathogen, Botrytis cinerea, elicits various defense responses but does not induce systemic acquired resistance (SAR). Plant Mol. Biol. 48, 267–276. [DOI] [PubMed] [Google Scholar]
- Hammerschmidt, R. (2009) Systemic acquired resistance. Adv. Bot. Res. 51, 173–222. [Google Scholar]
- Huang, W.E. , Huang, L. , Preston, G.M. , Naylor, M. , Carr, J.P. , Li, Y. , Singer, A.C. , Whiteley, A.S. and Wang, H. (2006) Quantitative in situ assay of salicylic acid in tobacco leaves using a genetically modified biosensor strain of Acinetobacter sp. ADP1. Plant J. 46, 1073–1083. [DOI] [PubMed] [Google Scholar]
- Jones, J.D. and Dangl, J.L. (2006) The plant immune system. Nature. 444, 323–329. [DOI] [PubMed] [Google Scholar]
- van Kan, J.A. (2006) Licensed to kill: the lifestyle of a necrotrophic plant pathogen. Trends Plant Sci. 11, 247–253. [DOI] [PubMed] [Google Scholar]
- Katagiri, F. and Tsuda, K. (2010) Understanding the plant immune system. Mol. Plant–Microbe Interact. 23, 1531–1536. [DOI] [PubMed] [Google Scholar]
- Kim, K.S. , Min, J.Y. and Dickman, M.B. (2008) Oxalic acid is an elicitor of plant programmed cell death during Sclerotinia sclerotiorum disease development. Mol. Plant–Microbe Interact. 21, 605–612. [DOI] [PubMed] [Google Scholar]
- Mishina, T.E. and Zeier, J. (2007) Pathogen‐associated molecular pattern recognition rather than development of tissue necrosis contributes to bacterial induction of systemic acquired resistance in Arabidopsis . Plant J. 50, 500–513. [DOI] [PubMed] [Google Scholar]
- Mur, L.A. , Kenton, P. , Lloyd, A.J. , Ougham, H. and Prats, E. (2008) The hypersensitive response; the centenary is upon us but how much do we know? J. Exp. Bot. 59, 501–520. [DOI] [PubMed] [Google Scholar]
- Noda, J. , Brito, N. and Gonzalez, C. (2010) The Botrytis cinerea xylanase Xyn11A contributes to virulence with its necrotizing activity, not with its catalytic activity. BMC Plant Biol. 10, 38. [DOI] [PMC free article] [PubMed] [Google Scholar]
- Pazzagli, L. , Cappugi, G. , Manao, G. , Camici, G. , Santini, A. and Scala, A. (1999) Purification, characterization, and amino acid sequence of cerato‐platanin, a new phytotoxic protein from Ceratocystis fimbriata f. sp. platani . J. Biol. Chem. 274, 24 959–24 964. [DOI] [PubMed] [Google Scholar]
- Rasmussen, J.B. , Hammerschmidt, R. and Zook, M.N. (1991) Systemic induction of salicylic acid accumulation in cucumber after inoculation with Pseudomonas syringae pv syringae . Plant Physiol. 97, 1342–1347. [DOI] [PMC free article] [PubMed] [Google Scholar]
- Rossi, F.R. , Gárriz, A. , Marina, M. , Romero, F.M. , González, M.E. , Collado, I. and Pieckenstain, F.L. (2011) The sesquiterpene botrydial produced by Botrytis cinerea induces the hypersensitive response on plant tissues and its action is modulated by salicylic acid and jasmonic acid signaling. Mol. Plant–Microbe Interact. 24, 888–896. [DOI] [PubMed] [Google Scholar]
- Schneider, C.A. , Rasband, W.S. and Eliceiri, K.W. (2012) NIH Image to ImageJ: 25 years of image analysis. Nat. Methods. 9, 671–675. [DOI] [PMC free article] [PubMed] [Google Scholar]
- Schneider, M. , Schweizer, P. , Meuwly, P. and Métraux, J.P. (1996) Systemic acquired resistance in plants. Int. Rev. Cytol. 168, 303–340. [Google Scholar]
- Schouten, A. , van Baarlen, P. and van Kan, J.A.L. (2008) Phytotoxic Nep1‐like proteins from the necrotrophic fungus Botrytis cinerea associate with membranes and the nucleus of plant cells. New Phytol. 177, 493–505. [DOI] [PubMed] [Google Scholar]
- Thomma, B.P. , Nurnberger, T. and Joosten, M.H. (2011) Of PAMPs and effectors: the blurred PTI–ETI dichotomy. Plant Cell. 23, 4–15. [DOI] [PMC free article] [PubMed] [Google Scholar]
- Tornero, P. and Dangl, J.L. (2001) A high throughput method for quantifying growth of phytopathogenic bacteria in Arabidopsis thaliana . Plant J. 28, 475–481. [DOI] [PubMed] [Google Scholar]
- Vlot, A.C. , Klessig, D.F. and Park, S.W. (2008a) Systemic acquired resistance: the elusive signal(s). Curr. Opin. Plant Biol. 11, 436–442. [DOI] [PubMed] [Google Scholar]
- Vlot, A.C. , Liu, P.P. , Cameron, R.K. , Park, S.W. , Yang, Y. , Kumar, D. , Zhou, F. , Padukkavidana, T. , Gustafsson, C. , Pichersky, E. and Klessig, D.F. (2008b) Identification of likely orthologs of tobacco salicylic acid‐binding protein 2 and their role in systemic acquired resistance in Arabidopsis thaliana . Plant J. 56, 445–456. [DOI] [PubMed] [Google Scholar]
- Vlot, A.C. , Dempsey, D.A. and Klessig, D.F. (2009) Salicylic acid, a multifaceted hormone to combat disease. Annu. Rev. Phytopathol. 47, 177–206. [DOI] [PubMed] [Google Scholar]
- Wang, D. , Weaver, N.D. , Kesarwani, M. and Dong, X. (2005) Induction of protein secretory pathway is required for systemic acquired resistance. Science. 308, 1036–1040. [DOI] [PubMed] [Google Scholar]
- Williamson, B. , Tudzynski, B. , Tudzynski, P. and Van Kan, J.A.L. (2007) Botrytis cinerea: the cause of grey mould disease. Mol. Plant Pathol. 8, 561–580. [DOI] [PubMed] [Google Scholar]
- Wilson, L.M. , Idnurm, A. and Howlett, B.J. (2002) Characterization of a gene (sp1) encoding a secreted protein from Leptosphaeria maculans, the blackleg pathogen of Brassica napus . Mol. Plant Pathol. 3, 487–493. [DOI] [PubMed] [Google Scholar]
- Yang, Y. , Zhang, H. , Li, G. , Li, W. , Wang, X. and Song, F. (2009) Ectopic expression of MgSM1, a cerato‐platanin family protein from Magnaporthe grisea, confers broad‐spectrum disease resistance in Arabidopsis . Plant Biotechnol. J. 7, 763–777. [DOI] [PubMed] [Google Scholar]
Associated Data
This section collects any data citations, data availability statements, or supplementary materials included in this article.
Supplementary Materials
Fig. S1 Time course of salicylic acid (SA) accumulation at different distances from the point of BcSpl1 infiltration. This figure shows the raw chemiluminescence results from which the SA concentrations displayed in Fig. 4 were obtained. dpi, days post‐infiltration; hpi, hours post‐infiltration.
Fig. S2 Animation showing the wave‐like pattern of salicylic acid (SA) induction in a tobacco leaf infiltrated with BcSpl1. The same data as in Fig. 4 were arranged in a different format to better display the wave of SA.