

Summary
Previously, we have determined the nonhost‐mediated recognition of the MfAvr4 and MfEcp2 effector proteins from the banana pathogen Mycosphaerella fijiensis in tomato, by the cognate Cf‐4 and Cf‐Ecp2 resistance proteins, respectively. These two resistance proteins could thus mediate resistance against M. fijiensis if genetically transformed into banana (Musa spp.). However, disease resistance controlled by single dominant genes can be overcome by mutated effector alleles, whose products are not recognized by the cognate resistance proteins. Here, we surveyed the allelic variation within the MfAvr4, MfEcp2, MfEcp2‐2 and MfEcp2‐3 effector genes of M. fijiensis in a global population of the pathogen, and assayed its impact on recognition by the tomato Cf‐4 and Cf‐Ecp2 resistance proteins, respectively. We identified a large number of polymorphisms that could reflect a co‐evolutionary arms race between host and pathogen. The analysis of nucleotide substitution patterns suggests that both positive selection and intragenic recombination have shaped the evolution of M. fijiensis effectors. Clear differences in allelic diversity were observed between strains originating from South‐East Asia relative to strains from other banana‐producing continents, consistent with the hypothesis that M. fijiensis originated in the Asian‐Pacific region. Furthermore, transient co‐expression of the MfAvr4 effector alleles and the tomato Cf‐4 resistance gene, as well as of MfEcp2, MfEcp2‐2 and MfEcp2‐3 and the putative Cf‐Ecp2 resistance gene, indicated that effector alleles able to overcome these resistance genes are already present in natural populations of the pathogen, thus questioning the durability of resistance that can be provided by these genes in the field.
Introduction
The engineering of durable resistance against crop pathogens is one of the main goals in molecular plant breeding research. Plant defence against microbial attacks is predominantly mediated by immune receptors, mostly encoded by single dominant resistance (R) genes that direct the recognition of cognate pathogen effectors (Jones and Dangl, 2006; Spoel and Dong, 2012). The recognition of effectors results in effector‐triggered immunity (ETI), the most common manifestation of which is the hypersensitive response (HR), a type of programmed cell death that arrests pathogen growth at the site of infection (Bandelt and Dress, 1992; Gassmann and Bhattacharjee, 2012). Effectors are low‐molecular‐weight proteins secreted by microbes during pathogenesis to suppress or dodge the host immune system (Stergiopoulos and de Wit, 2009). Pathogen evasion of host immunity is frequently mediated by the deletion or mutations in effector genes, which often show elevated levels of nonsynonymous polymorphisms as a result of their antagonistic co‐evolution with the host (Ma and Guttman, 2008; Stergiopoulos et al., 2007; Stukenbrock and McDonald, 2009). Moreover, the distribution and diversity of effectors in pathogen populations can be strongly influenced by the distribution and diversity of cognate immune receptors in the host (Ma and Guttman, 2008; Michelmore et al., 2013; Stukenbrock and McDonald, 2009). Understanding the complexity of the co‐evolutionary arms race between R genes and cognate effectors is crucial for predicting the durability of deployed R genes in the field and for making sound choices in molecular plant breeding programmes (McDonald and Linde, 2002).
Nearly 100 million tons of bananas are produced annually in about 120 countries in tropical and subtropical regions, making banana the fourth most important crop worldwide in production value, after rice, wheat and maize (Arias et al., 2003). Currently, black leaf streak disease, caused by the haploid, heterothallic ascomycete Mycosphaerella fijiensis, is the most destructive disease in banana, reducing yields by more than 38% (Churchill, 2011; Marin et al., 2003). The disease first appeared in the Fiji islands in South‐East Asia in 1963 and, within 30 years, it had invaded all the main banana‐producing areas of the world. However, although widespread founder effects were associated with the introduction of the pathogen in America, in contrast, invasion of Africa was probably achieved by a single founder event (Robert et al., 2012). Such differences in introduction events may have had a profound impact on the genetic diversity of the pathogen in the two continents. The fungus is also known to reproduce asexually through conidia, although sexually produced ascospores are more important for the development of epidemics (Churchill, 2011). Fungicide applications are at present the only means of managing the disease, but their intensive use has already spawned the development of fungicide‐resistant strains of the fungus (Canas‐Gutierrez et al., 2009; Churchill, 2011; Romero and Sutton, 1997). The use of resistant banana varieties has been considered as an alternative approach for the management of the disease, but conventional breeding methods have met with limited success, mainly as a result of sterility and polyploidy in currently cultivated bananas (Jain and Swennen, 2004). Indeed, most banana cultivars and all plantain landraces are sterile triploid hybrids (AAA, AAB, ABB) between the wild species Musa acuminata (A genome) and Musa balbisiana (B genome), which develop their fruit by vegetative parthenocarpy (Heslop‐Harrison and Schwarzacher, 2007). These limitations in banana breeding programmes have spawned efforts into the production of transgenic banana plants (Khanna et al., 2007; Tripathi et al., 2005) and, in one such effort, banana has been successfully transformed with the HR‐assisting protein (Hrap) gene from sweet pepper, which conferred enhanced resistance against banana Xanthomonas wilt (BXW) caused by the bacterium Xanthomonas campestris pv. musacearum (Tripathi et al., 2010).
Previously, we have reported that functional orthologues of the Avr4 and Ecp2 effector proteins from the tomato pathogen Cladosporium fulvum are present in M. fijiensis (Stergiopoulos et al., 2010). Avr4 is a small secreted protein that binds to chitin and protects fungal cell walls against host chitinases (van den Burg et al., 2006). In tomato, Avr4 is recognized by the Cf‐4 resistance protein, eliciting an HR that leads to disease resistance (Joosten et al., 1997). The intrinsic function of Ecp2 remains elusive, but both Avr4 and Ecp2 have been shown to be virulence factors for C. fulvum (van Esse et al., 2007; Laugé et al., 1997, ). The ability to recognize Ecp2 in tomato is mediated by a single dominant gene, termed Cf‐Ecp2, which has been mapped to the Orion locus on the short arm of tomato chromosome 1 (de Kock et al., 2005), but has not yet been cloned. Remarkably, both the M. fijiensis MfAvr4 and MfEcp2 effector proteins are also able to trigger a Cf‐4‐ and Cf‐Ecp2‐mediated HR in tomato, respectively (Stergiopoulos et al., 2010). These resistance genes are thus expected to mediate resistance against M. fijiensis, if genetically transformed and functional in banana and plantain. Moreover, MfEcp2 appears to interact with a putative host target in tomato to promote necrosis in the absence of Cf‐Ecp2. Two additional homologues of Ecp2, termed MfEcp2‐2 and MfEcp2‐3, have been identified in M. fijiensis, but neither of these seems to trigger HR or necrosis in the presence or absence of Cf‐Ecp2, respectively (Stergiopoulos et al., 2010). As for MfEcp2, the intrinsic functions of MfEcp2‐2 and MfEcp2‐3 are currently unknown. A molecular evolutionary analysis, however, of Ecp2‐like genes in fungi (including M. fijiensis) suggested that, soon after gene duplication, the newly formed paralogues were subject to functional diversification (Stergiopoulos et al., 2012). Although still hypothetical, it is postulated that Ecp2‐like genes play a role in adaptive responses to biotic and abiotic stresses (Stergiopoulos et al., 2012). Stress response genes, such as those involved in adaptive immunity or pathoadaptation to new hosts, often exhibit high rates of gains and losses, as well as high within‐population genetic variation (Stukenbrock and McDonald, 2009). Thus, it can perhaps be assumed that the effector genes of M. fijiensis may also exhibit a significant degree of allelic diversity.
The effective deployment of resistance genes in the field requires foreknowledge of the genetic diversity in cognate pathogen effectors, as disease resistance controlled by single dominant genes can easily be overcome by mutated effector alleles whose products are no longer recognized by the cognate resistance proteins (Ma and Guttman, 2008; Stergiopoulos et al., 2007; Stukenbrock and McDonald, 2009). Here, we surveyed the allelic variation present in the MfAvr4, MfEcp2, MfEcp2‐2 and MfEcp2‐3 effector genes of M. fijiensis from global populations of the pathogen, and assayed all allelic variants for their ability to invoke Cf‐4‐ and Cf‐Ecp2‐mediated HR, respectively. This information is vital to predict the durability of these resistance genes in Musa spp., and is required before elaborate efforts are undertaken to transform them into this plant species. In addition, knowledge of the allelic diversity in effector genes of the pathogen can provide important information on the presence of putative cognate resistance genes in Musa spp., and their possible co‐evolution with the M. fijiensis effectors studied here.
Results
Effector genes of M. fijiensis are highly polymorphic
Thirty‐four strains collected from the main banana‐producing continents around the world were used in this study (Table S1, see Supporting Information). The collection included strains from South‐East Asia (n = 12), Africa (n = 8) and Latin America (n = 14). Results for polymorphism analyses on the individual effectors are summarized in Fig. 1, Table 1 and Table S2 (see Supporting Information), and the phylogeny of the deduced protein isoforms for each effector is shown in Fig. 2. Overall allelic diversity was highest for MfEcp2‐3, followed by MfAvr4, MfEcp2 and, finally, MfEcp2‐2. Such differences are reflected in the estimates of nucleotide diversity (π n) and the number of segregating sites (θ w) for each individual gene (Table 1).
Figure 1.
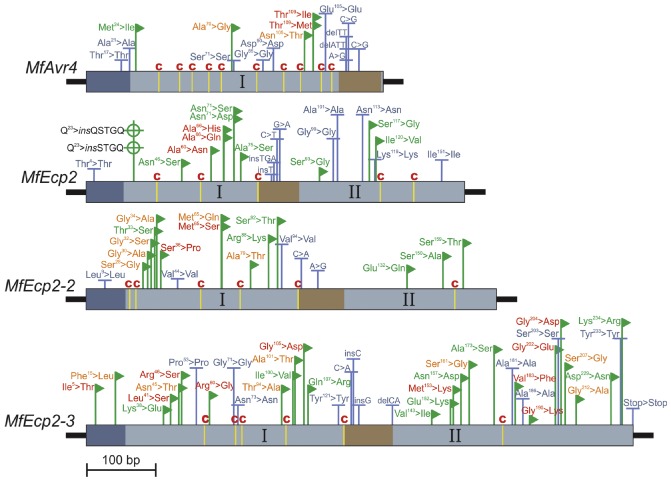
Allelic variation in the MfAvr4, MfEcp2, MfEcp2‐2 and MfEcp2‐3 effector genes of Mycosphaerella fijiensis. Grey boxes represent the proteins encoded by the different genes, including predicted signal peptides (dark blue). Introns are shown as brown boxes and exons are assigned Roman numerals. Codons in the genes encoding cysteine residues are represented by vertical yellow lines. Amino acid substitutions are indicated by the three letter code. Polymorphisms resulting in nonsynonymous amino acid substitutions in the encoded proteins are indicated by lines tagged with green flags and are also colour coded according to the physicochemical properties of the substituted amino acid residue; red denotes radical changes, orange neutral exchanges and green favoured shifts. Polymorphisms resulting in synonymous substitutions are indicated by blue T‐shaped vertical lines. Large insertions are indicated by green circles with crosses. Graph is drawn in scale. Ala, alanine; Arg, arginine; Asn, asparagine; Asp, aspartic acid; Gln, glutamine; Glu, glutamic acid; Gly, glycine; His, histidine; Ile, isoleucine; Leu, leucine; Lys, lysine; Met, methionine; Phe, phenylalanine; Pro, proline; Ser, serine; Thr, threonine; Tyr, tyrosine; Val, valine.
Table 1.
General indices of molecular diversity based on the sequence variation in the different effector genes of Mycosphaerella fijiensis examined in this study
| Domain | Region (bp)b | Eta (S)c | N nonsyn/N syn d | N hap e | Hdf | π n g | θ w h |
|---|---|---|---|---|---|---|---|
| MfAvr4 (n = 34)a | |||||||
| Total |
1–428 (428) |
13 (13) | 5/6 | 8 |
0.715 (± 0.062) |
0.0057 (± 0.0009) |
0.0075 (± 0.0030) |
| cDNA |
1–363 (363) |
11 (11) | 5/6 | 8 |
0.715 (± 0.062) |
0.0058 (± 0.0008) |
0.0074 (± 0.0031) |
| Exon I |
1–363 (363) |
11 (11) | 5/6 | 8 |
0.715 (± 0.062) |
0.0058 (± 0.0008) |
0.0074 (± 0.0031) |
| Intron |
364–425 (62) |
2 (2) | n.a. | 2 |
0.166 (± 0.080) |
0.0056 (± 0.0027) |
0.0083 (± 0.0061) |
| MfEcp2 (n = 34) | |||||||
| Total |
1–545 (545) |
20 (20) | 12/6 | 5 |
0.275 (± 0.099) |
0.0044 (± 0.0019) |
0.0090 (± 0.0033) |
| cDNA |
1–483 (483) |
18 (18) | 12/6 | 5 |
0.275 (± 0.099) |
0.0044 (± 0.0019) |
0.0091 (± 0.0034) |
| Exon I |
1–248 (248) |
10 (10) | 9/1 | 4 |
0.273 (± 0.098) |
0.0045 (± 0.0021) |
0.0099 (± 0.0042) |
| Intron |
249–307 (59) |
2 (2) | n.a. | 3 |
0.169 (± 0.007) |
0.0047 (± 0.0024) |
0.0083 (± 0.0061) |
| Exon II |
308–545 (238) |
8 (8) | 3/5 | 4 |
0.223 (± 0.093) |
0.0042 (± 0.0019) |
0.0082 (± 0.0037) |
| MfEcp2‐2 (n = 34) | |||||||
| Total |
1–591 (591) |
22 (20) | 15/3 | 5 |
0.275 (± 0.099) |
0.0029 (± 0.0017) |
0.0091 (± 0.0030) |
| cDNA |
1–522 (522) |
20 (18) | 15/3 | 5 |
0.275 (± 0.099) |
0.0030 (± 0.0017) |
0.0094 (± 0.0031) |
| Exon I |
1–305 (305) |
17 (15) | 12/3 | 5 |
0.275 (± 0.099) |
0.0043 (± 0.0024) |
0.0136 (± 0.0046) |
| Intron |
306–371 (66) |
2 (2) | n.a. | 3 |
0.116 (± 0.074) |
0.0026 (± 0.0018) |
0.0074 (± 0.0055) |
| Exon II |
372–591 (220) |
3 (3) | 3/0 | 3 |
0.116 (± 0.074) |
0.0011 (± 0.0008) |
0.0033 (± 0.0021) |
| MfEcp2‐3 (n = 33) | |||||||
| Total |
1–788 (788) |
37 (37) | 26/9 | 11 |
0.877 (± 0.034) |
0.0163 (± 0.0008) |
0.0116 (± 0.0039) |
| cDNA |
1–714 (714) |
35 (35) | 26/9 | 11 |
0.877 (± 0.034) |
0.0171 (± 0.0009) |
0.0121 (± 0.0041) |
| Exon I |
1–371 (371) |
16 (16) | 12/4 | 9 |
0.811 (± 0.046) |
0.0178 (± 0.0008) |
0.0106 (± 0.0041) |
| Intron |
372–442 (71) |
1 (1) | n.a. | 2 |
0.515 (± 0.022) |
0.0077 (± 0.0003) |
0.0037 (± 0.0037) |
| Exon II |
443–788 (346) |
20 (20) | 14/5 | 7 |
0.784 (± 0.042) |
0.0165 (± 0.0014) |
0.0142 (± 0.0052) |
Number of strains used in the analysis.
Sites with insertions and deletions (indels), as well as sites coding for stop codons, are not taken into account when calculating the various indices.
Total number of polymorphisms (Eta) and segregating sites (S).
Total number of nonsynonymous (N non‐syn) and synonymous (N syn) sites.
Total number of haplotypes based on DNA polymorphisms.
Nei's haplotype diversity index corrected for sample size (Nei, 1987) and its standard deviation.
Nucleotide diversity based on the average number of nucleotide differences between two random sequences (π n; Nei, 1987) and its standard deviation.
Statistics of the number of segregating sites (θ w; Watterson, 1975), estimated for the entire length of the sequences analysed and calculated standard deviation.
n.a., not applicable.
Figure 2.
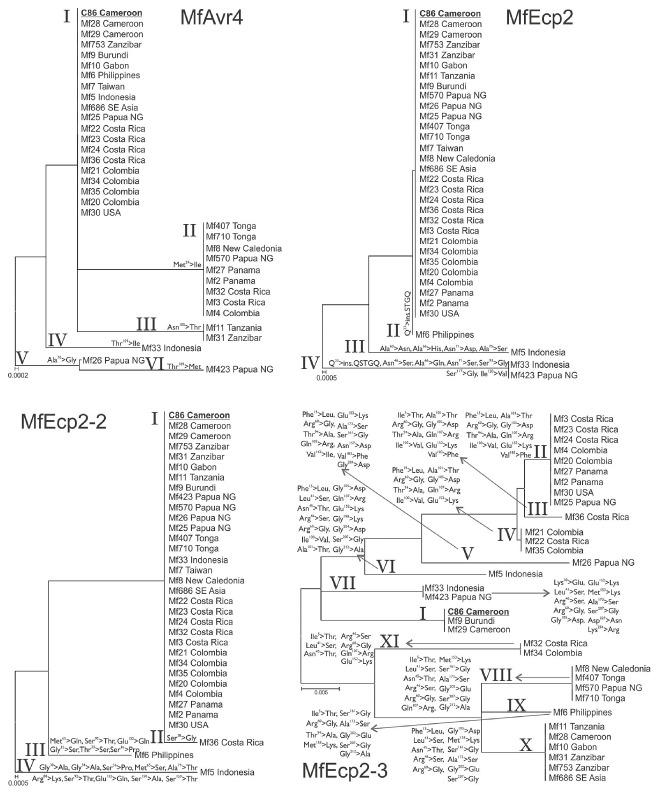
Phylogenetic relations among protein isoforms of the Mycosphaerella fijiensis MfAvr4, MfEcp2, MfEcp2‐2 and MfEcp2‐3 effectors. Unrooted neighbour‐joining trees were constructed using Poisson correction, with uniform substitution rates and with all ambiguous positions removed from each sequence pair compared. Amino acid substitutions that distinguish each isoform from the reference C86 sequence (in bold and underlined) and the geographical origin of the isolates are also indicated. Isoforms are indicated in Roman numerals. Ala, alanine; Arg, arginine; Asn, asparagine; Asp, aspartic acid; Gln, glutamine; Glu, glutamic acid; Gly, glycine; His, histidine; Ile, isoleucine; Leu, leucine; Lys, lysine; Met, methionine; Phe, phenylalanine; Pro, proline; Ser, serine; Thr, threonine; Tyr, tyrosine; Val, valine.
MfAvr4
Seventeen DNA polymorphisms were observed in DNA alignments of MfAvr4, including five nonsynonymous substitutions present in the 363‐bp protein‐coding region of the gene and six synonymous ones (Fig. 1; Table S2). Notably, two of the nonsynonymous substitutions involved a two‐state amino acid change (p.Thr109Met/Ile), suggesting that this site is under positive selection. Both of these polymorphisms are also radical substitutions based on the physicochemical properties of the amino acids, which could affect the structure and function of the protein produced. Six of the DNA polymorphisms observed in MfAvr4 were in the 59‐bp intron of this gene, including three single nucleotide substitutions and the independent deletion of two (c.363 + 11_12delTT) and three (c.363 + 10_12delATT) consecutive nucleotides, respectively. These were the only insertions and deletions (indels) identified in DNA alignments of MfAvr4. Based on the DNA polymorphism data, eight different alleles of MfAvr4 could be deduced, which translated into six different protein isoforms (I–VI) (Fig. 2). These differed in only one (isoforms II, III, IV and V) or two (isoform VI) amino acids from the reference MfAvr4 protein sequence (isoform I), represented by the African strain C86 (Stergiopoulos et al., 2010). The reference isoform I was the most frequently observed protein variant, which was broadly distributed in 20 strains from Africa (n = 6), South‐East Asia (n = 5) and Latin America (n = 9), followed by isoform II, which was present in strains from South‐East Asia (n = 4) and Latin America (n = 5), and isoform III, which was present only in Africa (n = 2). Isoforms IV, V and VI were represented by a single strain each, originating from South‐East Asia (Fig. 2).
MfEcp2
Twenty‐four DNA polymorphisms were observed in MfEcp2, 18 of which were present in the 483‐bp coding region of the gene and six in the 71‐bp intron sequence (Fig. 1; Table S2). Two polymorphic alleles were also identified, bearing an almost identical large nucleotide in‐frame insertion in exon I of the gene. This insertion of 15 bp, coding for the amino acids Gln‐Ser‐Thr‐Gly‐Gln, is present in the first allele between amino acids p.Gln23 and p.Ala24 of the encoded protein, whereas an insertion of 12 bp, coding for the amino acids Ser‐Thr‐Gly‐Gln, is present at exactly the same position in the second allele. Apart from these two large in‐frame insertions, all other DNA polymorphisms present in protein‐coding sequences of MfEcp2 were single nucleotide substitutions (n = 18), with the majority (n = 12) leading to amino acid substitutions. Notably, as in MfAvr4 and also in MfEcp2, four polymorphisms were identified that produce two two‐state amino acid substitutions (p.Ala66His/Gln and p.Asn71Ser/Asp), implying positive selection at these sites. Most missense DNA polymorphisms were located in exon I of the encoding gene, in contrast with silent substitutions that were all (but one) present in exon II. Finally, six polymorphisms were identified in the intron sequence of MfEcp2, including four indels. Despite the large number of polymorphisms identified in MfEcp2, these were concentrated in only five alleles that translated into four different protein isoforms (I–IV), including the reference MfEcp2 isoform I represented by strain C86 (Fig. 2). Most of the amino acid variation was present in just two rare isoforms of the protein, which differed from the reference MfEcp2 sequence in four (isoform III; n = 1) and 11 (isoform IV; n = 2) polymorphisms, respectively, including the large five‐amino‐acid in‐frame insertion in isoform IV. The second in‐frame insertion of four amino acids was present in isoform II (n = 2), which did not contain any other changes relative to the reference MfEcp2 protein. All alleles with polymorphisms in MfEcp2 were observed in strains originating from South‐East Asia.
MfEcp2‐2
Twenty single nucleotide substitutions were identified in the 522‐bp protein‐coding sequence of MfEcp2‐2, with the majority (n = 18) producing missense mutations. Two more polymorphisms were identified in the 66‐bp intron of the gene (Fig. 1; Table S2). Notably, eight of the missense mutations invoke amino acid substitutions of or to Ser and Thr amino acid residues. These two amino acids are frequently found in protein functional centres, such as the catalytically active sites of many enzymes, suggesting that MfEcp2‐2 could be involved in protein–protein interactions. The distribution of polymorphisms within the coding sequence of the gene revealed high localized levels of nucleotide diversity in exon I, in which a ‘mutational hot‐spot’, located just after the start of the mature MfEcp2‐2 protein, was detected. In addition, two nonsynonymous substitutions, leading to a two‐state amino acid change (p.Met65Gln/Ser), were detected in exon I, implying positive selection. Based on polymorphisms at the DNA and protein level, respectively, five alleles of MfEcp2‐2 and four protein isoforms (I–IV) could be distinguished, including the reference MfEcp2‐2 isoform from the African strain C86 (isoform I) (Fig. 2). All nonsynonymous substitutions were accumulated in only three rare variants of the protein that differed by one (isoform II; n = 1), six (isoform III; n = 1) and 10 (isoform IV; n = 1) amino acids from the reference MfEcp2‐2 protein, respectively. As for MfEcp2, all strains with polymorphisms in MfEcp2‐2 originated from South‐East Asia, suggesting that this is a cradle for allelic variation in M. fijiensis.
MfEcp2‐3
Forty‐one DNA polymorphisms were identified in MfEcp2‐3, which is the largest number of polymorphisms identified in the four effector genes of M. fijiensis examined in this study (Fig. 1; Table S2). The majority (n = 36) of polymorphisms were present within the 714‐bp coding region of MfEcp2‐3 and caused amino acid substitutions (n = 26) in the protein produced, suggesting that the locus is under positive and/or relaxed selection. Nonsynonymous and synonymous substitutions were almost equally distributed between the two more or less equal‐sized exons of the gene, in contrast with MfEcp2 and MfEcp2‐2, where a strong bias for the presence of polymorphisms in exon I was observed. Five polymorphisms were also present in the 71‐bp intron of MfEcp2‐3, including three indels, the only ones identified in the MfEcp2‐3 alignments. Eleven alleles of MfEcp2‐3 could be distinguished, which translated into an equal number of protein isoforms (isoforms I–XI) with complex patterns of shared polymorphisms that could have been the result of intragenic recombination or convergent evolution (Fig. 2). The frequency distribution of these isoforms showed the existence of both common (isoforms II and X), intermediate (isoforms I, IV, VIII) and rare (isoforms III, V, VI, VII, IX, XI) frequency isoforms. However, only two of these isoforms were shared between isolates originating from different parts of the world.
New effector alleles can be created by intragenic recombination
Visual inspection of the distribution of polymorphisms in effector alleles of M. fijiensis and, especially, MfEcp2‐3 suggests that some of the observed distribution could be the result of intragenic recombination. To further explore this possibility and look for evidence of intragenic recombination in the four effector genes, we used several sequence‐based recombination detection methods. This was performed because of the differences in power and accuracy of the different algorithms implemented in these methods to detect recombination. Evidence of recombination was first investigated by the analysis of split‐networks generated with the SplitsTree4 program (Huson, 1998) (Fig. S1, see Supporting Information). Networks constructed using the SplitDecomposition method (Bandelt and Dress, 1992) showed a tree‐like topology for MfAvr4 (Fig. S1A), MfEcp2 (Fig. S1C) and MfEcp2‐2 (Fig. S1D), suggesting that the underlying evolutionary processes for these genes are bifurcating. However, for MfEcp2‐3, a single reticulate box was identified, providing evidence of conflicting phylogenetic signals for this locus within the analysed sequences. To further resolve the phylogenetic networks, we applied the NeighborNet algorithm (Bryant and Moulton, 2004), which, according to the least‐squares fitted values, provided a better fit for MfAvr4 (99.62% vs. 88.2% for SplitDecomposition) and MfEcp2‐3 (99.45% vs. 59.86% for SplitDecomposition). For MfEcp2 and MfEcp2‐2, both methods fitted the data equally well at 99.99%. The split‐network computed with the NeighborNet algorithm again produced tree‐like structures for MfEcp2 and MfEcp2‐2, supporting a model of bifurcating evolution. In contrast, it revealed a reticulate network structure for MfAvr4 (Fig. S1B) and MfEcp2‐3 (Fig. S1F), implying that these two genes have been affected by intragenic recombination. The parallelogram formation and the number of reticulating branches observed are considerably higher in MfEcp2‐3 than MfAvr4, suggesting that this gene is more severely affected or likely to have been affected by recombination. Indeed, the pairwise homoplasy index (PHI) (Bruen et al., 2006) test detected significant evidence for recombination in MfEcp2‐3 (P = 5.17 × 10⁻⁷), but not in MfAvr4 (P = 0.814), MfEcp2 (P = 1.0) or MfEcp2‐2 (P = 1.0).
To validate these results and locate possible recombination breakpoints within the MfEcp2‐3 alignment, we further used the single breakpoint recombination (SBR) method and the genetic algorithm for recombination detection (GARD) (Pond et al., 2006), as implemented in the ‘Datamonkey’ webserver (Delport et al., 2010). Both methods detected significant evidence for recombination only between the MfEcp2‐3 alleles, but not for the other genes included in this study (Fig. S2, see Supporting Information). SBR found significant evidence of recombination, and reported position 280 in the MfEcp2‐3 alignment as a possible recombination breakpoint (Fig. S2A). The position was inferred with 100% confidence by both the Akaike information criterion (AIC) and the small‐sample AIC (AICc) (Pond et al., 2006). AICc also identified position 427 of the nucleotide alignment as a potential recombination breakpoint (Fig. S2B). Notably, the multiple breakpoint model offered an improvement of 87.66 to the AICc score over the no‐recombination single phylogeny model, thus providing strong evidence that at least one of the two recombination breakpoints reflects a true topological incongruence in the MfEcp2‐3 alignment. Indeed, both recombination breakpoints were validated by the Kishino–Hasegawa (KH) test (Kishino and Hasegawa, 1989), which demonstrated significant (P < 0.01) incongruence between topologies before and after each breakpoint (Fig. S2C). In this case, both left‐hand side (LHS) and right‐hand side (RHS) P values were 0.0004. Moreover, the phylogenies of the segments before, after and in between the two suggested breakpoints also revealed highly different branching patterns, indicative of incongruent topologies, and thus recombination. Finally, similar results were obtained when using eight recombination detection algorithms (BootScan, RDP, GENECOV, MaxChi, Chimaera, PhylPro, SiScan, 3Seq) available with the RPD4 software program (Martin et al., 2010) (Fig. S3, see Supporting Information Results S1).
Effector genes of M. fijiensis are under positive selection
We further examined whether the molecular evolution of MfAvr4, MfEcp2, MfEcp2‐2 and MfEcp2‐3 has been shaped by natural selection, which could signify a co‐evolutionary arms race with the host. Because selection is most typically directed towards a few individual sites and rarely only on entire domains, we used the maximum likelihood (ML) codon‐based site models implemented in CODEML (Yang, 2007; Yang and Bielawski, 2000) to determine instances of departures from the neutral model of molecular evolution and to identify such sites. For all four genes, likelihood ratio tests (LRTs), comparing models M3 (discrete rate categories) and M0 (single rate), indicated a significant variation from the neutral model of molecular evolution at P < 0.05 (MfAvr4) or P < 0.01 (MfEcp2, MfEcp2‐2 and MfEcp2‐3) (Table S3, see Supporting Information). To identify specific codons evolving with ω > 1, we tested whether models M2a and M8, which allow for positively selected sites, fitted the data better than their nested null models M1a and M7, respectively. LRT tests showed that, for MfEcp2, MfEcp2‐2 and MfEcp2‐3, the positive selection models M2a and M8 were significantly (P < 0.001) favoured over their nested null models, thus revealing the presence of positively selected sites. However, this was not the case for MfAvr4. The ML analysis with model M8 identified that 3.2%, 0.6% and 12.7% of the sites are evolving with ω > 1 in MfEcp2, MfEcp2‐2 and MfEcp2‐3, respectively. Using the naïve empirical Bayes (NEB) and Bayes empirical Bayes (BEB) inference methods, at least one amino acid (p.66A) in MfEcp2, one (p.65M) in MfEcp2‐2 and 11 (p.5I, p.15F, p.41L, p.45N, p.46R, p.01A, p.105G, p.107Q, p.173A, p.207S, p.212G) in MfEcp2‐3 were identified with support from both methods at posterior probabilities of 1% as being positively selected. The amino acids in MfEcp2‐3 are distributed over the entire protein, which might suggest that they constitute part of a conformational epitope.
The presence of a large number of codon sites in MfEcp2‐3 which are positively selected suggests that high allelic diversity in this gene is driven by diversifying selection. However, caution should be taken, as recombination can affect the detection of positive selection and overinflate the results (Nielsen, 2005; Yang and Bielawski, 2000). Thus, we also used the recombination‐aware single‐likelihood ancestor counting (SLAC), fixed effects likelihood (FEL) and random effects likelihood (REL) methods (Pond and Frost, 2005), implemented in the ‘Datamonkey’ webserver (Delport et al., 2010), to search for signatures of natural selection in the genes and to further identify sites that may have been affected by purifying selection (Table S4, see Supporting Information). Four sites (p.24M, p.70A, p.105N, p.109T) received support by REL as being positively selected in MfAvr4. Three additional sites were inferred to be negatively selected, with one site (p.85G) receiving support by all three methods, one (p.90D) by SLAC and FEL, and one (p.115E) by FEL alone. For MfEcp2, three sites (p.60A, p.66A, p.71N) were inferred by REL to be positively selected and three (p.113N, p.119K, p.151I) by FEL to be under negative selection. For MfEcp2‐2, a single positively selected site (p.65M) was detected by REL, whereas two negatively selected sites (p.9L, p.94V) were detected by FEL. Finally, for MfEcp2‐3, 14 and three sites were inferred by at least one of the three methods to be positively or negatively selected, respectively. All 14 positively selected sites received support by REL, two (p.15I and p.94T) of which received additional support from FEL. All three negatively selected sites in MfEcp2‐3 received support from FEL alone. From the data shown above, it is evident that the results obtained with REL corroborate those obtained using the codon‐based models in CODEML. This is not surprising as REL is an extension of the codon‐based selection analyses implemented in CODEML (Pond and Frost, 2005).
Polymorphisms in the M. fijiensis effectors can abolish recognition by cognate tomato Cf resistance proteins
Previously, we have demonstrated that the reference MfAvr4 protein (isoform I) can trigger a Cf‐4‐mediated HR in tomato and in Nicotiana benthamiana plants transgenic for Cf‐4 (Stergiopoulos et al., 2010). Here, we tested whether allelic variants of MfAvr4 from natural populations of the fungus are still recognized by the Cf‐4 resistance protein. Agroinfiltrations in Cf‐4 N. benthamiana plants of the MfAvr4 allele encoding isoforms II (p.Met24Ile), III (p.Asn105Thr), V (p.Ala70Gly) and VI (p.Ala70Gly, p.Thr109Met) elicited an HR similar to the ‘wild‐type’ MfAvr4 isoform I (Fig. 3). However, isoform IV (p.Thr109Ile) failed to elicit an HR on Cf‐4 N. benthamiana plants, indicating loss of recognition by Cf‐4. Interestingly, isoform VI, in which p.Thr109 is substituted by Met, is still recognized by Cf‐4, indicating that, next to position, the physicochemical properties of the substituted amino acid are also critical.
Figure 3.
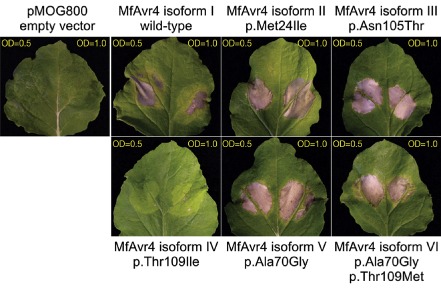
Transient expression of the MfAvr4 effector alleles in Cf‐4‐transgenic Nicotiana benthamiana plants, using the Agrobacterium tumefaciens transient transformation assay (ATTA). For ATTAs, A. tumefaciens cultures containing binary expression vectors with the MfAvr4 alleles encoding the different protein isoforms identified in this study were infiltrated at an optical density (OD) of 0.5 (left side of leaf) and 1.0 (right side of leaf) in leaves of 5‐week‐old N. benthamiana plants. Infiltrations with A. tumefaciens cultures containing empty vector pMOG800 were used as a negative control. Photographs were taken at 6 days post‐infiltration.
We have also demonstrated previously the specific HR‐associated recognition of MfEcp2 (isoform I) in MoneyMaker (MM)‐Cf‐Ecp2 tomato plants. Moreover, we have shown that isoform I of MfEcp2 induces low levels of necrosis in MM‐Cf‐0 tomato plants that lack Cf‐Ecp2, most probably by interacting with a host virulence target that is guarded by Cf‐Ecp2 (Stergiopoulos et al., 2010). Agroinfections of 2‐week‐old MM‐Cf‐Ecp2 plants with Agrobacterium tumefaciens expressing the PVX::MfEcp2 alleles encoding isoforms II and III failed to elicit an HR, indicating loss of recognition by Cf‐Ecp2 (Fig. 4). However, transient expression of the MfEcp2 allele encoding isoform IV elicited a weaker HR than isoform I on MM‐Cf‐Ecp2 tomato plants. In addition, isoforms II, III and IV failed to elicit any macroscopically visible necrosis in MM‐Cf‐0 plants when systemically delivered by Potato virus X (PVX). These observations indicate that polymorphisms identified in MfEcp2 considerably compromised the ability of the protein to interact directly or indirectly with Cf‐Ecp2 or other targets in MM‐Cf‐0 plants. Finally, PVX‐based transient expression of MfEcp2‐2 and MfEcp2‐3 and the alleles thereof identified in this study in MM‐Cf‐Ecp2 and MM‐Cf‐0 plants did not trigger any visible HR or necrosis, respectively, indicating that Cf‐Ecp2 is ineffective against these two effectors (Figs S4 and S5, see Supporting Information).
Figure 4.
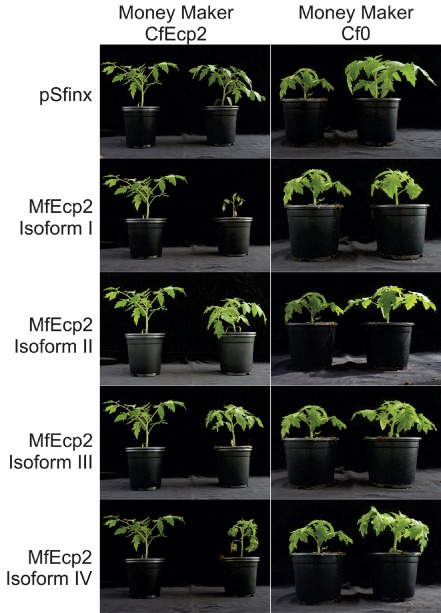
Transient expression of the MfEcp2 effector alleles in the near‐isogenic MoneyMaker (MM‐Cf‐0; known Cf resistance genes are absent) and MM‐Cf‐Ecp2 (Cf‐Ecp2 resistance gene is present) tomato lines using the Potato virus X (PVX)‐based expression system. Tomato plants were inoculated with Agrobacterium tumefaciens transformants expressing the binary PVX‐based vector pSfinx fused to the MfEcp2 alleles encoding the different protein isoforms identified in this study (plants on the right in each panel). Tomato plants inoculated with the empty pSfinx vector (plants on the left in each panel) were used as reference plants. In the presence of the Cf‐Ecp2 resistance gene, the wild‐type MfEcp2 effector triggers a hypersensitive response (HR). Low levels of HR are also induced when the wild‐type MfEcp2 effector is systemically delivered in MM‐Cf‐0 plants. Only mosaic symptoms typical for PVX infections are seen on the plants after inoculation with the empty pSfinx binary vector.
Discussion
Overall, the combined results from tests of neutrality and codon‐based methods are consistent with a model of MfEcp2 and MfEcp2‐2 evolving under positive directional selection, and MfEcp2‐3 under balancing selection. The occurrence of multiple alleles of this effector in both global and local populations of the pathogen argue in favour of balancing selection, a pattern frequently seen with fungal avirulence genes (Aguileta et al., 2009; Sacristan and Garcia‐Arenal, 2008; Stukenbrock and McDonald, 2009). We consider balancing selection as another form of positive diversifying selection, which, next to overdominance and frequency‐dependent selection, acts as a general mechanism for maintaining protein polymorphisms in natural populations (Charlesworth, 2006; Nielsen, 2005). Directional selection, however, will work towards the fixation of one or a few advantageous alleles in the population (Hurst, 2009). This is probably the case for MfEcp2 and MfEcp2‐2 for which only a few, highly diversified alleles were detected. Finally, MfAvr4 could be seen as evolving neutrally, as most tests of selection failed to reject the hypothesis of neutral evolution. However, the presence of multiple MfAvr4 alleles in global populations of the pathogen, as well as a two‐state amino acid substitution (p.Thr109Met/Ile) in different protein isoforms, argue against neutral evolution and point towards positive diversifying selection. Such a discrepancy may be the result of variability in sensitivity of the tests and the limited number of segregating sites that were compared (Nielsen, 2005; Zeng et al., 2006). Thus, it is possible that weak balancing selection is also responsible for the maintenance of genetic variation in the MfAvr4 locus.
Our sequence analyses indicated that, next to positive selection, effector diversification in M. fijiensis is also driven by intragenic recombination. Overall, the results obtained by the implementation of different recombination detection methods indicate that an underlying low frequency of intragenic recombination has affected the allelic patterns observed in MfEcp2‐3. Recombination is a powerful evolutionary force that can accelerate the emergence of immune escape mutations by the production of chimeric effector genes from existing alleles, and further play an important role in maintaining effector diversity in pathogen populations (Watt, 1972; Webster and Hurst, 2012). It has been shown that recombination‐assisted evolution frequently appears at higher rates in genes that are subject to diversifying selection (Stukenbrock and McDonald, 2009). This also seems to be the case in our study, as evidence of intragenic recombination was obtained for MfEcp2‐3, which is under balancing selection, but not for MfEcp2 and MfEcp2‐2, which are under directional selection. Some weak, although not statistically supported, evidence of intragenic recombination was also obtained for MfAvr4, a gene that is suspected to be under weak balancing selection. The fact that both intragenic recombination and positive diversifying selection can act in concert to promote and maintain rapid sequence diversification in effector genes of M. fijiensis could significantly enhance the pathogen's ability to rapidly adapt to changing selective pressures imposed by the host immune system. This should not be underestimated when designing effective disease control strategies, as pathogens with high evolutionary potential are more likely to overcome genetic resistance that relies on single resistance genes (McDonald and Linde, 2002).
Loss‐of‐function mutants and complete gene deletions are frequently associated with the transition from avirulence to virulence in fungal plant pathogens, where the conditional benefits from abolishing the genes under strong selection pressure might be higher than the costs of the loss (Stergiopoulos et al., 2007; Stukenbrock and McDonald, 2009). However, natural selection in protein‐coding sequences of all four effector genes studied here favours polymorphisms that result in single amino acid substitutions over indels or complete gene deletions. This is in contrast with polymorphisms present in intron sequences of the genes, where several indels are observed. The suppression of frame‐shifting indels in protein‐coding regions of the genes is suggestive of selective constraints for the preservation of the final gene product, and implies an important and possibly indispensable role of the proteins for the fungus.
In the absence of known cognate resistance proteins in Musa spp. that could perceive the M. fijiensis effectors studied here, it is currently unknown how much of the observed allelic variation in effector genes of M. fijiensis reflects adaptive variation versus random mutation. However, the large number of polymorphisms observed in effector genes of M. fijiensis suggests that these are targets of immunity in Musa spp. Subsequently, it can be hypothesized that positive selection, driven by antagonistic co‐evolution with host immune receptors and/or other host targets, is responsible for the maintenance of high levels of sequence polymorphisms in effector genes of the pathogen. Indeed, the signature of positive selection and the presence of mutational hot‐spots in M. fijiensis effectors are suggestive of the presence of immunogenic epitopes that are involved in interactions with host immune receptors. In contrast, residues under strong negative selection could specify regions that are critical for the structure and intrinsic function of the proteins (Nilsson et al., 2011). This scenario is in line with the classical co‐evolutionary arms race model between pathogen effectors and cognate host immune receptors, in which the molecular evolution of effectors is defined by the opposing forces of maintaining function, on the one hand, and avoiding host recognition, on the other (Ma and Guttman, 2008).
Although an attractive model, evasion of host resistance through effector diversification in a co‐evolutionary arms race between the host and the pathogen will be a viable evolutionary option only if the effector is specifically recognized by a cognate immune receptor in the host. The recent completion of the Musa acuminata genome sequence, one of the two double‐haploid progenitors of currently grown banana cultivars of the Cavendish group, has revealed the presence of 89 nucleotide‐binding site (NBS) leucine‐rich repeat (LRR) proteins in this species (D'Hont et al., 2012). Several other studies have reported the cloning of a series of resistance gene analogues (RGAs) from a multitude of banana cultivars and wild Musa accessions (Azhar and Heslop‐Harrison, 2008; Chen et al., 2007; Miller et al., 2008), including putative orthologues of the tomato Cf genes, such as, for example, those amplified in landrace Zebrina GF (Wiame et al., 2000). It is expected that cognate immune receptors able to perceive the M. fijiensis effectors studied here are present in wild Musa germplasm. Subsequently, the distribution and diversity of such cognate immune receptors in Musa spp. could account for the generation and maintenance of adaptively significant variation in effector genes of the pathogen.
In favour of the above hypothesis, most allelic variation identified in effector genes of M. fijiensis is concentrated in a few strains originating from South‐East Asia. This is perhaps not surprising, as historic records and population studies place the Asian‐Pacific region as the primary centre of origin and diversification of the pathogen and the banana crop (Carlier et al., 1996; Robert et al., 2012). The presence and maintenance of multiple effector alleles in pathogen populations derived from this part of the world could reflect a long co‐evolutionary history between M. fijiensis and immune receptors within the Musa genus. In contrast, in continents in which the genetic diversity of cultivated bananas and plantain is narrow, such as Latin America and Africa, intraspecific effector diversity in pathogen populations is limited, indicating the absence of selection pressure, and/or founder and hitchhiking effects. Indeed, studies on the global genetic structure of M. fijiensis suggest a fairly recent migration of the fungus from South‐East Asia to other continents, followed by widespread founder effects (Robert et al., 2012). Furthermore, the genetic basis of currently grown commercial cultivars of edible banana and plantain is extremely narrow, as most are merely sterile parthenocarpic hybrids between the wild species Musa acuminata (A genome) and Musa balbisiana (B genome) that have largely evolved via asexual vegetative propagation (Heslop‐Harrison and Schwarzacher, 2007). It is estimated that over 47% of the bananas produced globally today belong to a single Cavendish group, a triploid (AAA) derivative of Musa acuminata susceptible to infections by M. fijiensis (Arias et al., 2003). Cavendish bananas have replaced the popular Gros Michel cultivar in the 1960s that was purged worldwide by the so‐called ‘Panama disease’, caused by Fusarium oxysporum f. sp. cubensis tropical race 1 and, as a result, became the main group of banana cultivars currently grown in most of the world (Ploetz, 1994). Thus, lack of selection pressure imposed by the host on the pathogen in Latin America and Africa, where almost exclusively Cavendish bananas are grown (Arias et al., 2003), and the narrow genetic diversity of the pathogen in these two continents probably account for the extremely limited allelic variation observed in its effector genes.
One of the main objectives of this study was to evaluate the potential durability of the tomato Cf‐4 and Cf‐Ecp2 resistance genes in the field against M. fijiensis, if genetically transformed into banana. Cloning of the tomato Cf‐Ecp2 still remains elusive, but three candidate genes have already been mapped to the Orion locus on the short arm of tomato chromosome 1 (de Kock et al., 2005). Our analyses indicate that, even if functional in the genetic background of banana, Cf‐4 and Cf‐Ecp2 are unlikely to provide durable resistance against black leaf streak disease in the field, as MfAvr4 and MfEcp2 alleles, whose products are able to overcome these two resistance genes, are already present in natural populations of the pathogen. More specifically, an isoform of MfAvr4 was identified bearing an amino acid substitution (p.Thr109Ile) that evaded Cf‐4‐mediated HR in transient expression assays in N. benthamiana. This is rather surprising as substitution of p.Thr109 by Met in another isoform of MfAvr4 was still functional in triggering a Cf‐4‐mediated HR. Previous studies have also shown that Cf‐4 is able to perceive highly diversified homologues of Avr4 from different fungal species, which led to the assumption that the perception of homologous Avr4 effector proteins by Cf‐4 is based on the effector's tertiary structure rather than individual amino acids present in solvent‐exposed antigenic domains of the proteins (de Wit et al., 2012; Stergiopoulos et al., 2010). This might also be the reason why natural selection in C. fulvum Avr4 favours amino acid substitutions of mainly cysteine residues that disrupt the disulphide bonds and destabilize the protein, enabling proteases in the tomato apoplast to degrade it. In this way, such isoforms can evade Cf‐4‐mediated recognition, but still retain their ability to bind to chitin and protect the fungus against host chitinases (van den Burg et al., 2003; Joosten et al., 1997; Stergiopoulos et al., 2007). Altogether, it is becoming clear that the interaction between Cf‐4 and the Avr4 homologues appears to be more complex than initially thought. Finally, almost all isoforms of MfEcp2 described here were able to evade recognition by the putative Cf‐Ecp2 resistance gene present in tomato. These isoforms also lost their ability to induce necrosis in tomato in the absence of the cognate Cf‐Ecp2 gene, indicating that the cumulative effect of the mutations present in the isoforms is significant. Furthermore, neither MfEcp2‐2 nor MfEcp2‐3 or any of their allelic variants were able to trigger any necrosis in tomato plants in the presence of Cf‐Ecp2, indicating that this resistance gene would not be effective against these two effectors. Still encouraging is the fact that isoforms of MfAvr4 and MfEcp2, which fail to elicit a Cf‐4‐ and Cf‐Ecp2‐mediated HR, respectively, are restricted to populations of the pathogen from South‐East Asia. Strains originating from Latin America and Africa are much more homogeneous, and have no mutations in MfAvr4 and MfEcp2 that can overcome Cf‐4‐ and Cf‐Ecp2‐mediated resistance. Thus, the deployment of Cf‐4 and Cf‐Ecp2 genes in these continents might still prove to be effective.
Experimental Procedures
An extension of the materials and methods is provided as Supporting Experimental Procedures (see Supporting Information).
Fungal material
The strains used are listed in Table S1. The MfAvr4 (Mycfi2:87167), MfEcp2 (Mycfi2:52972), MfEcp2‐2 (Mycfi2:187124) and MfEcp2‐3 (Mycfi2:198160) effector genes of M. fijiensis (Stergiopoulos et al., 2010) were amplified and sequenced using the primers listed in Table S5 (see Supporting Information).
DNA polymorphisms
Effector sequences from the African strain CIRAD86 (C86) were used as the reference alleles, with which all other sequences were compared (Stergiopoulos et al., 2010). Standard molecular diversity indices were calculated using DnaSP v5 (Librado and Rozas, 2009). Haplotypes were inferred based on the allelic variation observed in individual effector genes, and cladograms depicting the evolutionary relationships among the deduced protein isoforms were inferred by neighbour joining.
Analysis of recombination
Evidence of recombination was first tested by the analysis of split‐networks using the SplitsTree4 software package (Huson, 1998). We then used SBR and GARD, as implemented at the ‘Datamonkey’ webserver (Delport et al., 2010), to identify recombination breakpoints in the alignments. This analysis was further corroborated by the use of several of the recombination detection methods implemented in the RDP v.4 (RDP4) software package (Martin et al., 2010).
Tests of selection
We investigated departures from neutrality, and patterns of selection at individual sites were assessed using the site models (M0, M1a, M2a, M3, M7 and M8) implemented in the CODEML program of the PAML v4.4 software package (Yang, 2007; Yang and Bielawski, 2000). To account for the adverse effects of recombination in detecting instances of positive selection and to identify sites that may have been affected by purifying or diversifying selection, we also used the recombination‐aware SLAC, FEL and REL methods (Pond and Frost, 2005) implemented in the ‘Datamonkey’ webserver (Delport et al., 2010).
Plant assays
The tomato lines used were the cultivar MoneyMaker carrying no known functional Cf resistance genes (MM‐Cf0) and its breeding line Ontario‐7518 carrying a putative Cf‐Ecp2 resistance gene (MM‐Cf‐Ecp2) (Haanstra et al., 1999). For transient expression of MfAvr4 and its alleles in N. benthamiana, we used transgenic plants expressing Cf‐4 (Gabriels et al., 2006). Agrobacterium tumefaciens (strain MOG101) transient transformation assays (agroinfiltrations) and PVX‐mediated transient expression of effector alleles in tomato (agroinfections) were performed according to Stergiopoulos et al. (2010).
Supporting information
Fig. S1 Split graphs with inferred reticulate phylogenetic relationships among the MfAvr4, MfEcp2, MfEcp2‐2 and MfEcp2‐3 allelic variants. The networks include all isolates; graphs were constructed using SplitDecomposition (left‐hand graphs: A, C and E) and NeighborNet (right‐hand graphs: B, D and F) methods with uncorrected p distances as implemented in SplitsTree version 4. In the case of MfEcp2 and MfEcp2‐2, both methods yielded the same network. Least‐squares (LS) fitted values for each method are indicated, as well as the P values of the PhiTest for recombination (n.s., not significant).
Fig. S2 Analysis of recombination in the MfEcp2‐3 alleles using the genetic algorithm for recombination detection (GARD). (A) Plot of the inferred recombination breakpoints in the MfEcp2‐3 alignment and their support probabilities. The x axis represents the nucleotide position in the alignment and the vertical bars denote putative recombination breakpoints. When shown in green, breakpoints are statistically supported by the Kishino–Hasegawa (KH) test at P < 0.01. The y axis represents support values for breakpoints (1.0 = 100% support). (B) GARD recombination report. Recombination breakpoints (Bps) and the small‐sample Akaike information criterion (AICc) values are indicated. ΔAICc represents the improvement over the AICc score by fitting a multiple breakpoint model to the data, as opposed to absence in recombination. In general, ΔAICc > 10 is strongly supportive of recombination, and the higher the value the more likely that recombination has taken place. Evidence for two breakpoints at positions 280 and 427, respectively, of the MfEcp2‐3 nucleotide alignment is found, but only the breakpoint at position 280 is supported by ΔAICc. (C) Neighbour‐joining trees constructed with different segments of the alignment: (i) entire length (nucleotide positions 1–714); (ii) from start to the first recombination breakpoint (nucleotide positions 1–280); (iii) between the first and second breakpoints (nucleotide positions 281–427); and (iv) from the second breakpoint to the end (nucleotide positions 428–714). The phylogenies show highly incongruent topologies, which is strong evidence for recombination.
Fig. S3 Graphical representation of the individual recombination events detected in the MfEcp2‐3 alignment using eight different methods implemented in the recombination detection software program version 4 (RDP4). Grey bars represent the length of each MfEcp2‐3 allele and coloured bars indicate individual recombination events (minor donors). Recombination events are colour coded according to the method by which they were detected. Nucleotide positions of recombination breakpoints, as well as the P values associated with each event, as calculated by the method by which the event was detected, are indicated to the left or right of each event. Each strain represents a different MfEcp2‐3 isoform.
Fig. S4 Transient expression of the MfEcp2‐2 effector alleles in the near‐isogenic MoneyMaker (MM‐Cf‐0; known Cf resistance genes are absent) and MM‐Cf‐Ecp2 (Cf‐Ecp2 resistance gene is present) tomato lines using the Potato virus X (PVX)‐based expression system. Tomato plants were inoculated with Agrobacterium tumefaciens transformants expressing the binary PVX‐based vector pSfinx fused to the MfEcp2‐2 alleles encoding the different protein isoforms identified in this study. Mosaic symptoms are only seen when any of the MfEcp2‐2 alleles are expressed in MM‐Cf‐0 and MM‐Cf‐Ecp2 tomato lines (plants on the left in each panel), similar to symptoms triggered by the empty pSfinx binary vector (plants on the right in each panel). Photographs were taken at 21 days post‐inoculation.
Fig. S5 Transient expression of the MfEcp2‐3 effector alleles in the near‐isogenic MoneyMaker (MM‐Cf‐0; known Cf resistance genes are absent) and MM‐Cf‐Ecp2 (Cf‐Ecp2 resistance gene is present) tomato lines using the Potato virus X (PVX)‐based expression system. Tomato plants were inoculated with Agrobacterium tumefaciens transformants expressing the binary PVX‐based vector pSfinx fused to the MfEcp2‐3 alleles encoding the different protein isoforms identified in this study. Mosaic symptoms are only seen when any of the MfEcp2‐3 alleles are expressed in MM‐Cf‐0 and MM‐Cf‐Ecp2 tomato lines (plants on the left in each panel), similar to symptoms triggered by the empty pSfinx binary vector (plants on the right in each panel). Photographs were taken at 21 days post‐inoculation.
Table S1 Strains of Mycosphaerella fijiensis used in this study.
Table S2 Allelic variation in effector genes of Mycosphaerella fijiensis.
Table S3 Results of the maximum likelihood analysis conducted with CODEML using the site‐specific models. The parameter estimates under the different models are indicated, as well as the likelihood ratio statistics for testing the different hypotheses.
Table S4 Sites inferred to be positively (dN‐dS > 0) or negatively (dN‐dS < 0) selected based on the SLAC, FEL and REL analyses.
Table S5 Polymerase chain reaction (PCR) and sequencing primers used in this study.
Experimental Procedures S1
Results S1
Acknowledgements
IS was financially supported by the NWO‐ERA‐PG project ARAPGFP/06.002A and later on by the UC Davis Faculty Start‐up Funds. This project was co‐financed by the Centre for BioSystems Genomics (CBSG), which is part of the Netherlands Genomics Initiative. PJGMdW was financed by the Royal Netherlands Academy of Arts and Sciences. The authors declare no conflicts of interest.
REFERENCES
- Aguileta, G. , Refregier, G. , Yockteng, R. , Fournier, E. and Giraud, T. (2009) Rapidly evolving genes in pathogens: methods for detecting positive selection and examples among fungi, bacteria, viruses and protists. Infect. Genet. Evol. 9, 656–670. [DOI] [PubMed] [Google Scholar]
- Arias, P. , Dankers, C. , Liu, P. and Pilkauskas, P. (2003) The world banana economy forum 1985–2002. Rome: Tropical and Horticultural Products Service, Food and Agriculture Organization of the United Nations. [Google Scholar]
- Azhar, M. and Heslop‐Harrison, J.S. (2008) Genomes, diversity and resistance gene analogues in Musa species. Cytogenet. Genome Res. 121, 59–66. [DOI] [PubMed] [Google Scholar]
- Bandelt, H.J. and Dress, A.W.M. (1992) Split decomposition: a new and useful approach to phylogenetic analysis of distance data. Mol. Phylogenet. Evol. 1, 242–252. [DOI] [PubMed] [Google Scholar]
- Bruen, T.C. , Philippe, H. and Bryant, D. (2006) A simple and robust statistical test for detecting the presence of recombination. Genetics, 172, 2665–2681. [DOI] [PMC free article] [PubMed] [Google Scholar]
- Bryant, D. and Moulton, V. (2004) Neighbor‐Net: an agglomerative method for the construction of phylogenetic networks. Mol. Biol. Evol. 21, 255–265. [DOI] [PubMed] [Google Scholar]
- van den Burg, H.A. , Westerink, N. , Francoijs, K.J. , Roth, R. , Woestenenk, E. , Boeren, S. , de Wit, P.J.G.M. , Joosten, M.H.A.J. and Vervoort, J. (2003) Natural disulfide bond‐disrupted mutants of AVR4 of the tomato pathogen Cladosporium fulvum are sensitive to proteolysis, circumvent Cf‐4‐mediated resistance, but retain their chitin binding ability. J. Biol. Chem. 278, 27 340–27 346. [DOI] [PubMed] [Google Scholar]
- van den Burg, H.A. , Harrison, S.J. , Joosten, M.H.A.J. , Vervoort, J. and de Wit, P.J.G.M. (2006) Cladosporium fulvum Avr4 protects fungal cell walls against hydrolysis by plant chitinases accumulating during infection. Mol. Plant–Microbe Interact. 19, 1420–1430. [DOI] [PubMed] [Google Scholar]
- Canas‐Gutierrez, G.P. , Angarita‐Velasquez, M.J. , Restrepo‐Florez, J.M. , Rodriguez, P. , Moreno, C.X. and Arango, R. (2009) Analysis of the CYP51 gene and encoded protein in propiconazole‐resistant isolates of Mycosphaerella fijiensis . Pest Manag. Sci. 65, 892–899. [DOI] [PubMed] [Google Scholar]
- Carlier, J. , Lebrun, M.H. , Zapater, M.F. , Dubois, C. and Mourichon, X. (1996) Genetic structure of the global population of banana black leaf streak fungus, Mycosphaerella fijiensis . Mol. Ecol. 5, 499–510. [Google Scholar]
- Charlesworth, D. (2006) Balancing selection and its effects on sequences in nearby genome regions. Plos Genet. 2, 379–384. [DOI] [PMC free article] [PubMed] [Google Scholar]
- Chen, Y.P. , Chen, Y.F. , Zhao, J.T. , Huang, X. and Huang, X.L. (2007) Cloning and expression of resistance gene analogs (RGAs) from wild banana resistant to banana Fusarium wilt. J. Plant Physiol. Mol. Biol. 33, 567–573. [PubMed] [Google Scholar]
- Churchill, A.C.L. (2011) Mycosphaerella fijiensis, the black leaf streak pathogen of banana: progress towards understanding pathogen biology and detection, disease development, and the challenges of control. Mol. Plant Pathol. 12, 307–328. [DOI] [PMC free article] [PubMed] [Google Scholar]
- Delport, W. , Poon, A.F.Y. , Frost, S.D.W. and Pond, S.L.K. (2010) Datamonkey 2010: a suite of phylogenetic analysis tools for evolutionary biology. Bioinformatics, 26, 2455–2457. [DOI] [PMC free article] [PubMed] [Google Scholar]
- D'Hont, A. , Denoeud, F. , Aury, J.‐M. , Baurens, F.‐C. , Carreel, F. , Garsmeur, O. , Noel, B. , Bocs, S. , Droc, G. , Rouard, M. , Da Silva, C. , Jabbari, K. , Cardi, C. , Poulain, J. , Souquet, M. , Labadie, K. , Jourda, C. , Lengelle, J. , Rodier‐Goud, M. , Alberti, A. , Bernard, M. , Correa, M. , Ayyampalayam, S. , McKain, M.R. , Leebens‐Mack, J. , Burgess, D. , Freeling, M. , Mbeguie‐A‐Mbeguie, D. , Chabannes, M. , Wicker, T. , Panaud, O. , Barbosa, J. , Hribova, E. , Heslop‐Harrison, P. , Habas, R. , Rivallan, R. , Francois, P. , Poiron, C. , Kilian, A. , Burthia, D. , Jenny, C. , Bakry, F. , Brown, S. , Guignon, V. , Kema, G. , Dita, M. , Waalwijk, C. , Joseph, S. , Dievart, A. , Jaillon, O. , Leclercq, J. , Argout, X. , Lyons, E. , Almeida, A. , Jeridi, M. , Dolezel, J. , Roux, N. , Risterucci, A.‐M. , Weissenbach, J. , Ruiz, M. , Glaszmann, J.‐C. , Quetier, F. , Yahiaoui, N. and Wincker, P. (2012) The banana (Musa acuminata) genome and the evolution of monocotyledonous plants. Nature, 488, 213–217. [DOI] [PubMed] [Google Scholar]
- van Esse, H. , Bolton, M.D. , Stergiopoulos, I. , de Wit, P.J.G.M. and Thomma, B.P.H.J. (2007) The chitin‐binding Cladosporium fulvum effector protein Avr4 is a virulence factor. Mol. Plant–Microbe Interact. 20, 1092–1101. [DOI] [PubMed] [Google Scholar]
- Gabriels, S.H.E.J. , Takken, F.L.W. , Vossen, J.H. , de Jong, C.F. , Liu, Q. , Turk, S.C.H.J. , Wachowski, L.K. , Peters, J. , Witsenboer, H.M.A. , de Wit, P.J.G.M. and Joosten, M.H.A.J. (2006) cDNA‐AFLP combined with functional analysis reveals novel genes involved in the hypersensitive response. Mol. Plant–Microbe Interact. 19, 567–576. [DOI] [PubMed] [Google Scholar]
- Gassmann, W. and Bhattacharjee, S. (2012) Effector‐triggered immunity signaling: from gene‐for‐gene pathways to protein–protein interaction networks. Mol. Plant–Microbe Interact. 25, 862–868. [DOI] [PubMed] [Google Scholar]
- Haanstra, J.P. , Lauge, R. , Meijer‐Dekens, F. , Bonnema, G. , de Wit, P.J. and Lindhout, P. (1999) The Cf‐ECP2 gene is linked to, but not part of, the Cf‐4/Cf‐9 cluster on the short arm of chromosome 1 in tomato. Mol. Gen. Genet. 262, 839–845. [DOI] [PubMed] [Google Scholar]
- Heslop‐Harrison, J.S. and Schwarzacher, T. (2007) Domestication, genomics and the future for banana. Ann. Bot.‐London, 100, 1073–1084. [DOI] [PMC free article] [PubMed] [Google Scholar]
- Hurst, L.D. (2009) Genetics and the understanding of selection. Nat. Rev. Genet. 10, 83–93. [DOI] [PubMed] [Google Scholar]
- Huson, D.H. (1998) SplitsTree: analyzing and visualizing evolutionary data. Bioinformatics, 14, 68–73. [DOI] [PubMed] [Google Scholar]
- Jain, S.M. and Swennen, R. (2004) Banana Improvement: Cellular, Molecular Biology, and Induced Mutations. Enfield, NH: Science Publishers, Inc. [Google Scholar]
- Jones, J.D.G. and Dangl, J.L. (2006) The plant immune system. Nature, 444, 323–329. [DOI] [PubMed] [Google Scholar]
- Joosten, M.H.A.J. , Vogelsang, R. , Cozijnsen, T.J. , Verberne, M.C. and DeWit, P.J.G.M. (1997) The biotrophic fungus Cladosporium fulvum circumvents Cf‐4‐mediated resistance by producing unstable AVR4 elicitors. Plant Cell, 9, 367–379. [DOI] [PMC free article] [PubMed] [Google Scholar]
- Khanna, H.K. , Paul, J.Y. , Harding, R.M. , Dickman, M.B. and Dale, J.L. (2007) Inhibition of Agrobacterium‐induced cell death by antiapoptotic gene expression leads to very high transformation efficiency of banana. Mol. Plant–Microbe Interact. 20, 1048–1054. [DOI] [PubMed] [Google Scholar]
- Kishino, H. and Hasegawa, M. (1989) Evaluation of the maximum‐likelihood estimate of the evolutionary tree topologies from DNA‐sequence data, and the branching order in Hominoidea. J Mol. Evol. 29, 170–179. [DOI] [PubMed] [Google Scholar]
- de Kock, M.J.D. , Brandwagt, B.F. , Bonnema, G. , de Wit, P.J.G.M. and Lindhout, P. (2005) The tomato Orion locus comprises a unique class of Hcr9 genes. Mol. Breed. 15, 409–422. [Google Scholar]
- Laugé, R. , Joosten, M.H.A.J. , VandenAckerveken, G.F.J.M. , VandenBroek, H.W.J. and DeWit, P.J.G.M. (1997) The in planta‐produced extracellular proteins ECP1 and ECP2 of Cladosporium fulvum are virulence factors. Mol. Plant–Microbe Interact. 10, 725–734. [Google Scholar]
- Librado, P. and Rozas, J. (2009) DnaSP v5: a software for comprehensive analysis of DNA polymorphism data. Bioinformatics, 25, 1451–1452. [DOI] [PubMed] [Google Scholar]
- Ma, W.B. and Guttman, D.S. (2008) Evolution of prokaryotic and eukaryotic virulence effectors. Curr. Opin. Plant Biol. 11, 412–419. [DOI] [PubMed] [Google Scholar]
- Marin, D.H. , Romero, R.A. , Guzman, M. and Sutton, T.B. (2003) Black sigatoka: an increasing threat to banana cultivation. Plant Dis. 87, 208–222. [DOI] [PubMed] [Google Scholar]
- Martin, D.P. , Lemey, P. , Lott, M. , Moulton, V. , Posada, D. and Lefeuvre, P. (2010) RDP3: a flexible and fast computer program for analyzing recombination. Bioinformatics, 26, 2462–2463. [DOI] [PMC free article] [PubMed] [Google Scholar]
- McDonald, B.A. and Linde, C. (2002) Pathogen population genetics, evolutionary potential, and durable resistance. Annu. Rev. Phytopathol. 40, 349–379. [DOI] [PubMed] [Google Scholar]
- Michelmore, R.W. , Christopoulou, M. and Caldwell, K.S. (2013) Impacts of resistance gene genetics, function, and evolution on a durable future. Annu. Rev. Phytopathol. 51, 291–319. [DOI] [PubMed] [Google Scholar]
- Miller, R.N. , Bertioli, D.J. , Baurens, F.C. , Santos, C.M. , Alves, P.C. , Martins, N.F. , Togawa, R.C. , Souza, M.T., Jr and Pappas, G.J., Jr (2008) Analysis of non‐TIR NBS‐LRR resistance gene analogs in Musa acuminata Colla: isolation, RFLP marker development, and physical mapping. BMC Plant Biol. 8, 15. [DOI] [PMC free article] [PubMed] [Google Scholar]
- Nei, M. (1987) Molecular evolutionary genetics. New York: Columbia University Press. [Google Scholar]
- Nielsen, R. (2005) Molecular signatures of natural selection. Annu. Rev. Genet. 39, 197–218. [DOI] [PubMed] [Google Scholar]
- Nilsson, J. , Grahn, M. and Wright, A.P.H. (2011) Proteome‐wide evidence for enhanced positive Darwinian selection within intrinsically disordered regions in proteins. Genome Biol. 12, R65. [DOI] [PMC free article] [PubMed] [Google Scholar]
- Ploetz, R.C. (1994) Panama‐disease—return of the first banana menace. Int. J. Pest Manag. 40, 326–336. [Google Scholar]
- Pond, S.L.K. and Frost, S.D.W. (2005) Not so different after all: a comparison of methods for detecting amino acid sites under selection. Mol. Biol. Evol. 22, 1208–1222. [DOI] [PubMed] [Google Scholar]
- Pond, S.L.K. , Posada, D. , Gravenor, M.B. , Woelk, C.H. and Frost, S.D.W. (2006) Automated phylogenetic detection of recombination using a genetic algorithm. Mol. Biol. Evol. 23, 1891–1901. [DOI] [PubMed] [Google Scholar]
- Robert, S. , Ravigne, V. , Zapater, M.F. , Abadie, C. and Carlier, J. (2012) Contrasting introduction scenarios among continents in the worldwide invasion of the banana fungal pathogen Mycosphaerella fijiensis . Mol. Ecol. 21, 1098–1114. [DOI] [PubMed] [Google Scholar]
- Romero, R.A. and Sutton, T.B. (1997) Sensitivity of Mycosphaerella fijiensis, causal agent of black Sigatoka of banana, to propiconazole. Phytopathology, 87, 96–100. [DOI] [PubMed] [Google Scholar]
- Sacristan, S. and Garcia‐Arenal, F. (2008) The evolution of virulence and pathogenicity in plant pathogen populations. Mol. Plant Pathol. 9, 369–384. [DOI] [PMC free article] [PubMed] [Google Scholar]
- Spoel, S.H. and Dong, X.N. (2012) How do plants achieve immunity? Defence without specialized immune cells. Nat. Rev. Immunol. 12, 89–100. [DOI] [PubMed] [Google Scholar]
- Stergiopoulos, I. and de Wit, P.J. (2009) Fungal effector proteins. Annu. Rev. Phytopathol. 47, 233–263. [DOI] [PubMed] [Google Scholar]
- Stergiopoulos, I. , De Kock, M.J.D. , Lindhout, P. and De Wit, P.J.G.M. (2007) Allelic variation in the effector genes of the tomato pathogen Cladosporium fulvum reveals different modes of adaptive evolution. Mol. Plant–Microbe Interact. 20, 1271–1283. [DOI] [PubMed] [Google Scholar]
- Stergiopoulos, I. , van den Burg, H.A. , Okmen, B. , Beenen, H.G. , van Liere, S. , Kema, G.H.J. and de Wit, P.J.G.M. (2010) Tomato Cf resistance proteins mediate recognition of cognate homologous effectors from fungi pathogenic on dicots and monocots. Proc. Natl. Acad. Sci. USA, 107, 7610–7615. [DOI] [PMC free article] [PubMed] [Google Scholar]
- Stergiopoulos, I. , Kourmpetis, Y.A. , Slot, J.C. , Bakker, F.T. , De Wit, P.J.G.M. and Rokas, A. (2012) In silico characterization and molecular evolutionary analysis of a novel superfamily of fungal effector proteins. Mol. Biol. Evol. 29, 3371–3384. [DOI] [PubMed] [Google Scholar]
- Stukenbrock, E.H. and McDonald, B.A. (2009) Population genetics of fungal and oomycete effectors involved in gene‐for‐gene interactions. Mol. Plant–Microbe Interact. 22, 371–380. [DOI] [PubMed] [Google Scholar]
- Tripathi, L. , Tripathi, J.N. and Hughes, J.D. (2005) Agbagba. Afr. J. Biotechnol. 4, 1378–1383. [Google Scholar]
- Tripathi, L. , Mwaka, H. , Tripathi, J.N. and Tushemereirwe, W.K. (2010) Expression of sweet pepper Hrap gene in banana enhances resistance to Xanthomonas campestris pv. musacearum . Mol. Plant Pathol. 11, 721–731. [DOI] [PMC free article] [PubMed] [Google Scholar]
- Watterson, G.A. (1975) On the number of segregating sites in genetical models without recombination. Theor. Pop. Biol. 7, 256–276. [DOI] [PubMed] [Google Scholar]
- Watt, W.B. (1972) Intragenic recombination as a source of population genetic variability. Am. Nat. 106, 737–753. [Google Scholar]
- Webster, M.T. and Hurst, L.D. (2012) Direct and indirect consequences of meiotic recombination: implications for genome evolution. Trends Genet. 28, 101–109. [DOI] [PubMed] [Google Scholar]
- Wiame, I. , Swennen, R. and Sagi, L. (2000) PCR‐based cloning of candidate disease resistance genes from banana (Musa acuminata). Acta Hort. 521, 51–57. [Google Scholar]
- de Wit, P.J.G.M. , van der Burgt, A. , Okmen, B. , Stergiopoulos, I. , Abd‐Elsalam, K.A. , Aerts, A.L. , Bahkali, A.H. , Beenen, H.G. , Chettri, P. , Cox, M. , Datema, E. , de Vries, R. , Dhillon, B. , Ganley, A.R. , Griffiths, S.A. , Guo, Y.A. , Hamelin, R.C. , Henrissat, B. , Kabir, M.S. , Jashni, M.K. , Kema, G. , Klaubauf, S. , Lapidus, A. , Levasseur, A. , Lindquist, E. , Mehrabi, R. , Ohm, R.A. , Owen, T.J. , Salamov, A. , Schwelm, A. , Schijlen, E. , Sun, H. , van den Burg, H.A. , van Ham, R.C.H.J. , Zhang, S.G. , Goodwin, S.B. , Grigoriev, I.V. , Collemare, J. and Bradshaw, R.E. (2012) The genomes of the fungal plant pathogens Cladosporium fulvum and Dothistroma septosporum reveal adaptation to different hosts and lifestyles but also signatures of common ancestry. Plos Genet. 8, e1003088. [DOI] [PMC free article] [PubMed] [Google Scholar]
- Yang, Z.H. (2007) PAML 4: Phylogenetic analysis by maximum likelihood. Mol. Biol. Evol. 24, 1586–1591. [DOI] [PubMed] [Google Scholar]
- Yang, Z.H. and Bielawski, J.P. (2000) Statistical methods for detecting molecular adaptation. Trends Ecol. Evol. 15, 496–503. [DOI] [PMC free article] [PubMed] [Google Scholar]
- Zeng, K. , Fu, Y.X. , Shi, S.H. and Wu, C.I. (2006) Statistical tests for detecting positive selection by utilizing high‐frequency variants. Genetics, 174, 1431–1439. [DOI] [PMC free article] [PubMed] [Google Scholar]
Associated Data
This section collects any data citations, data availability statements, or supplementary materials included in this article.
Supplementary Materials
Fig. S1 Split graphs with inferred reticulate phylogenetic relationships among the MfAvr4, MfEcp2, MfEcp2‐2 and MfEcp2‐3 allelic variants. The networks include all isolates; graphs were constructed using SplitDecomposition (left‐hand graphs: A, C and E) and NeighborNet (right‐hand graphs: B, D and F) methods with uncorrected p distances as implemented in SplitsTree version 4. In the case of MfEcp2 and MfEcp2‐2, both methods yielded the same network. Least‐squares (LS) fitted values for each method are indicated, as well as the P values of the PhiTest for recombination (n.s., not significant).
Fig. S2 Analysis of recombination in the MfEcp2‐3 alleles using the genetic algorithm for recombination detection (GARD). (A) Plot of the inferred recombination breakpoints in the MfEcp2‐3 alignment and their support probabilities. The x axis represents the nucleotide position in the alignment and the vertical bars denote putative recombination breakpoints. When shown in green, breakpoints are statistically supported by the Kishino–Hasegawa (KH) test at P < 0.01. The y axis represents support values for breakpoints (1.0 = 100% support). (B) GARD recombination report. Recombination breakpoints (Bps) and the small‐sample Akaike information criterion (AICc) values are indicated. ΔAICc represents the improvement over the AICc score by fitting a multiple breakpoint model to the data, as opposed to absence in recombination. In general, ΔAICc > 10 is strongly supportive of recombination, and the higher the value the more likely that recombination has taken place. Evidence for two breakpoints at positions 280 and 427, respectively, of the MfEcp2‐3 nucleotide alignment is found, but only the breakpoint at position 280 is supported by ΔAICc. (C) Neighbour‐joining trees constructed with different segments of the alignment: (i) entire length (nucleotide positions 1–714); (ii) from start to the first recombination breakpoint (nucleotide positions 1–280); (iii) between the first and second breakpoints (nucleotide positions 281–427); and (iv) from the second breakpoint to the end (nucleotide positions 428–714). The phylogenies show highly incongruent topologies, which is strong evidence for recombination.
Fig. S3 Graphical representation of the individual recombination events detected in the MfEcp2‐3 alignment using eight different methods implemented in the recombination detection software program version 4 (RDP4). Grey bars represent the length of each MfEcp2‐3 allele and coloured bars indicate individual recombination events (minor donors). Recombination events are colour coded according to the method by which they were detected. Nucleotide positions of recombination breakpoints, as well as the P values associated with each event, as calculated by the method by which the event was detected, are indicated to the left or right of each event. Each strain represents a different MfEcp2‐3 isoform.
Fig. S4 Transient expression of the MfEcp2‐2 effector alleles in the near‐isogenic MoneyMaker (MM‐Cf‐0; known Cf resistance genes are absent) and MM‐Cf‐Ecp2 (Cf‐Ecp2 resistance gene is present) tomato lines using the Potato virus X (PVX)‐based expression system. Tomato plants were inoculated with Agrobacterium tumefaciens transformants expressing the binary PVX‐based vector pSfinx fused to the MfEcp2‐2 alleles encoding the different protein isoforms identified in this study. Mosaic symptoms are only seen when any of the MfEcp2‐2 alleles are expressed in MM‐Cf‐0 and MM‐Cf‐Ecp2 tomato lines (plants on the left in each panel), similar to symptoms triggered by the empty pSfinx binary vector (plants on the right in each panel). Photographs were taken at 21 days post‐inoculation.
Fig. S5 Transient expression of the MfEcp2‐3 effector alleles in the near‐isogenic MoneyMaker (MM‐Cf‐0; known Cf resistance genes are absent) and MM‐Cf‐Ecp2 (Cf‐Ecp2 resistance gene is present) tomato lines using the Potato virus X (PVX)‐based expression system. Tomato plants were inoculated with Agrobacterium tumefaciens transformants expressing the binary PVX‐based vector pSfinx fused to the MfEcp2‐3 alleles encoding the different protein isoforms identified in this study. Mosaic symptoms are only seen when any of the MfEcp2‐3 alleles are expressed in MM‐Cf‐0 and MM‐Cf‐Ecp2 tomato lines (plants on the left in each panel), similar to symptoms triggered by the empty pSfinx binary vector (plants on the right in each panel). Photographs were taken at 21 days post‐inoculation.
Table S1 Strains of Mycosphaerella fijiensis used in this study.
Table S2 Allelic variation in effector genes of Mycosphaerella fijiensis.
Table S3 Results of the maximum likelihood analysis conducted with CODEML using the site‐specific models. The parameter estimates under the different models are indicated, as well as the likelihood ratio statistics for testing the different hypotheses.
Table S4 Sites inferred to be positively (dN‐dS > 0) or negatively (dN‐dS < 0) selected based on the SLAC, FEL and REL analyses.
Table S5 Polymerase chain reaction (PCR) and sequencing primers used in this study.
Experimental Procedures S1
Results S1