

SUMMARY
In this study, proteomics and metabolomics were used to study the wheat response to exposure to the SnToxA effector protein secreted by the fungal pathogen Stagonospora nodorum during infection. Ninety‐one different acidic and basic proteins and 101 metabolites were differentially abundant when comparing SnToxA‐ and control‐treated wheat leaves during a 72‐h time course. Proteins involved in photosynthesis were observed to increase marginally initially after exposure, before decreasing rapidly and significantly. Proteins and metabolites associated with the detoxification of reactive oxygen species in the chloroplast were also differentially abundant during SnToxA exposure, implying that the disruption of photosynthesis causes the rapid accumulation of chloroplastic reactive oxygen species. Metabolite profiling revealed major metabolic perturbations in central carbon metabolism, evidenced by significant increases in tricarboxylic acid (TCA) cycle intermediates, suggestive of an attempt by the plant to generate ATP and reducing equivalents in response to the collapse of photosynthesis caused by SnToxA. This was supported by the observation that the TCA cycle enzyme malate dehydrogenase was up‐regulated in response to SnToxA. The infiltration of SnToxA also resulted in a significant increase in abundance of many pathogenicity‐related proteins, even in the absence of the pathogen or other pathogen‐associated molecular patterns. This approach highlights the complementary nature of proteomics and metabolomics in studying effector–host interactions, and provides further support for the hypothesis that necrotrophic pathogens, such as S. nodorum, appear to exploit existing host cell death mechanisms to promote pathogen growth and cause disease.
INTRODUCTION
Our understanding of fungal plant diseases has long been dominated by the concept of gene‐for‐gene interactions, first proposed by Flor in 1942 (Flor, 1942, 1956). This model has been well established for biotrophic pathogens, but, until recently, there has been little evidence that it holds true for the necrotrophic pathogens that feed off dying or dead tissue. The necrotrophs have long been viewed as simplistic pathogens that rely on a battery of lytic and degradative enzymes to obtain the required nutrients. Recent studies have overturned this simplistic model and have shown that many necrotrophs interact with the host in an elegantly specific gene‐for‐gene manner, albeit inversely (Friesen et al., 2008; Oliver and Solomon, 2010; Strelkov and Lamari, 2003). In such a system, the pathogen secretes small proteins, termed effectors, which are typically translocated into host cells. These effectors then appear to interact with a dominant susceptibility locus in a gene‐for‐gene manner, resulting in cell death. Rather than restricting cell growth as in a biotrophic interaction, cell death results in a rich nutrient source which promotes necrotrophic infection. The details of this interaction remain poorly understood, although it has been suggested that necrotrophs may exploit existing host death mechanisms that are usually associated with a resistant hypersensitive response (HR) (Hammond‐Kosack and Rudd, 2008). This is known as effector‐triggered susceptibility (ETS) based on the apparent manipulation by necrotrophs of the effector‐triggered immunity defence mechanism.
The first proteinaceous necrotrophic effector identified was Ptr ToxA from Pyrenophora tritici‐repentis, the causal agent of yellow (or tan) spot in wheat (Triticum aestivum) (Ballance et al., 1989; Tomas et al., 1990). The virulence of the fungus on wheat genotypes carrying the dominant susceptibility gene Tsn1 is dependent on the production of the Ptr ToxA effector. Sensitivity to the purified effector protein co‐locates to the same genetic locus as susceptibility to the disease (Faris et al., 1996; Tomas et al., 1990). Tsn1 has now been cloned and possesses many of the features typically associated with resistance (R) genes, including serine/threonine protein kinase (S/TPK), nucleotide‐binding site (NBS) and leucine‐rich repeat (LRR) domains, all of which are required for Ptr ToxA sensitivity (Faris et al., 2010). Genome sequence analysis of the related wheat pathogen Stagonospora nodorum reveals that it harbours a homologue of Ptr ToxA, named SnToxA (Friesen et al., 2006). SnToxA is 99.7% identical to Ptr ToxA, which is hypothesized to have been recently acquired by P. tritici‐repentis through a lateral gene transfer event (Friesen et al., 2006). Like Ptr ToxA, SnToxA only initiates leaf chlorosis and subsequent necrosis in the presence of Tsn1 (Friesen et al., 2006).
Ciuffetti and co‐workers (Manning and Ciuffetti, 2005; Manning et al., 2008) have provided evidence that Ptr ToxA, like many other fungal effectors (Kale et al., 2010), is likely to be translocated into host cells during growth of the pathogen in planta. It is unclear how Ptr ToxA is internalized, but the requirement for the solvent‐exposed RGD domain has been demonstrated, as has the presence of Tsn1 (Manning et al., 2008; Sarma et al., 2005). Protein binding studies have also shown that Ptr ToxA and Tsn1 do not interact directly, suggesting that Tsn1 is not a high‐affinity receptor for ToxA (Faris et al., 2010). Once internalized, Ptr ToxA is targeted to the chloroplast, where it has been shown to bind to plastocyanin and ToxA binding protein 1 (ToxABP1). The function of ToxABP1 is unknown, but silencing in sensitive wheat lines results in reduced Ptr ToxA sensitivity (Manning et al., 2010; Tai et al., 2007). The localization of Ptr ToxA to the chloroplast is then followed by an accumulation of reactive oxygen species (ROS) in the presence of light and, ultimately, cell death (Manning and Ciuffetti, 2005; Manning et al., 2009).
These studies have provided significant insight into the mechanism and mode of action of Ptr ToxA. Two recent reports have sought to understand the host response to Ptr ToxA exposure using microarrays (Adhikari et al., 2009; Pandelova et al., 2009). Numerous cellular processes were highlighted as being up‐ and down‐regulated in response to Ptr ToxA exposure, including photosynthesis, defence responses and pathways involved in the generation of ROS. Although the sequence similarity between Ptr ToxA and SnToxA is clear, there have been no mechanistic studies to date examining the mode of action of SnToxA, or the response of the host to SnToxA exposure. In this study, we have examined the host proteome and metabolome in response to SnToxA exposure. A proteomics approach was chosen because it has been well documented that the correlation between mRNA and protein levels is such that protein levels cannot always be predicted from quantitative mRNA data (Gygi et al., 1999). Metabolomics is a complementary technique to proteomics, but does, in itself, offer distinct advantages, namely that it is the metabolome rather than either the transcriptome or proteome that more directly influences the phenotype (Kell et al., 2005). The goals of this study were two‐fold. First, we sought to determine the response at the level of the proteome and metabolome of a susceptible wheat variety to exposure to SnToxA. Second, we used the data generated to compare the modes of action of SnToxA and Ptr ToxA. The application of these complementary functional genomics techniques has identified that SnToxA and Ptr ToxA have comparable modes of action. This study also identified novel aspects of the response of wheat to SnToxA exposure and shed new light onto this necrotrophic gene‐for‐gene interaction.
RESULTS
SnToxA infiltration causes chlorosis of susceptible wheat leaves
Leaves from the S. nodorum‐susceptible wheat genotype BG261 were infiltrated with either an SnToxA solution to initiate a reaction or water as a control, and sampled at 0.5, 4, 12, 24, 48 and 72 h post‐infiltration (hpi). The infiltrated areas of control leaves remained undamaged over time (Fig. 1A). Symptoms became visible at 24 hpi in the SnToxA‐infiltrated leaves and chlorosis developed gradually afterwards (Fig. 1B). Using the quantitative method devised by Wijekoon et al. (2008), the chlorotic surface area was measured (Fig. 1C). Damage caused by infiltration per se was assessed in water‐infiltrated leaves. Symptoms of minor physical damage were apparent at 12 hpi and were stable over time, affecting approximately 10% of the infiltrated area. Consistent with this damage, SnToxA treatment also affected 10% of the infiltrated area at 12 hpi. The percentage of chlorosis increased steadily in SnToxA‐infiltrated leaves, and reached approximately 20% at 24 hpi, 30% at 48 hpi and 50% at 72 hpi. Complete necrosis of the infiltrated region was apparent by 7 days post‐infiltration (data not shown).
Figure 1.
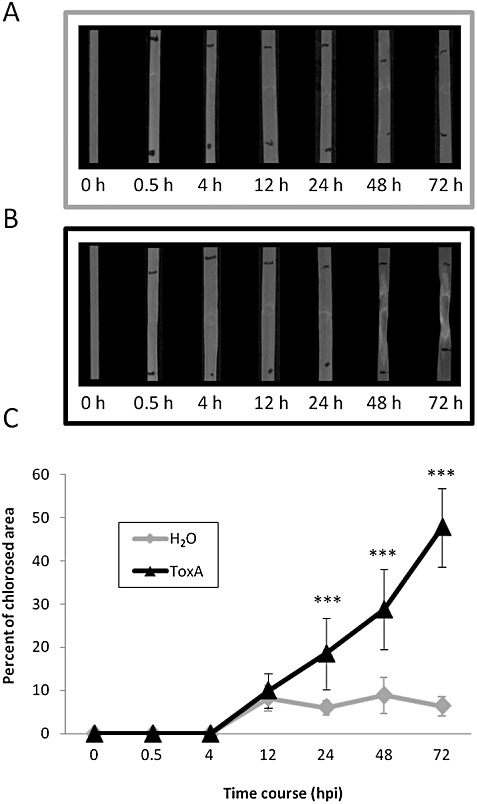
Toxicity assay over 0–72 h post‐infiltration (hpi) following wheat leaf infiltration with mock (H2O) solution (n= 5) (A) and 1.22 µg/mL ToxA solution (n= 10) (B). (C) Chlorotic area within the infiltrated region (marked with horizontal black lines) was quantified using Scion Image software and converted into a percentage. Significance levels (***P < 0.001) were obtained using independent one‐way analyses of variance (ANOVAs) for each time point.
A proteomics approach to resolve the wheat response to ToxA exposure
A gel‐based proteomics strategy was adopted in this study using two‐dimensional electrophoresis to separate wheat leaf acidic and basic soluble proteins, in combination with tandem mass spectrometry (MS/MS) for identification. Overall, two‐dimensional patterns were of acceptable quality, with few streaks, especially for basic proteins, and well‐resolved spots covering the whole gel (Fig. 2). Along the acidic gradient, the 55‐kDa horizontal streak and the two most prominent 15‐kDa spots represent ribulose bisphosphate carboxylase/oxygenase (RuBisCO) large and small subunits (RBCL and RBCS; spots A229, A290, A839–842, B066, B084, B216), respectively. RuBisCO has been shown previously to represent more than 50% of the soluble proteins in wheat photosynthetic tissue (Parry et al., 2011). In our study, although the large subunit of RuBisCO is too prominent to be resolved along a range of pH 4–7, it does not affect the rest of the two‐dimensional pattern. Table S1 (see Supporting Information) lists the experimental features and reports the number of protein spots separated along acidic and basic ranges. Although the protein content loaded onto basic immobilized pH gradient (IPG) strips was five times higher than that on acidic strips, it only yielded half the number of spots (1070 acidic spots versus 530 basic spots). However, the incorporation of basic proteins in this study increased protein coverage by 50%.
Figure 2.
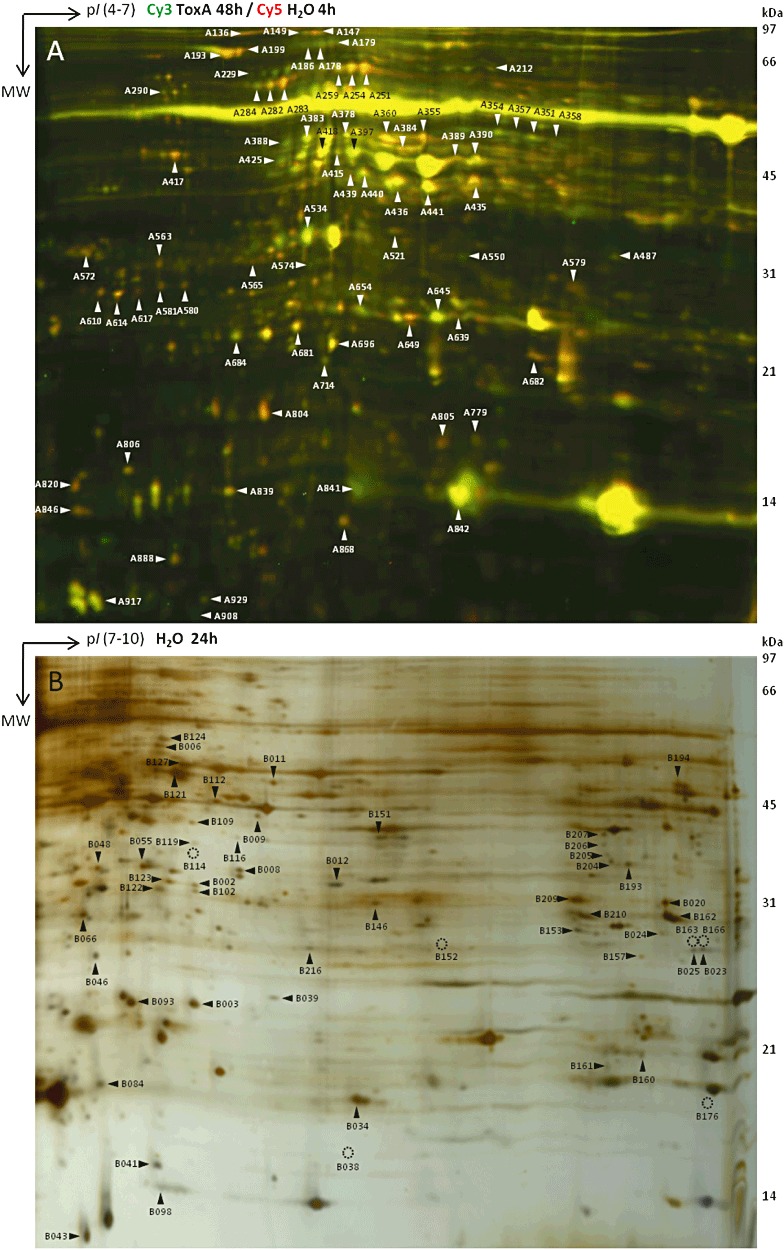
Two‐dimensional gels along acidic range (pH 4–7) following DIGE labelling (A) and basic range (pH 7–10) (B). Spots excised and analysed by mass spectrometry are indicated by an arrow when present or an open circle when missing.
Approximately one‐half of the detected spots were deemed to be reproducible when present in two of three biological replicates (520 acidic spots and 218 basic spots), and their expression profiling was explored using analyses of variance (ANOVAs). Two‐way ANOVAs showed that 213 (41%) acidic spots and 167 (77%) basic spots were significantly [P < 0.1, false discovery rate (FDR) correction] affected under our experimental conditions, amounting to 380 (51%) spots in total (Table S2, see Supporting Information). Of these, 260 (68%) spots responded to the time (TI) factor, 52 (14%) spots responded to the treatment (TR) factor and 68 (18%) spots responded to the TI × TR interaction effect. Overall, more basic proteins than acidic proteins were significant in our design and, in particular, 78 (47%) of the basic proteins responded to TR and/or TI × TR effects, whereas only 42 (20%) of the acidic proteins presented the same pattern. All the proteins with TR and/or TI × TR effects were selected for protein identification, and some spots whose abundance varied significantly over time were also included.
A total of 76 acidic spots and 54 basic spots underwent matrix‐assisted laser desorption ionization time‐of‐flight tandem mass spectrometry (MALDI TOF/TOF MS/MS) analyses (Fig. 2). Of the 130 MS‐analysed spots, 110 (85%) led to successful protein identifications (including proteins of unknown function). Most of the annotations came from cereals (79%), and Triticum species in particular (57%). Complementing MALDI‐TOF/TOF MS/MS analyses with nanoflow liquid chromatography electrospray ionization tandem mass spectrometry (nLC‐ESI‐MS/MS) analyses greatly improved the success rate of protein identification of both acidic and basic spots (92% and 74%, respectively). In some instances, two to three proteins were identified within the same spot (Table S3, see Supporting Information). The 110 hits obtained led to 91 different accessions, 81 of which were unique descriptions (Table 1). This highlights the high frequency of isoforms, with up to five identified forms (e.g. RuBisCO small subunit). Many of the acidic and basic proteins identified were suggestive that the exposure of susceptible wheat leaves to SnToxA caused significant changes in photosynthesis, oxidative stress and defence responses (Tables 1 and S3). These changes are discussed further in the following discussion.
Table 1.
Identities of differentially expressed proteins in SnToxA‐treated wheat.
| Spot | Description | Accession | mascot score | Coverage (%) | log2 ratio 0.5 h | log2 ratio 4 h | log2 ratio 12 h | log2 ratio 24 h | log2 ratio 48 h |
|---|---|---|---|---|---|---|---|---|---|
| A136 | Heat shock protein (90 kDa) | Q43638 | 385 | 14 | −0.906 | 0.852 | 0.953 | −0.682 | −0.489 |
| A147 | Putative uncharacterized protein Sb06g023840 | C5YCZ2 | 664 | 16 | −0.309 | 1.351 | 1.008 | −1.014 | −1.376 |
| A149 | Translation elongation factor G | C5YCZ2 | 719 | 18 | 0.056 | 2.053 | 1.288 | −0.708 | −1.439 |
| A178 | Heat shock cognate protein 70 | Q6QUX5 | 361 | 16 | 0.347 | −0.319 | 0.571 | 0.652 | −0.249 |
| A179 | Heat shock cognate protein 70 | Q6QUX5 | 370 | 15 | 0.527 | −0.337 | 0.674 | 1.179 | −0.942 |
| A186 | Heat shock protein 70 | Q5MGA8 | 259 | 12 | 0.098 | 0.097 | 1.093 | 0.415 | −0.854 |
| A193 | 70‐kDa heat shock protein | C7ENF7 | 632 | 14 | −0.286 | 0.161 | 0.831 | 0.033 | −0.607 |
| A199 | Heat shock protein 70 | D2D320 | 95 | 7 | −0.020 | 0.451 | 0.315 | 0.969 | −1.176 |
| A212 | 2,3‐Bisphosphoglycerate‐mutase | A8QPL0 | 163 | 25 | 0.188 | −0.964 | 0.566 | 0.118 | 0.227 |
| A229 | Ribulose bisphosphate carboxylase/oxygenase (RuBisCO) large chain | B6GUT8 | 94 | 5 | 0.103 | 0.167 | −0.915 | 1.006 | 1.331 |
| A251 | RuBisCO large subunit‐binding protein subunit β | Q43831 | 335 | 15 | 0.600 | 0.266 | 0.371 | 0.098 | −1.331 |
| A254 | RuBisCO large subunit‐binding protein subunit β | Q43831 | 686 | 21 | −0.436 | 0.213 | 0.466 | −0.344 | −0.044 |
| A259 | RuBisCO large subunit‐binding protein subunit β | Q43831 | 679 | 20 | 0.089 | 0.466 | 0.500 | 0.237 | −1.018 |
| A282 | RuBisCO large subunit‐binding protein subunit α | P08823 | 1217 | 29 | −0.292 | 0.405 | 0.418 | 0.145 | −0.394 |
| A283 | RuBisCO large subunit‐binding protein subunit α | P08823 | 1267 | 31 | −0.347 | 0.359 | 0.752 | 0.316 | −0.998 |
| A284 | RuBisCO large subunit‐binding protein subunit α | P08823 | 975 | 29 | −0.171 | 0.470 | 1.113 | 0.398 | −1.265 |
| A290 | Ribulose bisphosphate carboxylase large chain (fragment) | Q6VW42 | 66 | 4 | 1.002 | 0.270 | −0.645 | −0.830 | 0.163 |
| A351 | S‐Adenosylmethionine synthase 1 | A6XMY9 | 808 | 39 | 0.654 | 0.449 | 0.108 | 0.351 | 0.594 |
| A354 | S‐Adenosylmethionine synthase 3 | Q4LB22 | 768 | 28 | 0.215 | 0.566 | 0.336 | 0.443 | 0.285 |
| A355 | Elongation factor Tu | C0P699 | 280 | 11 | −0.520 | −0.024 | 0.357 | 0.268 | −0.388 |
| A357 | S‐Adenosylmethionine synthase 3 | Q4LB22 | 193 | 15 | −0.313 | 0.147 | 0.998 | 0.050 | 1.136 |
| A358 | 1‐Deoxy‐d‐xylulose 5‐phosphate reductoisomerase, putative | Q4H1G4 | 129 | 11 | 0.374 | 0.531 | 0.471 | 0.118 | −0.094 |
| A358 | S‐Adenosylmethionine synthase 1 | Q70EZ8 | 153 | 6 | 0.374 | 0.531 | 0.471 | 0.118 | −0.094 |
| A360 | RuBisCO activase A, chloroplastic | Q40073 | 620 | 20 | 0.017 | 0.051 | 0.761 | −0.370 | −0.606 |
| A378 | Plastid glutamine synthetase | C7DPL0 | 350 | 19 | −0.275 | 0.307 | 0.914 | −1.111 | −0.106 |
| A383 | Plastid glutamine synthetase | C7DPL0 | 479 | 23 | −0.431 | 0.319 | 0.470 | −0.268 | −0.418 |
| A384 | Phosphoglycerate kinase, chloroplastic | P12782 | 976 | 26 | 0.691 | 0.787 | 0.171 | −1.239 | −1.036 |
| A388 | Plastid glutamine synthetase | C7DPL0 | 284 | 16 | −0.252 | −0.031 | 0.217 | −0.119 | 0.060 |
| A389 | RuBisCO activase A, chloroplastic | Q40073 | 624 | 22 | 1.365 | 1.390 | −0.566 | 0.858 | −1.817 |
| A390 | RuBisCO activase A, chloroplastic | Q40073 | 590 | 23 | −0.066 | 0.196 | 0.471 | −0.161 | −0.936 |
| A397 | RuBisCO activase A, chloroplastic | Q40073 | 607 | 22 | −0.520 | 0.100 | 0.539 | −0.149 | −0.338 |
| A415 | Sedoheptulose‐1,7‐bisphosphatase, chloroplastic | P46285 | 219 | 26 | 0.242 | 0.133 | 0.877 | −0.857 | −0.520 |
| A417 | Translation elongation factor G | A2XG06 | 277 | 16 | −0.658 | −0.508 | −0.270 | 0.365 | 0.174 |
| A418 | Phosphoribulokinase, chloroplastic | P26302 | 739 | 34 | −0.189 | 0.483 | 0.577 | −0.511 | −0.798 |
| A425 | Phosphoribulokinase, chloroplastic | P26302 | 249 | 15 | −0.403 | 0.107 | 0.090 | 0.310 | 0.106 |
| A435 | Fructose‐bisphosphate aldolase, chloroplastic | C0KTA6 | 392 | 16 | 0.027 | 0.089 | 0.721 | −0.244 | −0.772 |
| A436 | Fructose‐bisphosphate aldolase, chloroplastic | C0KTA6 | 535 | 23 | −0.011 | 0.211 | 0.710 | −0.116 | −0.987 |
| A439 | Fructose‐bisphosphate aldolase, chloroplastic | C0KTA6 | 169 | 11 | 0.709 | 0.026 | −1.736 | −0.988 | 0.757 |
| A440 | Fructose‐bisphosphate aldolase, chloroplastic | C0KTA6 | 459 | 21 | −0.226 | 0.323 | 0.503 | −0.457 | −0.544 |
| A441 | Fructose‐bisphosphate aldolase, cytosolic | B4FR47 | 283 | 8 | −0.026 | 0.221 | 1.030 | −0.195 | −1.274 |
| A487 | Ribosomal protein L1 | C5YXG6 | 166 | 8 | −0.766 | −0.596 | 0.482 | −0.240 | 0.897 |
| A521 | Tyrosine phosphatase, putative | D5LXX6 | 103 | 19 | 0.091 | 0.435 | 0.383 | −0.305 | −0.756 |
| A534 | Chloroplast oxygen‐evolving enhancer protein 1 | A5JV93 | 396 | 30 | −0.255 | 0.053 | 0.573 | −0.259 | 0.034 |
| A550 | β‐1,3‐Glucanase | Q9XEN5 | 114 | 11 | 1.317 | 1.172 | −0.411 | −0.818 | 1.175 |
| A563 | 14‐3‐3‐like protein A | P29305 | 223 | 24 | 0.008 | 0.085 | 0.321 | 0.426 | −0.520 |
| A565 | 14‐3‐3 protein | Q08G36 | 344 | 29 | −0.800 | 0.407 | 0.844 | 0.905 | −1.249 |
| A572 | 28‐kDa ribonucleoprotein, chloroplast | O23798 | 421 | 30 | −0.494 | 0.316 | 1.002 | −0.231 | −0.509 |
| A574 | Chloroplast lipocalin | Q38JB6 | 96 | 10 | 0.053 | 0.206 | 1.250 | 0.410 | −1.731 |
| A579 | NAD‐dependent epimerase/dehydratase | A2XZK1 | 109 | 9 | −0.661 | −0.246 | 0.745 | 0.501 | −0.526 |
| A580 | Elongation factor 1‐β | P29546 | 79 | 13 | −0.159 | 0.671 | 0.777 | −0.612 | −0.684 |
| A581 | Elongation factor 1‐β | P29546 | 108 | 11 | 0.577 | 0.394 | 0.403 | 0.309 | −0.894 |
| A610 | 29‐kDa ribonucleoprotein, chloroplast | A2YNZ1 | 96 | 6 | −0.059 | 0.315 | 0.629 | 0.297 | −0.330 |
| A614 | Nucleic acid‐binding protein, putative | C3V134 | 473 | 59 | −0.240 | 0.104 | 0.365 | −0.043 | −0.043 |
| A617 | Nucleic acid‐binding protein, putative | O81988 | 195 | 15 | −0.339 | 0.245 | 0.246 | −0.429 | 1.556 |
| A639 | Triosephosphate isomerase, cytosolic | P34937 | 247 | 17 | −0.889 | 0.353 | 0.502 | 0.575 | −0.887 |
| A645 | Oxygen‐evolving enhancer protein 2, chloroplastic | Q00434 | 790 | 47 | −0.668 | 0.037 | 0.392 | 0.284 | −0.178 |
| A649 | Oxygen‐evolving enhancer protein 2, chloroplastic | B8B3P0 | 188 | 11 | −0.041 | 0.150 | 0.340 | 0.217 | −0.946 |
| A649 | Chaperonin 21, putative | Q00434 | 76 | 6 | −0.041 | 0.150 | 0.340 | 0.217 | −0.946 |
| A654 | 2‐Cys peroxiredoxin BAS1, chloroplastic | A2YWS7 | 180 | 9 | −0.389 | 0.194 | 0.930 | 0.509 | −0.750 |
| A654 | Oxygen‐evolving enhancer protein 2, chloroplastic | P80602 | 194 | 25 | −0.389 | 0.194 | 0.930 | 0.509 | −0.750 |
| A654 | Thylakoid lumenal 19‐kDa protein | Q00434 | 166 | 27 | −0.389 | 0.194 | 0.930 | 0.509 | −0.750 |
| A681 | 2‐Cys peroxiredoxin BAS1, chloroplastic | P80602 | 670 | 44 | −0.177 | 0.454 | 0.529 | −0.040 | −0.799 |
| A682 | 50S ribosomal protein L10 | B4G1Q5 | 131 | 8 | −0.115 | −0.306 | 0.553 | −0.089 | −0.287 |
| A684 | 2‐Cys peroxiredoxin BAS1, chloroplastic | P80602 | 486 | 53 | −0.351 | 0.207 | 0.302 | 0.090 | −0.343 |
| A696 | Chlorophyll a–b‐binding protein 6A | C1K5B4 | 156 | 9 | −0.206 | 0.344 | 0.687 | −0.304 | −1.047 |
| A779 | Nucleoside diphosphate kinase | Q0IMS5 | 162 | 17 | 1.065 | −0.035 | −0.470 | −0.746 | 0.975 |
| A804 | 50S ribosomal protein L12‐1, chloroplastic | Q06030 | 91 | 14 | 0.029 | 0.083 | 0.154 | −0.133 | −0.314 |
| A820 | Histone H2B | B4FYZ0 | 73 | 16 | 0.147 | 0.257 | 0.544 | −0.157 | −0.281 |
| A839 | Ribulose bisphosphate carboxylase small chain | Q5NDA6 | 453 | 38 | −0.103 | 0.124 | 0.440 | −0.246 | −0.782 |
| A839 | Thioredoxin M | Q9FRZ4 | 76 | 11 | −0.103 | 0.124 | 0.440 | −0.246 | −0.782 |
| A841 | Ribulose bisphosphate carboxylase small chain | Q9FRZ4 | 146 | 16 | −0.171 | −0.009 | 0.440 | 0.219 | 0.079 |
| A842 | Ribulose bisphosphate carboxylase small chain | Q9FRZ4 | 193 | 22 | −0.439 | 0.073 | 0.552 | −0.077 | −0.365 |
| A846 | 60S acidic ribosomal protein P2‐like protein | Q7X729 | 115 | 10 | 0.136 | 0.073 | 0.455 | 0.146 | −0.487 |
| A917 | Plastocyanin, chloroplastic | P08248 | 101 | 20 | −0.175 | 0.138 | 0.328 | −0.244 | −0.335 |
| A929 | Plastocyanin, chloroplastic | A2Z9R0 | 63 | 11 | −0.087 | −0.139 | 0.544 | −0.105 | −0.799 |
| A929 | Thylakoid membrane phosphoprotein 14 kDa, chloroplast | Q0DFC9 | 82 | 20 | −0.087 | −0.139 | 0.544 | −0.105 | −0.799 |
| B003 | Peptidyl‐prolyl cis–trans‐isomerase (cyclophilin) | Q6XPZ4 | 310 | 35 | 0.074 | −0.158 | |||
| B006 | Geranylgeranyl hydrogenase | COLIR3 | 467 | 26 | −0.204 | −0.586 | |||
| B006 | UDP‐sulphoquinovose synthase | D5GWI4 | 220 | 49 | −0.204 | −0.586 | |||
| B006 | Sulpholipid biosynthesis protein | Q45FE7 | 208 | 12 | −0.204 | −0.586 | |||
| B008 | Mg‐protoporphyrin IX methyltransferase | Q5NKT1 | 98 | 6 | −0.155 | −0.518 | |||
| B012 | Adenylate kinase 1, putative | A9PB19 | 164 | 13 | 0.292 | −0.039 | |||
| B020 | Mitochondrial outer membrane porin | P46274 | 287 | 21 | 0.429 | −0.363 | |||
| B023 | Thaumatin‐like protein | Q8S4P7 | 99 | 14 | 1.858 | 16.985 | |||
| B024 | Chitinase 1 | Q8W429 | 175 | 21 | 2.101 | 17.392 | |||
| B025 | Transducin family protein | D7LEK9 | 50 | 1 | 0.000 | 16.975 | |||
| B034 | Ubiquitin carrier protein | C0PPR9 | 80 | 25 | −0.007 | 0.777 | |||
| B038 | PR‐4 (fragment) | Q9SQG3 | 82 | 10 | 0.000 | 16.656 | |||
| B043 | Ubiquitin monomer protein (fragment) | Q2VJ43 | 163 | 25 | 0.027 | 0.307 | |||
| B046 | Phenylalanine ammonia‐lyase | D5KS97 | 224 | 6 | −0.035 | 1.410 | |||
| B048 | Catalytic/coenzyme‐binding protein | D7M797 | 84 | 9 | 0.006 | −0.148 | |||
| B055 | Peroxisomal ascorbate peroxidase | A5JPR2 | 151 | 12 | −0.013 | −0.181 | |||
| B055 | Transcription factor APFI | Q8GRK1 | 171 | 18 | −0.013 | −0.181 | |||
| B066 | Carbonic anhydrase | D4N8D8 | 254 | 32 | −0.220 | −0.381 | |||
| B066 | Ribulose bisphosphate carboxylase small chain | Q9FRZ4 | 69 | 14 | −0.220 | −0.381 | |||
| B084 | Ribulose bisphosphate carboxylase small chain | Q9FRZ4 | 201 | 12 | −0.504 | −0.411 | |||
| B093 | Peptidyl‐prolyl cis–trans‐isomerase (cyclophilin) | Q6XPZ4 | 130 | 21 | 0.002 | −0.237 | |||
| B098 | Photosystem II polypeptide 10 kDa (fragment) | Q6XW17 | 135 | 29 | 0.200 | 0.536 | |||
| B109 | 5,10‐Methylene‐tetrahydrofolate dehydrogenase/5,10‐methenyl‐tetrahydrofolate cyclohydrolase | A6XMY4 | 213 | 17 | 0.036 | −0.534 | |||
| B112 | RNA‐binding protein, putative | Q9SA52 | 117 | 4 | 0.201 | −0.535 | |||
| B116 | Chitinase | A5AT00 | 89 | 7 | 0.000 | 17.110 | |||
| B119 | 31.7‐kDa class I endochitinase‐antifreeze protein | Q9AXR9 | 108 | 11 | −0.198 | 1.914 | |||
| B121 | Hydroxypyruvate reductase | Q93XV7 | 106 | 9 | 0.286 | −0.648 | |||
| B122 | Carbonic anhydrase | D4N8D8 | 179 | 25 | −0.280 | −1.536 | |||
| B123 | Plastidial outer membrane protein porin | A2WRY9 | 99 | 8 | −0.062 | −0.480 | |||
| B127 | Ribulose bisphosphate carboxylase large chain (fragment) | Q6QE22 | 46 | 4 | −0.585 | −0.376 | |||
| B146 | Mitochondrial outer membrane porin | P46274 | 107 | 12 | −0.076 | −0.486 | |||
| B151 | Malate dehydrogenase | C4J673 | 117 | 8 | −0.162 | 0.489 | |||
| B153 | DNA‐binding protein p24 | A1YKH2 | 78 | 6 | −0.225 | −1.134 | |||
| B160 | Brain protein 44‐like | Q6Z595 | 53 | 14 | 0.808 | 0.145 | |||
| B161 | Glutathione peroxidase chr01_pseudomolecule_IMGAG_V3 | Medtr1g017 | 55 | 8 | 0.670 | 0.000 | |||
| B161 | Plastid ribosomal protein L11 | Q8H8H8 | 80 | 10 | |||||
| B162 | Acid phosphatase, putative | Q9M4D6 | 87 | 7 | 0.047 | −0.169 | |||
| B163 | Thaumatin‐like protein | Q8S4P7 | 69 | 10 | 0.000 | 17.307 | |||
| B166 | Glutamate receptor 3 plant, putative | B9SDW1 | 57 | 2 | 14.689 | 15.459 | |||
| B176 | Pathogenesis‐related protein 1 | C3UZE2 | 200 | 28 | 0.000 | 16.427 | |||
| B194 | Peroxisomal (S)‐2‐hydroxy‐acid oxidase (glycolate oxidase) | P05414 | 150 | 8 | 0.179 | 0.278 | |||
| B205 | Glucan endo‐1,3‐β‐d‐glucosidase | O82716 | 111 | 15 | 15.594 | 2.311 | |||
| B206 | β‐1,3‐Glucanase | Q4JH28 | 91 | 18 | 15.791 | 17.670 | |||
| B209 | Mitochondrial outer membrane porin | P46274 | 207 | 20 | −0.062 | −0.601 | |||
| B216 | Ribulose bisphosphate carboxylase large chain | Q3ZEK8 | 52 | 3 | 0.242 | −1.044 |
The following spots, A714, A805, A806, A868, A888, A908, B002, B009, B011, B039, B041, B102, B114, B124, B152, B157, B193, B204, B207 and B210, revealed no matches. Statistical data are shown in Table S2. Further information (number of peptides, species, expected pI/MW, SignalP and ChloroP results, etc.) are given in Table S3.
Figure 3 displays the expression profiling of MS‐analysed proteins in ToxA‐infiltrated leaves relative to controls. Greater than 30% of the identified acidic proteins were significantly more abundant at 12 hpi. This trend was reversed at 48 hpi, with approximately the same number of proteins less abundant in treated leaves compared with the controls. Basic protein abundance was only measured in the 24‐ and 48‐hpi samples, and showed that the number of proteins more or less abundant compared with the control increased at the latter time point.
Figure 3.
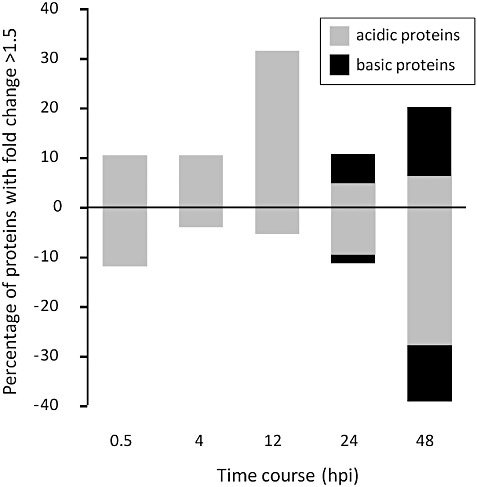
Protein abundance in ToxA‐infiltrated leaves relative to the controls over time. Up‐ and down‐regulated (fold change >1.5, irrespective of P values) proteins were numbered and converted into a percentage; down‐regulated proteins were converted to negative values using a −1 factor. Note that basic proteins were only analysed for the 24‐ and 48‐h time points. hpi, hours post‐infiltration.
Many of the identified SnToxA‐responsive proteins are targeted to the chloroplast
The TargetP algorithm was used to determine the cell compartments to which the identified proteins were allocated (Table S3). Four proteins were predicted to be mitochondrial, 11 (mostly basic) to be secreted, 53 (34%) to be targeted to the chloroplast and 51 located elsewhere. The ChloroP algorithm was also used and predicted that 44% of the proteins were targeted to the chloroplast. Both algorithms operate solely on sequence information, searching for chloroplast transit peptide (cTP), mitochondrial targeting peptide (mTP) or secretory pathway signal peptide (SP). However, other proteins identified in this study, whether enzymes or structural proteins, are known to be chloroplastic and were missed by these predictions. This was the case for two isoforms of the RuBisCO large subunit (spots A229, A290, B127), RBCL‐binding protein subunits α and β isoforms (spots A251, A254, A259, A282–284), a 2‐cysteine peroxiredoxin (spot A654), a psbR 10‐kDa subunit of photosystem II (PSII, spot B098) and an RNA‐binding protein (spot B112). This can only be explained as follows: (i) these proteins are encoded by chloroplastic genes, which consequently do not possess a cTP; or (ii) the hit sequence is incomplete. In our study, the total number of chloroplastic proteins reached 75 (53%), and most were acidic (57, 77%).
Metabolite profiling of wheat in response to SnToxA exposure
In addition to proteomics, we also performed an untargeted metabolomics approach in an attempt to understand the wheat response to SnToxA exposure. Gas chromatography‐mass spectrometry (GC‐MS) analysis was used to identify changes in polar primary metabolites in SnToxA‐treated wheat leaf samples throughout the 4–72‐h time course after SnToxA infiltration. Principal component analysis (PCA) was used to discover trends within the split 20 : 1 dataset and to provide a means to observe the quality of the data. The six replicates belonging to each treatment and time point sampled clustered together, indicating the robustness and reproducibility of the experimental design. The first two principal components (PCs) explained 65% of the variance in the dataset (Fig. 4). PC1 accounted for 53% of the variance, which can largely be explained by the effect of time on metabolite changes, whereas the 12% of variance explained by PC2 clearly separates SnToxA‐infiltrated wheat and control at 48 and 72 hpi. The samples can be divided into four clusters. The first contains the 4‐ and 12‐h samples for both control and treated wheat. The second consists of all the 24‐h samples. At 48 h, the variance as a result of metabolite changes between control and SnToxA‐treated wheat becomes apparent. The third cluster contains the control 48‐ and 72‐h samples, whereas the entire lower section of PCA is dominated by the fourth cluster grouping the SnToxA 48‐ and 72‐h samples. The loadings plot (Fig. 4B) for this PCA illustrates the contribution of each metabolite to the variance between clusters. The metabolites with the highest contribution to PC1 are asparagine and four unknown compounds, and to PC2 are asparagine, quinic acid, malate and two unknown compounds.
Figure 4.
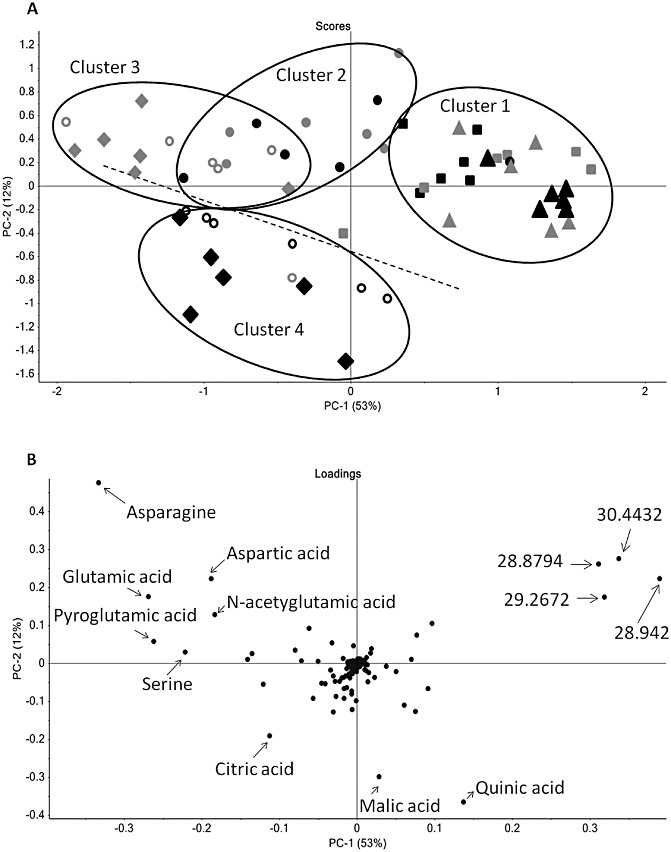
(A) Score plots of principal component analysis (PCA) of gas chromatography‐mass spectrometry (GC‐MS) metabolite data for both control and SnToxA‐infiltrated wheat leaves at five time points from 4 to 72 h post‐infiltration (hpi). The symbols  , ▴, ●, ○ and ◆ represent the time points 4, 12, 24, 48 and 72 hpi, respectively. SnToxA‐treated samples are black and water‐infiltrated control samples are grey. The numbers in parentheses indicate the variance in the datasets explained by the first two principal components (PCs). (B) Loadings plot illustrating the metabolites contributing to the variance observed in the PCA.
ANOVA was performed to assess the statistical significance of the contribution of each metabolite to the variation between SnToxA and control wheat. The abundances of 92 metabolites detected using GC‐MS were altered significantly (P < 0.05) by SnToxA. Of these, 32 were identified by a match to in‐house databases and five were putatively identified with a match of above 80% to the NIST08 library or the Golm Metabolome Database (Table 2). The remaining 55 metabolites have not yet been identified (data not shown). A significant portion of these unidentified metabolites have fragmentation patterns indicative of sugars, which, by nature, are structurally very similar, and therefore in‐house standards are required to provide accurate retention times for identification. Of the total 92 metabolites which responded significantly to SnToxA, approximately 60% displayed an increase in abundance at one or more time points, whereas the remainder decreased overall. An increase in metabolite abundance, particularly from 24 h, was the most noticeable trend observed in response to SnToxA, with 45%–60% of significant metabolites belonging to the three major groups of compounds (organic acids, sugar/sugar alcohols and unknowns) consistent with this pattern.
Table 2.
Putatively identified metabolites differentially abundant in SnToxA‐treated wheat.
| Metabolite and ID | * | H2O | ToxA | ||||||||
|---|---|---|---|---|---|---|---|---|---|---|---|
| 4 h | 12 h | 24 h | 48 h | 72 h | 4 h | 12 h | 24 h | 48 h | 72 h | ||
| Amino acids | |||||||||||
| l‐Isoleucine_16.4189_1295_158_S | B | 2.75 ± 1.38 | 1.06 ± 0.61 | 2.15 ± 0.85 | 2.62 ± 0.9 | 2.06 ± 0.73 | 0.95 ± 0.43 | 0.71 ± 0.31 | ND | 6.55 ± 2.39 | 6.21 ± 2.85 |
| l‐Glycine_16.7004_1307_174_S | A | 11.07 ± 6.01 | 12.72 ± 7.56 | ND | 64.82 ± 22.86 | 66.2 ± 25.46 | ND | 6.64 ± 3.41 | 11.75 ± 6.49 | 22.08 ± 10.96 | 21.66 ± 8.15 |
| Aspartic acid_21.7171_1522_232 | B | 9.44 ± 2.62 | 11.53 ± 4.11 | 26.24 ± 5.6 | 32.07 ± 11.75 | 51.8 ± 10.82 | 19.28 ± 3.09 | 6.42 ± 3 | 22.53 ± 4.97 | 22.63 ± 6.63 | 22.12 ± 4.98 |
| Asparagine_24.8197_1692_116 | C | 11.22 ± 2.82 | 11.04 ± 7.46 | 64.67 ± 11.38 | 119.7 ± 40.45 | 150.3 ± 39.78 | 20.31 ± 5.27 | 2.5 ± 2.47 | 43.43 ± 10.59 | 28.84 ± 11.71 | 32.32 ± 15.15 |
| Organic acids | |||||||||||
| Glyceric acid_17.3134_1338_189 | B | 4.23 ± 0.85 | 1.93 ± 0.26 | 3.17 ± 0.23 | 2.76 ± 0.88 | 3.26 ± 1.05 | 4.31 ± 1.22 | 1.8 ± 0.3 | 2.07 ± 0.74 | 3.54 ± 1.21 | 7.66 ± 0.57 |
| Malic acid_21.0415_1489_233 | C | 45.6 ± 3.66 | 32.85 ± 6.1 | 25.11 ± 3.2 | 19.49 ± 4.67 | 23.09 ± 1.67 | 52.03 ± 8.29 | 37.87 ± 4.17 | 29.35 ± 7.16 | 68.63 ± 7.1 | 101.1 ± 11.95 |
| Pyroglutamic acid_21.7484_1524_156 | B | 43.42 ± 9.24 | 37.48 ± 10.58 | 105.9 ± 11.76 | 173.1 ± 32.22 | 145.9 ± 18.99 | 41.56 ± 5.26 | 16.5 ± 1.92 | 80.44 ± 14.96 | 91.84 ± 14.01 | 104.3 ± 15.91 |
| GABA_21.911_1525_174_S | B | 3.09 ± 1.08 | 1.16 ± 0.16 | 2.94 ± 0.88 | 3.38 ± 0.54 | 5.82 ± 1.12 | 2.08 ± 0.26 | 1.29 ± 0.3 | 2.15 ± 0.55 | 15.12 ± 2.94 | 9.6 ± 2.43 |
| N‐Acetylglutamic aid_22.0486_1540_84 | B | 3.44 ± 2.12 | ND | 15.9 ± 2.93 | 20.23 ± 6.66 | 36.03 ± 7.04 | 7.21 ± 1.08 | ND | 13.41 ± 2.23 | 17.53 ± 4.07 | 15.88 ± 6.05 |
| Erythronic acid _22.1612_1547_292 | C | 0.18 ± 0.04 | 0.22 ± 0.05 | 0.17 ± 0.05 | 0.31 ± 0.02 | 0.44 ± 0.04 | 0.24 ± 0.01 | 0.18 ± 0.04 | 0.22 ± 0.05 | 0.6 ± 0.07 | 1.06 ± 0.05 |
| Threonic acid_22.5428_1568_292 | C | 3.27 ± 0.21 | 2.73 ± 0.22 | 0.98 ± 0.1 | 0.85 ± 0.08 | 1.53 ± 0.22 | 2.48 ± 0.2 | 2.48 ± 0.2 | 1.09 ± 0.11 | 5.64 ± 0.76 | 11.09 ± 1.08 |
| 2‐Ketoglutaric acid_22.9744_1591_198 | B | 0.29 ± 0.12 | ND | 0.47 ± 0.1 | 0.49 ± 0.11 | 0.71 ± 0.07 | 0.31 ± 0.07 | ND | ND | 0.51 ± 0.12 | 0.25 ± 0.11 |
| Ribonic acid_26.3147_1774_333 | C | 0.32 ± 0.03 | 0.37 ± 0.02 | 0.39 ± 0.02 | 0.55 ± 0.04 | 0.59 ± 0.04 | 0.29 ± 0.02 | 0.31 ± 0.01 | 0.4 ± 0.02 | 0.65 ± 0.04 | 0.93 ± 0.04 |
| Glyceric acid‐3‐phosphate_27.4032_1834_299 | B | 2.01 ± 0.32 | ND | 2.27 ± 0.32 | 3.43 ± 0.99 | 3.46 ± 1.16 | 1.96 ± 0.47 | 0.25 ± 0.12 | 3.1 ± 0.68 | 1.75 ± 0.41 | 0.89 ± 0.3 |
| Citric acid_27.6096_1845_273 | C | 14.68 ± 1.89 | 22.53 ± 2.37 | 24.45 ± 3.52 | 35.18 ± 3.7 | 38.26 ± 2.37 | 17.2 ± 1.47 | 16.27 ± 1.03 | 27.4 ± 2.64 | 49.34 ± 4.13 | 70.48 ± 7.67 |
| Dehydroascorbic acid_28.1038_1872_173 | B | 1.6 ± 0.77 | 1.84 ± 0.46 | 1.56 ± 0.17 | 2.13 ± 0.24 | 1.76 ± 0.14 | 0.81 ± 0.11 | 1.45 ± 0.66 | 1.17 ± 0.1 | 1.4 ± 0.18 | 0.7 ± 0.04 |
| Quinic acid_28.2664_1881_345 | C | 91.78 ± 6 | 144.0 ± 13.86 | 36.44 ± 2.89 | 32.09 ± 4.1 | 30.37 ± 2.54 | 97.74 ± 5.72 | 140.0 ± 11.94 | 40.31 ± 5.58 | 102.0 ± 15.83 | 258.8 ± 17.67 |
| Ascorbic acid_29.874_1970_332 | B | 6.54 ± 1.94 | 8.83 ± 1.22 | 18.06 ± 2.04 | 17.82 ± 1.97 | 21.18 ± 4.71 | 9.18 ± 1.44 | 7.65 ± 1.47 | 17.63 ± 1.36 | 13.05 ± 2.26 | 11.03 ± 2.54 |
| Glucaric acid_30.8498_2023_333 | C | 0.61 ± 0.07 | 0.64 ± 0.06 | ND | 0.14 ± 0.07 | ND | 0.69 ± 0.05 | 0.77 ± 0.06 | 0.46 ± 0.17 | 0.45 ± 0.15 | 0.22 ± 0.11 |
| Galactonic acid_30.9249_2027_292 | C | 0.12 ± 0.02 | 0.1 ± 0.01 | 0.06 ± 0.02 | 0.09 ± 0 | 0.05 ± 0.02 | 0.11 ± 0.01 | 0.08 ± 0.02 | 0.06 ± 0.02 | 0.14 ± 0.01 | 0.2 ± 0.03 |
| Glucuronic acid_43.7858_2929_217 | C | 0.05 ± 0.02 | 0.06 ± 0.02 | ND | 0.1 ± 0.03 | 0.2 ± 0.02 | 0.12 ± 0.01 | ND | 0.09 ± 0.03 | 0.23 ± 0.05 | 0.72 ± 0.11 |
| Sugars/sugar alcohols | |||||||||||
| Erythritol_21.4106_1505_217 | B | 0.18 ± 0.04 | 0.28 ± 0.02 | 0.27 ± 0.01 | 0.34 ± 0.03 | 0.47 ± 0.05 | 0.19 ± 0.03 | 0.19 ± 0.02 | 0.19 ± 0.04 | 0.37 ± 0.02 | 0.66 ± 0.06 |
| Xylose_24.6133_1681_103 | B | 0.78 ± 0.08 | 0.93 ± 0.09 | 0.45 ± 0.1 | 0.4 ± 0.1 | 0.58 ± 0.07 | 0.62 ± 0.05 | 0.78 ± 0.06 | 0.35 ± 0.12 | 0.25 ± 0.11 | 0.23 ± 0.14 |
| Xylulose_24.9073_1697_205 | B | 1.79 ± 0.21 | 1.72 ± 0.18 | 1.22 ± 0.2 | 0.77 ± 0.2 | 1.1 ± 0.17 | 1.66 ± 0.26 | 1.85 ± 0.23 | 1.11 ± 0.27 | 1.65 ± 0.21 | 2.13 ± 0.27 |
| Ribose_24.9198_1691_103_S | B | 2.9 ± 0.4 | 2.67 ± 0.44 | 2.22 ± 0.55 | 0.76 ± 0.42 | 1.55 ± 0.49 | 2.81 ± 0.39 | 2.6 ± 0.22 | 2.38 ± 0.67 | 2.92 ± 0.6 | 3.52 ± 1.08 |
| Arabinitol_25.7017_1741_217 | B | 0.25 ± 0.03 | 0.3 ± 0.04 | 0.28 ± 0.01 | 0.4 ± 0.03 | 0.4 ± 0.04 | 0.25 ± 0.03 | 0.2 ± 0.01 | 0.23 ± 0.06 | 0.34 ± 0.02 | 0.63 ± 0.07 |
| Fructofuranoside_26.7776_1800_217 | C | ND | 0.2 ± 0.05 | ND | 0.44 ± 0.21 | 0.25 ± 0.16 | 0.2 ± 0.03 | 0.11 ± 0.03 | 0.19 ± 0.12 | 0.82 ± 0.08 | 1.84 ± 0.22 |
| Fructose_28.5041_1894_103 | C | 51.5 ± 6.57 | 23.39 ± 2.79 | 13.04 ± 0.64 | 7.02 ± 2.39 | 10.97 ± 1.28 | 29.19 ± 1.8 | 16.91 ± 1.76 | 12.2 ± 1.7 | 36.41 ± 0.94 | 32.73 ± 5.89 |
| Fructose {BP}_28.6855_1904_103 | C | 35.13 ± 5.18 | 16.36 ± 2.13 | 9.33 ± 0.5 | 7.26 ± 0.61 | 7.65 ± 1.02 | 21.52 ± 1.05 | 11.3 ± 1.24 | 8.66 ± 1.28 | 24.98 ± 0.73 | 21.96 ± 3.45 |
| Galactose_28.8231_1912_319 | B | 1.54 ± 0.28 | 1.37 ± 0.1 | 0.75 ± 0.05 | 0.68 ± 0.07 | 0.63 ± 0.04 | 1.07 ± 0.08 | 1.09 ± 0.09 | 0.55 ± 0.15 | 0.94 ± 0.12 | 0.94 ± 0.05 |
| Sedoheptulose_32.4637_2112_319 | C | 0.47 ± 0.03 | 0.81 ± 0.07 | 0.66 ± 0.04 | 1.33 ± 0.17 | 1.97 ± 0.21 | 0.48 ± 0.1 | 0.51 ± 0.05 | 0.56 ± 0.06 | 1.66 ± 0.08 | 3.48 ± 0.21 |
| 2‐O‐Glycerol‐α‐d‐galactopyranoside_35.6539_2315_204 | C | 0.36 ± 0.12 | 0.42 ± 0.09 | 0.26 ± 0.13 | 0.51 ± 0.02 | 0.51 ± 0.1 | 0.69 ± 0.06 | 0.55 ± 0.04 | 0.63 ± 0.21 | 10.83 ± 1.31 | 6.51 ± 0.63 |
| Glucose‐6‐phosphate_35.704_2319_387 | C | 0.74 ± 0.28 | ND | 0.25 ± 0.17 | 0.42 ± 0.14 | ND | 0.99 ± 0.23 | 0.52 ± 0.11 | 0.57 ± 0.19 | 1.05 ± 0.24 | 0.69 ± 0.32 |
| Maltose_41.6402_2752_361 | B | ND | 0.45 ± 0.04 | 0.52 ± 0.04 | 0.66 ± 0.08 | 0.63 ± 0.06 | 0.09 ± 0.05 | 0.4 ± 0.1 | 0.36 ± 0.09 | 0.54 ± 0.06 | 0.17 ± 0.08 |
| Isomaltose_41.7216_2758_204 | B | ND | ND | ND | ND | 0.18 ± 0.06 | ND | ND | ND | 0.24 ± 0.05 | 0.34 ± 0.11 |
| Other | |||||||||||
| Glycerol_15.8997_1280_205 | A | ND | 0.03 ± 0.01 | 0.04 ± 0.01 | 0.02 ± 0.01 | 0.03 ± 0.01 | 0.08 ± 0.04 | 0.06 ± 0.02 | ND | 0.03 ± 0.01 | 0.05 ± 0.02 |
| myo‐Inositol_32.176_2096_318 | C | 11.86 ± 1.63 | 10.13 ± 0.76 | 12.15 ± 0.76 | 13.48 ± 1.06 | 17.28 ± 1.19 | 10.93 ± 0.68 | 10.68 ± 0.83 | 13.85 ± 1.73 | 9.93 ± 1.34 | 8.91 ± 0.7 |
Metabolites are identified in the format ‘name_retention time_retention index_base peak’. Metabolite abundances less than 0.01 are listed as not detected (ND). Data are primarily from 20 : 1 split gas chromatography‐mass spectrometry (GC‐MS) analysis; however, the abundance of a number of metabolites was calculated from splitless data and annotated with an ‘_S’ extension to the metabolite ID. *Statistical significance (combination of treatment and treatment × time) as determined by analysis of variance (ANOVA) is indicated as A (P < 0.05), B (P < 0.01) or C (P < 0.001). A false discovery rate (FDR) method was applied.
In addition to ANOVA, Student's t‐test was performed on the 92 significantly different metabolites to identify those that were altered significantly by SnToxA at each individual time point (P < 0.05). Only the 37 identified using the databases mentioned previously are discussed here. At 4 hpi, 14 metabolites responded significantly to SnToxA treatment. Fructofuranoside was detected in SnToxA‐treated leaves, but absent in the control, fructose was 1.8‐fold lower in treated leaves and 2‐O‐glycerol‐α‐d‐galactopyranoside was 1.9‐fold higher. Another 10 unknown compounds had also responded to SnToxA treatment by this time point. Cluster 1 of PCA also included the 12‐h samples, at which point 17 metabolites were altered significantly by SnToxA. Ribonic acid, xylitol, arabinitol, sedoheptulose and sucrose were all 1.2–1.6‐fold lower in SnToxA‐treated wheat. Glucuronic acid was detected in small amounts in the control, but absent in treated wheat, and glucose‐6‐phosphate and aspartic acid were detected in SnToxA‐treated wheat, but were below the limits of detection in the control.
Cluster 2 of PCA grouped the 24‐h control and SnToxA‐treated samples. The 11 metabolites that were altered significantly in response to SnToxA at this point included α‐ketoglutaric acid and glycerol, which were detected in the control, but absent in SnToxA‐treated wheat. Glucuronic acid and glucaric acid, however, were present in SnToxA‐treated wheat, but absent in the control.
At 48 and 72 hpi, the differences between SnToxA‐treated wheat and the control became most prominent as they diverged into different clusters in PCA. This was reflected by the increase in the number of metabolites changing in response to SnToxA treatment. The abundance of 45 metabolites was altered significantly by SnToxA at 48 h, and that of 51 metabolites at 72 hpi. The compound 2‐O‐glycerol‐α‐d‐galactopyranoside was a considerable 21‐fold higher in abundance in SnToxA‐treated wheat. Threonic acid, fructose, γ‐aminobutyric acid (GABA), malate, quinic acid and xylulose were amongst the known metabolites which also increased by more than two‐fold in response to SnToxA at 48 h. At 72 h, 2‐O‐glycerol‐α‐d‐galactopyranoside was still 13‐fold higher in treated wheat. Quinic acid, fructofuranoside, threonic acid, malate, phosphoric acid, galactonic acid, glucuronic acid, fructose, erythronic acid and glyceric acid were also several fold higher in response to SnToxA. Those metabolites present at significantly lower abundances at 72 hpi in response to SnToxA included maltose, α‐ketoglutarate, dehydroascorbic acid, asparagine and myo‐inositol.
An absence of certain metabolites involved in the reactions of photosynthesis was noticeable in the GC‐MS data. A number of low‐molecular‐weight metabolites, such as pyruvate and glyoxylate, are difficult to detect using standard GC parameters, and the majority of sugars were not detected in their phosphorylated forms because of instability in the conditions involved in this analysis. These facts highlight the benefits and complementary nature of undertaking both proteomics and metabolomics approaches.
DISCUSSION
SnToxA triggers the collapse of photosynthesis and causes an oxidative burst
The proteomics approach detected multiple proteins associated with PSI and PSII, as well as the Calvin cycle and other aspects of photosynthesis and photorespiration. The abundance of the majority of these proteins was observed to increase at 12 hpi with SnToxA, after which, they decreased significantly and continually in abundance throughout the remainder of the time course. It has been well established in previous studies that Ptr ToxA is targeted to the chloroplast and induces photosystem changes (Manning et al., 2007; Pandelova et al., 2009). These data suggest that SnToxA also appears to be localized and targeted to the chloroplast, where it has a negative impact on photosynthesis. How Ptr ToxA and SnToxA impair photosynthesis is currently unknown, although the binding of Ptr ToxA to plastocyanin has been demonstrated (Tai et al., 2007).
One of the primary outcomes of photosynthetic disruption is the accumulation of ROS. Previous studies on Ptr ToxA have demonstrated conclusively that its infiltration into Tsn1‐wheat leaves results in the accumulation of ROS. Although ROS were not measured directly in this study, many enzymes associated with ROS detoxification and scavenging were identified as differentially abundant during SnToxA exposure. These included all three BAS1 peroxiredoxin isoforms, a chloroplastic lipocalin, a thioredoxin m, a glutathione peroxidase, a cyclophilin, as well as the peroxisome with an ascorbate peroxidase. The up‐regulation of these ROS enzymes at 12 and/or 24 hpi implies that the cell and, in particular, the chloroplast actively detoxify ROS. The metabolomics data also provided evidence that the host is attempting to detoxify increasing ROS levels. This evidence includes increased levels of several metabolites associated with ascorbate metabolism, including dehydroascorbate, threonic acid, glucuronic acid and glucaric acid.
It is important to note that multiple sources of ROS in plant cells have been identified previously. The primary source for ROS produced in response to pathogen recognition is NAPDH oxidase. Evidence is also now emerging that ROS generated within the cell also plays a role in plant–pathogen interactions (Mur et al., 2008; Torres, 2010). Studies by Ciuffetti and co‐workers have shown that ROS accumulate in the chloroplast of Ptr ToxA‐treated leaves (Manning et al., 2009). One mechanism of ROS production in the chloroplast occurs when the photon intensity is in excess of that required for CO2 fixation, also known as the excess excitation energy (EEE) (Karpinski et al., 2003). How exposure to SnToxA leads to EEE generation is unknown. One possibility may be the binding of SnToxA to plastocyanin, as has been demonstrated for Ptr ToxA. If SnToxA were to bind to, and inhibit, the function of plastocyanin, this would result in an accumulation of electrons in PSII, leading to the eventual degradation of the reaction centre (Schottler et al., 2004; Sommer et al., 2003). Perhaps the accumulation in the photosynthetic machinery demonstrated in this study at 12 hpi is a response by the cell to compensate for the initial decrease in efficiency caused by the binding of SnToxA to plastocyanin. This compensatory increase, however, would be finite, and the continual blockage of electron transfer between the two photosystems through the binding of SnToxA to plastocyanin would eventually lead to excessive electron accumulation, triggering the collapse of the photosystems. This is evident from the continual decrease in proteins involved in both photosynthesis and photorespiration throughout the later periods of the time course. It is also relevant that the abundance of enzymes associated with ROS detoxification decreased significantly after 24 hpi. These data suggest that the scavenging and detoxification of ROS are probably overwhelmed by the levels produced through the collapse of photosynthesis, leading to the continual increase in ROS levels during exposure, as reported previously.
The roles of ROS produced in the chloroplast in response to SnToxA exposure are likely to be multiple. First, it is well established that lipid peroxidation by H2O2 plays a key role in the execution of light‐dependent cell death (Montillet et al., 2005; Torres, 2010). Apart from the requirement of SnToxA for light, our data also show a strong up‐regulation of chloroplastic lipocalin. Chloroplastic lipocalin is a thylakoid luminal protein that responds positively at the transcriptional level to various abiotic stresses, including drought, high light and paraquat (Levesque‐Tremblay et al., 2009). Mode‐of‐action studies have shown that it is involved in the protection of thylakoid membranes from lipid peroxidation (e.g. as a product of photosynthetic impairment) and that it represents a defence mechanism against oxidative stress. It has also been demonstrated that ROS have regulatory and signalling roles, including the induction of phosphorylation cascades involved in cell death responses (Asai et al., 2002; Samuel et al., 2005; Torres, 2010). It is significant to note that Pandelova et al. (2009) showed the up‐regulation of TaMPK3 gene expression during Ptr ToxA exposure, particularly towards the latter stages of the time course study when ROS levels would be at their highest. MPK3 homologues are mitogen‐activated protein (MAP) kinases that have been shown to respond positively at the transcriptional, translational and post‐translational levels during the activation of either effector‐triggered immunity or pathogen‐associated molecular pattern (PAMP)‐triggered immunity. Rudd et al. (2008) have shown that TaMPK3 responds to infection by the related wheat pathogen Mycosphaerella graminicola, and have suggested that it plays a role in ETS. The current study and previous observations suggest that ROS induced by SnToxA and Ptr ToxA localization to the chloroplast are involved directly in cell death through lipid peroxidation, and also act as signalling molecules to trigger the ETS response.
SnToxA induces host defence responses
Biomarkers commonly observed during pathogen invasion showed a response to SnToxA infiltration, in particular pathogenesis‐related (PR) proteins, including cell wall‐degrading enzymes. Also known as inducible defence‐related proteins, PR proteins are absent or barely detectable in healthy tissues, and accumulate under pathological conditions. Although not categorized as a PR protein, a phenylalanine ammonia‐lyase, the first enzyme of the phenylpropanoid pathway, falls within this definition (Van Loon et al., 2006). All of the ten PR proteins identified in this study were significantly (P < 0.05) more abundant in SnToxA‐infiltrated leaves at 48 hpi than in controls. Nine were basic and were induced by more than 3.8‐fold; there were four chitinases (spots B024, B038, B116, B119), which could belong to the PR‐3, PR‐4, PR‐8 or PR‐11 family, two thaumatin‐like proteins (spots B023, B163), part of the PR‐5 family, one member of the PR‐1 family (spot B176) and two β‐glucosidases (spots B205, B206), members of the PR‐2 family. The acidic β‐glucosidase (spot A550) was up‐regulated in SnToxA‐infiltrated leaves at 0.5, 4 and 48 hpi, by 2.5‐, 2.6‐ and 2.3‐fold, respectively. At 48 hpi, phenylalanine ammonia‐lyase (B046) presented a 2.7‐fold significant (P < 0.01) induction at the protein level. Previous studies have demonstrated that the transcript levels of chitinase, a PR‐1 protein and β‐glucosidase (Adhikari et al., 2009), as well as the transcript abundances of PR‐2 and PR‐4 proteins (Pandelova et al., 2009), increase in wheat leaves infiltrated with Ptr ToxA. It is interesting to note that no PR proteins were detected as being differentially abundant in a recent study examining the effect of PtrToxB on the wheat leaf proteome (Kim et al., 2010). Most PR proteins possess antifungal properties. Although the mode of action and cellular and molecular targets of PR‐1 remain unknown, its involvement in the host defence reaction against a variety of pathogens has been widely reported; moreover, its constitutive or over‐expression leads to an enhanced host resistance or tolerance (Van Loon et al., 2006). Both chitinases and β‐glucosidases hydrolyse glycosidic bonds in fungal cell walls, thereby releasing chitin oligomers and β‐1,3‐glucans, respectively, which, in turn, act as elicitors of the defence reaction. Resistance in wheat would rely on a rapid recognition of the fungal pathogen sensed from released β‐1,3‐glucans (Shetty et al., 2009). Similarly, thaumatin‐like proteins are assumed to destroy the fungal cell wall through glucan binding and glucanase activities (Liu et al., 2010).
The interesting aspect of this observed increase in PR protein abundance on SnToxA exposure is that it occurs in the absence of the pathogen or any other known PAMPs. A previous study examining PR protein gene expression in catalase‐deficient tobacco showed conclusively that sublethal levels of H2O2 were sufficient to activate the expression of acidic and basic PR proteins. However, it was the onset of chlorosis and necrosis (as observed in a typical HR response) that was the trigger for rapid and strong activation of PR protein expression (Chamnongpol et al., 1998). Evidence from this study and others has shown that Ptr ToxA and SnToxA exposure results in the induction of intracellular ROS production and the up‐regulation of ROS‐detoxifying enzymes. It is significant to note that PR proteins begin to accumulate at 24 hpi, but increase significantly at 48 hpi, precisely the time at which the visible symptoms of chlorosis become apparent. Taken together, these data imply that the accumulation of ROS, including H2O2, as a result of the disruption of the photosynthetic process, is sufficient to cause an increase in PR protein abundance in the absence of S. nodorum.
SnToxA has significant effects on central primary metabolism
Using a complementary metabolomics approach, this study has shown that SnToxA exposure results in significant consequences on the central carbon metabolism of wheat. It should be considered that, although the measurement of differentially expressed transcripts and protein levels provides some indication of metabolic control, changes in protein abundance do not always correlate with enzymatic activity, which is often controlled by the substrates and products themselves. Many reactions are controlled at the post‐translational level involving metabolic feedback mechanisms and phosphorylation (Paul and Pellny, 2003). A key example of this concept is the inhibition of phosphofructokinase [PFK, a principal regulator of the carbon flux through glycolysis and the tricarboxylic acid (TCA) cycle] by phosphoenolpyruvate, a downstream product of the reaction catalysed by PFK (Berg et al., 2007). Analysis of the small polar metabolome has demonstrated that SnToxA causes significant changes in the abundance of TCA cycle intermediates at the stage of visible plant chlorosis. The TCA cycle serves the crucial role of producing usable energy to the cell in the form of ATP, in addition to generating the reducing power essential for many biochemical reactions (Fernie et al., 2004). Interestingly, two key intermediates in this pathway (citrate and malate) show a significant increase in abundance from 48 hpi in response to SnToxA (fold changes of 1.8 and 4.4, respectively, at 72 hpi). Succinate, although not significant (P= 0.07 at 48 h), is also consistent with this trend. The proteomics data generated in this study substantiate the claim, with data detailing a late induction of the TCA cycle enzyme malate dehydrogenase (MDH) in response to SnToxA treatment. This enzyme has been shown previously to be up‐regulated in wheat in response to the proteinaceous effector PtrToxB (Kim et al., 2010).
The up‐regulation of TCA cycle intermediates on SnToxA exposure appears to belie the chlorotic state of the infiltrated host tissue at this stage. It has been demonstrated that the gene expression of TCA cycle enzymes in Arabidopsis thaliana increases in response to the bacterial plant pathogen Pseudomonas syringae (Scheideler et al., 2002). We present the first direct evidence of an increase in TCA cycle metabolites in response to pathogen effectors. It could be speculated that the up‐regulation of TCA cycle metabolism is a consequence of the inhibition of photosynthesis caused by SnToxA. Ptr ToxA causes chlorophyll loss (Manning et al., 2004) and decreases in photosystem complexes I and II (Adhikari et al., 2009; Pandelova et al., 2009), disrupting the electron transport chain (ETC) and therefore energy production in chloroplasts. The ETC in mitochondria is therefore the only remaining site for energy production to continue. The mitochondrial ETC requires an electron donor, which can be generated by the TCA cycle in the form of NADPH (Buchanan et al., 2009). However, the lack of the ability of plants to photosynthesize following SnToxA treatment reduces the availability of sugars for conversion to acetyl‐CoA required for the TCA cycle to function. In such conditions of starvation, β‐oxidation of fatty acids is often utilized to generate acetyl‐CoA (Graham et al., 1994).
In plants, β‐oxidation of fatty acids occurs in glyoxysomes (Cooper and Beevers, 1969). The acetyl‐CoA produced is used in the glyoxylate cycle, which bears similarities to the TCA cycle; however, the two CO2‐producing steps are omitted (Berg et al., 2007). The majority of research concerning the role of the glyoxylate cycle in plants has been undertaken on germinating seeds and senescing leaves (Graham et al., 1994; McLaughlin and Smith, 1994), as this pathway was, until recently, considered to be redundant once plants are able to photosynthesize. However, mature plants, including wheat, have been shown to possess the enzymes involved in this cycle (Janssen, 1995; Nieri et al., 1997; Pistelli et al., 1991). Several studies have observed glyoxylate cycle activation during the HR induced by fungal invasion (Cots et al., 2002) and under conditions of starvation (Graham et al., 1992, 1994). β‐Oxidation of fatty acids and carbon metabolism through the glyoxylate cycle represent a possible mechanism for enabling wheat to continue energy production following SnToxA treatment. In support of the glyoxylate cycle hypothesis, the only TCA cycle intermediate detected in this study that did not follow a pattern of increasing abundance was α‐ketoglutarate, a metabolite bypassed in the glyoxylate cycle.
A further explanation for the up‐regulation of the TCA cycle is the synthesis of metabolites, such as amino acids and porphyrins, which, apart from having important roles themselves, are building blocks for secondary metabolites important in plant defence (Buchanan et al., 2009). Studies are currently underway to analyse the secondary metabolites in SnToxA‐treated samples. An example of a primary metabolite synthesized by the TCA cycle is GABA, a nonprotein amino acid well known for its role as a neurotransmitter in animals (Bouche and Fromm, 2004). GABA accumulates in response to abiotic and biotic stresses; however, it has an enigmatic role in plants and, only recently, has research identified its part in the carbon–nitrogen balance, regulation of pH, herbivore defence, redox regulation, energy production and as a signalling molecule (Fait et al., 2008; Oliver and Solomon, 2004; Solomon and Oliver, 2002). GABA has also been reported to prevent damage caused by oxidative stress as reducing equivalents are produced by the GABA shunt to eliminate ROS (Oliver and Solomon, 2004). GABA was present at significantly higher abundance at 48 and 72 hpi in response to SnToxA treatment. Its precursor, α‐ketoglutarate, showed a decrease at 72 hpi in SnToxA‐treated wheat, suggesting depletion, perhaps as a result of the production of glutamate and, subsequently, GABA. Whether GABA is produced in response to oxidative stress or as a signalling molecule has yet to be established.
SnToxA and Ptr ToxA have comparable modes of action
A previous seminal study by Friesen et al. (2006) demonstrated that SnToxA, like Ptr ToxA, interacts with Tsn1. This is the first such study to analyse the host response to SnToxA exposure and, as such, has allowed us to further assess the relationship of Ptr ToxA and SnToxA in terms of biological activity. The data presented in this study show that SnToxA appears to cause significant effects on photosynthesis, with many proteins associated with this process significantly less abundant after a short exposure to the effector protein. SnToxA also induces a series of defence responses in susceptible wheat leaves, including the up‐regulation of multiple PR proteins and significant changes to ROS metabolism. These changes have mostly been described for Ptr ToxA‐infiltrated leaves, albeit at the transcript level, demonstrating, for the first time, the comparable nature of SnToxA and Ptr ToxA in terms of biological activity.
These data also provide further evidence that necrotrophic pathogens, such as S. nodorum and P. tritici‐repentis, seek to manipulate existing host machinery to cause cell death and promote infection. However, many questions still remain, in particular with respect to the roles of the generated ROS, and follow‐up work is now underway to examine host signalling pathways and lipid composition during SnToxA exposure. It is also worth noting that a further two genes encoding effector proteins in S. nodorum have been identified recently (Liu et al., 2009). This study has highlighted the power of investigating both proteins and metabolites during effector exposure, and it is envisaged that such approaches will be employed to analyse the modes of action of these two new necrotrophic effectors.
EXPERIMENTAL PROCEDURES
Wheat culture, leaf infiltration and sampling, and toxicity assay
SnToxA‐sensitive wheat (Triticum aestivum L. genotype BG261) was grown from seeds, as described previously (Solomon et al., 2006). SnToxA was purified from S. nodorum, as described previously (Oliver et al., 2009). Ten‐day‐old plants were infiltrated, as described previously (Liu et al., 2004), with either distilled H2O or purified SnToxA (1.22 µg/mL) at the start of the photoperiod.
Plants for proteomic analysis were collected at 0, 0.5, 4, 12, 24 and 48 hpi. Three biological replicates were collected, each containing ten infiltrated areas. Infiltrated leaf areas for soluble protein extraction were pooled and instantly frozen in liquid nitrogen and stored at −80 °C. Plants for metabolomic analysis were harvested at 0, 4, 12, 24, 48 and 72 hpi. Six biological replicates were harvested, each containing eight leaf sections per sample. Metabolism was quenched in liquid nitrogen immediately and tissue was stored at −80 °C until extraction.
For the toxicity assay, fresh infiltrated leaf samples were digitalized using a flatbed scanner (model Epson Perfection 4990 Photo, Epson, North Ryde, NSW, Australia). Changes in colour associated with infiltration symptoms were analysed using Scion Image software (Scion Corporation, Frederick, MD, USA) following the method devised by Wijekoon et al. (2008). The chlorotic area associated with SnToxA infiltration was quantified across the following time course: 0, 0.5, 4, 12, 24, 48 and 72 hpi (Adhikari et al., 2009). Five leaves infiltrated with water and ten leaves infiltrated with SnToxA were used for each time point.
Protein extraction, assay and labelling
Frozen leaf samples were finely ground in liquid nitrogen using a chilled mortar and pestle. Soluble proteins were extracted using a trichloroacetic acid–2‐mercaptoethanol–acetone method devised by Damerval et al. (1986). Protein pellets were solubilized in 1 mL DIGE lysis buffer (7 m urea, 2 m thiourea, 4% w/v 3‐[3‐(cholamidopropyl)dimethylammonio]‐1‐propanesulphonate, 30 mm Tris‐Cl, pH 8.5). Protein extracts were transferred into 2‐mL Eppendorf tubes and their pH was monitored by diluting 2 µL into 20 µL double‐distilled H2O and wetting pH 0–14 indicator strips (Merck, Kilsyth, Vic., Australia). When necessary, the pH of the protein extract was adjusted to 8.5 with 50 mm NaOH.
The protein content of leaf protein extracts was estimated using a 2‐D Quant Kit (GE Healthcare, Ryldamere, NSW, Australia) following the manufacturer's instructions. Protein extracts were stored at −20 °C until use.
In order to maximize labelling reproducibility across samples, a 150‐µg aliquot of each protein extract was transferred into a fresh 1.5‐mL Eppendorf tube and completed with DIGE lysis buffer to bring the volume to 150 µL in each tube. The homogeneity of protein content was further checked using one‐dimensional electrophoresis (data not shown). Samples were labelled using CyDye DIGE fluors (minimal dyes kit, GE Healthcare), according to the manufacturer's instructions, with minor modifications. Amine reactive cyanine (Cy) dyes were freshly dissolved in anhydrous dimethyl formamide. The internal standard consisted of a pool of 75 µg of each sample and was labelled with 200 pmol Cy2. DIGE labels were assigned to samples according to a randomized design; 150 µg of proteins of each sample were labelled with 200 pmol Cy3 or Cy5. Labelling reactions were performed in a cold room on ice and quenched using 10 mm lysine. Samples labelled with Cy3 and Cy5 were randomly pooled and mixed with the Cy2‐labelled internal standard prior to isoelectric focusing (IEF). The labelling reaction was incubated on ice in the dark for 30 min. The reaction was terminated by the addition of 10 nmol lysine.
Two‐dimensional electrophoresis
Wheat leaf proteins were separated using two‐dimensional electrophoresis (O'Farrell, 1975). During the first dimension, proteins were resolved along two pH ranges: acidic (pH 4–7) and basic (pH 7–10); they are hereafter referred to as acidic and basic proteins, respectively.
For acidic proteins, all 36 samples (two treatments × six time points × three replicates) were analysed over the whole 0–48‐h time course. DIGE‐labelled protein samples were separated using the IPG‐IEF technique (Bjellqvist et al., 1982). Pooled labelled samples (375 µg proteins/gel) were diluted into an IEF solution (7 m urea, 2 m thiourea, 4% w/v 3‐[3‐(cholamidopropyl)dimethylammonio]‐1‐propanesulphonate, 1% w/v dithiothreitol, 1% v/v 2‐mercaptoethanol, 10 mm tris‐(2‐carboxyethyl)‐phosphine‐HCl, 0.25% ampholites 3–10, 0.25% ampholites 4–7) to reach a volume of 470 µL, and then loaded onto 24‐cm 4–7 IPG strips (GE Healthcare) through in‐gel rehydration. IPG‐IEF was performed at 20 °C using IPGphor II (GE Healthcare) and the following programme: 0 V for 1 h, after which mineral oil was added, 50 V for 12 h, 200 V for 30 min, 500 V for 30 min, 1000 V for 1 h, 8000 V for 90 h, until a total of 93 000 Vh had passed.
For basic proteins, 12 samples (two treatments × two time points × three replicates) from time points 24 h and 48 h were separated using IPG‐IEF. Unlabelled protein samples (500 µg proteins/gel) were diluted into DeStreak rehydration solution (GE Healthcare) with 1% ampholites 7–10 to reach a volume of 470 µL, and then loaded onto 24‐cm 7–10 IPG strips (Bio‐Rad, Hercules, CA, USA) through passive in‐gel rehydration overnight. IPG‐IEF was performed at 20 °C using MultiPhor II (GE Healthcare) and the following programme: 150 V for 15 min, 200 V for 30 min, 300 V for 5 min, 300 V for 5 h, 1000 V for 5 h, 3500 V for 4 h, 3500 V for 102 h, until a total of 370 000 Vh had passed. To produce gels for spot excision, the same protocol was applied, except that 1 mg of proteins was loaded.
IPG strip equilibration was performed according to Görg et al. (1988) by incubation in 1% dithiothreitol for 15 min, followed by incubation in 2.5% iodoacetamide for 15 min. Equilibrated IPG strips were transferred onto 12.5% homecast polyacrylamide/bisacrylamide (37.5 : 1) gels (0.1 × 24 × 20 cm3) and sealed in 1% (w/v) agarose (Invitrogen, Mulgrave Vic., Australia) in Laemmli (Laemmli, 1970) running buffer with 0.002% (w/v) bromophenol blue (BPB). The second dimension was performed using the Ettan DALTsix Electrophoresis Unit (GE Healthcare) at 10 °C at 40 V for 30 min, followed by 450 V for 4 h 30 min (0.4 mA, 100 W).
Gel staining, image processing and statistical analyses
For labelled acidic proteins, two‐dimensional gels were digitalized using Typhoon Trio (GE Healthcare) employing fluorescence acquisition mode, 200‐µm resolution, 600 V photomultiplier tube and normal sensitivity. Images were analysed using DeCyder 2D 7.0 (GE Healthcare). About 1000 spots were detected per image.
For basic proteins, two‐dimensional gels were stained following the silver nitrate staining method developed by Rabilloud and Charmont (2000). Stained gels were scanned using a Molecular Imaging PharosFX Plus system (Bio‐Rad) at 100‐µm resolution with the densitometry mode. Images were converted into TIF format (16‐bit greyscale, 254 dots per inch). Images were processed using ImageMaster 2D Platinum (GE Healthcare). About 500 spots were detected per image. Statistical analyses were executed on reproducible spots only (i.e. present in two of three biological replicates).
Two‐way ANOVAs were performed using JMP 8.0.1 software (SAS Institute Inc., Cary, NC, USA) and the following model: Aij= TIi+ TRj+ (TI × TR)ij+eij, where Aij denotes the protein abundance measured for time i and treatment j, with 1 < i < 6 and 1 < j < 2. The terms TIi and TRj measure the effect of the time and treatment, respectively. The interaction term (TI × TR)ij accounts for the interaction between time and treatment. An FDR method (Reiner et al., 2003) was applied. One‐way ANOVAs were also carried out using JMP at each time point, employing the following model: Ai= TRi+ei, where Ai denotes the protein abundance measured for treatment i, with 1 < i < 2. All spots that displayed significant P values (α= 0.1) for treatment and time × treatment interaction effects were selected for excision. Among the spots that displayed significant P values for the time effect, those that showed significant treatment effect at a particular time point were also selected for excision. Hierarchical clustering analyses (HCAs) using Ward's method and PCAs were performed using JMP.
For the excision of significant acidic spots, two‐dimensional gels obtained following DIGE labelling and separation along the pH 4–7 range were further stained using the ‘Blue Silver’ Coomassie staining protocol of Candiano et al. (2004). For the excision of significant basic spots, two‐dimensional gels on which 1 mg of proteins from pooled samples per time point (24 and 48 h) were loaded and resolved along the pH 7–10 range were stained following Candiano et al. (2004).
Protein identification using MS
Significant spots (76 acidic and 54 basic) were manually excised in duplicate from Coomassie‐stained gels and pooled into a fresh tube. Following destaining by three 45‐min washes with 25 mm ammonium bicarbonate in 50 : 50 acetonitrile–water, spots were vacuum dried, trypsin digested and analysed using a 5800 MALDI TOF/TOF TM analyser (Applied Biosystems/MDS SCIEX, Mulgrave, Vic., Australia) as described in Bringans et al. (2008a). The 55 spots that did not yield any spectrum were further analysed using a Ultimate 3000 nanoflow LC system (Dionex, Bannockburn, IL, USA) online with the 4000‐Q‐Trap (Applied Biosystems), as described in (Bringans et al., 2008b).
Peptide mass fingerprinting spectra and the peptide sequence spectra of each sample were processed using mascot software (Matrix Science, London, UK) hosted at the Australian Proteomics Computational Facility (http://www.apcf.edu.au). mascot parameters were set as follows: methionine oxidation as a variable modification, one maximum miscleavage, monoisotopic 1+ peptide charge and a 0.4‐Da peptide tolerance. Data search files were searched against the nonredundant (nr) National Center for Biotechnology Information (NCBI) database restricted to Viridiplantae. MS outputs are available on the PRIDE repository (http://www.ebi.ac.uk/pride) with accession number 16648, corresponding to spots A136 to B216. These outputs are also available in Table S4 (see Supporting Information).
The TargetP algorithm (Emanuelsson et al., 2000) (http://www.cbs.dtu.dk/services/TargetP/) was used online to predict targeted compartments. The ChloroP algorithm (Emanuelsson et al., 1999) (http://www.cbs.dtu.dk/services/ChloroP/) was used online to predict chloroplast targeting based on the predicted presence of cTP. Proteins of unknown function were further searched against the nr database using the blastp algorithm. Annotations with a minimum E value of 1.00e‐25 were selected; their abbreviated codes display an asterisk.
Extraction, derivatization and analysis of wheat metabolites using GC‐MS
Metabolite analysis was carried out with slight modifications to previous methods (Ipcho et al., 2010). Sample weights were taken of frozen tissue before samples were homogenized (2 min, 20 Hz) in a Tissue Lyser (Qiagen, Hilden, Germany). Frozen tissue powder (approximately 60 mg) was extracted with methanol (800 µL) containing 0.125 mg/mL of ribitol internal standard. The mixture was extracted at 4 °C with shaking (45 min, 900 rpm) and mixed with water (200 µL). To remove nonpolar metabolites, chloroform (500 µL) was added, mixed vigorously and centrifuged (10 min, 2000 g). The upper methanol–water phase was taken and washed again with chloroform (500 µL). The nonpolar phase was discarded and the methanol–water phase was dried under vacuum.
Derivatization was performed online with the Gerstel MultiPurpose Sampler (Linthicum, MD, USA). Methoximation of carbonyl groups was achieved with incubation and shaking at 37 °C (90 min, 1200 rpm) with methylamine‐HCl (20 µL, 20 mg/mL in pyridine). Trimethylsilylation of polar groups was completed by the addition of 30 µL of N‐trimethylsilyl‐N‐methyl trifluoroacetamide (MSTFA), followed by incubation at 37 °C and shaking for 30 min.
GC‐MS analysis was undertaken as described previously (Lowe et al., 2009). Samples were analysed in splitless and 20 : 1 split modes in order to obtain quantitative data for all metabolites over the extensive range of concentrations present. The splitless dataset was used for metabolites of lower concentration which were not reliably quantified in the split analysis. Metabolite abundances were normalized to the ribitol internal standard and sample weights using AnalyzerPro (SpectralWorks Ltd., Runcorn, Cheshire, UK). The mass spectra of the compounds found were identified using the publicly available Golm metabolome database (Max‐Planck‐Institute for Plant Physiology; Schauer et al., 2005) and the commercial National Institute of Standards and Technology 08 (NIST; http://www.nist.gov/index.html) mass spectral library. Data analyses were carried out using The Unscrambler (Version 10.0, CAMO ASA, Oslo, Norway) and the JMP 8.0.1 statistical package (SAS Institute Inc.). Metabolites deemed to be significant as determined by ANOVA for treatment and treatment × time were combined. An FDR method was applied (Benjamini and Hochberg, 1995).
Supporting information
Table S1 Features of the experimental design pertaining to two‐dimensional electrophoresis.
Table S2 Observed pI and molecular weight (MW), log2 ratios (ToxA/H2O) and P values of the identified proteins.
Table S3 Identities of differentially expressed proteins following matrix‐assisted laser desorption ionization time‐of‐flight tandem mass spectrometry (MALDI TOF/TOF MS/MS) and MASCOT search. C, chloroplastic location; S, secreted protein; –, other location. Spots highlighted in grey contain more than one protein (i.e. cross‐contaminations).
Table S4 MASCOT results.
Supporting info item
Supporting info item
Supporting info item
Supporting info item
ACKNOWLEDGEMENTS
We thank Sue Lyons for her help with growth chamber parameters, Rosemary Birch, Melanie Wagner and Liam Cassidy for their help with leaf infiltration, Samira Hassan for her assistance with Typhoon, Cassandra Harris for her assistance with DeCyder and Dr Michael Djordjevic for the use of ImageMaster2D. This work was financially supported by the Australian Research Council (DP0986139).
REFERENCES
- Adhikari, T.B. , Bai, J. , Meinhardt, S.W. , Gurung, S. , Myrfield, M. , Patel, J. , Ali, S. , Gudmestad, N.C. and Rasmussen, J.B. (2009) Tsn1‐mediated host responses to ToxA from Pyrenophora tritici‐repentis . Mol. Plant–Microbe Interact. 22, 1056–1068. [DOI] [PubMed] [Google Scholar]
- Asai, T. , Tena, G. , Plotnikova, J. , Willmann, M.R. , Chiu, W.L. , Gomez‐Gomez, L. , Boller, T. , Ausubel, F.M. and Sheen, J. (2002) Map kinase signalling cascade in Arabidopsis innate immunity. Nature, 415, 977–983. [DOI] [PubMed] [Google Scholar]
- Ballance, G.M. , Lamari, L. and Bernier, C.C. (1989) Purification and characterization of a host‐selective necrosis toxin from Pyrenophora tritici‐repentis . Physiol. Mol. Plant Pathol. 35, 203–213. [Google Scholar]
- Benjamini, Y. and Hochberg, Y. (1995) Controlling the false discovery rate: a practical and powerful approach to multiple testing. J. R. Stat. Soc. Ser. B (Methodol.) 57, 289–300. [Google Scholar]
- Berg, J.M. , Tymoczko, J.L. and Stryer, L. (2007) Biochemistry. New York: W.H. Freeman and Company. [Google Scholar]
- Bjellqvist, B. , Ek, K. , Righetti, P.G. , Gianazza, E. , Gorg, A. , Westermeier, R. and Postel, W. (1982) Isoelectric focusing in immobilized pH gradients: principle, methodology and some applications. J. Biochem. Biophys. Methods, 6, 317–339. [DOI] [PubMed] [Google Scholar]
- Bouche, N. and Fromm, H. (2004) GABA in plants: just a metabolite? Trends Plant Sci. 9, 110–115. [DOI] [PubMed] [Google Scholar]
- Bringans, S. , Eriksen, S. , Kendrick, T. , Gopalakrishnakone, P. , Livk, A. , Lock, R. and Lipscombe, R. (2008a) Proteomic analysis of the venom of Heterometrus longimanus (Asian black scorpion). Proteomics, 8, 1081–1096. [DOI] [PubMed] [Google Scholar]
- Bringans, S. , Kendrick, T.S. , Lui, J. and Lipscombe, R. (2008b) A comparative study of the accuracy of several de novo sequencing software packages for datasets derived by matrix‐assisted laser desorption/ionisation and electrospray. Rapid Commun. Mass Spectrom. 22, 3450–3454. [DOI] [PubMed] [Google Scholar]
- Buchanan, B.B. , Gruissem, W. and Jones, R.L. (2009) Biochemistry and Molecular Biology of Plants. Somerset, NJ: John Wiley & Sons Inc. [Google Scholar]
- Candiano, G. , Bruschi, M. , Musante, L. , Santucci, L. , Ghiggeri, G.M. , Carnemolla, B. , Orecchia, P. , Zardi, L. and Righetti, P.G. (2004) Blue silver: a very sensitive colloidal Coomassie G‐250 staining for proteome analysis. Electrophoresis, 25, 1327–1333. [DOI] [PubMed] [Google Scholar]
- Chamnongpol, S. , Willekens, H. , Moeder, W. , Langebartels, C. , Sandermann, H. , Van Montagu, M. , Inze, D. and Van Camp, W. (1998) Defense activation and enhanced pathogen tolerance induced by H2O2 in transgenic tobacco. Proc. Natl. Acad. Sci. USA, 95, 5818–5823. [DOI] [PMC free article] [PubMed] [Google Scholar]
- Cooper, T.G. and Beevers, H. (1969) Mitochondria and glyoxysomes from castor bean endosperm. Enzyme constituents and catalytic activity. J. Biol. Chem. 244, 3507–3513. [PubMed] [Google Scholar]
- Cots, J. , Fargeix, C. , Gindro, K. and Widmer, F. (2002) Pathogenic attack and carbon reallocation in soybean leaves (Glycine max L.): reinitiation of the glyoxylate cycle as a defence reaction. J. Plant Physiol. 159, 91–96. [Google Scholar]
- Damerval, C. , de Vienne, D. , Zivy, M. and Thiellement, H. (1986) Technical improvements in two‐dimensional electrophoresis increase the level of genetic variation detected in wheat‐seedling proteins. Electrophoresis, 7, 52–54. [Google Scholar]
- Emanuelsson, O. , Nielsen, H. and Von Heijne, G. (1999) ChloroP, a neural network‐based method for predicting chloroplast transit peptides and their cleavage sites. Protein Sci. 8, 978–984. [DOI] [PMC free article] [PubMed] [Google Scholar]
- Emanuelsson, O. , Nielsen, H. , Brunak, S. and Von Heijne, G. (2000) Predicting subcellular localization of proteins based on their N‐terminal amino acid sequence. J. Mol. Biol. 300, 1005–1016. [DOI] [PubMed] [Google Scholar]
- Fait, A. , Fromm, H. , Walter, D. , Galili, G. and Fernie, A.R. (2008) Highway or byway: the metabolic role of the GABA shunt in plants. Trends Plant Sci. 13, 14–19. [DOI] [PubMed] [Google Scholar]
- Faris, J.D. , Anderson, J.A. , Francl, L.J. and Jordahl, J.G. (1996) Chromosomal location of a gene conditioning insensitivity in wheat to a necrosis‐inducing culture filtrate from Pyrenophora tritici‐repentis . Phytopathology, 86, 459–463. [Google Scholar]
- Faris, J.D. , Zhang, Z. , Lu, H. , Lu, S. , Reddy, L. , Cloutier, S. , Fellers, J.P. , Meinhardt, S.W. , Rasmussen, J.B. , Xu, S.S. , Oliver, R.P. , Simons, K.J. and Friesen, T.L. (2010) A unique wheat disease resistance‐like gene governs effector‐triggered susceptibility to necrotrophic pathogens. Proc. Natl. Acad. Sci. USA, 107, 13 544–13 549. [DOI] [PMC free article] [PubMed] [Google Scholar]
- Fernie, A.R. , Carrari, F. and Sweetlove, L.J. (2004) Respiratory metabolism: glycolysis, the TCA cycle and mitochondrial electron transport. Curr. Opin. Plant Biol. 7, 254–261. [DOI] [PubMed] [Google Scholar]
- Flor, H.H. (1942) Inheritance of pathogenicity in Melampsora lini . Phytopathology, 32, 653–669. [Google Scholar]
- Flor, H.H. (1956) The complementary systems in flax and flax rust. Adv. Genet. 8, 29–54. [Google Scholar]
- Friesen, T.L. , Stukenbrock, E.H. , Liu, Z. , Meinhardt, S. , Ling, H. , Faris, J.D. , Rasmussen, J.B. , Solomon P.S., McDonald B.A. and Oliver R.P. (2006) Emergence of a new disease as a result of interspecific virulence gene transfer. Nat. Genet, 38, 953–956. [DOI] [PubMed] [Google Scholar]
- Friesen, T.L. , Faris, J.D. , Solomon, P.S. and Oliver, R.P. (2008) Host‐specific toxins: effectors of necrotrophic pathogenicity. Cell. Microbiol. 10, 1421–1428. [DOI] [PubMed] [Google Scholar]
- Görg, A. , Postel, W. , Gunther, S. and Friedrich, C. (1988) Horizontal two‐dimensional electrophoresis with immobilized pH gradients using PhastSystem. Electrophoresis, 9, 57–59. [DOI] [PubMed] [Google Scholar]
- Graham, I.A. , Leaver, C.J. and Smith, S.M. (1992) Induction of malate synthase gene expression in senescent and detached organs of cucumber. Plant Cell, 4, 349–357. [DOI] [PMC free article] [PubMed] [Google Scholar]
- Graham, I.A. , Denby, K.J. and Leaver, C.J. (1994) Carbon catabolite repression regulates glyoxylate cycle gene expression in cucumber. Plant Cell, 6, 761–772. [DOI] [PMC free article] [PubMed] [Google Scholar]
- Gygi, S.P. , Rochon, Y. , Franza, B.R. and Aebersold, R. (1999) Correlation between protein and mRNA abundance in yeast. Mol. Cell. Biol. 19, 1720–1730. [DOI] [PMC free article] [PubMed] [Google Scholar]
- Hammond‐Kosack, K.E. and Rudd, J.J. (2008) Plant resistance signalling hijacked by a necrotrophic fungal pathogen. Plant Signal. Behav. 3, 993–995. [DOI] [PMC free article] [PubMed] [Google Scholar]
- Ipcho, S.V.S. , Tan, K.C. , Koh, G. , Gummer, J. , Oliver, R.P. , Trengove, R.D. and Solomon, P.S. (2010) The transcription factor StuA regulates central carbon metabolism, mycotoxin production, and effector gene expression in the wheat pathogen Stagonospora nodorum . Eukaryot. Cell, 9, 1100–1108. [DOI] [PMC free article] [PubMed] [Google Scholar]
- Janssen, B.J. (1995) A cDNA clone for isocitrate lyase from tomato. Plant Physiol. 108, 1339. [DOI] [PMC free article] [PubMed] [Google Scholar]
- Kale, S.D. , Gu, B. , Capelluto, D.G.S. , Dou, D. , Feldman, E. , Rumore, A. , Arredondo, F.D. , Hanlon, R. , Fudal, I. , Rouxel, T. , Lawrence, C.B. , Shan, W. and Tyler, B.M. (2010) External lipid PI3P mediates entry of eukaryotic pathogen effectors into plant and animal host cells. Cell, 142, 284–295. [DOI] [PubMed] [Google Scholar]
- Karpinski, S. , Gabrys, H. , Mateo, A. , Karpinska, B. and Mullineaux, P.M. (2003) Light perception in plant disease defence signalling. Curr. Opin. Plant Biol. 6, 390–396. [DOI] [PubMed] [Google Scholar]
- Kell, D.B. , Brown, M. , Davey, H.M. , Dunn, W.B. , Spasic, I. and Oliver, S.G. (2005) Metabolic footprinting and systems biology: the medium is the message. Nat. Rev. Microbiol. 3, 557–565. [DOI] [PubMed] [Google Scholar]
- Kim, Y.M. , Bouras, N. , Kav, N.N.V. and Strelkov, S.E. (2010) Inhibition of photosynthesis and modification of the wheat leaf proteome by Ptr ToxB: a host‐specific toxin from the fungal pathogen Pyrenophora tritici‐repentis . Proteomics, 10, 2911–2926. [DOI] [PubMed] [Google Scholar]
- Laemmli, U.K. (1970) Cleavage of structural proteins during the assembly of the head of bacteriophage T4. Nature, 227, 680–685. [DOI] [PubMed] [Google Scholar]
- Levesque‐Tremblay, G. , Havaux, M. and Ouellet, F. (2009) The chloroplastic lipocalin AtCHL prevents lipid peroxidation and protects Arabidopsis against oxidative stress. Plant J. 60, 691–702. [DOI] [PubMed] [Google Scholar]
- Liu, J.J. , Sturrock, R. and Ekramoddoullah, A.K. (2010) The superfamily of thaumatin‐like proteins: its origin, evolution, and expression towards biological function. Plant Cell Rep. 29, 419–436. [DOI] [PubMed] [Google Scholar]
- Liu, Z. , Faris, J.D. , Oliver, R.P. , Tan, K.C. , Solomon, P.S. , McDonald, M.C. , McDonald, B.A. , Nunez, A. , Lu, S. , Rasmussen, J.B. and Friesen, T.L. (2009) SnTox3 acts in effector triggered susceptibility to induce disease on wheat carrying the Snn3 gene. PLoS Pathog. 5, e1000581. [DOI] [PMC free article] [PubMed] [Google Scholar]
- Liu, Z.H. , Faris, J.D. , Meinhardt, S.W. , Ali, S. , Rasmussen, J.B. and Friesen, T.L. (2004) Genetic and physical mapping of a gene conditioning sensitivity in wheat to a partially purified host‐selective toxin produced by Stagonospora nodorum . Phytopathology, 94, 1056–1060. [DOI] [PubMed] [Google Scholar]
- Lowe, R.G.T. , Lord, M. , Rybak, K. , Trengove, R.D. , Oliver, R.P. and Solomon, P.S. (2009) Trehalose biosynthesis is involved in sporulation of Stagonospora nodorum . Fungal Genet. Biol. 46, 381–389. [DOI] [PubMed] [Google Scholar]
- Manning, V.A. , Andrie, R.M. , Trippe, A.F. and Ciuffetti, L.M. (2004) Ptr ToxA requires multiple motifs for complete activity. Mol. Plant-Microbe. Interact , 17, 491–501. [DOI] [PubMed] [Google Scholar]
- Manning, V.A. and Ciuffetti, L.M. (2005) Localization of Ptr ToxA produced by Pyrenophora tritici‐repentis reveals protein import into wheat mesophyll cells. Plant Cell, 17, 3203–3212. [DOI] [PMC free article] [PubMed] [Google Scholar]
- Manning, V.A. , Hardison, L.K. and Ciuffetti, L.M. (2007) Ptr ToxA interacts with a chloroplast‐localized protein. Mol. Plant–Microbe Interact. 20, 168–177. [DOI] [PubMed] [Google Scholar]
- Manning, V.A. , Hamilton, S.M. , Karplus, P.A. and Ciuffetti, L.M. (2008) The Arg–Gly–Asp‐containing, solvent‐exposed loop of Ptr ToxA is required for internalization. Mol. Plant–Microbe Interact. 21, 315–325. [DOI] [PubMed] [Google Scholar]
- Manning, V.A. , Chu, A.L. , Steeves, J.E. , Wolpert, T.J. and Ciuffetti, L.M. (2009) A host‐selective toxin of Pyrenophora tritici‐repentis, Ptr ToxA, induces photosystem changes and reactive oxygen species accumulation in sensitive wheat. Mol. Plant–Microbe Interact. 22, 665–676. [DOI] [PubMed] [Google Scholar]
- Manning, V.A. , Chu, A.L. , Scofield, S.R. and Ciuffetti, L.M. (2010) Intracellular expression of a host‐selective toxin, ToxA, in diverse plants phenocopies silencing of a ToxA‐interacting protein, ToxABP1. New Phytol. 187, 1034–1047. [DOI] [PubMed] [Google Scholar]
- McLaughlin, J.C. and Smith, S.M. (1994) Metabolic regulation of glyoxylate‐cycle enzyme synthesis in detached cucumber cotyledons and protoplasts. Planta, 195, 22–28. [Google Scholar]
- Montillet, J.‐L. , Chamnongpol, S. , Rusterucci, C. , Dat, J. , van de Cotte, B. , Agnel, J.‐P. , Battesti, C. , Inze, D. , Van Breusegem, F. and Triantaphylides, C. (2005) Fatty acid hydroperoxides and H2O2 in the execution of hypersensitive cell death in tobacco leaves. Plant Physiol. 138, 1516–1526. [DOI] [PMC free article] [PubMed] [Google Scholar]
- Mur, L.A.J. , Kenton, P. , Lloyd, A.J. , Ougham, H. and Prats, E. (2008) The hypersensitive response; the centenary is upon us but how much do we know? J. Exp. Bot. 59, 501–520. [DOI] [PubMed] [Google Scholar]
- Nieri, B. , Ciurli, A. , Pistelli, L. , Smith, S.M. , Alpi, A. and De Bellis, L. (1997) Glyoxylate cycle enzymes in seedlings and in mature plants of tomato (Lycopersicon esculentum Mill.). Plant Sci. 129, 39–47. [Google Scholar]
- O'Farrell, P.H. (1975) High resolution two‐dimensional electrophoresis of proteins. J. Biol. Chem. 250, 4007–4021. [PMC free article] [PubMed] [Google Scholar]
- Oliver, R.P. and Solomon, P.S. (2004) Does the oxidative stress used by plants for defence provide a source of nutrients for pathogenic fungi? Trends Plant Sci. 9, 472–473. [DOI] [PubMed] [Google Scholar]
- Oliver, R.P. , Rybak, K. , Solomon, P.S. and Ferguson‐Hunt, M. (2009) Prevalence of ToxA‐sensitive alleles of the wheat gene Tsn1 in Australian and Chinese wheat cultivars. Crop and Pasture Science , 60, 348–352. [Google Scholar]
- Oliver, R.P. and Solomon, P.S. (2010) New developments in pathogenicity and virulence of necrotrophs. Curr. Opin. Plant Biol. 13, 415–419. [PubMed] [Google Scholar]
- Pandelova, I. , Betts, M.F. , Manning, V.A. , Wilhelm, L.J. , Mockler, T.C. and Ciuffetti, L.M. (2009) Analysis of transcriptome changes induced by Ptr ToxA in wheat provides insights into the mechanisms of plant susceptibility. Mol. Plant, 2, 1067–1083. [DOI] [PubMed] [Google Scholar]
- Parry, M.A.J. , Reynolds, M. , Salvucci, M.E. , Raines, C. , Andralojc, P.J. , Zhu, X.‐G. , Price, G.D. , Condon, A.G. and Furbank, R.T. (2011) Raising yield potential of wheat. II. Increasing photosynthetic capacity and efficiency. J. Exp. Bot. 62, 453–467. [DOI] [PubMed] [Google Scholar]
- Paul, M.J. and Pellny, T.K. (2003) Carbon metabolite feedback regulation of leaf photosynthesis and development. J. Exp. Bot. 54, 539–547. [DOI] [PubMed] [Google Scholar]
- Pistelli, L. , De Bellis, L. and Alpi, A. (1991) Peroxisomal enzyme activities in attached senescing leaves. Planta, 184, 151–153. [DOI] [PubMed] [Google Scholar]
- Rabilloud, T. and Charmont, S. (2000) Detection of proteins on two‐dimensional electrophoresis gels In: Proteome Research: Two‐Dimensional Gel Electrophoresis and Identification Methods (Rabilloud T., ed.), pp. 107–125. Berlin, New York: Springer. [Google Scholar]
- Reiner, A. , Yekutieli, D. and Benjamini, Y. (2003) Identifying differentially expressed genes using false discovery rate controlling procedures. Bioinformatics, 19, 368–375. [DOI] [PubMed] [Google Scholar]
- Rudd, J.J. , Keon, J. and Hammond‐Kosack, K.E. (2008) The wheat mitogen‐activated protein kinases TaMPK3 and TaMPK6 are differentially regulated at multiple levels during compatible disease interactions with Mycosphaerella graminicola . Plant Physiol. 147, 802–815. [DOI] [PMC free article] [PubMed] [Google Scholar]
- Samuel, M.A. , Hall, H. , Krzymowska, M. , Drzewiecka, K. , Hennig, J. and Ellis, B.E. (2005) SIPK signaling controls multiple components of harpin‐induced cell death in tobacco. Plant J. 42, 406–416. [DOI] [PubMed] [Google Scholar]
- Sarma, G.N. , Manning, V.A. , Ciuffetti, L.M. and Karplus, P.A. (2005) Structure of Ptr ToxA: an RGD‐containing host‐selective toxin from Pyrenophora tritici‐repentis . Plant Cell, 17, 3190–3202. [DOI] [PMC free article] [PubMed] [Google Scholar]
- Schauer, N. , Steinhauser, D. , Strelkov, S. , Schomburg, D. , Allison, G. , Moritz, T. , Lundgren, K. , Roessner‐Tunali, U. , Forbes, M.G. , Willmitzer, L. , Fernie, A.R. and Kopka, J. (2005) GC‐MS libraries for the rapid identification of metabolites in complex biological samples. FEBS Lett. 579, 1332–1337. [DOI] [PubMed] [Google Scholar]
- Scheideler, M. , Schlaich, N.L. , Fellenberg, K. , Beissbarth, T. , Hauser, N.C. , Vingron, M. , Slusarenko, A.J. and Hoheisel J.D. (2002) Monitoring the switch from housekeeping to pathogen defense metabolism in Arabidopsis thaliana using cDNA arrays. J. Biol. Chem. 277, 10 555–10 561. [DOI] [PubMed] [Google Scholar]
- Schottler, M.A. , Kirchhoff, H. and Weis, E. (2004) The role of plastocyanin in the adjustment of the photosynthetic electron transport to the carbon metabolism in tobacco. Plant Physiol. 136, 4265–4274. [DOI] [PMC free article] [PubMed] [Google Scholar]
- Shetty, N.P. , Jensen, J.D. , Knudsen, A. , Finnie, C. , Geshi, N. , Blennow, A. , Collinge, D.B. and Jørgensen, H.J.L. (2009) Effects of beta‐1,3‐glucan from Septoria tritici on structural defence responses in wheat. J. Exp. Bot. 60, 4287–4300. [DOI] [PubMed] [Google Scholar]
- Solomon, P.S. and Oliver, R.P. (2002) Evidence that γ‐aminobutyric acid is a major nitrogen source during Cladosporium fulvum infection of tomato. Planta, 214, 414–420. [DOI] [PubMed] [Google Scholar]
- Solomon, P.S. , Rybak, K. , Trengove, R.D. and Oliver, R.P. (2006) Investigating the role of calcium/calmodulin‐dependent protein kinases in Stagonospora nodorum . Mol. Microbiol. 62, 367–381. [DOI] [PubMed] [Google Scholar]
- Sommer, F. , Hippler, M. , Biehler, K. , Fischer, N. and Rochaix, J.D. (2003) Comparative analysis of photosensitivity in photosystem I donor and acceptor side mutants of Chlamydomonas reinhardtii . Plant Cell Environ. 26, 1881–1892. [Google Scholar]
- Strelkov, S.E. and Lamari, L. (2003) Host–parasite interactions in tan spot [Pyrenophara tritici‐repentis] of wheat. Can. J. Plant Pathol. 25, 339–349. [Google Scholar]
- Tai, Y.‐S. , Bragg, J. and Meinhardt, S. (2007) Functional characterization of ToxA and molecular identification of its intracellular targeting protein in wheat. Am. J. Plant Physiol. 2, 76–89. [Google Scholar]
- Tomas, A. , Feng, G.H. , Reeck, G.R. , Bockus, W.W. and Leach, J.E. (1990) Purification of a cultivar‐specific toxin from Pyrenophora tritici‐repentis, causal agent of tan spot of wheat. Mol. Plant-Microbe. Interact , 3, 221–224. [Google Scholar]
- Torres, M.A. (2010) ROS in biotic interactions. Physiol. Plant. 138, 414–429. [DOI] [PubMed] [Google Scholar]
- Van Loon, L.C. , Rep, M. and Pieterse, C.M.J. (2006) Significance of inducible defense‐related proteins in infected plants. Annu. Rev. Phytopathol. 44, 135–162. [DOI] [PubMed] [Google Scholar]
- Wijekoon, C.P. , Goodwin, P.H. and Hsiang, T. (2008) Quantifying fungal infection of plant leaves by digital image analysis using Scion Image software. J. Microbiol. Methods, 74, 94–101. [DOI] [PubMed] [Google Scholar]
Associated Data
This section collects any data citations, data availability statements, or supplementary materials included in this article.
Supplementary Materials
Table S1 Features of the experimental design pertaining to two‐dimensional electrophoresis.
Table S2 Observed pI and molecular weight (MW), log2 ratios (ToxA/H2O) and P values of the identified proteins.
Table S3 Identities of differentially expressed proteins following matrix‐assisted laser desorption ionization time‐of‐flight tandem mass spectrometry (MALDI TOF/TOF MS/MS) and MASCOT search. C, chloroplastic location; S, secreted protein; –, other location. Spots highlighted in grey contain more than one protein (i.e. cross‐contaminations).
Table S4 MASCOT results.
Supporting info item
Supporting info item
Supporting info item
Supporting info item