

Summary
Frosty pod rot (FPR) of Theobroma cacao (cacao) is caused by the hemibiotrophic fungus Moniliophthora roreri. Cacao clones tolerant to FPR are being planted throughout Central America. To determine whether M. roreri shows a differential molecular response during successful infections of tolerant clones, we collected field‐infected pods at all stages of symptomatology for two highly susceptible clones (Pound‐7 and CATIE‐1000) and three tolerant clones (UF‐273, CATIE‐R7 and CATIE‐R4). Metabolite analysis was carried out on clones Pound‐7, CATIE‐1000, CATIE‐R7 and CATIE‐R4. As FPR progressed, the concentrations of sugars in pods dropped, whereas the levels of trehalose and mannitol increased. Associations between symptoms and fungal loads and some organic and amino acid concentrations varied depending on the clone. RNA‐Seq analysis identified 873 M. roreri genes that were differentially expressed between clones, with the primary difference being whether the clone was susceptible or tolerant. Genes encoding transcription factors, heat shock proteins, transporters, enzymes modifying membranes or cell walls and metabolic enzymes, such as malate synthase and alternative oxidase, were differentially expressed. The differential expression between clones of 43 M. roreri genes was validated by real‐time quantitative reverse transcription polymerase chain reaction. The expression profiles of some genes were similar in susceptible and tolerant clones (other than CATIE‐R4) and varied with the biotrophic/necrotropic shift. Moniliophthora roreri genes associated with stress metabolism and responses to heat shock and anoxia were induced early in tolerant clones, their expression profiles resembling that of the necrotrophic phase. Moniliophthora roreri stress response genes, induced during the infection of tolerant clones, may benefit the fungus in overcoming cacao defense mechanisms.
Keywords: disease tolerance, frosty pod rot, hemibiotroph, metabolite, Moniliophthora roreri, RNA‐Seq, Theobroma cacao
Introduction
Moniliophthora roreri H. C. Evans, Stalpers, Samson & Benny is the causal agent (Evans, 2007; Phillips‐Mora and Wilkinson, 2007) of frosty pod rot (FPR) on Theobroma cacao L. (cacao), the source of chocolate (Wood and Lass, 2001). FPR occurs in most major cacao‐producing areas in the western hemisphere (Evans, 2007; Phillips‐Mora and Wilkinson, 2007). FPR is a major concern because of its devastating effects on yields and limited available control measures (Evans, 2007; Phillips‐Mora and Wilkinson, 2007).
Moniliophthora roreri is a hemibiotroph. During the biotrophic phase, fruits develop malformations and progress to the necrotrophic phase in which sporulation occurs (Evans, 2007; Evans et al., 2002; Phillips‐Mora and Wilkinson, 2007). Recently, a working model for the M. roreri disease cycle in a highly susceptible interaction has been proposed (Bailey et al., 2013). Moniliophthora roreri gene expression is repressed under the limited nutrient conditions of the biotrophic phase (Meinhardt et al., 2006; Mondego et al., 2008). The fungus spreads slowly and positions itself to exploit resources available when necrosis (Nc) is triggered. A shift in M. roreri gene expression occurs between the biotrophic and necrotrophic phases, and pod metabolites are rapidly metabolized by the pathogen during the necrotrophic phase (Bailey et al., 2013).
A program in Central America, centered at CATIE in Costa Rica, distributes clones which show tolerance to FPR (Phillips‐Mora, 2010). The clones used in this study have been under observation for FPR for more than 11 years (Phillips‐Mora et al., 2012). Losses to FPR have increased over the past 7 years in susceptible and tolerant clones (Phillips‐Mora et al., 2012). The molecular and metabolomic characterization of successful infections of tolerant clones is a step towards understanding how M. roreri might overcome tolerance.
Although cacao clones can have significant tolerance to M. roreri, they are not immune, and infections occur at low rates. We used clones associated with the CATIE breeding program to carry out this research. The first objective was to characterize changes in pod metabolite concentrations associated with successful M. roreri infections of susceptible and tolerant clones. The second objective was to characterize the molecular signature for M. roreri when it overcomes the defenses faced in tolerant cacao clones. Comparisons are made between two susceptible cacao clones (Pound‐7 and CATIE‐1000) and three tolerant clones (UF‐273, CATIE‐R7 and CATIE‐R4). By understanding the M. roreri interaction with tolerant cacao clones, we hope to identify the mechanisms associated with overcoming cacao defense responses with implications relative to the sustainability of tolerance in the field. A parallel study is being carried out to identify changes in cacao gene expression caused by M. roreri infection in tolerant and susceptible clones (Ali et al., 2014).
Results
RNA‐Seq analysis of susceptible and tolerant clones infected with M. roreri
RNA‐Seq analysis was carried out on samples from naturally infected pods of two tolerant cacao clones (CATIE‐R7 and CATIE‐R4) and two susceptible clones (Pound‐7 and CATIE‐1000). The RNA‐Seq samples had similar fungal loads (Fr) of around 10%. Fr was estimated as the percentage of the geometric mean of the expression levels of three M. roreri reference genes (Refs) relative to the expression of three cacao Refs. The 10% level was chosen based on previous RNA‐Seq experience as a minimum Fr yielding significant M. roreri transcripts. Pods for the susceptible clones Pound‐7 and CATIE‐1000 were asymptomatic. Symptoms varied for CATIE‐R7 and CATIE‐R4 (Appendix S1, Library Stats) for three reasons: (i) pods of tolerant clones with Fr of approximately 10% and no chlorosis (Ch) or Nc were rare; (ii) symptoms were poorly associated with Fr in tolerant clones; and (iii) the M. roreri genes of interest in pods of tolerant clones should be consistently expressed regardless of symptoms as they are expected to be reactions to the host defenses. The M. roreri transcript levels in the RNA‐Seq samples ranged from 0.31% to 2.42% of the total processed reads (Appendix S1, Library Stats, see Supporting Information). The mean percentages of M. roreri transcripts per clone in the libraries were 1.09%, 1.35%, 0.57% and 0.72% for Pound‐7, CATIE‐1000, CATIE‐R7 and CATIE‐R4, respectively. The normalized geometric mean range for the three M. roreri Refs for each clone varied from 603 reads to 872 reads, a difference of 1.45‐fold (Appendix S1, Reference Genes). The M. roreri transcriptome consists of 17 920 genes (Appendix S2, RNA‐Seq, see Supporting Information). Transcripts of 14 580 genes were detected, with 10 321 being detected by an average of five reads and 4712 being detected by an average of 25 reads in one or more clones. The secretome of M. roreri consists of 1535 proteins (Appendix S2, Secretome). An additional 92 proteins with signal peptides have two or more transmembrane domains and 124 proteins have glycosylphosphatidylinositol (GPI) anchors.
There were 863 transcripts differentially expressed (P ≤ 0.05) between at least one clone pairing (Fig. 1, Appendix S2, Diff Expressed), 198 encoding secreted proteins (Appendix S2, Secretome). Twenty‐three transcripts showed differences between the tolerant and susceptible clones in all combinations (Table 1, Appendix S2, Tol‐Sus). There were 602 transcripts differentially expressed between Pound‐7 and CATIE‐R4, and 408 transcripts differentially expressed between CATIE‐1000 and CATIE‐R4. There were 126 transcripts differentially expressed between Pound‐7 and CATIE‐R7, and 83 transcripts differentially expressed between CATIE‐1000 and CATIE‐R7.
Figure 1.
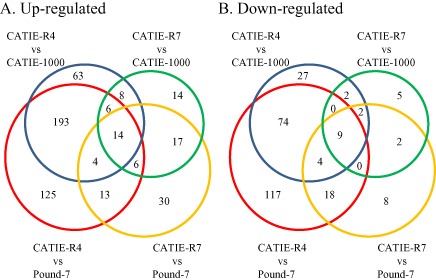
Venn diagrams showing the numbers of genes differentially expressed between susceptible clones Pound‐7 and CATIE‐1000 and tolerant clones CATIE‐R7 and CATIE‐R4.
Table 1.
Moniliophthora roreri genes differentially expressed between tolerant (CATIE‐R7 and CATIE‐R4) and susceptible (CATIE‐1000 and Pound‐7) clones in all comparisons in the RNA‐Seq analysis
| GPI anchor | Mean normalized read/library | Significance (P value) | ||||||||||
|---|---|---|---|---|---|---|---|---|---|---|---|---|
| Accession number | Real‐time qRT‐PCR | Putative ID/function | No | Yes | P7 | C1000 | R7 | R4 | P7–R4 | P7–R7 | C1000–R7 | C1000–R4 |
| evm.model.sctg_0149_0001.18 | Methyl transferase | x | 3771.92 | 2036.95 | 22.34 | 36.22 | <0.001 | <0.001 | <0.001 | <0.001 | ||
| evm.model.sctg_0022_0002.80 | MrHS20 | Heat shock protein hsp20 | 2.33 | 10.80 | 353.36 | 427.07 | <0.001 | <0.001 | <0.001 | <0.001 | ||
| evm.model.sctg_0094_0001.8 | MrEP14 | Methyl transferase | x | 710.53 | 428.46 | 7.87 | 16.25 | <0.001 | <0.001 | <0.001 | <0.001 | |
| evm.model.sctg_0223_0002.11 | MrAAO | d‐Amino acid oxidase | 409.74 | 93.90 | 0.95 | 0.00 | <0.001 | <0.001 | 0.002 | <0.001 | ||
| evm.model.sctg_0003_0001.19 | MrEP22 | Hypothetical protein | 8.89 | 3.18 | 793.25 | 736.65 | <0.001 | <0.001 | <0.001 | <0.001 | ||
| evm.model.sctg_0005_0005.20 | Amide‐like NADH oxidoreductase | 18.98 | 25.81 | 405.07 | 564.41 | <0.001 | <0.001 | 0.001 | <0.001 | |||
| evm.model.sctg_0238_0003.13 | MrHS | Small heat shock protein | 0.85 | 1.83 | 278.02 | 390.12 | <0.001 | <0.001 | <0.001 | <0.001 | ||
| evm.model.sctg_0099_0001.2 | Small heat shock protein | 5.39 | 5.32 | 185.62 | 298.80 | <0.001 | <0.001 | <0.001 | 0.001 | |||
| evm.model.sctg_0199_0001.1 | MrEP15 | Hypothetical protein | x | 4060.35 | 3617.16 | 74.08 | 22.55 | <0.001 | <0.001 | <0.001 | <0.001 | |
| evm.model.sctg_0077_0001.32 | Short‐chain dehydrogenase | 6.16 | 18.77 | 121.06 | 874.98 | <0.001 | <0.001 | 0.024 | <0.001 | |||
| evm.model.sctg_0017_0002.15 | Hypothetical protein | x | 647.09 | 651.42 | 50.31 | 79.23 | 0.002 | 0.002 | 0.003 | 0.001 | ||
| evm.model.sctg_0016_0007.7 | Hypothetical protein | x | 0.69 | 0.11 | 294.51 | 264.84 | <0.001 | 0.002 | 0.001 | <0.001 | ||
| evm.model.sctg_0022_0002.72 | Lactose permease | 1.71 | 0.98 | 27.74 | 14.98 | 0.001 | 0.003 | 0.009 | 0.006 | |||
| evm.model.sctg_0165_0001.3 | C6 transcription factor | 3.97 | 3.59 | 73.47 | 37.12 | 0.008 | 0.004 | 0.002 | 0.002 | |||
| evm.model.sctg_0119_0004.2 | MrCp450b | Cytochrome p450 | 6.66 | 12.72 | 919.92 | 294.64 | <0.001 | 0.005 | 0.009 | <0.001 | ||
| evm.model.sctg_0231_0001.5 | Rhodocoxin reductase | 241.14 | 230.04 | 46.19 | 54.04 | 0.002 | 0.007 | 0.016 | 0.020 | |||
| evm.model.sctg_0109_0001.13 | Hypothetical protein | x | 171.22 | 193.00 | 27.80 | 0.98 | <0.001 | 0.012 | 0.002 | <0.001 | ||
| evm.model.sctg_0197_0006.7 | Siderophore iron transporter | 37.99 | 31.16 | 349.24 | 355.03 | <0.001 | 0.024 | 0.009 | <0.001 | |||
| evm.model.sctg_0037_0001.30 | NADH dehydrogenase 1 α subcomplex | 4.35 | 1.58 | 532.48 | 188.44 | 0.004 | 0.030 | 0.003 | <0.001 | |||
| evm.model.sctg_0416_0001.3 | Hypothetical protein | x | 1.81 | 1.02 | 88.50 | 38.95 | 0.016 | 0.031 | 0.008 | 0.003 | ||
| evm.model.sctg_0005_0005.21 | Glyoxylate dehydrogenase | 7.08 | 5.49 | 55.25 | 33.93 | 0.011 | 0.031 | 0.011 | 0.007 | |||
| evm.model.sctg_0250_0003.8 | MrCAT1 | Mycelial catalase cat1 | x | 211.44 | 808.43 | 68.06 | 29.47 | 0.001 | 0.033 | <0.001 | <0.001 | |
| evm.model.sctg_0089_0002.31 | MrEP23 | Hypothetical protein | 793.47 | 480.95 | 28.63 | 14.98 | 0.010 | 0.036 | 0.006 | 0.001 | ||
Real‐time qRT‐PCR, real‐time quantitative reverse transcription polymerase chain reaction.
Principal coordinate analysis (PCoA) was carried out using RNA‐Seq data for the top 200 expressed genes (Fig. 2A) and genes differentially expressed between CATIE‐R4 (Fig. 2B), CATIE‐R7 (Fig. 2C) and susceptible clones. The three plots showed similar patterns separating tolerant clones from susceptible clones. The largest amount of variation explained by an individual coordinate was 56.06% for coordinate 1 using the CATIE‐R4 differentially expressed genes. The susceptible clones CATIE‐1000 and Pound‐7 were also separated using the CATIE‐R7 differentially expressed genes.
Figure 2.
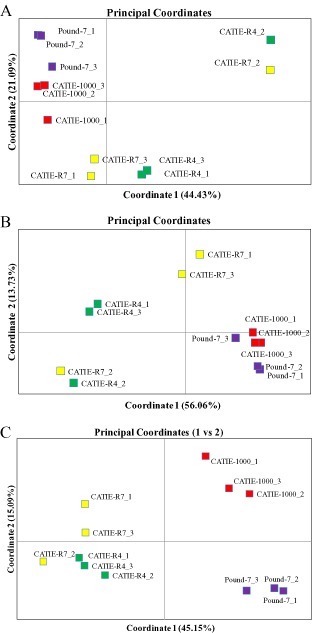
Principal coordinate analysis (PCoA) of RNA‐Seq reads (log10) for three libraries for clones CATIE‐R4, CATIE‐R7, CATIE‐1000 and Pound‐7. (A) Comparisons using the top 200 highly expressed genes based on the mean number of reads averaged over all libraries. (B) Comparisons using genes differentially expressed between CATIE‐R4 and susceptible clones CATIE‐1000 and/or Pound‐7. (C) Comparisons using reads for genes differentially expressed between CATIE‐R7 and susceptible clones CATIE‐1000 and/or Pound‐7.
Real‐time quantitative Reverse Transcription Polymerase Chain Reaction (Real‐time qRT‐PCR) analysis of M. roreri gene expression in susceptible and tolerant cacao clones
Fr and symptoms
After RNA‐Seq, 43 M. roreri genes showing differential expression between tolerant and susceptible clones (Appendix S2, primers used) were chosen for analysis by Real‐time qRT‐PCR to confirm expression in infected pods for tolerant cacao clones UF‐273, CATIE‐R7 and CATIE‐R4 and susceptible clones Pound‐7 and CATIE‐1000. Thirty‐eight of the 43 M. roreri genes studied showed significant correlation (P ≤ 0.05) between RNA‐Seq reads and the Real‐time qRT‐PCR results (Appendix S1, RNA‐Seq and qRT‐PCR Cor). Fr for each pod is presented in Fig. 3, together with symptoms. The use of Fr, an RNA‐based estimate of relative fungal content, was also supported by the significant correlations between fungal DNA content and Fr using MrAct and MrITS as probes (Appendix S1, DNA‐RNA real‐time qRT‐PCR Cor). Increasing Fr was associated with increasing Ch and Nc in clones CATIE‐1000 and Pound‐7 (Fig. 3). This pattern was apparent for clone UF‐273, but not for CATIE‐R7 and CATIE‐R4 (Fig. 3). These observations were supported by the R 2 values obtained when Fr was regressed against pod weight (Wt), Ch and Nc (Table 2). The R 2 for the model containing Nc was highly significant (P ≤ 0.0001) exceeding 0.6 for both CATIE‐1000 and Pound‐7, and for UF‐273 (P ≤ 0.002) with R 2 of 0.397. Nc was less effective in predicting Fr for CATIE‐R7 (R 2 = 0.172) and CATIE‐R4 (R 2 = 0.206).
Figure 3.
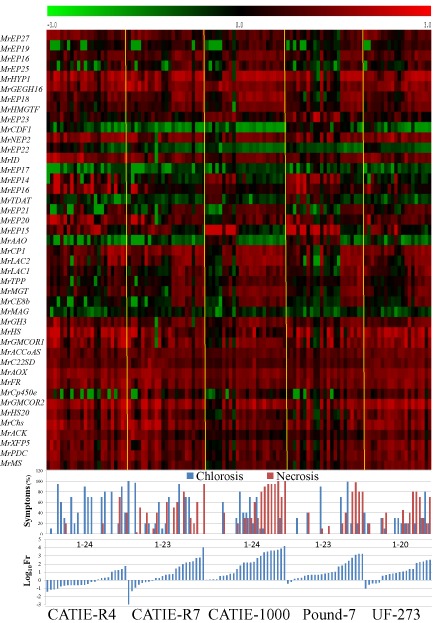
Fungal load (A), pod symptoms (B) and Moniliophthora roreri gene expression levels (C) for 43 M. roreri genes analysed over 114 naturally infected pods representing two susceptible clones (Pound‐7 and CATIE‐1000) and three tolerant clones (UF‐273, CATIE‐R7 and CATIE‐R4). Graphs show relative expression of M. roreri reference genes (Fr, % Theobroma cacao Ref) in each pod, % chlorosis (Ch) and % necrosis (Nc) for each pod, and log10 of M. roreri gene expression (%Pr) for 43 M. roreri genes for each pod.
Table 2.
Linear regression analysis was carried out within each clone using Moniliophthora roreri fungal load (Fr) as the dependent variable with the predictor variables of pod weight (Wt), percentage chlorosis (Ch) and percentage necrosis (Nc)
| Clone | Wt | Nc | Wt–Nc | Ch–Nc | |
|---|---|---|---|---|---|
| CATIE‐R4 | R 2 | 0.206 | |||
| P value | 0.015 | ||||
| CATIE‐1000 | R 2 | 0.822 | 0.849 | 0.859 | |
| P value | <.0001 | <.0001 | <.0001 | ||
| Pound‐7 | R 2 | 0.654 | |||
| P value | <.0001 | ||||
| CATIE‐R7 | R 2 | 0.146 | 0.172 | ||
| P value | 0.041 | 0.028 | |||
| UF‐273 | R 2 | 0.160 | 0.397 | 0.484 | |
| P value | 0.046 | 0.002 | 0.001 |
Linear regression analysis was carried out within each clone using PROC REG in SAS 9.2 (SAS Institute, Raleigh, NC, USA). All significant models (α ≤ 0.05) are presented for each clone for which all individual predictor variables within the regression model are also significant (α ≤ 0.05).
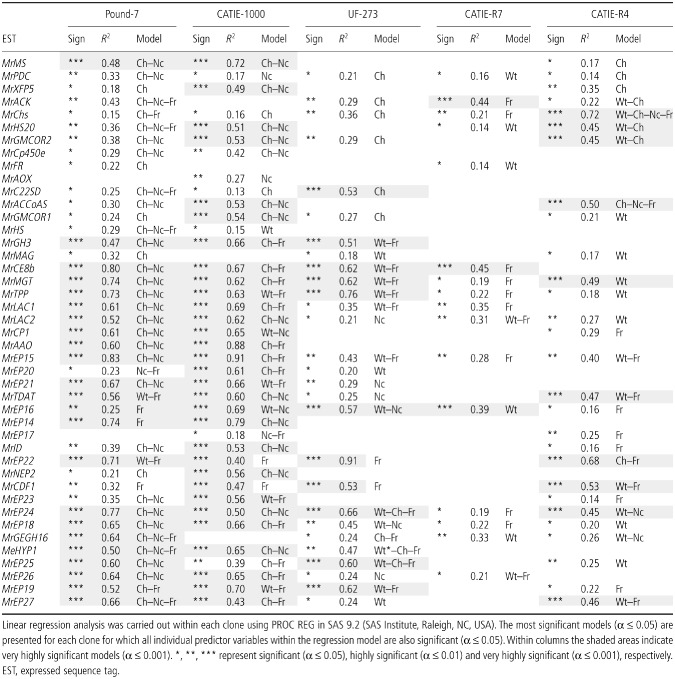
Linear regression analysis: M. roreri gene expression
The independent variables Wt, Ch, Nc and Fr in singular and all combinations were used to predict M. roreri gene expression within a clone. The model with the largest R 2, where all included independent variables were significant, is presented (Table 3). For Pound‐7, 22 M. roreri genes had highly significant models (P ≤ 0.001), with 29 models including Ch and Nc, and 14 models including Fr. CATIE‐1000 had 31 highly significant models (P ≤ 0.001), with 14 models including Ch and Nc, and 18 models including Fr. UF‐273 had 11 highly significant models (P ≤ 0.001), with no models including Ch and Nc, 11 models including Wt and Fr, and 13 models including Fr. CATIE‐R7 had three highly significant models (P ≤ 0.0001), with zero models including Ch and Nc, and 11 models including Fr. CATIE‐R4 had 10 highly significant models (P ≤ 0.0001), with two models including Ch and Nc, 17 models including the independent variable Wt, and 13 models including Fr.
Table 3.
Linear regression analysis was carried out within each clone using M oniliophthora roreri gene expression as the dependent variable with the predictor variables of pod weight (Wt), percentage chlorosis (Ch), percentage necrosis (Nc) and fungal load (Fr)
PCoA of Real‐time qRT‐PCR throughout results
PCoA was also carried out using the Real‐time qRT‐PCR data for 114 pods from five clones (Fig. 4). Plot coordinates 1, 2 and 3 explained 47.08%, 23.20% and 10.71% of the variability, respectively. The malformed green (MG) pods and Ch pods of the five clones are presented in the PCoA plots, together with the Nc pods. In most cases, the pods showing Nc shared a similar distribution regardless of clone. With limited exceptions, the MG pods of the tolerant clones separated from the MG pods of the susceptible clones. Comparing coordinates 1 and 2 (Fig. 4A), the MG pods for the susceptible clones grouped in the lower right quadrant. The MG pods for the tolerant clones were offset across the upper right quadrant towards the left quadrants. Comparing coordinates 1 and 3 (Fig. 4B), the MG pods of the susceptible clones grouped towards the far right of the coordinate 1 axis with the MG pods of the tolerant clones dispersed to the left. Interestingly, CATIE‐R4 and UF‐273 separated from one another in the comparison of coordinates 1 and 3. Comparing coordinates 2 and 3 (Fig. 4C), MG pods of the susceptible clones grouped to the left of the coordinate 2 axis and the MG pods of the tolerant clones were dispersed across the plot to the right with groupings above and below the coordinate 3 axis.
Figure 4.
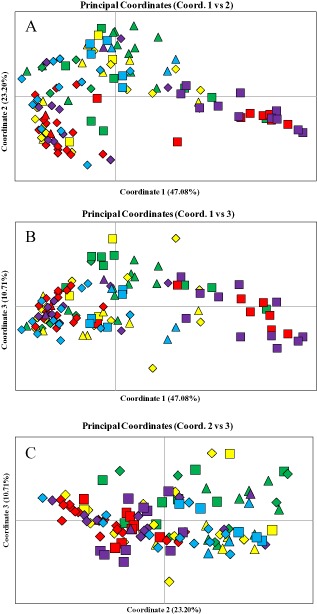
Principal coordinate analysis (PCoA) of real‐time quantitative reverse transcription polymerase chain reaction expression levels for 43 M. roreri genes analysed over 114 naturally infected pods representing susceptible clones Pound‐7 and CATIE‐1000 and tolerant clones UF‐273, CATIE‐R7 and CATIE‐R4. (A) Comparisons between coordinates 1 and 2. (B) Comparisons between coordinates 1 and 3. (C) Comparisons between coordinates 2 and 3. Colours represent Pound‐7 (purple), CATIE‐1000 (red), UF‐273 (blue), CATIE‐R7 (yellow), and CATIE‐R4 (green). Shapes represent malformed green pods (squares), yellow pods with no necrosis (triangles) and necrotic pods (diamonds).
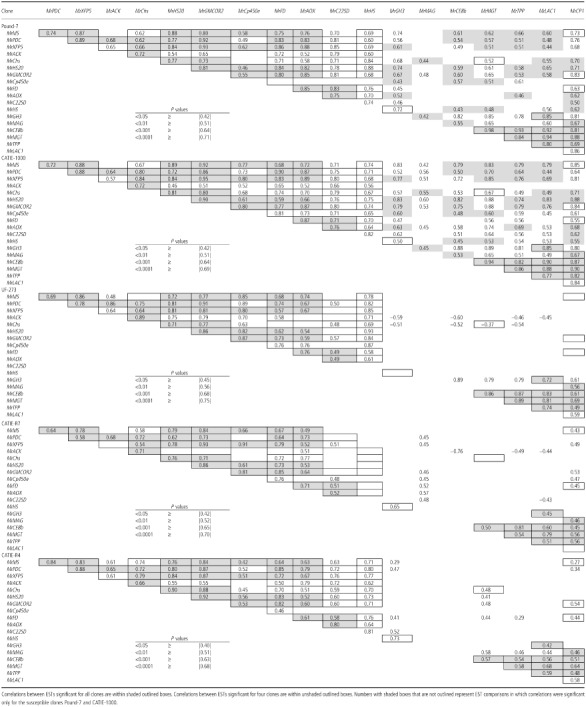
Pearson's correlation analysis
Pearson's correlation analyses were conducted within clones comparing the expression patterns of 43 M. roreri genes analysed by Real‐time qRT‐PCR. A matrix of 19 M. roreri gene pairs is presented (Table 4). The susceptible clones displayed a pattern of significant correlation in most comparisons. Of 170 comparisons, Pound‐7 had 130 significant correlations and CATIE‐1000 had 156 significant correlations. The tolerant clones had 80, 67 and 91 significant correlations for UF‐273, CATIE‐R7 and CATIE‐R4, respectively. There were 44 M. roreri gene pairs with significant correlations for all clones (shaded outlined boxes), 31 M. roreri gene pairs with significant correlations for four clones (unshaded outlined boxes) and 36 comparisons were only significant in the two susceptible clones (shaded not outlined boxes).
Table 4.
Pearson's correlation coefficient (Fisher's Z transformation) was calculated between combinations of the 19 M oniliophthora roreri expressed sequence tags (EST s) within clones to determine the relationship between their expression
Real‐time qRT‐PCR heat maps
Several patterns of expression were observed when the Real‐time qRT‐PCR data were compared with Fr and pod symptoms (Ch, Nc). Most genes showed a significant increase or decrease in expression associated with increasing symptoms and Fr levels that was consistent between susceptible clones (Fig. 3). The patterns diverged when considering the tolerant clones. For example, tolerant clones had a more consistent high level of expression of MrMS, MrFR and MrAOX than the susceptible clones (Fig. 5A, B). Interestingly, the expression of MrMS, MrFR and MrAOX was abnormally high in CATIE‐R7 relative to the susceptible clones only when Fr was low. MrCE8b, MrMGT and MrLAC1 showed an abrupt increase in expression as Fr increased in all clones, except CATIE‐R4 (Fig. 5B, C). MrAAO and MrTDAT were highly expressed in susceptible clones when symptoms and Fr were low, but were almost always expressed at low levels in tolerant clones (Fig. 5D).
Figure 5.
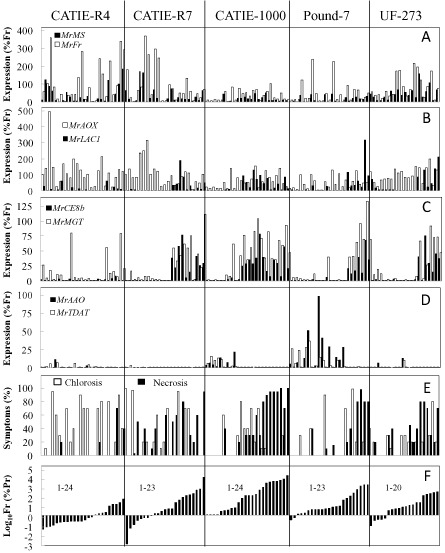
Moniliophthora roreri gene expression levels for MrMS and MrFR (A), MrAOX and MrLAC1 (B), MrCE8b and MrMGT (C) and MrAAO and MrTDAT (D) analysed over 114 naturally infected pods representing susceptible clones Pound‐7 and CATIE‐1000 and tolerant clones UF‐273, CATIE‐R7 and CATIE‐R4. Graphs also show % chlorosis and % necrosis (E) and relative expression for M. roreri reference genes (Fr, %Pr) (F).
Metabolites
Metabolite concentrations were determined for a subset of pods (at least 20 per clone including five or six uninfected) for clones CATIE‐R4, CATIE‐R7, CATIE‐1000 and Pound‐7. Regression identified 13 and 10 metabolites with very significant regression models (P ≤ 0.0001) for Pound‐7 and CATIE‐1000, respectively (Table 5). The highly significant models included one or more of the variables Ch, Nc or Fr. Pearson's correlation analysis identified close correlations between the concentrations of fructose, glucose, sucrose and malic, aconitic and shikimic acids that generally was consistent across all four clones (Table 6). A second group of metabolites showed a less consistent association across clones (oxoglutaric acid, isoleucine, glycine, alanine, valine and leucine). Mannitol concentrations were always correlated with fumaric acid, and trehalose was correlated with mannitol in three of four comparisons. The data are presented for the metabolites mannitol, fructose, fumaric acid, 2‐oxoglutaric acid and alanine (Fig. 6). Mannitol and fumaric acid increased in concentration as disease progressed. Fructose increased in the controls from 30–60 days after pollination (DAP), but decreased as symptoms and Fr increased in infected pods. 2‐Oxoglutaric acid occurred in high concentrations in Pound‐7. Alanine concentrations increased to high levels in the tolerant clones, especially CATIE‐R7.
Table 5.
Linear regression analysis was carried out within each clone using metabolite concentration (ng/mg dry weight) as the dependent variable with the predictor variables of pod weight (Wt), percentage chlorosis (Ch), percentage necrosis (Nc) and fungal load (Fr)
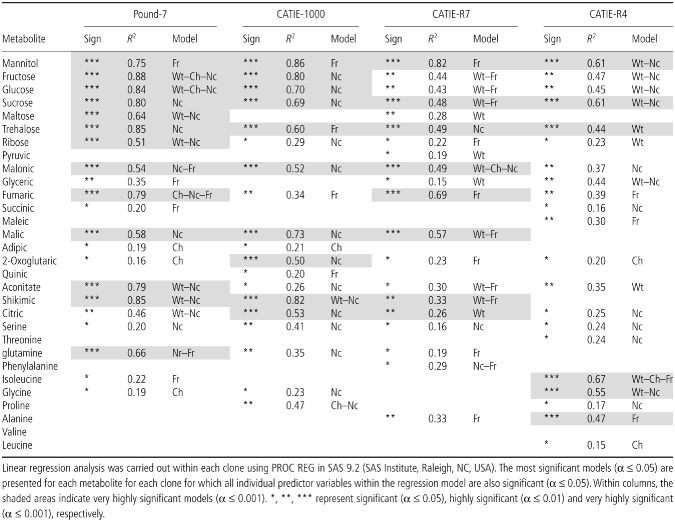
Table 6.
Pearson's correlation coefficient (Fisher's Z transformation) was calculated between all combinations of 20 metabolites within a clone to determine the relationship between the changes in their concentrations
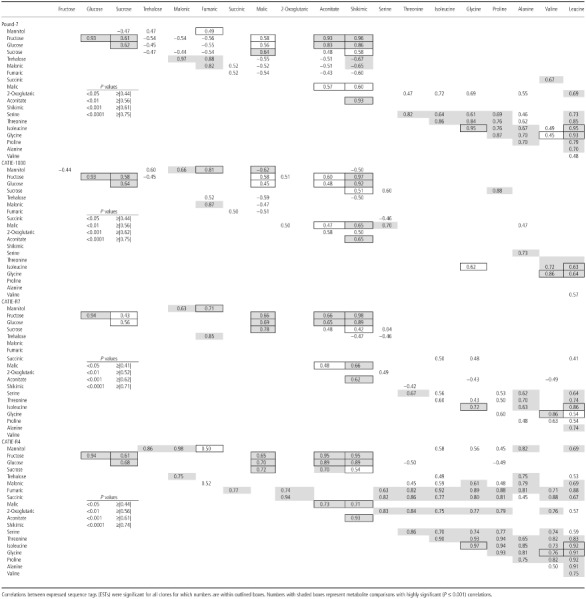
Figure 6.
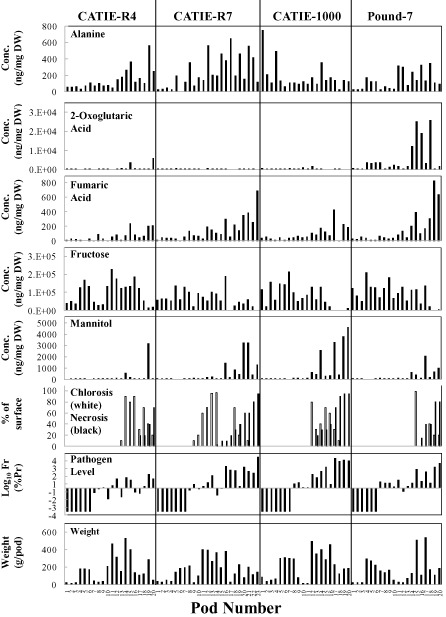
Graphs showing pod weight (g), symptoms (chlorosis and necrosis), fungal load (Fr), and mannitol, fructose, fumaric acid, 2‐oxoglutaric acid and alanine concentrations (ng/mg dry weight) for pods of Pound‐7, CATIE‐1000, CATIE‐R7 and CATIE‐R4.
Discussion
Disease progression in tolerant and susceptible clones
Malformations occur during the biotrophic phase of M. roreri infection before progressing to the necrotrophic phase (Bailey et al., 2013; Evans, 1981). Tolerant clones CATIE‐R4 and CATIE‐R7 show typical FPR symptoms, but Ch in the absence of Nc is also common (Fig. 3). Fr is largely predicted by Nc levels in CATIE‐1000 and Pound‐7, but there is a reduced association between Fr and symptoms in the tolerant clones (Table 2). In clone CATIE‐R4, MG pods often have very low Fr compared with the susceptible clones (Fig. 3). Successful infections of tolerant clones may cause pods to prematurely senesce at low Fr.
Changes in metabolites as a result of M. roreri infection
Quantitative trait locus (QTL) mapping identified linkage groups associated with tolerance to FPR in crosses between UF273 and Pound‐7 (Brown et al., 2007), all originating from UF‐273. Tolerant clones CATIE‐R7 and CATIE‐R4 share UF‐273 as a parent. CATIE‐R4 also has the tolerant clone PA‐169 as a parent. Some M. roreri reactions differ between highly susceptible clones (see MrCDF1 and MrEP16, Fig. 3) and may be a response to the environment encountered in each clone. Metabolites tend to follow similar patterns in all clones. Fructose levels decrease and mannitol levels increase late in infection in all clones. The most unusual observations are the correlations involving organic acids and regression models involving amino acids in CATIE‐R4. The ability of the fungus to alter metabolite concentrations is largely dependent on the amount of fungus present and/or the stress it induces. Most of the infection‐induced metabolite changes have been reported previously (Bailey et al., 2013; Melnick et al., 2012). The accumulation of alanine in the tolerant clones may be a result of the onset of anoxia (Menegus et al., 1989).
Changes in M. roreri gene expression in susceptible and tolerant clones
The Real‐time qRT‐PCR data suggest an orderly disease progression in the susceptible clones CATIE 1000 and Pound 7 (Fig. 3) in association with changes in M. roreri gene expression (Fig. 3). In many cases, regression analysis verifies the association between symptoms, Fr and M. roreri gene expression in the susceptible clones (Table 3), supporting previous results linking changes in M. roreri gene expression with the biotroph/necrotroph shift (Bailey et al., 2013). MrMS expression in susceptible clones is predicted by regression in models including Ch and Nc. MrMS (a putative malate synthase) is associated with the glyoxylate pathway used by fungi to meet carbon requirements, bypassing steps in the citric acid cycle. The glyoxylate cycle is induced during the shift from biotrophy to necrotrophy (Bailey et al., 2013) and can be a critical virulence factor in some interactions (Dunn et al., 2009). The models for MrMS are of reduced significance (R 2 = 0.17) for CATIE‐R4, and insignificant for CATIE‐R7 and UF‐273. These results suggest a disruption in the ordered disease progression when M. roreri attempts to survive the pod environment of tolerant clones.
Tolerant clones are clearly separated from susceptible clones using the global gene expression patterns of the 12 RNA‐Seq datasets. The plot derived from genes differentially expressed between CATIE‐R4 and susceptible clones separates CATIE‐R4 from the susceptible clones, with CATIE‐R7 tending towards the same separation. The plot derived from the differentially expressed genes of CATIE‐R7 closely groups the tolerant clones and separates the susceptible clones from one another. The genes differentially expressed between CATIE‐R7 and the susceptible clones may represent genes uniformly differentially expressed by the tolerant clones, possibly derived from UF‐273, a parent they share.
PCoA comparing individual pod samples across clones suggests that M. roreri behaves differently in MG pods of tolerant clones relative to responses in susceptible clones. In tolerant clones, M. roreri expression is often typical of the necrotrophic stage, despite limited tissue Nc/Ch (Fig. 3). The correlation analysis verifies the dissociation of the ordered progression of gene expression during the infection process in tolerant clones. Among 19 genes, there are two groups of tightly co‐regulated genes. The first group includes MrMs, MrPDC, MrXFP5, MrACK, MrChs, MrHS20, MrGMCOR2, MrCp450e, MrFr, MrAOX and MrC22SD, which are highly expressed regardless of symptom or Fr in the tolerant clones. A relationship between MrMS, MrPDC, MrXFP5 and MrACK has already been proposed (Bailey et al., 2013). MrXFP5 (a putative d‐xylulose 5‐phosphate phosphoketolase) may serve to reverse the flow of acetate kinase (MrACK) towards acetate feeding into the glyoxylate pathway. MrPDC (a putative pyruvate decarboxylase) is potentially involved in the production of acetyl‐CoA through the pyruvate–acetaldehyde–acetate pathway, also contributing to the glyoxylate cycle (Strijbis and Distel, 2010). The second group includes MrGH3, MrCE8b, MrMGT, MrTPP, MrLAC1, MrCP1 and MrLAC2. These genes show a pattern of expression closer to that observed in susceptible clones, being induced as symptoms and Fr increase. These genes encode secreted proteins suggesting changes in the fungal cell wall and in nutrient acquisition strategies. In some comparisons between these two groups, genes show coordinated expression patterns in susceptible clones not found in tolerant clones. Correlation coefficients between MrMS and MrLAC1 are significant (P ≤ 0.001) for Pound‐7 and CATIE‐1000, but not in the tolerant clones. The differential expression patterns of these groups (Fig. 4) probably contribute to the patterns seen in the PCoA plots separating the MG pods of the susceptible and tolerant clones.
Relating RNA‐Seq analysis to Real‐time qRT‐PCR analysis
The RNA‐Seq analysis identified over 800 M. roreri genes as differentially expressed between clones (Appendix S2, Induced). The Real‐time qRT‐PCR analysis indicates that the expression of most genes shifts between MG and Nc pods in the susceptible clones (Fig. 3). This association often results in highly significant predictive models dependent on Wt, Ch, Nc and/or Fr. The coordinated expression among these transcripts (Pearson's correlations) and between these transcripts, Ch, Nc and Fr (regression analysis) is often disrupted in tolerant clones.
Twenty‐three genes (Table 1) showed differential expression between individual tolerant and susceptible clones in all four RNA‐Seq comparisons. The putative functions of the 14 genes up‐regulated in tolerant clones suggest an elite class of stress‐responsive genes, including three small heat shock proteins (sHsps), a sugar transporter, a C6 transcription factor, a siderophore iron transporter, five reductases and three genes with no putative function. Consistently down‐regulated genes include two ich1‐like methyl transferases, a glycine/d‐amino acid oxidase, a cellobiose dehydrogenase, an AIFL‐like pyridine nucleotide‐disulphide oxidoreductase, a catalase and three genes of unknown function. These genes are members of a larger group of related genes that show differential expression between clones (Appendix S2).
Differential gene expression between clones
Potential effector proteins
Effector proteins modify host responses to infection and promote the growth of the microbe (Rafiqi et al., 2012). Effectors are generally secreted proteins functioning in the apoplast or taken up by the host cell, possibly reaching the nucleus (Rafiqi et al., 2012). Effectors are often small (small secreted proteins, SSPs) and cysteine rich (Rafiqi et al., 2012). Six hundred and thirty‐seven of the secreted proteins are 300 amino acids or less in length, 126 having at least eight cysteines (Appendix S2, Secretome). Ninety SSPs are differentially expressed between clones, 44 having no putative function, and 29 having eight or more cysteines. There are a large number of hydrophobins (at least 38) in the M. roreri transcriptome, (Wosten, 2001), which may function as effectors (de Wit et al., 2009). Seven hydrophobins are differentially expressed between clones (see MrHYP1 in Fig. 3). Other potential effectors showing differential expression include pathogenesis‐related‐1 (PR‐1)‐like proteins (Teixeira et al., 2012), ceratoplatinins (Barsottini et al., 2013; see MrCP1 in Fig. 3), and necrosis and ethylene‐inducing peptide 1 (NEP1)‐like proteins (de Jonge and Thomma, 2009; see MrNEP2 in Fig. 3).
Transcription factors
Several putative transcription factors (Appendix S2, Transcription) are up‐regulated in the tolerant clones: HMG domain, BZip domain, C2H2 zinc finger and C6 transcription factors (Shelest, 2008). At least four members of the HMG domain MATA‐type transcription factor family show induction in the tolerant clones. In the Real‐time qRT‐PCR analysis, MrHMGTF, a MATA‐type transcription factor, shows partial induction in the tolerant clones prior to pathogen buildup. MrHMGTF is induced during the M. roreri biotrophic/necrotrophic shift (Bailey et al., 2013). Four genes encoding C6 transcription factors show induction in the tolerant clones. In the future, it may be possible to connect the differential expression patterns of C6 transcription factors (zinc finger proteins) with the specific genes and processes they regulate (MacPherson et al., 2006).
sHsps
Three sHsps are induced in tolerant clones and six sHsps are induced in CATIE‐R4 (Appendix S2, sHsp). MrHS20 and MrHS are highly expressed in the tolerant clones, expressed at low levels in CATIE‐1000 and increase in Pound‐7 late in infection (Fig. 3). sHsps are generally active as large oligomers, preventing protein aggregation and aiding refolding (Haslbeck et al., 2005). Mammalian sHsps protect cells from oxidative stress, among other processes (Haslbeck et al., 2005). Less is known about fungal sHsps, although they are induced by heat and various stresses (Chagué et al., 2006).
Alternative oxidase
An alternative oxidase gene (MrAOX) is induced early in tolerant clones (Fig. 3). AOX is a mitochondrial electron transport alternative oxidase insensitive to nitric oxide and can be induced by reactive oxygen (Joseph‐Horne et al., 2001). Nitric oxide is a component of plant defense, including the hypersensitive response (Joseph‐Horne et al., 2001). Thomazella et al. (2012) observed elevated AOX transcripts in the biotrophic phase of Moniliophthora perniciosa, but MrAOX is induced in the necrotrophic phase of FPR.
Transporters
A large number of transporter‐like genes are differentially expressed: carboxylate and sugar transporters, peptide and amino acid permeases, and drug transporters [ATP‐binding cassette (ABC) and major facilitator superfamily (MFS) type] (Appendix S2, Transporters). Carboxylate/monocarboxylate transporters are required for the use of alternative carbon sources, such as acetate, lactate and pyruvate, as substrates for carbon assimilation (Casal et al., 2008). An extracellular invertase gene is expressed in both tolerant and susceptible clones. The combination of extracellular invertases with hexose transporters has been observed in other hemibiotrophic fungi as an efficient way of using host sucrose (Münch et al., 2008). Increased symptoms of FPR are associated with decreased sucrose and fructose levels.
Peptide/amino acid transporters/permeases show differential regulation between susceptible and tolerant clones in the RNA‐Seq analysis. Substrate specificities of peptide/amino acid transporters/permeases vary (Wipf et al., 2002). The pathogen is probably secreting peptidases/proteases (Appendix S2, Peptide Digestion), targeting plant peptide degradation.
At least eight MFS‐multidrug‐resistance transporters are differentially expressed between tolerant and susceptible clones. An ABC transporter is also induced in tolerant clones. Members of ABC and MFS transporter families can be critical virulence factors via the management of fungal metabolites toxic to plants and through the efflux of antifungal plant metabolites (Del Sorbo et al., 2000).
Reductases
Three glucose–methanol–choline (GMC)‐oxidoreductases are induced in the tolerant clones (Appendix S2, Reduction Oxidation). GMC‐oxidoreductases catalyse a diverse range of reactions (Zámocký et al., 2004). MrGMCOR2 shows close correlation with the MrMS/MrXFP expression group, and expression in tolerant clones is elevated at low Fr. A group of cytochrome p450 monooxygenases is differentially expressed between tolerant and susceptible clones. Cytochrome p450 monooxygenases participate in sterol biosynthesis, degradation of lignin and breakdown of environmental contaminants (van den Brink et al., 1998), processes probably altered in the interaction between tolerant and susceptible clones.
Many short dehydrogenase/reductases (SDR) and other reductases are differentially expressed. SDRs are involved in the synthesis and breakdown of metabolites, such as fatty acids, amino acids, polyketides, sugars and steroids/sterols (Mannhaupt et al., 2003). Mannitol‐1‐phosphate dehydrogenase (up‐regulated in tolerant clones) converts fructose‐6‐phosphate to mannitol‐1‐phosphate, leading to mannitol production (Solomon et al., 2007). Mannitol accumulates with the onset of Nc.
Up‐regulation of malate dehydrogenase in the tolerant clones may be related to a shift between the tricarboxylic acid (TCA) and glyoxylate cycles (Lorenz and Fink, 2001). Two unique reductases, a ferric‐chelate reductase and a fumarate reductase, are induced in the tolerant clones. Microorganisms secrete siderophores which chelate ferric iron prior to transport (Lesuisse et al., 1990). A putative MFS‐type siderophore iron transporter is differentially expressed in the tolerant clones (RNA‐Seq). Some microorganisms reduce the iron to Fe(ii) using ferric‐chelate reductase once the iron enters the cell, resulting in siderophore release. Real‐time qRT‐PCR analysis verifies that the putative fumarate reductase gene is expressed at higher levels in tolerant clones (Fig. 5). Fumarate reductase catalyses the conversion of fumarate to succinate. Enomoto et al. (2002) have suggested that fumarate reductase is required under anaerobic conditions to re‐oxidize the reduced form of nicotinamide adenine dinucleotide (NADH), a possible link to the observed fumaric acid accumulation and differential expression of MrAOX in the tolerant clones.
Modifications of fungal and plant membranes and cell walls
Genes required for the synthesis of ergosterols are induced in CATIE‐R4 in the RNA‐Seq analysis (Appendix S2, Membrane and Cell Wall): sterol C‐14 reductase, C‐4 methyl sterol oxidase, sterol C‐24 methyltransferase, sterol C‐8 isomerase, sterol C‐5 desaturase and sterol C‐22 desaturase (Lees et al., 1995). Sterols, components of plant and fungal membranes, are important in fungal development and have been implicated in stress responses. Swan and Watson (1998) have observed that high ergosterol concentrations correlate with increased viability after exposure to heat and ethanol in Saccharomyces cerevisiae.
In CATIE‐R4, three hydrophobin genes are up‐regulated and two are down‐regulated. Hydrophobins, wall structural proteins, mediate interactions with the environment (Linder et al., 2005). Regression models tested for MrHYP1 are significant for the susceptible clones and UF‐273, but not for CATIE‐R4 and CATIE‐R7 (Table 3). MrHYP1 is expressed at low levels early in infection in the susceptible clones and UF‐273, and at higher levels in CATIE‐R7 and CATIE‐R4, suggesting a change in wall structure.
Chitin and chitosan are fungal cell wall components (El Gueddari et al., 2002). Putative chitin synthases and deacetylases show increased expression in tolerant clones (RNA‐Seq). Real‐time qRT‐PCR verifies that tolerant clones show high expression of putative chitin synthase MrChs (Fig. 3). El Gueddari et al. (2002) have suggested that fungi modify the chitin in their walls to chitosan to limit the activity of plant chitinases, thus reducing plant defense. The fungus may also down‐regulate its own chitinases, as four M. roreri type II chitinases are down‐regulated in CATIE‐R4.
Several laccases are differentially expressed in CATIE‐R4 (RNA‐Seq). In CATIE‐R4 (Real‐time qRT‐PCR), MrLAC1 (Fig. 5) fails to show the typical shift in expression observed in other clones in association with the biotroph/necrotroph shift. Laccases are involved in lignin breakdown by the fungus, but also function in the deposition of pigments in the fungal wall (Singh and Chen, 2008). A secreted glucose oxidase is also induced in the tolerant clones (Appendix S2, Reduction and Oxidation), but other enzymes supporting lignin degradation are not differentially expressed (Hatakka, 1994).
Although M. roreri genes targeting pectin, cellulose and xylan show differential expression between tolerant and susceptible clones in the RNA‐Seq analysis, some members are up‐regulated and others are down‐regulated. Complex stage‐specific regulation of genes targeting plant cell walls during the biotroph/necrotroph shift has also been observed in hemibiotrophic Colletotrichum species (Gan et al., 2013). 1,4‐β‐d‐Glucan cellobiohydrolase cleaves cellobiosyl units from the nonreducing end of cellulose chains (Zeilinger et al., 1998). Two putative 1,4‐β‐d‐glucan cellobiohydrolases are up‐regulated early in the infection of CATIE‐R4 and a third is down‐regulated. A putative xylanase is up‐regulated and two xylanases are down‐regulated. Xylans are hemicelluloses found in the plant cell wall (Polizeli et al., 2005). Genes targeting other hemicelluloses (mannans, glucans, arabinans and galactans) show differential expression between clones. Genes encoding enzymes targeting pectin (d‐galacturonic acid reductase, endo‐ and exo‐polygalacturonase, and pectin methylesterase) show differential expression depending on the clone. Pectin is a major component of cacao pods (Adomako, 1972). Real‐time qRT‐PCR verifies that MrCE8b (putative pectin methylesterase) and MrGH3 (putative β‐glucosidase) are differentially expressed. MrCE8b is induced during the shift from biotroph to necrotroph in all clones except CATIE‐R4.
Conclusions
Successful infections of tolerant clones by M. roreri result in a disassociation between typical progressive fungal colonization patterns, disease symptom development and fungal gene expression as observed during infections of susceptible clones. In tolerant clones, disease symptoms occur at low Fr and include Ch in the absence of Nc, a rare occurrence in susceptible clones. These reactions leave M. roreri in a poor position to exploit nutrients released as tissues senesce. Pod metabolites change as disease progresses, but few changes are associated with tolerance. Infection of tolerant clones elicits specific M. roreri responses to the unfavourable environment, including changes in metabolism and the induction of fungal stress responses designed to mitigate plant defense mechanisms. The M. roreri genes differentially expressed between tolerant and susceptible clones are candidates for functional analysis with regard to their contribution to the overcoming of cacao defense mechanisms by M. roreri.
Experimental Procedures
Artificial inoculation of five clones of cocoa with M. roreri
Three tolerant clones and two susceptible clones were selected for study. The susceptible clones were Pound‐7 and CATIE‐1000. The tolerant clones were UF‐273 type 1, CATIE‐R7 (an offspring of UF‐273 × CATIE‐1000) and CATIE‐R4 (an offspring of UF‐273 × PA‐169). The trees were located at the CATIE field station, La Lola, near Siquirres, Costa Rica. Eighty pods for each clone were hand pollinated in 2009/2010 with 40 pods being artificially inoculated at 2 months of age (Bailey et al., 2013). Artificial inoculation was inefficient for the tolerant clones. As a result, only uninoculated pods harvested at 60 and 90 DAP (five to six pods per clone per time point) were used.
Harvesting of pods showing symptoms of FPR as a result of natural infection
In 2010, monthly visits (July to November) were made to the clonal plots described above and pods of five clones (CATIE‐1000, Pound‐7, UF‐273 type 1, CATIE‐R7 and CATIE‐R4) showing symptoms of infection were harvested. Pods showing a range of symptoms (malformed, chlorotic, malformed and chlorotic, and necrotic) were harvested for each clone. The pods were transported to the laboratory, weighed, photographed and placed in liquid nitrogen for 10 min. The pods were lyophilized for 48–72 h and vacuum sealed in plastic bags for shipping to Beltsville, MD, USA.
RNA extraction
Pods were coarsely ground under liquid nitrogen, and approximately 1 cm3 of sample was used for processing. The pod material was ground finely and transferred to a 50‐mL centrifuge tube containing 15 mL of 65 °C extraction buffer (Bailey et al., 2005). Additional extraction methods were conducted as in Bailey et al. (2013). cDNA was synthesized using the Invitrogen Superscript VILO kit (Carlsbad, CA, USA), following the manufacturer's directions.
Expression analysis using RNA‐Seq and Real‐time qRT‐PCR
Procedures for Real‐time qRT‐PCR and analysis are as described by Bailey et al. (2013). The amount of M. roreri Ref transcript, a proxy for Fr in each sample, was estimated relative to the expression of three cacao Refs (Pr). Fr in each sample was calculated by comparing the expression of three M. roreri Refs (MrACT, MrGADPH and MrUBQ) with the expression of three cacao Refs (TcACT, TcACP and TcEF1α). The geometric mean (Vandesompele et al., 2002) (C T●Pr) was calculated for the cycle times of three cacao Refs. ΔC T was calculated for each M. roreri Ref [ΔC T = (C T●Pr) – (C T●Mr Fr(1–3))]. The expression levels for each of the three M. roreri Refs in each sample were calculated as %Pr = 100 × [(E)ΔCT], where E is the primer efficiency for each M. roreri Ref. Fr was estimated as the geometric mean of the expression levels of the three M. roreri Refs (%Pr).
RNA samples from infected pods of susceptible (Pound‐7 and CATIE‐1000) and tolerant (CATIE‐R4 and CATIE‐R7) clones were selected for RNA‐Seq analysis carried out by the National Center for Genome Resources (Santa Fe, NM, USA). There were three replicate samples per clone. The cDNA was generated using an RNA library preparation TruSeq protocol developed by Illumina Technologies (San Diego, CA, USA). The mRNA was first isolated from total RNA by polyA selection, and single‐end sequencing libraries were constructed with an insert size of 160 bp. Single‐end sequencing was performed using the Illumina HiSeq platform. Samples were multiplexed with six‐mer barcodes, generating 720 170 543 filtered 1 × 50‐bp read pairs. The sequences were verified with regard to source by comparison with the M. roreri genome [National Center for Biotechnology Information (NCBI) BioProject PRJNA213737; http://www.ncbi.nlm.nih.gov/bioproject/213737] and the T. cacao genome (http://cocoagendb.cirad.fr/). RNA reads from RNA‐Seq libraries, ranging from 50 to 70 million reads in fastq format, were aligned using memory‐efficient short‐read aligner Bowtie‐0.12.7 (Langmead et al., 2009) to the coding sequences of the M. roreri genome and the coding sequences of the T. cacao genome (Argout et al., 2010). Tabulated raw counts of reads to each CDS were obtained from the Bowtie alignment. Estimation and statistical analysis of the expression level using gene count data with three replicates for each library were performed using the DEseq package (Anders and Huber, 2010) and R×64 2.15.2 program (http://www.r‐project.org/).
Moniliophthora roreri genes (43) were chosen for analysis by Real‐time qRT‐PCR across all infected pods based on their differential expression patterns, Kyoto Encyclopedia of Genes and Genomes (KEGG) and Gene Ontology (GO) analysis (Appendix S3, see Supporting Information) and putative ID (Appendix S2). The M. roreri genes (Appendix S2, primers used) were chosen based on the putative function and differential expression between tolerant and susceptible clones. To obtain relative transcript levels, the threshold cycle (C T) values for the genes of interest (C T●GOI) were normalized to the C T values (geometric mean) of the three M. roreri Refs (MrACT, MrGADPH and MrUBQ, C T●Fr) for each sample [ΔC T = (C T●Fr) – (C T●GOI)]. The expression levels for each M. roreri gene in each sample were calculated as %Fr = 100 × [(E)ΔCT], where E is the primer efficiency.
Metabolite analysis
Metabolites were measured for healthy pods at 60 and 90 DAP (three to four pods per clone per harvest time) and for at least 15 naturally infected pods for clones Pound‐7, CATIE‐1000, CATIE‐R7 and CATIE‐R4. Wt was used as a proxy for age in the naturally infected pods by comparison with the healthy pods of known age. Infected pods showing extremely low (Fr < 0.03%Pr) or high (Fr > 11.00%Pr) Fr were not included. Extractions were conducted using the methodology in Melnick et al. (2012). Freeze–dried tissue was ground to a powder (50 mg dry weight) in liquid nitrogen and extracted at 4 °C with 1.4 mL methanol in a ground glass homogenizer. A mixture of 45 μL of internal standards, containing 62.5 nmol of α‐aminobutyric acid and 26 μmol of ribitol, was injected prior to homogenization. The homogenates were collected, incubated at 70 °C in an H2O bath for 15 min, and diluted with an equal volume of deionized H2O. The aqueous methanol extracts were centrifuged for 15 min at 5800 g. The supernatants were transferred to fresh tubes and stored for up to 2 weeks at 20 °C. Amino acids, organic acids and soluble carbohydrates were quantified by gas chromatography coupled to mass spectrometry using known concentrations of chemical standards.
Statistical analysis
Relative M. roreri gene expression (%Fr and Fr expressed as %Pr) and metabolite dry weight (ng/mg) were log‐transformed to linearize the data (Rieu and Powers, 2009). Linear regression analysis was carried out within each clone using PROC REG in SAS 9.2 (SAS Institute, Raleigh, NC, USA). Predictor variables were Wt, %Ch, %Nc and relative M. roreri Ref expression (Fr), and the dependent variable was the relative expression of a specific M. roreri gene. The most highly significant models (P‐adjusted ≤ 0.05), where all included predictors are significant (P ≤ 0.05), are presented. A heat map of the relative expression of the individual M. roreri genes was created using TIGR MultiExperiment Viewer (MeV) (Saeed et al., 2003). Fr (%Pr) was also regressed against Wt, %Ch and %Nc.
Correlations within a clone between the expression of the 43 M. roreri genes (log10 %Fr) and between metabolite concentrations (log10 dry weight) were calculated using Pearson's correlation statistic (Fisher's Z transformation) employing PROC CORR in SAS 9.2. In examining the relationship between M. roreri gene expression patterns among clones, PROC DISTANCE of SAS 9.2 was used to calculate the Euclidean distance between gene pairs. PCoA was performed using GenAlEx 6.1 with the distance matrix of gene expression as log10 %Fr and the option of adjusting the covariance to represent trends in gene expression through low‐dimensional projection of high‐dimensional data (Katagari and Glazebrook, 2009).
Acknowledgements
This work was funded by the US Department of Agriculture Agricultural Research Service (USDA‐ARS). References to a company and/or product by the USDA are only for the purposes of information and do not imply approval or recommendation of the product to the exclusion of others that may also be suitable. USDA is an equal opportunity provider and employer.
Supporting information
Appendix S1 Library statistics and correlations.
Appendix S2 RNA‐Seq analysis.
Appendix S3 Gene Ontology (GO) and Kyoto Encyclopedia of Genes and Genomes (KEGG) analysis.
References
- Adomako, D. (1972) Cocoa pod husk pectin. Phytochemistry, 11, 1145–1148. [Google Scholar]
- Ali, S.S. , Melnick, R.L. , Crozier, J. , Philips‐Mora, W. , Strem, M.D. , Shao, J. , Zhang, D. , Sicher, R. , Meinhardt, L. and Bailey, B.A. (2014) Successful pod infections by Moniliophthora roreri result in differential Theobroma cacao gene expression depending on the clone's level of tolerance. Mol. Plant Pathol. Accepted article, DOI: 10.1111/mpp.12126. [DOI] [PMC free article] [PubMed] [Google Scholar]
- Anders, S. and Huber, W. (2010) Differential expression analysis for sequence count data. Genome Biol. 11, 1–12. [DOI] [PMC free article] [PubMed] [Google Scholar]
- Argout, X. , Salse, J. , Aury, J. , Guiltinan, M. , Droc, G. , Gouzy, J. , Allegre, M. , Chaparro, C. , Legavre, T. and Maximova, S. (2010) The genome of Theobroma cacao . Nat. Genet. 43, 101–108. [DOI] [PubMed] [Google Scholar]
- Bailey, B.A. , Bae, H. , Strem, M.D. , Antúnez de Mayolo, G. , Guiltinan, M.J. , Verica, J.A. , Maximova, S.N. and Bowers, J.H. (2005) Developmental expression of stress response genes in Theobroma cacao leaves and their repsonse to Nep1 treatment and a compatible infection by Phytophthora megakarya . Plant Physiolol. Biochem. 43, 611–622. [DOI] [PubMed] [Google Scholar]
- Bailey, B.A. , Crozier, J. , Sicher, R.C. , Strem, M.D. , Melnick, R. , Carazzoll, M.F. , Costa, G.G.L. , Pereira, G.A.G. , Zhang, D. , Maximova, S. , Guiltinan, M. and Meinhardt, L. (2013) Dynamic changes in pod and fungal physiology associated with the shift from biotrophy to necrotrophy during the infection of Theobroma cacao by Moniliophthora roreri . Physiol. Mol. Plant Pathol. 81, 84–96. [Google Scholar]
- Barsottini, M.R. , de Oliveira, J.F. , Adamoski, D. , Teixeira, P.J.P.L. , do Prado, P.F.V. , Tiezzi, H.O. , Sforça, M.L. , Cassago, A. , Portugal, R.V. , de Oliveira, P.S.L. , de Mattos Zeri, A.C. , Dias, S.M.G. , Pereira, G.A.G. and Ambrosio, A.L.B. (2013) Functional diversification of cerato‐platanins in Moniliophthora perniciosa as seen by differential expression and protein function specialization. Mol. Plant–Microbe Interact. 26, 1281–1293. [DOI] [PubMed] [Google Scholar]
- van den Brink, H.M. , van Gorcom, R.F.M. , van den Hondel, C.A.M.J.J. and Punt, P.J. (1998) Cytochrome P450 enzyme systems in fungi. Fungal Genet. Biol. 23, 1–17. [DOI] [PubMed] [Google Scholar]
- Brown, J.S. , Phillips‐Mora, W. , Power, E.J. , Krol, C. , Cervantes‐Martinez, C. , Motamayor, J.C. and Schnell, R.J. (2007) Mapping QTLs for resistance to frosty pod and black pod diseases and horticultural traits in Theobroma cacao L. Crop Sci. 47, 1851–1858. [Google Scholar]
- Casal, M. , Paiva, S. , Queirós, O. and Soares‐Silva, I. (2008) Transport of carboxylic acids in yeasts. FEMS Microbiol. Rev. 32, 974–994. [DOI] [PubMed] [Google Scholar]
- Chagué, V. , Danit, L.‐V. , Siewers, V. , Gronover, C.S. , Tudzynski, P. , Tudzynski, B. and Sharon, A. (2006) Ethylene sensing and gene activation in Botrytis cinerea: a missing link in ethylene regulation of fungus–plant interactions? Mol. Plant–Microbe Interact. 19, 33–42. [DOI] [PubMed] [Google Scholar]
- Del Sorbo, G. , Schoonbeek, H. and De Waard, M.A. (2000) Fungal transporters involved in efflux of natural toxic compounds and fungicides. Fungal Genet. Biol. 30, 1–15. [DOI] [PubMed] [Google Scholar]
- Dunn, M.F. , Ramírez‐Trujillo, J.A. and Hernández‐Lucas, I. (2009) Major roles of isocitrate lyase and malate synthase in bacterial and fungal pathogenesis. Microbiology, 155, 3166–3175. [DOI] [PubMed] [Google Scholar]
- El Gueddari, N.E. , Rauchhaus, U. , Moerschbacher, B.M. and Deising, H.B. (2002) Developmentally regulated conversion of surface‐exposed chitin to chitosan in cell walls of plant pathogenic fungi. New Phytol. 156, 103–112. [Google Scholar]
- Enomoto, K. , Arikawa, Y. and Muratsubaki, H. (2002) Physiological role of soluble fumarate reductase in redox balancing during anaerobiosis in Saccharomyces cerevisiae . FEMS Microbiol. Lett. 215, 103–108. [DOI] [PubMed] [Google Scholar]
- Evans, H. (1981) Witches’ broom disease—a case study. Cocoa Growers Bull. 32, 5–19. [Google Scholar]
- Evans, H.C. (2007) Cacao diseases—the trilogy revisited. Phytopathology, 97, 1640–1643. [DOI] [PubMed] [Google Scholar]
- Evans, H.C. , Holmes, K.A. , Phillips, W. and Wilkinson, M.J. (2002) What's in a name: Crinipellis, the final resting place for the frosty pod rot pathogen of cocoa? Mycologist, 16, 148–152. [Google Scholar]
- Gan, P. , Ikeda, K. , Irieda, H. , Narusaka, M. , O'Connell, R.J. , Narusaka, Y. , Takano, Y. , Kubo, Y. and Shirasu, K. (2013) Comparative genomic and transcriptomic analyses reveal the hemibiotrophic stage shift of Colletotrichum fungi. New Phytol. 197, 1236–1249. [DOI] [PubMed] [Google Scholar]
- Haslbeck, M. , Miess, A. , Stromer, T. , Walter, S. and Buchner, J. (2005) Disassembling protein aggregates in the yeast cytosol: the cooperation of HSP26 with SSA1 and HSP104. J. Biol. Chem. 280, 23 861–23 868. [DOI] [PubMed] [Google Scholar]
- Hatakka, A. (1994) Lignin‐modifying enzymes from selected white‐rot fungi: production and role in lignin degradation. FEMS Microbiol. Rev. 13, 125–135. [Google Scholar]
- de Jonge, R. and Thomma, B.P.H. (2009) Fungal LysM effectors: extinguishers of host immunity? Trends Microbiol. 17, 151–157. [DOI] [PubMed] [Google Scholar]
- Joseph‐Horne, T. , Hollomon, D.W. and Wood, P.M. (2001) Fungal respiration: a fusion of standard and alternative components. Biochim. Biophys. Acta, 1504, 179–195. [DOI] [PubMed] [Google Scholar]
- Katagari, F. and Glazebrook, J. (2009) Pattern discovery in expression profiling data. Curr. Prot. Mol. Biol. 85(Supp.), 22.5.1–22.5.15. [DOI] [PubMed] [Google Scholar]
- Langmead, B. , Trapnell, C. , Pop, M. and Salzberg, S. (2009) Ultrafast and memory‐efficient alignment of short DNA sequences to the human genome. Genome Biol. 10, 1–10. [DOI] [PMC free article] [PubMed] [Google Scholar]
- Lees, N.D. , Skaggs, B. , Kirsch, D.R. and Bard, M. (1995) Cloning of the late genes in the ergosterol biosynthetic pathway of Saccharomyces cerevisiae—a review. Lipids, 30, 221–226. [DOI] [PubMed] [Google Scholar]
- Lesuisse, E. , Crichton, R.R. and Labbe, P. (1990) Iron‐reductases in the yeast Saccharomyces cerevisiae . Biochim. Biophys. Acta, 1038, 253–259. [DOI] [PubMed] [Google Scholar]
- Linder, M.B. , Szilvay, G.R. , Nakari‐Setälä, T. and Penttilä, M. (2005) Hydrophobins: the protein‐amphiphiles of filamentous fungi. FEMS Microbiol. Rev. 29, 877–896. [DOI] [PubMed] [Google Scholar]
- Lorenz, M.C. and Fink, G.R. (2001) The glyoxylate cycle is required for fungal virulence. Nature, 412, 83–86. [DOI] [PubMed] [Google Scholar]
- MacPherson, S. , Larochelle, M. and Turcotte, B. (2006) A fungal family of transcriptional regulators: the zinc cluster proteins. Microbiol. Mol. Biol. Rev. 70, 583–604. [DOI] [PMC free article] [PubMed] [Google Scholar]
- Mannhaupt, G. , Montrone, C. , Haase, D. , Mewes, H.W. , Aign, V. , Hoheisel, J.D. , Fartmann, B. , Nyakatura, G. , Kempken, F. , Maier, J. and Schulte, U. (2003) What's in the genome of a filamentous fungus? Analysis of the Neurospora genome sequence. Nucleic Acids Res. 31, 1944–1954. [DOI] [PMC free article] [PubMed] [Google Scholar]
- Meinhardt, L.W. , Bellato, C.M. , Rincones, J. , Azevedo, R.A. , Cascardo, J.C.M. and Pereira, G.A.G. (2006) In vitro production of biotrophic‐like cultures of Crinipellis perniciosa, the casual agent of witches’ broom disease of Theobroma cacao . Curr. Microbiol. 52, 191–196. [DOI] [PubMed] [Google Scholar]
- Melnick, R.L. , Marelli, J.‐P. , Sicher, R.C. , Strem, M.D. and Bailey, B.A. (2012) The interaction of Theobroma cacao and Moniliophthora perniciosa, the causal agent of witches’ broom disease, during parthenocarpy. Tree Genet. Genomes, 8, 1261–1279. [Google Scholar]
- Menegus, F. , Cattaruzza, L. , Chersi, A. and Fronza, G. (1989) Differences in the anaerobic lactate‐succinate production and in the changes of cell sap pH for plants with high and low resistance to anoxia. Plant Physiol. 90, 29–32. [DOI] [PMC free article] [PubMed] [Google Scholar]
- Mondego, J. , Carazzolle, M. , Costa, G. , Formighieri, E. , Parizzi, L. , Rincones, J. , Cotomacci, C. , Carraro, D. , Cunha, A. , Carrer, H. , Vidal, R. , Estrela, R. , Garcia, O. , Thomazella, D. , de Oliveira, B. , Pires, A. , Rio, M. , Araujo, M. , de Moraes, M. , Castro, L. , Gramacho, K. , Goncalves, M. , Neto, J. , Neto, A. , Barbosa, L. , Guiltinan, M. , Bailey, B. , Meinhardt, L. , Cascardo, J. and Pereira, G. (2008) A genome survey of Moniliophthora perniciosa gives new insights into Witches’ Broom Disease of cacao. BMC Genomics, 9, 548. [DOI] [PMC free article] [PubMed] [Google Scholar]
- Münch, S. , Lingner, U. , Floss, D.S. , Ludwig, N. , Sauer, N. and Deising, H. (2008) The hemibiotrophic lifestyle of Colletotrichum species. J. Plant Physiol. 165, 41–51. [DOI] [PubMed] [Google Scholar]
- Phillips‐Mora, W. (2010) Plant and Animal Genome Conference In: Plant & Animal Genome XVIII Conference, p. 115 San Diego, CA: Scherago Inc. [Google Scholar]
- Phillips‐Mora, W. and Wilkinson, M. (2007) Frosty pod of cacao: a disease with a limited geographic range but unlimited potential for damage. Phytopathology, 97, 1644–1647. [DOI] [PubMed] [Google Scholar]
- Phillips‐Mora, W. , Arciniegas‐Leal, A. , Mata‐Quiros, A. and Motamayor‐Arias, J.C. (2012) Catalogo de clones de cacao: seleccionados por el CATIE para siembras comerciales. Turrialba: CATIE. [Google Scholar]
- Polizeli, M.L.T. , Rizzatti, A.C.S. , Monti, R. , Terenzi, H.F. , Jorge, J.A. and Amorim, D.S. (2005) Xylanases from fungi: properties and industrial applications. Appl. Microbiol. Biotechnol. 67, 577–591. [DOI] [PubMed] [Google Scholar]
- Rafiqi, M. , Ellis, J.G. , Ludowici, V.A. , Hardham, A.R. and Dodds, P.N. (2012) Challenges and progress towards understanding the role of effectors in plant–fungal interactions. Curr. Opin. Plant Biol. 15, 477–482. [DOI] [PubMed] [Google Scholar]
- Rieu, I. and Powers, S.J. (2009) Real‐time quantitative RT‐PCR: design, calculations, and statistics. Plant Cell, 21, 1031–1033. [DOI] [PMC free article] [PubMed] [Google Scholar]
- Saeed, A. , Sharov, V. , White, J. , Li, J. , Liang, W. , Bhagabati, N. , Braisted, J. , Klapa, M. , Currier, T. , Thiagarajan, M. , Sturn, A. , Snuffin, M. , Rezantsev, A. , Popov, D. , Ryltsov, A. , Kostukovich, E. , Borisovsky, I. , Liu, Z. , Vinsavich, A. , Trush, V. and Quackenbush, J. (2003) TM4: a free, open‐source system for microarray data management and analysis. Biotechniques, 34, 374–378. [DOI] [PubMed] [Google Scholar]
- Shelest, E. (2008) Transcription factors in fungi. FEMS Microbiol. Lett. 286, 145–151. [DOI] [PubMed] [Google Scholar]
- Singh, D. and Chen, S. (2008) The white‐rot fungus Phanerochaete chrysosporium: conditions for the production of lignin‐degrading enzymes. Appl. Microbiol. Biotechnol. 81, 399–417. [DOI] [PubMed] [Google Scholar]
- Solomon, P.S. , Waters, O.D.C. and Oliver, R.P. (2007) Decoding the mannitol enigma in filamentous fungi. Trends Microbiol. 15, 257–262. [DOI] [PubMed] [Google Scholar]
- Strijbis, K. and Distel, B. (2010) Intracellular acetyl unit transport in fungal carbon metabolism. Eukaryot. Cell, 9, 1809–1815. [DOI] [PMC free article] [PubMed] [Google Scholar]
- Swan, T.M. and Watson, K. (1998) Stress tolerance in a yeast sterol auxotroph: role of ergosterol, heat shock proteins and trehalose. FEMS Microbiol. Lett. 169, 191–197. [DOI] [PubMed] [Google Scholar]
- Teixeira, P.J.P.L. , Thomazella, D.P.T. , Vidal, R.O. , do Prado, P.F.V. , Reis, O. , Baroni, R.M. , Franco, S.F. , Mieczkowski, P. , Pereira, G.A.G. and Mondego, J.M.C. (2012) The fungal pathogen Moniliophthora perniciosa has genes similar to plant PR‐1 that are highly expressed during its interaction with cacao. PLoS ONE, 7, e45929. [DOI] [PMC free article] [PubMed] [Google Scholar]
- Thomazella, D.P.T. , Teixeira, P.J.P.L. , Oliveira, H.C. , Saviani, E.E. , Rincones, J. , Toni, I.M. , Reis, O. , Garcia, O. , Meinhardt, L.W. , Salgado, I. and Pereira, G.A.G. (2012) The hemibiotrophic cacao pathogen Moniliophthora perniciosa depends on a mitochondrial alternative oxidase for biotrophic development. New Phytol. 194, 1025–1034. [DOI] [PMC free article] [PubMed] [Google Scholar]
- Vandesompele, J. , De Preter, K. , Pattyn, F. , Poppe, B. , Van Roy, N. , De Paepe, A. and Speleman, F. (2002) Accurate normalization of real‐time quantitative RT‐PCR data by geometric averaging of multiple internal control genes. Genome Biol. 3, 1–12. [DOI] [PMC free article] [PubMed] [Google Scholar]
- Wipf, D. , Benjdia, M. , Tegeder, M. and Frommer, W.B. (2002) Characterization of a general amino acid permease from Hebeloma cylindrosporum . FEBS Lett. 528, 119–124. [DOI] [PubMed] [Google Scholar]
- de Wit, P.J.G. , Mehrabi, R. , Van Den Burg, H.A. and Stergiopoulos, I. (2009) Fungal effector proteins: past, present and future. Mol. Plant Pathol. 10, 735–747. [DOI] [PMC free article] [PubMed] [Google Scholar]
- Wood, G. and Lass, R. (2001) Cocoa. Oxford: Blackwell Science Ltd. [Google Scholar]
- Wosten, H. (2001) Hydrophobins: multipurpose proteins. Annu. Rev. Microbiol. 55, 625–646. [DOI] [PubMed] [Google Scholar]
- Zámocký, M. , Hallberg, M. , Ludwig, R. , Divne, C. and Haltrich, D. (2004) Ancestral gene fusion in cellobiose dehydrogenases reflects a specific evolution of GMC oxidoreductases in fungi. Gene, 338, 1–14. [DOI] [PubMed] [Google Scholar]
- Zeilinger, S. , Mach, R.L. and Kubicek, C.P. (1998) Two adjacent protein binding motifs in the cbh2 (cellobiohydrolase II‐encoding) promoter of the fungus Hypocrea jecorina (Trichoderma reesei) cooperate in the induction by cellulose. J. Biol. Chem. 273, 34 463–34 471. [DOI] [PubMed] [Google Scholar]
Associated Data
This section collects any data citations, data availability statements, or supplementary materials included in this article.
Supplementary Materials
Appendix S1 Library statistics and correlations.
Appendix S2 RNA‐Seq analysis.
Appendix S3 Gene Ontology (GO) and Kyoto Encyclopedia of Genes and Genomes (KEGG) analysis.