

SUMMARY
The moss Physcomitrella patens is an evolutionarily basal model system suitable for the analysis of plant defence responses activated after pathogen assault. Upon infection with the necrotroph Botrytis cinerea, several defence mechanisms are induced in P. patens, including the fortification of the plant cell wall by the incorporation of phenolic compounds and the induced expression of related genes. Botrytis cinerea infection also activates the accumulation of reactive oxygen species and cell death with hallmarks of programmed cell death in moss tissues. Salicylic acid (SA) levels also increase after fungal infection, and treatment with SA enhances transcript accumulation of the defence gene phenylalanine ammonia‐lyase (PAL) in P. patens colonies. The expression levels of the genes involved in 12‐oxo‐phytodienoic acid (OPDA) synthesis, including lipoxygenase (LOX) and allene oxide synthase (AOS), increase in P. patens gametophytes after pathogen assault, together with a rise in free linolenic acid and OPDA concentrations. However, jasmonic acid (JA) could not be detected in healthy or infected tissues of this plant. Our results suggest that, although conserved defence signals, such as SA and OPDA, are synthesized and are probably involved in the defence response of P. patens against B. cinerea infection, JA production appears to be missing. Interestingly, P. patens responds to OPDA and methyl jasmonate by reducing moss colony growth and rhizoid length, suggesting that jasmonate perception is present in mosses. Thus, P. patens can provide clues with regard to the evolution of different defence pathways in plants, including signalling and perception of OPDA and jasmonates in nonflowering and flowering plants.
INTRODUCTION
Flowering plants have evolved complex signalling and defence mechanisms to protect themselves against pathogen attack. Recognition of the pathogen triggers a large range of inducible defence reactions, including the increase of reactive oxygen species (ROS), synthesis of antimicrobial compounds, reinforcement of the cell wall and induction of defence‐related genes. The activation of many of these cellular responses is common to both resistant and susceptible hosts, and the outcome of the interaction will depend on the ability to perceive the pathogen and quickly mount an effective host defence response. One of the most efficient resistance reactions is the hypersensitive response (HR), which is characterized by the rapid death of plant cells in infected tissues. Several studies have shown that plant cell death occurring during the HR is a type of programmed cell death (PCD) (Greenberg and Yao, 2004; Morel and Dangl, 1997). Plant cells undergoing PCD share a number of morphological and biochemical features in common with animal PCD, including chromatin condensation, DNA fragmentation, blebbing of the plasma membrane, accumulation of ROS, release of cytochrome c from mitochondria and activation of a number of hydrolytic enzymes, such as serine and cysteine proteases (Greenberg and Yao, 2004; Lam, 2004, 2008). Recently, two major classes of plant PCD have been defined, including vacuolar cell death and necrotic cell death, although the HR falls into a separate modality, as features of both types of cell death are present (van Doorn et al., 2011).
The biosynthesis of salicylic acid (SA), ethylene (ET) and jasmonic acid (JA) is induced after pathogen recognition, and these hormones play key roles in plant defence responses. The balance and interplay of these hormones will determine the expression of resistance to particular pathogens (Glazebrook, 2005). In general, SA‐mediated responses are associated with resistance to biotrophic pathogens, whereas JA and ET are considered to be important signals in resistance to necrotrophic pathogens. Recent studies have shown that additional hormones are involved in the defence response to pathogen assault, including abscisic acid (ABA) and auxins (López et al., 2008; Robert‐Seilaniantz et al., 2011). In addition, many pathogens are themselves also capable of producing phytohormones during infection that interfere with the plant defence response (López et al., 2008; Robert‐Seilaniantz et al., 2007).
Bryophytes (mosses, liverworts and hornworts) are nonvascular plants that diverged from flowering plants more than 450 million years ago, representing one of the oldest groups of land plants (Schaefer and Zrÿd, 2001). The first plants that colonized emerged lands needed to adapt to important stresses, including desiccation and UV radiation, as well as infection by microbial pathogens. Although bryophytes interact in nature with a variety of fungal pathogens, some of which infect and cause symptoms (Davey and Currah, 2006), little information exists on the defence mechanisms activated after pathogen assault. We have shown previously that the model moss Physcomitrella patens constitutes an excellent model system for the analysis of the infection processes and defence responses activated after microbial infection in an evolutionarily basal land plant (Oliver et al., 2009; Ponce de León, 2011; Ponce de León et al., 2007). The P. patens genome has been sequenced completely (Rensing et al., 2008) and functional studies of genes with possible roles in defence responses can be performed by targeted gene disruption, as P. patens has a high frequency of homologous recombination, in contrast with flowering plants (Schaefer, 2002).
Broad‐host‐range necrotrophic pathogens, such as Botrytis cinerea, Pectobacterium carotovorum ssp. carotovorum (P.c. carotovorum; formerly named Erwinia carotovora ssp. carotovora), Pythium debaryanum and Pythium irregulare, are capable of infecting P. patens tissues, causing disease symptoms and activation of defence responses (Oliver et al., 2009; Ponce de León et al., 2007). Inoculation with B. cinerea and both Pythium species, as well as treatments with P.c. carotovorum cell‐free culture filtrates, containing plant cell wall‐degrading enzymes which act as elicitors capable of inducing plant defence responses in flowering plants (Vidal et al., 1997), induced the expression of defence‐related genes, including lipoxygenase (LOX), phenylalanine ammonia‐lyase (PAL), chalcone synthase (CHS) and pathogenesis‐related‐1 (PR‐1). In addition, P. patens cells infected with B. cinerea, or treated with elicitors of a harpin (HrpN) producing P.c. carotovorum strain (SCC1) (Rantakari et al., 2001), showed cytoplasmic collapse, the accumulation of autofluorescent compounds and chloroplast breakdown, suggesting that an HR‐like response is activated in P. patens (Ponce de León et al., 2007). Levels of 12‐oxo‐phytodienoic acid (OPDA), which is the precursor of the defence hormone JA, increased in P. debaryanum‐ and P. irregulare‐infected moss tissues relative to healthy P. patens tissues (Oliver et al., 2009). However, the presence of JA or its derivatives, collectively named jasmonates, in P. patens is still controversial, as Stumpe et al. (2010) could not detect any amount of JA or amino acid conjugates of JA in moss tissues, and only exceedingly low levels of JA were estimated in Pythium‐inoculated gametophytes (Oliver et al., 2009).
In order to expand the knowledge on the different defence mechanisms activated in P. patens after pathogen challenge, we continued our studies using B. cinerea as a pathogen. Botrytis cinerea penetrates plant tissues by releasing hydrolysing enzymes, including cutinases, and pectinolytic enzymes, causing grey mould disease in many crop plants (van Kan, 2006). As part of its invasion strategy, B. cinerea promotes PCD in plant cells, leading to pathogen proliferation (Govrin and Levine, 2000). In this study, we show that B. cinerea multiplies in P. patens tissues and induces defence responses, including the reinforcement of the cell wall, activation of PCD and the accumulation of SA and OPDA. Although we could not detect JA, P. patens responds to methyl jasmonate (MeJA) by producing a developmental response in a dose‐dependent manner, which is consistent with jasmonate action in other plants (Staswick et al., 1992).
RESULTS
Botrytis cinerea multiplies in P. patens tissues and activates the reinforcement of the cell wall
We have reported previously that B. cinerea infects P. patens cells, resulting in necrosis and maceration of host tissues within 2 days of inoculation (Ponce de León et al., 2007). In order to quantify mycelium growth during the initial stages of infection, when symptoms are not evident, we isolated total DNA and performed quantitative polymerase chain reaction (PCR) using primers specific for both B. cinerea and P. patens DNA. As shown in Fig. 1a, B. cinerea biomass started to increase after 8 h of inoculation and, after 24 h, B. cinerea DNA became predominant in the samples. In addition to quantitative PCR, the colonization of B. cinerea was further assessed by staining mycelium in living moss cells with the fluorescent dye solophenyl flavine 7GFE 500 (Hoch et al., 2005). Spores germinated and germ tubes elongated at 4 and 8 h post‐inoculation (hpi), respectively (Fig. 1b,c). At 24 hpi, hyphae proliferated and different infection stages could be observed in different leaves (Fig. 1d–g). Botrytis cinerea hyphal tips attempted to penetrate single moss cells (Fig. 1d) and, once infection occurred, fungal hyphae were observed within the limits of the cell walls (Fig. 1e). Mycelium proliferated and hyphae grew within and on moss leaves (Fig. 1f–g).
Figure 1.
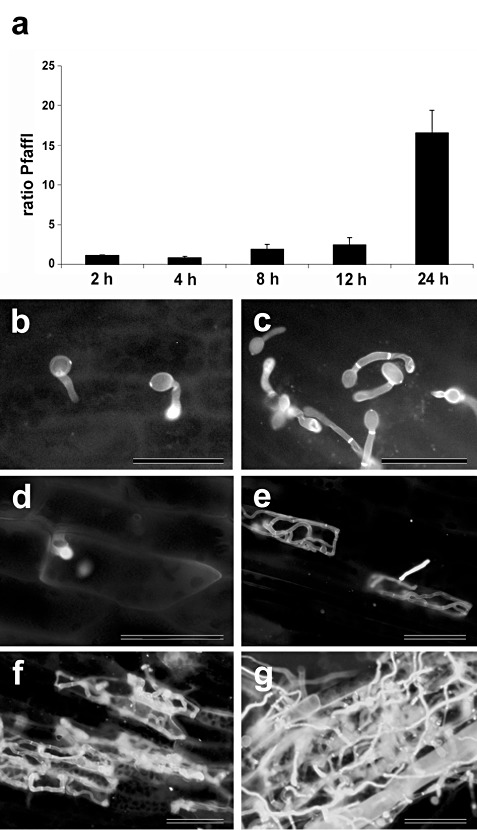
Progress of Botrytis cinerea colonization in Physcomitrella patens tissues. (a) Botrytis cinerea DNA levels were estimated by quantitative polymerase chain reaction (qPCR) adapted from Pfaffl (2001), normalizing against plant DNA content as an endogenous reference and relative to time zero of the infection time course. The results and standard deviation of three independent triplicate experiments are shown. (b–g) Staining of fungal hyphae with the fluorescent dye solophenyl flavine 7GFE 500, showing different infection stages of moss colonization by B. cinerea. (b) Spore germination at 4 h post‐inoculation (hpi). (c) Germ tube elongation at 8 hpi. (d) Hyphal tip approaching a moss cell at 24 hpi. (e) Hyphae growing within cell wall limits at 24 hpi. (f, g) Proliferation of mycelium within and on moss tissues at 24 hpi. The scale bar represents 20 µm.
Botrytis cinerea‐infected leaves were stained with safranin‐O and toluidine blue to measure the incorporation of phenolic compounds. Water‐treated leaves (Fig. 2a) and uninfected tissues were not stained, whereas B. cinerea‐infected tissues were positively stained, reflecting a cell wall fortification mechanism (Fig. 2b–f). Plant cell walls in contact with B. cinerea hyphae incorporated phenolic compounds, visualized by staining with both dyes. Fungal hyphae on the surface of the leaves were also stained (Fig. 2c,f).
Figure 2.
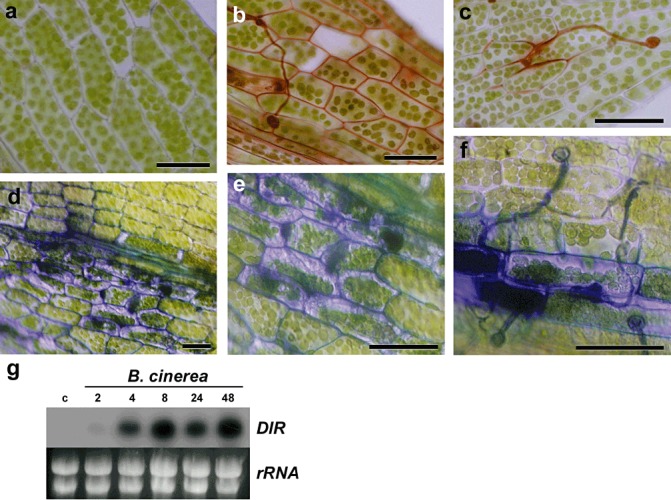
Cell wall‐associated defence responses in Botrytis cinerea‐infected tissues. (a) Water‐treated leaf stained with safranin‐O. (b, c) Botrytis cinerea‐infected leaf stained with safranin‐O. (d–f) Botrytis cinerea‐infected leaves stained with toluidine blue. Photographs of representative samples were taken 1 day after inoculation. The scale bar represents 20 µm. (g) Expression of dirigent‐like (DIR) gene after B. cinerea inoculation. Plants treated with water were used as controls. Moss samples were harvested at the indicated times (hours) after treatment. Ten micrograms of total RNA were separated on formaldehyde–agarose gels, transferred to a nylon membrane and hybridized to a 32P‐labelled partial cDNA DIR probe corresponding to Physcomitrella patens DIR gene Phypa_170601. Ethidium bromide staining of rRNA was used to ensure equal loading of RNA samples. Experiments were repeated thrice with similar results.
Previously, we have identified a gene encoding a dirigent‐like (DIR) protein in a cDNA library obtained from P. patens tissues treated with elicitors of P.c. carotovorum (A. Alvarez and I. Ponce de León, personal observation). DIR proteins are considered to mediate the free radical coupling of monolignol plant phenols to yield the cell wall polymers lignans and lignins (Davin and Lewis, 2000). Expression pattern analysis showed that P. patens DIR‐like gene is induced within 4 h of B. cinerea inoculation, and high levels of transcript accumulation persist until 48 h (Fig. 2g). The results suggest that induced expression of a DIR‐like gene could lead to the modification of the cell wall polymer content and contribute to the reinforcement of the cell wall after B. cinerea infection.
Botrytis cinerea infection causes ROS accumulation and PCD in P. patens
We evaluated whether ROS accumulates after the inoculation of P. patens colonies with B. cinerea. ROS production was observed in a single cell showing an approaching hypha (Fig. 3b) and in fungal invaded cells (Fig. 3c–e), while no fluorescence could be detected in water‐treated leaves (Fig. 3a). As the infection progressed, intracellular ROS were distributed homogeneously in the cytoplasm (Fig. 3e). Since ROS are involved in the generation of plant cell death, we quantified cell death occurring in B. cinerea‐inoculated tissues with Evans blue staining. As shown in Fig. 3f, the number of dead cells started to increase after 1 dpi, reaching a three‐fold increase after 2 dpi in comparison with water‐treated tissues.
Figure 3.
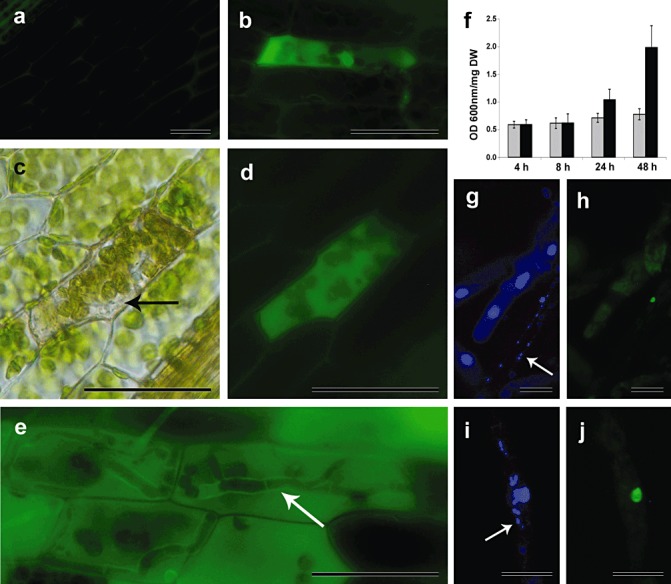
Reactive oxygen species (ROS) production and programmed cell death in Botrytis cinerea‐infected Physcomitrella patens tissues. (a) ROS production in water‐treated leaf (control). (b) ROS production in B. cinerea‐inoculated leaf. (c) Bright field of a B. cinerea‐infected leaf showing a P. patens cell containing fungal hyphae. (d) Same picture as (c) showing ROS accumulation. (e) ROS distributed homogeneously in the cytoplasm of a B. cinerea‐infected leaf. The arrows in (c) and (e) point to fungal hyphae. (f) Measurement of cell death by Evans blue staining 4, 8, 24 and 48 h after inoculation in water‐treated colonies (grey bars) and B. cinerea‐inoculated colonies (black bars). Data were expressed as the optical density (OD) at 600 nm per milligram of dry weight (DW). Values in (f) are means with standard deviations of six independent replicate moss samples. (g, i) Nuclei of protonemal filaments inoculated with B. cinerea and stained with 4′,6‐diamidino‐2‐phenylindole (DAPI). Fungal nuclei are indicated with an arrow. (h, j) Nuclei positively stained with terminal deoxynucleotidyl transferase‐mediated dUTP nick end labelling (TUNEL). Experiments were repeated thrice with similar results. Photographs of representative samples were taken 1 day after inoculation. The scale bar represents 20 µm.
We have shown previously that P. patens cells infected with B. cinerea exhibit hallmarks of PCD (Ponce de León et al., 2007). Here, using terminal deoxynucleotidyl transferase‐mediated dUTP nick end labelling (TUNEL) assay, we confirmed that B. cinerea induced PCD in moss tissues, particularly in cells colonized by fungal hyphae (Fig. 3g–j), indicating the occurrence of DNA fragmentation. No fluorescence was detected in water‐treated tissues or in tissues corresponding to the negative control in which the terminal transferase was omitted (data not shown). DNA laddering characteristics of nucleosomal breakdown were not detected in B. cinerea‐infected P. patens tissues (data not shown), or in moss tissues infected with other pathogens (Lawton and Saidasan, 2009). Taken together, these results show that B. cinerea infection caused ROS production in infected P. patens tissues and activation of an HR‐like response.
Physcomitrella patens induces the accumulation of SA and OPDA, but not JA, after B. cinerea infection
To examine the involvement of different hormones in the response of P. patens to B. cinerea inoculation, SA, JA, OPDA, ABA and indole‐3‐acetic acid (IAA) were analysed in B. cinerea‐inoculated and control plants. The results showed a seven‐fold induction in SA concentration 4 h after inoculation with B. cinerea (Fig 4a). However, B. cinerea induced only a two‐fold increase in ABA levels at 1 dpi, and the IAA content decreased at 4 and 8 hpi (Fig. 4a). To analyse the possible role of SA in the activation of moss defence responses, plants were pretreated with different concentrations of SA and water, and symptom development was compared after B. cinerea inoculation. We could not observe clear differences in disease symptoms caused by B. cinerea in SA‐ or water‐treated plants (data not shown). However, the expression of PAL (Phypa_180561) was induced at 4 h after SA application, showing the potential of SA to modulate defence gene expression.
Figure 4.
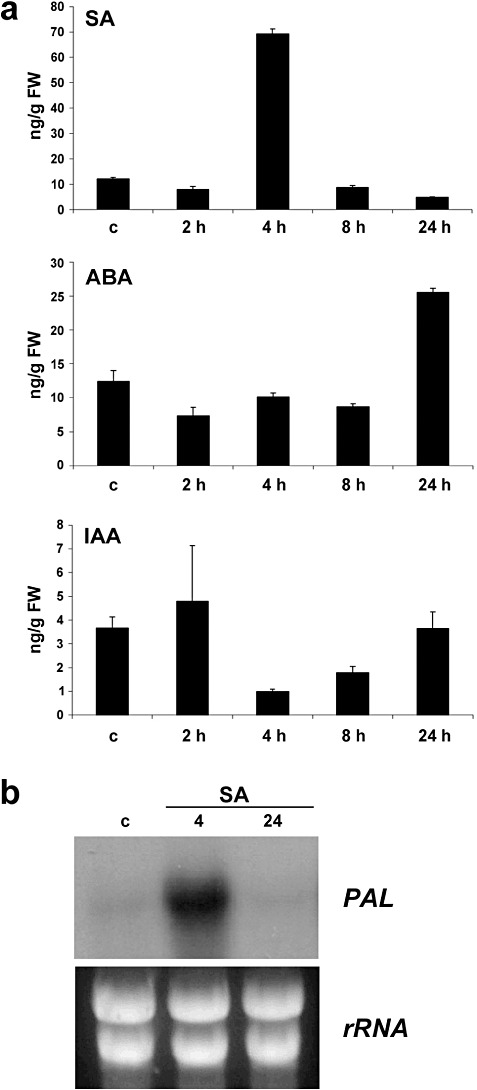
Salicylic acid (SA), abscisic acid (ABA) and auxin accumulation and expression analysis of a phenylalanine ammonia‐lyase (PAL) gene in response to SA. (a) Endogenous SA, ABA and indole‐3‐acetic acid (IAA) levels [ng/g fresh weight (FW)] in water‐treated and B. cinerea‐inoculated tissues were analysed at the indicated time points. Values are means and standard errors of three independent experiments. (b) Expression of PAL after 0.5 mm SA treatment at 4 and 24 h. Ten micrograms of total RNA were separated on formaldehyde–agarose gels, transferred to a nylon membrane and hybridized to a 32P‐labelled partial cDNA PAL probe corresponding to Physcomitrella patens PAL gene Phypa_180561. Ethidium bromide staining of rRNA was used to ensure equal loading of RNA samples. Expression analysis was repeated thrice with similar results.
The results also showed that the free OPDA content increased 66‐fold 24 h after B. cinerea inoculation, which correlated with an increase in the level of free linolenic acid (LNA) (Fig. 5a, Table S1, see Supporting Information). However, no C12 jasmonate analogues could be detected in B. cinerea‐infected tissues. We also analysed free LNA, OPDA and JA content in P. patens plants infected with P. irregulare or P. debaryanum or treated with elicitors of P.c. carotovorum. The results showed that, although LNA and OPDA increased in response to both Pythium species, and LNA increased after treatment with elicitors of P.c. carotovorum, no jasmonates could be detected in any of the samples analysed (Table S1).
Figure 5.
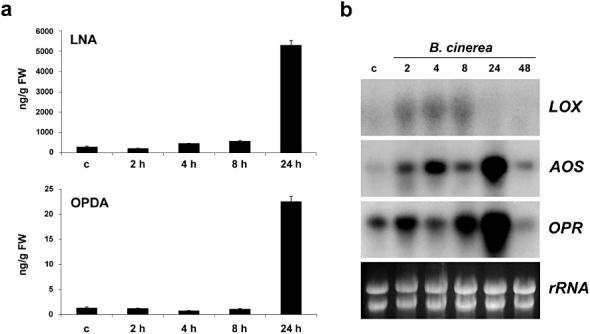
Linolenic acid (LNA) and 12‐oxo‐phytodienoic acid (OPDA) accumulation and expression analysis of lipoxygenase (LOX), allene oxide synthase (AOS) and OPDA reductase‐encoding (OPR) genes on Botrytis cinerea inoculation. (a) Endogenous free LNA and OPDA levels [ng/g fresh weight (FW)] in water‐treated and B. cinerea‐inoculated tissues were analysed at the indicated time points. Values are means and standard errors of three independent experiments. (b) Expression of LOX, AOS and OPR after B. cinerea inoculation at the indicated times (hours). Ten micrograms of total RNA were separated on formaldehyde–agarose gels, transferred to nylon membranes and hybridized to 32P‐labelled partial cDNA probes corresponding to Physcomitrella patens genes LOX (Phypa_117739), AOS (Phypa_214061) and OPR (Phypa_158472). Ethidium bromide staining of rRNA was used to ensure equal loading of RNA samples. Expression analysis was repeated thrice with similar results.
We have shown previously that LOX1 (Anterola et al., 2009) transcript levels increase after B. cinerea inoculation in P. patens tissues (Ponce de León et al., 2007). In order to analyse in more detail the expression pattern of genes potentially involved in OPDA synthesis, we analysed the expression pattern of an additional LOX (LOX6; Anterola et al., 2009) and an allene oxide synthase (AOS) in response to B. cinerea infection. A gene with high identity to OPDA reductase‐encoding genes (OPR) of flowering plants was also included in the expression analysis. As shown in Fig 5b, the expression of LOX, AOS and OPR increased after fungal inoculation. LOX transcript accumulation started at 2 h and was maintained during 4 and 8 h after spore treatments. The level of AOS and OPR expression increased at 2 h in fungal inoculated tissues, reaching a maximum level at 24 h. Taken together, the results show that the synthesis of SA and OPDA is induced in P. patens tissues after B. cinerea infection, whereas JA could not be detected in any of the infected or elicitor‐treated tissues analysed.
Physcomitrella patens responds to OPDA and MeJA
As jasmonates are not detected in P. patens tissues (healthy and infected tissues), suggesting that they are not synthesized in this moss, we addressed the question of whether moss cells could perceive and respond to OPDA or MeJA. Moss colonies were grown in the presence of different concentrations of OPDA and MeJA and, after 21 days, the diameters of the colonies were measured. The results showed a reduction in the colony diameter of between 34% and 35% after the growth of moss tissues with 5, 10, 25 and 50 µm OPDA compared with control plants (Fig. 6a,b). When moss tissues were grown in the presence of MeJA, reductions of 25% and 36% in colony diameter were observed with 25 and 50 µm MeJA, respectively, compared with control plants, whereas 5 and 10 µm MeJA had no significant effect on moss development (Fig. 7a,b). In addition, a significant reduction in rhizoid length was observed when plants were grown in the presence of 5, 10, 25 and 50 µm OPDA (40%–53%) and 25 and 50 µm MeJA (46% and 53%), when compared with control plants (6, 7). Rhizoids were more abundant in gametophores grown in the presence of OPDA compared with rhizoids in the control condition (Fig. 6e). These results show that OPDA and MeJA affect moss development and, although jasmonates are not detected in this moss, P. patens is able to perceive and respond to OPDA and MeJA.
Figure 6.
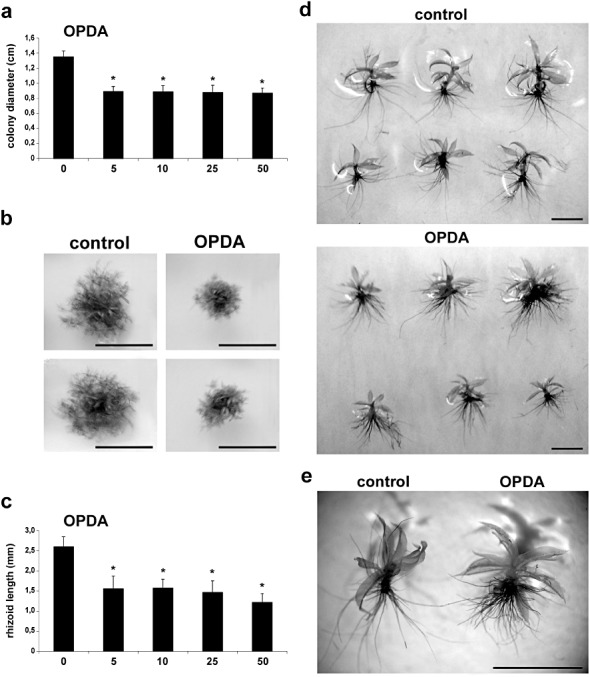
12‐Oxo‐phytodienoic acid (OPDA) induces reduction of colony growth and rhizoid length. (a) Moss colonies grown on different concentrations of OPDA, measured as size (diameter in centimetres) of single moss colonies relative to control moss colonies grown on 0.5% ethanol. Results and standard deviation corresponding to 16 colonies per sample are shown. (b) Individual colonies showing the typical phenotype 21 days after growing plants on 0.5% ethanol (control) or 50 µm OPDA‐containing medium. (c) Physcomitrella patens gametophores grown on 0.5% ethanol or 5, 10, 25 and 50 µm OPDA were taken from the edge of the moss colonies, stained with toluidine blue and the rhizoid lengths were measured (length in millimetres). Results and standard deviation corresponding to 24 gametophores are shown. (d, e) Individual gametophores grown for 21 days on 0.5% ethanol (control) or 50 µm OPDA‐containing medium. Rhizoids were stained with toluidine blue and their lengths were measured (mm). Experiments were repeated at least three times with similar results and representative photographs are shown. Scale bars represent 1 cm in (b) and 0.2 cm in (d, e). Asterisks for plants grown on 5, 10, 25 and 50 µm OPDA indicate that the values are significantly different from control plants according to Kruskal–Wallis test: P < 0.0001.
Figure 7.
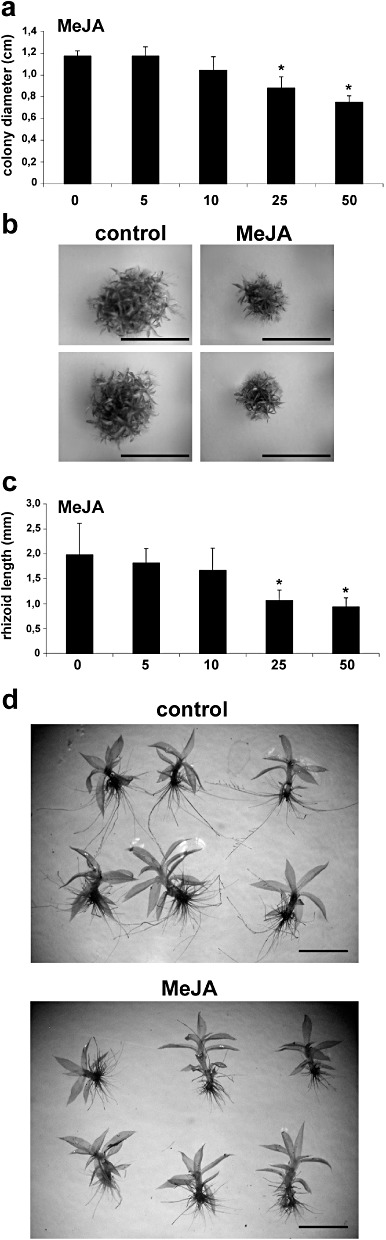
Methyl jasmonate (MeJA) induces reduction of colony growth and rhizoid length. (a) Moss colonies grown on different concentrations of MeJA, measured as size (diameter in centimetres) of single moss colonies relative to control moss colonies grown on 0.5% ethanol. Results and standard deviation corresponding to 16 colonies per sample are shown. (b) Individual colonies showing the typical phenotype after 21 days of growth on 50 µm MeJA‐containing medium in comparison with control plants grown on 0.5% ethanol. (c) Physcomitrella patens gametophores grown on 0.5% ethanol or 5, 10, 25 and 50 µm MeJA were taken from the edge of the moss colonies, stained with toluidine blue and the rhizoid lengths were measured (mm). Results and standard deviation corresponding to 24 gametophores are shown. (d) Individual gametophores grown for 21 days on 50 µm MeJA‐containing medium relative to control plants grown on 0.5% ethanol. Rhizoids were stained with toluidine blue and their lengths were measured (mm). Experiments were repeated at least three times with similar results and representative photographs are shown. Scale bars represent 1 cm in (b) and 0.2 cm in (d). Asterisks for plants grown on 25 and 50 µm MeJA indicate that the values are significantly different from control plants according to Kruskal–Wallis test: P < 0.0001.
DISCUSSION
To gain further insight into the defence mechanisms acquired against airborne pathogens during the transition of plants from an aquatic to a terrestrial environment, we continued our studies on the interaction of the bryophyte P. patens with the wide‐host‐range fungus B. cinerea. Physcomitrella patens is susceptible to B. cinerea infection, and we show that B. cinerea multiplies after 8 and 12 hpi, and that disease symptoms are visible after 24 hpi when B. cinerea DNA becomes predominant in the samples.
Modification of the plant cell wall by the incorporation of phenolic compounds is an important defence mechanism operating in the defence response of flowering plants against B. cinerea (Asselbergh et al., 2007; Curvers et al., 2010). Botrytis cinerea‐infected P. patens tissues incorporate phenolic compounds in the cell wall, detected by safranin‐O and toluidine blue staining. This type of fortification mechanism occurs during lignification and suberization in vascular plants (Lucena et al., 2003; Mellersh et al., 2002). The cell wall composition of bryophytes is different from that of vascular plants, especially with regard to the process of lignification (Edelmann et al., 1998; Lee et al., 2005). From an evolutionary perspective, mosses represent the first lineage across the plant kingdom with the complete lignin biosynthesis pathway, with the exception of ferulate 5‐hydroxylase (F5H), which converts G (guaiacyl) monolignol to S (syringyl) monolignol (Xu et al., 2009). In green algae, only certain lignin biosynthesis genes have been found and no lignin and monolignol‐like molecules have been detected (Xu et al., 2009). The occurrence of lignins in bryophytes is still controversial. Instead of lignin, mosses may contain other phenolic compounds, such as lignin‐like polymers (Popper, 2008). Espiñeira et al. (2011) have shown that P. patens cell walls contain lignin‐like polyphenols, although lignin could not be found by solubilizing the β‐O‐4 lignin core, which is exclusive to lignins. In addition, methoxyl groups and the methoxylated ring carbon atoms in the monolignol units of lignified materials are absent in the moss Rhacocarpus purpurascens (Edelmann et al., 1998). Nevertheless, peroxidase enzymes, which are typically involved in lignin biosynthesis, and are capable of oxidizing monolignols, have been detected in P. patens (Espiñeira et al., 2011). DIR proteins are thought to mediate the coupling of monolignol plant phenols to yield lignans and lignins (Davin and Lewis, 2000). In this article, we have shown the induced expression of a gene encoding a DIR‐like protein in B. cinerea‐infected moss tissues. The P. patens genome contains eight additional putative DIR‐like genes with identities of 39.7%–96.7% to the DIR‐like gene used in this study. As the DIR cDNA fragment used as a probe (Phypa_110421) and two other DIR‐like genes (Phypa_170601 and Phypa_48771) exhibit high identity (81.1%–96.7%), and encode transcripts of similar sizes, Northern blot results could represent the expression pattern of these three DIR genes. Transcriptional profiling has revealed the induced expression of some DIR genes in flowering plants during the disease resistance response (Chakravarthy et al., 2010; Coram et al., 2008), suggesting that they could play important roles in plant–pathogen interactions. The expression pattern of different pathogen‐inducible DIR‐like genes may vary depending on the pathosystem. In wheat, a similar expression pattern of two DIR‐like genes was reported during the course of infection with Puccinia striiformis (Coram et al., 2008). However, the expression pattern of two DIR‐like genes from grapevine was different after Erysiphe necator assault (Fung et al., 2008). Consistent with a possible role of DIR proteins in defence, DIR‐overexpressing transgenic plants show enhanced resistance after fungal assault (Wang and Fristensky, 2001; Wang et al., 1999). Our results suggest that changes in cell wall composition occur after infection as part of a defence mechanism, leading to the reinforcement of the well wall. Although cell wall fortification mechanisms are activated in P. patens after B. cinerea infection, they are not sufficient to stop fungal colonization, leading, finally, to plant decay. Bhuiyan et al. (2009) have demonstrated that S lignin plays a pivotal role in plant defence against fungal penetration. The lack of S monolignols in P. patens could contribute to the high susceptibility observed in moss tissues after B. cinerea infection. Hence, P. patens represents an interesting model system to analyse lignin‐like material composition after pathogen assault, and to evaluate the role of DIR‐like proteins in the coupling of monolignols during plant defence responses.
ROS production is an important component of B. cinerea virulence, and increased levels of ROS in plant cells seem to cause more aggressive infection of B. cinerea, resulting in an accelerated colonization of host tissue (Govrin and Levine, 2000). Consistently, we detected ROS generation in B. cinerea‐infected P. patens tissues which showed increased cell death after fungal colonization. Single moss cells respond rapidly to hyphal contact by generating ROS, suggesting that, like vascular plants (Asai and Yoshioka, 2009; Govrin and Levine, 2000), the oxidative burst is probably induced before and during B. cinerea invasion. Intracellular ROS were detected homogeneously in the cytoplasm and may contribute to the observed cell wall strengthening by oxidative cross‐linking of wall components. Previously, we have shown the occurrence of protoplast shrinkage, the accumulation of autofluorescent compounds and chloroplast breakdown in B. cinerea‐infected cells, which are indicative of an HR‐like response (Ponce de León et al., 2007). ROS accumulation and protoplast shrinkage are typical features of necrotic plant PCD (van Doorn et al., 2011). These results, together with TUNEL‐positive staining of P. patens nuclei invaded by B. cinerea hyphae, confirm the activation of an HR‐like response after B. cinerea infection. Studies in tobacco and Arabidopsis suggest that B. cinerea needs HR cell death to achieve full pathogenicity (Dickman et al., 2001; Govrin and Levine, 2000). Arabidopsis mutants with an accelerated cell death response are more susceptible to B. cinerea, whereas mutants with reduced or delayed cell death are generally more resistant (van Baarlen et al., 2007). Physcomitrella patens therefore represents an interesting model plant to perform functional studies of the key components involved in PCD and can provide clues to the evolution of PCD in plants.
Signal molecules, including SA, JA, ABA and auxins, are involved in the defence response of flowering plants against pathogens, and the balance between these hormones will influence the outcome of the interaction (López et al., 2008; Robert‐Seilaniantz et al., 2011). In the present study, we observed an increase in SA content in B. cinerea‐inoculated moss tissues relative to control plants. To our knowledge, this is the first time that an SA increase has been reported in a moss after pathogen assault. The rapid and transient increase in SA levels was observed 4 h after the inoculation of moss tissues with B. cinerea spores. In B. cinerea‐infected flowering plants, SA levels have been measured at later time points. In infected tomato and Arabidopsis plants, increased SA levels were observed at 12–24 hpi and 48 hpi, respectively (El Oirdi et al., 2011; Veronese et al., 2006). The P. patens genome contains 14 putative genes encoding PALs (Wolf et al., 2010) and several putative homologues of isochorismate synthases, supporting the synthesis of SA in this moss. In addition, the treatment of P. patens colonies with SA induces the expression of PAL (Phypa_180561), suggesting that the endogenous rise of SA leads to enhanced expression of this defence gene. Consistent with our findings, Andersson et al. (2005) demonstrated that SA application to P. patens colonies induced defence mechanisms and increased resistance to P.c. carotovorum. The ability to perceive and transduce the SA signal was also observed in the moss Funaria hygrometrica, in which SA treatments caused an effect on plant growth and development (Christianson and Duffy, 2002). Taken together, these results suggest that the ability to synthesize, perceive and transduce the SA signal is an ancient feature in plant evolution.
The role played by SA signalling in the resistance of flowering plants to B. cinerea infection is complex. Although SA‐deficient NahG Arabidopsis and tomato plants are more susceptible than wild‐type plants to B. cinerea (Audenaert et al., 2002; El Oirdi et al., 2011; Ferrari et al., 2003), NahG and wild‐type Nicotiana benthamiana plants respond similarly to B. cinerea infection (Asai et al., 2010). Recently, El Oirdi et al. (2011) have demonstrated that B. cinerea produces an exopolysaccharide, which acts as an elicitor of the SA pathway, antagonizing the JA signalling pathway in tomato to enhance disease symptoms. Contradictory results have been obtained in tomato, as the pretreatment of plants with 0.5 mm SA reduced slightly (Vicedo et al., 2009) or enhanced (El Oirdi et al., 2011) disease development caused by B. cinerea relative to control plants. This difference could be a result of the activation or not of the SA/JA antagonism by B. cinerea, which could be strain and host dependent (El Oirdi et al., 2011). In Arabidopsis, B. cinerea‐induced necrotic lesions were similar in SA‐treated and untreated plants (Govrin and Levine, 2002), and several authors have suggested that, in Arabidopsis, SA contributes to resistance against B. cinerea, although it does not play a major role (Ferrari et al., 2003; Glazebrook, 2005). Similar to Arabidopsis, we could not observe clear differences in disease symptoms caused by B. cinerea after the pretreatment of moss plants with different concentrations of SA or water (data not shown). Taken together, the results suggest that SA may contribute to the activation of defence responses against B. cinerea. The generation of P. patens plants impaired in SA accumulation or perception will certainly provide valuable insights into the role of SA in moss defence against B. cinerea and other pathogens.
Our results also show that the ABA content increases in P. patens tissues infected with B. cinerea relative to water‐treated plants. This increase was observed 24 h after the inoculation of P. patens colonies, when mycelium had colonized heavily the plant tissues and thus ABA could have been produced by B. cinerea itself. This is consistent with the fact that B. cinerea produces ABA that may contribute to the infection process (Siewers et al., 2004). In flowering plants, ABA‐deficient mutants are more resistant to B. cinerea (AbuQamar et al., 2006; Asselbergh et al., 2007; Curvers et al., 2010). In contrast, increased ABA levels contribute to the development of grey mould in tomato (Asselbergh et al., 2007; Ton et al., 2009). The ABA increase observed in B. cinerea‐infected P. patens plants could promote susceptibility to this pathogen by interfering negatively with SA‐dependent defence, as has been reported previously for flowering plants (Audenaert et al., 2002; Yasuda et al., 2008). Recently, P. patens microarray expression profiles in response to B. cinerea inoculation revealed differential expression of ABA‐inducible transcription factors and several genes with predicted ABA‐responsive promoters (C. Neu and S. Rensing, Albert‐Ludwigs‐Universität, Freiburg, Germany, personal communication). Thus, P. patens can provide new insights into the evolution of ABA as a defence signalling molecule in land plants.
Fungal pathogen infection perturbs auxin homeostasis, either by the pathogen production of auxin and/or by the alteration of host auxin biosynthesis (Maor et al., 2004; Tanaka et al., 2011). In this study, we observed a decrease in auxin content in B. cinerea‐inoculated moss tissues relative to control plants. In flowering plants, B. cinerea infection causes the repression of auxin signalling (El Oirdi and Bouarab, 2007; Llorente et al., 2008). The greatest decrease in IAA in moss tissues was detected 4 h after fungal inoculation, which correlates with an increase in SA levels. Wang et al. (2007) have demonstrated that SA inhibits the auxin signalling pathway as part of the plant defence mechanism. Further studies need to be performed to understand the interaction between these two hormonal pathways, as well as the role of auxins, in P. patens–microbe interactions.
Jasmonate biosynthesis is typically initiated with the release of LNA from membrane glycerolipids and conversion to OPDA by the sequential action of the plastid enzymes LOX, AOS and allene oxide cyclase (AOC). The second part of the pathway takes place in peroxisomes, where OPDA is reduced by OPDA reductase (OPR3) to give 3‐oxo‐2(2′[Z]‐pentenyl)‐cyclopentane‐1‐octanoic acid (OPC:8), followed by three rounds of β‐oxidation involving three enzymes to yield (+)‐7‐iso‐JA. This molecule epimerizes to the more stable (−)‐JA, generally known as JA (Browse, 2009). It has been demonstrated recently that the active form of the hormone is (+)‐7‐iso‐JA‐l‐isoleucine (Fonseca et al., 2009). Our results show that, like flowering plants, P. patens responds to B. cinerea by increasing the endogenous levels of free LNA and OPDA (Vicedo et al., 2009; Yang et al., 2007). Accordingly, the expression of genes encoding enzymes involved in the synthesis of OPDA, including LOX and AOS, is enhanced in B. cinerea‐infected tissues. In addition, free LNA and OPDA levels increase in moss tissues infected with P. irregulare and P. debaryanum, and increased LNA levels are detected after treatment with P.c. carotovorum elicitors. However, we could not detect JA in healthy, pathogen‐infected or elicitor‐treated P. patens tissues, suggesting that oxylipins are not further metabolized to JA in P. patens.
We have reported previously that OPDA levels and very small amounts of JA (1–7 ng/g fresh weight) increase in P. patens tissues infected with P. irregulare and P. debaryanum (Oliver et al., 2009). However, other groups have shown that OPDA, but not JA or JA‐isoleucine, accumulates in healthy or wounded P. patens gametophytes (Browse, 2009; Stumpe et al., 2010). In the current study, our re‐examination found no evidence for JA or related metabolites, suggesting that the trace gas chromatography/mass spectrometry (GC/MS) peaks, bordering the limits of detection, which were previously attributed to JA, actually correspond to other unrelated metabolites.
We have also observed the induced expression of an OPR‐encoding gene in response to B. cinerea. The P. patens genome contains several OPR‐like genes (Breithaupt et al., 2009; Li et al., 2009) and, although one of the gene products has been identified as a candidate for OPR3‐like activity, which is the only enzyme that converts cis‐(+)‐OPDA to JA (Breithaupt et al., 2009), enzymatic activity is missing. Studies with the Arabidopsis opr3 mutant have indicated that OPDA is active as a defence signal against pathogens and regulates defence gene expression (Browse, 2009; Stintzi et al., 2001; Taki et al., 2005). Consistently, moss colonies treated with OPDA show an enhanced expression of a defence gene PAL (Oliver et al., 2009). This PAL‐encoding gene (Phypa_156018) is different from the SA‐inducible PAL gene (Phypa_180561) and differential expression could lead to the production of different metabolites with distinct roles in defence. JA increases in Arabidopsis upon B. cinerea infection (Yang et al., 2007), and it has been shown recently that JA plays an important role in defence against this pathogen (Chehab et al., 2011). In mosses, other oxylipins, including OPDA, may play primary roles in defence against B. cinerea, either by activating gene expression and/or by its antimicrobial activity against this fungus (Prost et al., 2005).
The P. patens genome contains six putative genes encoding the JA‐isoleucine receptor COI (coronatine insensitive) and six encoding the repressor JAZ (Chico et al., 2008). It remains an open question as to which molecule(s) is/are the ligand(s) of P. patens COI‐like proteins and how this signalling pathway is perceived. Several explanations are possible, including the perception of OPDA or OPDA‐isoleucine or other jasmonates by P. patens COI‐like proteins, although there is currently no experimental evidence of the interaction of OPDA with the COI1–JAZ complex in flowering plants (Chini et al., 2009).
OPDA affects moss development, evidenced by a reduced growth of P. patens colonies and decreased rhizoid length. Although jasmonates were not detected in P. patens tissues, this moss also responds to MeJA by reducing the growth of the colonies and the length of the rhizoid in a dose‐dependent manner. This is consistent with previous results obtained in Arabidopsis, where the growth of seedlings and roots was reduced on OPDA‐ and MeJA‐containing medium (Mueller et al., 2008; Staswick et al., 1992; Vellosillo et al., 2007; Yan et al., 2007). It has been suggested that growth inhibition might occur at the level of the cell cycle, as JA and OPDA block cell cycle progression (Mueller et al., 2008; Swiatek et al., 2002). Although higher levels of MeJA relative to OPDA were needed to alter moss development, both oxylipins were perceived, leading, finally, to the activation of similar responses. Accordingly, at the level of gene expression, OPDA, JA and MeJA induce the accumulation of the defence gene PAL (Phypa_156018) (Oliver et al., 2009). A central question is how these jasmonates are perceived by P. patens cells. It is tempting to speculate that numerous components utilized by the jasmonate perception system could exist as ancient features already present in mosses. In addition, the different P. patens COI‐like proteins could have different specificity and recognize different oxylipins, allowing the binding of a wider range of ligands. In conclusion, further studies are needed to obtain a more complete scenario with regard to the evolution of different defence pathways in plants, including the signalling and perception of OPDA and jasmonates in nonflowering and flowering plants, and P. patens represents an excellent basal plant to perform these studies.
EXPERIMENTAL PROCEDURES
Physcomitrella patens and pathogen growth conditions
Physcomitrella patens Gransden WT isolate (Schaefer et al., 1991) was provided by the IMSC International Moss Stock Center (Freiburg, Germany), and grown on cellophane overlaid agar BCDAT medium. Protonemal cultures and moss colonies were generated as described previously (Oliver et al., 2009). Plants were grown at 22 °C under a photoperiod of 16 h light, and 3‐week‐old colonies were used for all the experiments. Botrytis cinerea, P. irregulare and P. debaryanum were cultivated on 24 g/L potato dextrose agar (PDA) (Difco, Detroit, MI, USA) at 22 °C; P.c. carotovorum was propagated on Luria–Bertani (LB) medium at 28 °C and culture filtrates containing the elicitors were prepared according to Ponce de León et al. (2007).
Pathogen inoculation and B. cinerea staining
Botrytis cinerea inoculations were performed as described by Ponce de León et al. (2007) using a suspension (2 × 10⁵ spores/mL) in water. Both Pythium species were inoculated according to Oliver et al. (2009). The culture filtrate of P.c. carotovorum was applied by spraying the moss colonies. Botrytis cinerea tissues were stained with 0.1% solophenyl flavine 7GFE 500 in water for 10 min, rinsed in water and visualized with epifluorescence (Hoch et al., 2005). All photographs were taken at 1 day after inoculation, unless otherwise indicated, and representative photographs are shown.
Quantitative PCR
Total DNA was isolated from moss colonies inoculated with B. cinerea using the DNeasy kit (Qiagen, Hilden, Germany). Samples were frozen in liquid nitrogen immediately after inoculation (time zero) and after 2, 4, 8, 12 and 24 h. DNA was isolated from triplicate independent experiments. Each sample corresponds to 16, 3‐week‐old P. patens colonies sprayed with a spore suspension containing 2 × 10⁵ spores/mL. The oligonucleotides used to amplify P. patens DNA corresponded to the single copy 3′‐end of an elongation factor gene (Fwd: 5′‐TTTGGGATTGAAATGTCGTG‐3′; Rev: 5′‐TGAGCATGAGAAATTGGGTCT‐3′); the PCR product size was 180 bp, the PCR efficiency was 0.95 with an R 2 value of 0.9983. The oligonucleotides used to amplify B. cinerea DNA corresponded to the multiple copy ITS region (Fwd: 5′‐CTGTTCGAGCGTCATTTCAA‐3′; Rev: 5′‐CCTACCTGATCCGAGGTCAA‐3′); the PCR product size was 184 bp, the PCR efficiency was 1.01 with an R 2 value of 0.9975. Quantitative PCR was performed using the QuantiMix Easy SYG kit (Biotools, Madrid, Spain) based on Sybr Green technology and the Rotor‐Gene 6000 cycler (Corbett Life Science, Sydney, Australia). The annealing temperature was 55 °C. The relative amount of B. cinerea DNA was normalized to plant DNA and expressed relative to the calibrator samples taken at time zero. After 2 dpi, plant tissues were macerated, decreasing the plant DNA yield and preventing the use of this quantitative PCR approach. The relative quantification was performed according to Pfaffl (2001), a mathematical model that includes the real‐time PCR efficiencies of both the target and internal reference genes, and does not require any calibration curves with pure genomic DNA (Gachon and Saindrenan, 2004).
Visualization of plant cell wall‐associated defence responses
To detect cell wall modifications, safranin‐O staining was performed according to Lucena et al. (2003). Tissues were incubated with 0.01% safranin‐O in 50% ethanol for 5 min. The accumulation of phenolics was also detected by staining tissues with 0.05% toluidine blue in citrate–citric acid buffer (50 mm, pH 3.5; Mellersh et al., 2002).
Bright field microscopy and fluorescence microscopy were performed with an Olympus BX61 microscope (Shinjuku‐ku, Tokyo, Japan), and all images shown in this study were captured with the Microsuite software package (Olympus).
ROS production and cell death detection
The intracellular production of ROS was analysed by incubating moss tissues with 10 µm 2′,7′‐dichlorodihydrofluorescein diacetate (H2DCFDA) for 15 min in 0.1 m phosphate buffer (pH 7.5) in the dark. Leaves were visualized with epifluorescence. For the detection of cell death, moss colonies were incubated for 2 h with 0.05% Evans blue and washed four times with deionized water to remove excess and unbound dye. Dye bound to dead cells was solubilized in 50% methanol with 1% sodium dodecylsulphate (SDS) for 45 min at 50 °C, and the absorbance was measured at 600 nm (Levine et al., 1994). Each sample consisted of four colonies incubated in 6 mL of a methanol–SDS mixture. Six samples were analysed per experiment, which was repeated at least three times and expressed as the optical density (OD) per milligram of dry weight. Dry weight was measured after drying plant colonies for 18 h at 65 °C.
TUNEL assay
Water‐treated and B. cinerea‐inoculated protonemal tissues were fixed in 10% formalin and 50 mm 1,4 Piperazine bis (2‐ethanosulfonic acid) (PIPES) buffer (pH 6.8) at 4 °C overnight, dehydrated through a graded ethanol series (50%, 70%, 80%, 95%), washed twice with phosphate‐buffered saline and permeabilized with Triton X100 solution [10% Triton X100 and 4′,6‐diamidino‐2‐phenylindole (DAPI) staining solution containing 10 mm tris(hydroxymethyl)aminomethane (Tris) (pH 8.0), 1 mm ethylenediaminetetraacetic acid (EDTA) (pH 8.8) and 150 mm NaCl] overnight at 4 °C. Nuclear DNA fragmentation was identified by TUNEL staining, which detects free 3′‐hydroxyl groups of degraded nuclear DNA. The TUNEL assay (TUNEL in situ cell death detection kit‐fluorescein, Roche Applied Science, Mannheim, Germany) was carried out according to the manufacturer's instructions. To reduce the nonspecific signal, the reaction buffer was diluted three times in dilution buffer (Roche Applied Science). Terminal transferase was omitted for the negative control. After washing with DAPI staining buffer, samples were incubated in DAPI staining buffer containing 0.1 µg/mL at room temperature for 15 min. Excitation and emission filters were as follows: for DAPI, excitation was between 353 and 377 nm and emission was above 397 nm; for fluorescein, excitation was between 450 and 490 nm and emission was between 515 and 565 nm.
RNA gel blot analysis
Total RNA was isolated from water‐treated and B. cinerea‐inoculated tissue using standard procedures based on phenol–chloroform extraction followed by LiCl precipitation. Each sample consisted of 48 colonies. Ten micrograms of total RNA were separated, transferred to nylon membranes, hybridized and washed as described previously (Ponce de León et al., 2007). A partial cDNA clone of 506 bp, which showed a high level of similarity to DIR‐encoding genes from flowering plants (Phypa_110421), was cloned into pGem®T‐Easy (Promega, Madison, WI, USA) and used as a probe to amplify by PCR the corresponding cDNA using universal primers. A second partial cDNA clone of 374 bp was obtained with a high level of similarity to PAL‐encoding genes from flowering plants; in order to obtain a larger fragment for use as a probe, primers were used (PAL‐Fwd: 5′‐CACGACCCCATGCTTGTGGACTCC‐3′; PAL‐Rev: 5′‐AATCCTGTCAGCATGAGAAGGGTC‐3′) to amplify a cDNA of 2144 bp (Phypa_180561), which was cloned into pGEM (Promega). Partial cDNAs were obtained from a suppression subtractive hybridization cDNA library constructed from RNA from P. patens tissues treated with P.c. carotovorum strain SCC1 (Rantakari et al., 2001) elicitors as the tester and RNA from water‐treated moss tissues as the driver (A. Alvarez and I. Ponce de León, personal observation). In addition, the P. patens cDNA clones from RIKEN used as probes were obtained by digesting the plasmid harbouring the corresponding cDNA, including LOX (clone pphn31p10; Phypa_117739), AOS (clone pphb27o22; Phypa_214061) and OPR (clone pphb29k02; Phypa_158472) (Nishiyama et al., 2003). PCR and digested fragments were purified using Qiaquick columns (Qiagen), and labelled with [α32P]‐dCTP using the Rediprime II Random Prime labelling system (GE Healthcare, Buckinghamshire, UK). The amount of RNA loaded was verified by the addition of ethidium bromide to the samples and photography under UV light after electrophoresis. The blots shown are representative examples of the results obtained in three independent experiments.
Hormone analysis and treatments
Three‐week‐old moss colonies were inoculated with a spore suspension of B. cinerea. Tissue was collected 2, 4, 8 and 24 h after inoculation, frozen, ground and weighed until hormone quantification. Eight moss colonies were pooled and 200 mg of ground tissue were homogenized, derivatized, vapour phase extracted and analysed by gas chromatography/isobutane chemical ionization mass spectrometry (GC/CI‐MS), as described previously (Schmelz et al., 2004). This procedure was repeated three times.
Moss colonies were treated by spraying 0.5 mm SA on the tissues, and samples were taken at the indicated time points. Control plants were sprayed with water.
Growth of colonies with OPDA and MeJA
Small pieces of protonema were harvested from protonemal cultures and placed on fresh plates with increasing concentrations of OPDA and MeJA (5, 10, 25 and 50 µm). Control plants were grown on plates containing 0.5% ethanol. For each concentration and each oxylipin, two plates were set up containing 16 colonies each. Plants were observed after 21 days and the diameter of each colony was recorded between the borders of the moss colonies. For the measurement of the rhizoid length, 24 gametophores for each concentration and each oxylipin were taken from the edge of the colonies, stained for 1 min in 0.05% toluidine blue in citrate–citric acid buffer to allow rhizoid staining, and rinsed in water to remove excess dye. The colony diameter and rhizoid length were measured using Gimp 2.6 software. All experiments were repeated at least three times. To compare the significance of the differences between the diameter of the colonies and the length of the rhizoids of plants grown on different concentrations of OPDA and MeJA relative to control plants, a nonparametric Kruskal–Wallis multiple comparison test was performed using statistica 7 software.
Supporting information
Table S1 Endogenous free linolenic acid (LNA), 12‐oxo‐phytodienoic acid (OPDA) and jasmonic acid (JA) levels [ng/g fresh weight (FW)] were analysed at the indicated time points in Physcomitrella patens tissues after inoculation with Botrytis cinerea, Pythium irregulare and Pythium debaryanum, or after treatment with elicitors of Pectobacterium carotovorum ssp. carotovorum. Potato dextrose agar (PDA)‐ and water‐treated tissues were used as controls. Values are means and standard errors of three independent experiments.
Supporting info item
ACKNOWLEDGEMENTS
We gratefully acknowledge the IMSC International Moss Stock Center (Freiburg, Germany) for providing the Physcomitrella patens Gransden WT isolate. We thank Roberto Solano for helpful discussions and critical reading of the manuscript. We also thank Mats Hamberg for providing OPDA, Harvey Hoch for the dye solophenyl flavine, Mario Lalinde for picture illustrations and Claudia Piccini for statistical advice. This work was supported by Agencia Nacional de Investigación e Innovación (ANII) [grant FCE2007_376, fellowship BE_POS_2009_726 (A. Castro)] and Programa de Desarrollo de las Ciencias Básicas (PEDECIBA) Uruguay. The P. patens expressed sequence tags (ESTs) were obtained from the RIKEN Biological Research Center, Tsukuba, Japan.
REFERENCES
- AbuQamar, S. , Chen, X. , Dhawan, R. , Bluhm, B. , Salmeron, J. , Lam, S. , Dietrich, R.A. and Mengiste, T. (2006) Expression profiling and mutant analysis reveals complex regulatory networks involved in Arabidopsis response to Botrytis infection. Plant J. 48, 28–44. [DOI] [PubMed] [Google Scholar]
- Andersson, R.A. , Akita, M. , Pirhonen, M. , Gammelgård, E. and Valkonen, J.P.T. (2005) Moss–Erwinia pathosystem reveals possible similarities in pathogenesis and pathogen defense in vascular and nonvascular plants. J. Gen. Plant Pathol. 71, 23–28. [Google Scholar]
- Anterola, A. , Göbel, C. , Hornung, E. , Sellhorn, G. , Feussner, I. and Grimes, H. (2009) Physcomitrella patens has lipoxygenases for both eicosanoid and octadecanoid pathways. Phytochemistry, 70, 40–52. [DOI] [PubMed] [Google Scholar]
- Asai, S. and Yoshioka, H. (2009) Nitric oxide as a partner of reactive oxygen species participates in disease resistance to necrotrophic pathogen Botrytis cinerea in Nicotiana benthamiana . Mol. Plant–Microbe Interact. 22, 619–629. [DOI] [PubMed] [Google Scholar]
- Asai, S. , Mase, K. and Yoshioka, H. (2010) Role of nitric oxide and reactive oxide species in disease resistance to necrotrophic pathogens. Plant Signal. Behav. 5, 872–874. [DOI] [PMC free article] [PubMed] [Google Scholar]
- Asselbergh, B. , Curvers, K. , Franca, S.C. , Audenaert, K. , Vuylsteke, M. , Van Breusegem, F. and Höfte, M. (2007) Resistance to Botrytis cinerea in sitiens, an abscisic acid‐deficient tomato mutant, involves timely production of hydrogen peroxide and cell wall modifications in the epidermis. Plant Physiol. 144, 1863–1877. [DOI] [PMC free article] [PubMed] [Google Scholar]
- Audenaert, K. , De Meyer, G.B. and Höfte, M.M. (2002) Abscisic acid determines basal susceptibility of tomato to Botrytis cinerea and suppresses salicylic acid‐dependent signaling mechanisms. Plant Physiol. 128, 491–501. [DOI] [PMC free article] [PubMed] [Google Scholar]
- van Baarlen, P. , Woltering, E.J. , Staats, M. and van Kan, J.A.L. (2007) Histochemical and genetic analysis of host and non‐host interactions of Arabidopsis with three Botrytis species: an important role for cell death control. Mol. Plant Pathol. 8, 41–54. [DOI] [PubMed] [Google Scholar]
- Bhuiyan, N.H. , Selvaraj, G. , Wei, Y. and King, J. (2009) Gene expression profiling and silencing reveal that monolignol biosynthesis plays a critical role in penetration defence in wheat against powdery mildew invasion. J. Exp. Bot. 60, 509–521. [DOI] [PMC free article] [PubMed] [Google Scholar]
- Breithaupt, C. , Kurzbauer, R. , Schaller, F. , Stintzi, A. , Schaller, A. , Huber, R. , Macheroux, P. and Clausen, T. (2009) Structural basis of substrate specificity of plant 12‐oxophytodienoate reductases. J. Mol. Biol. 392, 1266–1277. [DOI] [PubMed] [Google Scholar]
- Browse, J. (2009) Jasmonate passes muster: a receptor and targets for the defense hormone. Annu. Rev. Plant Biol. 60, 183–205. [DOI] [PubMed] [Google Scholar]
- Chakravarthy, S. , Velásquez, A.C. , Ekengren, S.K. , Collmer, A. and Martin, G.B. (2010) Identification of Nicotiana benthamiana genes involved in pathogen‐associated molecular pattern‐triggered immunity. Mol. Plant–Microbe Interact. 23, 715–726. [DOI] [PubMed] [Google Scholar]
- Chehab, E.W. , Kim, S. , Savchenko, T. , Kliebenstein, D. , Dehesh, K. and Braam, J. (2011) Intronic T‐DNA insertion renders Arabidopsis opr3 a conditional jasmonic acid‐producing mutant. Plant Physiol. 156, 770–778. [DOI] [PMC free article] [PubMed] [Google Scholar]
- Chico, J.M. , Chini, A. , Fonseca, S. and Solano, R. (2008) JAZ repressors set the rhythm in jasmonate signaling. Curr. Opin. Plant Biol. 11, 1–9. [DOI] [PubMed] [Google Scholar]
- Chini, A. , Boter, M. and Solano, R. (2009) Plant oxylipins: COI1/JAZs/MYC2 as the core jasmonic acid‐signalling module. FEBS J. 276, 4682–4692. [DOI] [PubMed] [Google Scholar]
- Christianson, M.L. and Duffy, S.H. (2002) Dose‐dependent effect of salicylates in a moss, Funaria hygrometrica . J. Plant Growth Regul. 21, 200–208. [Google Scholar]
- Coram, T.E. , Wang, M. and Chen, X. (2008) Transcriptome analysis of the wheat–Puccinia striiformis f. sp. tritici interaction. Mol. Plant Pathol. 9, 157–169. [DOI] [PMC free article] [PubMed] [Google Scholar]
- Curvers, K. , Seifi, H. , Mouille, G. , de Rycke, R. , Asselbergh, B. , Van Hecke, A. , Vanderschaeghe, D. , Höfte, H. , Callewaert, N. , Van Breusegem, F. and Höfte, M. (2010) Abscisic acid deficiency causes changes in cuticle permeability and pectin composition that influence tomato resistance to Botrytis cinerea . Plant Physiol. 154, 847–860. [DOI] [PMC free article] [PubMed] [Google Scholar]
- Davey, M.L. and Currah, R.S. (2006) Interactions between mosses (Bryophyta) and fungi. Can. J. Bot. 84, 1509–1519. [Google Scholar]
- Davin, L.B. and Lewis, N.G. (2000) Dirigent proteins and dirigent sites explain the mystery of specificity of radical precursor coupling in lignan and lignin biosynthesis. Plant Physiol. 123, 453–462. [DOI] [PMC free article] [PubMed] [Google Scholar]
- Dickman, M.B. , Park, Y.K. , Oltersdorf, T. , Li, W. , Clemente, T. and French, R. (2001) Abrogation of disease development in plants expressing animal antiapoptotic genes. Proc. Natl. Acad. Sci. USA, 98, 6957–6962. [DOI] [PMC free article] [PubMed] [Google Scholar]
- van Doorn, W.G. , Beers, E.P. , Dangl, J.L. , Franklin‐Tong, V.E. , Gallois, P. , Hara‐Nishimura, I. , Jones, A.M. , Kawai‐Yamada, M. , Lam, E. , Mundy, J. , Mur, L.A. , Petersen, M. , Smertenko, A. , Taliansky, M. , Van Breusegem, F. , Wolpert, T. , Woltering, E. , Zhivotovsky, B. and Bozhkov, P.V. (2011) Morphological classification of plant cell deaths. Cell Death Differ. 18, 1241–1246. [DOI] [PMC free article] [PubMed] [Google Scholar]
- Edelmann, H.G. , Neinhuis, C. , Jarvis, M. , Evans, B. , Fischer, E. and Barthlott, W. (1998) Ultrastructure and chemistry of the cell wall of the moss Rhacocarpus purpurascens (Rhacocarpaceae): a puzzling architecture among plants. Planta, 206, 315–321. [Google Scholar]
- El Oirdi, M. and Bouarab, K. (2007) Plant signalling components EDS1 and SGT1 enhance disease caused by the necrotrophic pathogen Botrytis cinerea . New Phytol. 175, 131–139. [DOI] [PubMed] [Google Scholar]
- El Oirdi, M. , El Rahman, T.A. , Rigano, L. , El Hadrami, A. , Rodriguez, M.C. , Daayf, F. , Vojnov, A. and Bouarab, K. (2011) Botrytis cinerea manipulates the antagonistic effects between immune pathways to promote disease development in tomato. Plant Cell, 23, 2405–2421. [DOI] [PMC free article] [PubMed] [Google Scholar]
- Espiñeira, J.M. , Novo, U.E. , Gómez Ros, L.V. , Carrión, J.S. , Merino, F. , Ros Barceló, A. and Pomar, F. (2011) Distribution of lignin monomers and the evolution of lignification among lower plants. Plant Biol. 13, 59–68. [DOI] [PubMed] [Google Scholar]
- Ferrari, S. , Plotnikova, J.M. , De Lorenzo, G. and Ausubel, F.M. (2003) Arabidopsis local resistance to Botrytis cinerea involves salicylic acid and camalexin and requires EDS4 and PAD2, but not SID2, EDS5 or PAD4. Plant J. 35, 193–205. [DOI] [PubMed] [Google Scholar]
- Fonseca, S. , Chini, A. , Hamberg, M. , Adie, B. , Porzel, A. , Kramell, R. , Miersch, O. , Wasternack, C. and Solano, R. (2009) (+)‐7‐iso‐Jasmonoyl‐L‐isoleucine is the endogenous bioactive jasmonate. Nat. Chem. Biol. 5, 344–350. [DOI] [PubMed] [Google Scholar]
- Fung, R.W. , Gonzalo, M. , Fekete, C. , Kovacs, L.G. , He, Y. , Marsh, E. , McIntyre, L.M. , Schachtman, D.P. and Qiu, W. (2008) Powdery mildew induces defense oriented reprogramming of the transcriptome in a susceptible but not in a resistant grapevine. Plant Physiol. 146, 236–249. [DOI] [PMC free article] [PubMed] [Google Scholar]
- Gachon, C. and Saindrenan, P. (2004) Real‐time PCR monitoring of fungal development in Arabidopsis thaliana infected by Alternaria brassicicola and Botrytis cinerea . Plant Physiol. Biochem. 42, 367–371. [DOI] [PubMed] [Google Scholar]
- Glazebrook, J. (2005) Contrasting mechanisms of defense against biotrophic and necrotrophic pathogens. Annu. Rev. Phytopathol. 43, 205–227. [DOI] [PubMed] [Google Scholar]
- Govrin, E.M. and Levine, A. (2000) The hypersensitive response facilitates plant infection by the necrotrophic pathogen Botrytis cinerea . Curr. Biol. 10, 751–757. [DOI] [PubMed] [Google Scholar]
- Govrin, E.M. and Levine, A. (2002) Infection of Arabidopsis with a necrotrophic pathogen, Botrytis cinerea, elicits various defense responses but does not induce systemic acquired resistance (SAR). Plant Mol. Biol. 1, 267–276. [DOI] [PubMed] [Google Scholar]
- Greenberg, J.T. and Yao, N. (2004) The role and regulation of programmed cell death in plant–pathogen interactions. Cell. Microbiol. 6, 201–211. [DOI] [PubMed] [Google Scholar]
- Hoch, H.C. , Galvani, C.D. , Szarowski, D.H. and Turner, J.N. (2005) Two new fluorescent dyes applicable for visualization of fungal cell walls. Mycologia, 97, 580–588. [DOI] [PubMed] [Google Scholar]
- van Kan, J.A. (2006) Licensed to kill: the lifestyle of a necrotrophic plant pathogen. Trends Plant Sci. 11, 247–253. [DOI] [PubMed] [Google Scholar]
- Lam, E. (2004) Controlled cell death, plant survival and development. Nat. Rev. Mol. Cell. Biol. 5, 305–315. [DOI] [PubMed] [Google Scholar]
- Lam, E. (2008) Programmed cell death in plants: orchestrating an intrinsic suicide program within walls. Crit. Rev. Plant Sci. 27, 413–423. [Google Scholar]
- Lawton, M. and Saidasan, H. (2009) Pathogenesis in mosses. Annu. Plant Rev. 36, 298–339. [Google Scholar]
- Lee, K.J.D. , Knight, C.D. and Knox, J.P. (2005) Physcomitrella patens: a moss system for the study of plant cell walls. Plant Biosyst. 139, 16–19. [Google Scholar]
- Levine, A. , Tenhaken, R. , Dixon, R. and Lamb, C. (1994) H2O2 from the oxidative burst orchestrates the plant hypersensitive disease resistance response. Cell, 79, 583–593. [DOI] [PubMed] [Google Scholar]
- Li, W. , Liu, B. , Yu, L. , Feng, D. , Wang, H. and Wang, J. (2009) Phylogenetic analysis, structural evolution and functional divergence of the 12‐oxophytodienoate acid reductase gene family in plants. BMC Evol. Biol. 9, 90. [DOI] [PMC free article] [PubMed] [Google Scholar]
- Llorente, F. , Muskett, P. , Sánchez‐Vallet, A. , López, G. , Ramos, B. , Sánchez‐Rodríguez, C. , Jordá, L. , Parker, J. and Molina, A. (2008) Repression of the auxin response pathway increases Arabidopsis susceptibility to necrotrophic fungi. Mol. Plant, 1, 496–509. [DOI] [PubMed] [Google Scholar]
- López, M.A. , Bannenberg, G. and Castresana, C. (2008) Controlling hormone signaling is a plant and pathogen challenge for growth and survival. Curr. Opin. Plant Biol. 11, 420–427. [DOI] [PubMed] [Google Scholar]
- Lucena, M.A. , Romero‐Aranda, R. , Mercado, J.A. , Cuartero, J. , Valpuesta, V. and Quesada, M.A. (2003) Structural and physiological changes in the roots of tomato plants over‐expressing a basic peroxidase. Physiol. Plant. 118, 422–429. [Google Scholar]
- Maor, R. , Haskin, S. , Levi‐Kedmi, H. and Sharon, A. (2004) In planta production of indole‐3‐acetic acid by Colletotrichum gloeosporioides f. sp. aeschynomene . Appl. Environ. Microbiol. 70, 1852–1854. [DOI] [PMC free article] [PubMed] [Google Scholar]
- Mellersh, D.G. , Foulds, I.V. , Higgins, V.J. and Heath, M.C. (2002) H2O2 plays different roles in determining penetration failure in three diverse plant–fungal interactions. Plant J. 29, 257–268. [DOI] [PubMed] [Google Scholar]
- Morel, J.B. and Dangl, J.L. (1997) The hypersensitive response and the induction of cell death in plants. Cell Death Differ. 4, 671–683. [DOI] [PubMed] [Google Scholar]
- Mueller, S. , Hilbert, B. , Dueckershoff, K. , Roitsch, T. , Krischke, M. , Mueller, M.J. and Berger, S. (2008) General detoxification and stress responses are mediated by oxidized lipids through TGA transcription factors in Arabidopsis. Plant Cell, 20, 768–785. [DOI] [PMC free article] [PubMed] [Google Scholar]
- Nishiyama, T. , Fujita, T. , Shin‐I, T. , Seki, M. , Nishide, H. , Uchiyama, I. , Kamiya, A. , Carninci, P. , Hayashizaki, Y. , Shinozaki, K. , Kohara, Y. and Hasebe, M. (2003) Comparative genomics of Physcomitrella patens gametophytic transcriptome and Arabidopsis thaliana: implication for land plant evolution. Proc. Natl. Acad. Sci. USA, 100, 8007–8012. [DOI] [PMC free article] [PubMed] [Google Scholar]
- Oliver, J.P. , Castro, A. , Gaggero, C. , Cascón, T. , Schmelz, E.A. , Castresana, C. and Ponce de León, I. (2009) Pythium infection activates conserved plant defense responses in mosses. Planta, 230, 569–579. [DOI] [PubMed] [Google Scholar]
- Pfaffl, M.W. (2001) A new mathematical model for relative quantification in real‐time RT‐PCR. Nucleic Acids Res. 29, 45. [DOI] [PMC free article] [PubMed] [Google Scholar]
- Ponce de León, I. (2011) The moss Physcomitrella patens as a model system to study interactions between plants and phytopathogenic fungi and oomycetes. J. Pathog. 2011, Article ID 719873, 6. [DOI] [PMC free article] [PubMed] [Google Scholar]
- Ponce de León, I. , Oliver, J.P. , Castro, A. , Gaggero, C. , Bentancor, M. and Vidal, S. (2007) Erwinia carotovora elicitors and Botrytis cinerea activate defense responses in Physcomitrella patens . BMC Plant Biol. 8, 52. [DOI] [PMC free article] [PubMed] [Google Scholar]
- Popper, Z.A. (2008) Evolution and diversity of green plant cell walls. Curr. Opin. Plant Biol. 11, 286–292. [DOI] [PubMed] [Google Scholar]
- Prost, I. , Dhondt, S. , Rothe, G. , Vicente, J. , Rodriguez, M.J. , Kift, N. , Carbonne, F. , Griffiths, G. , Esquerré‐Tugayé, M.‐T. , Rosahl, S. , Castresana, C. , Hamberg, M. and Joëlle Fournier, J. (2005) Evaluation of the antimicrobial activities of plant oxylipins supports their involvement in defense against pathogens. Plant Physiol. 139, 1902–1913. [DOI] [PMC free article] [PubMed] [Google Scholar]
- Rantakari, A. , Virtaharju, O. , Vähämiko, S. , Taira, S. , Palva, E.T. , Saarilahti, H.T. and Romantschuk, M. (2001) Type III secretion contributes to the pathogenesis of the soft‐rot pathogen Erwinia carotovora. Partial characterization of the hrp gene cluster. Mol. Plant–Microbe Interact. 14, 962–968. [DOI] [PubMed] [Google Scholar]
- Rensing, S.A. , Lang, D. , Zimmer, A.D. , Terry, A. , Salamov, A. , Shapiro, H. , Nishiyama, T. , Perroud, P.F. , Lindquist, E.A. , Kamisugi, Y. , Tanahashi, T. , Sakakibara, K. , Fujita, T. , Oishi, K. , Shin‐I , T., Kuroki , Y., Toyoda , A., Suzuki , Y., Hashimoto , S., Yamaguchi , K., Sugano , S., Kohara , Y., Fujiyama , A., Anterola , A., Aoki , S., Ashton , N., Barbazuk , W.B., Barker , E., Bennetzen , J.L., Blankenship , R., Cho , S.H., Dutcher , S.K., Estelle , M., Fawcett , J.A., Gundlach , H., Hanada , K., Heyl , A., Hicks , K.A., Hughes , J., Lohr , M., Mayer , K., Melkozernov , A., Murata , T., Nelson , D.R., Pils , B., Prigge , M., Reiss , B., Renner , T., Rombauts , S., Rushton , P.J., Sanderfoot , A., Schween , G., Shiu , S.H., Stueber , K., Theodoulou , F.L., Tu , H., Van de Peer , Y., Verrier , P.J., Waters , E., Wood , A., Yang , L., Cove , D., Cuming , A.C., Hasebe , M., Lucas , S., Mishler , B.D., Reski , R., Grigoriev , I.V., Quatrano , R.S. and Boore , J.L. (2008) The Physcomitrella genome reveals evolutionary insights into the conquest of land by plants. Science, 4, 64–69. [DOI] [PubMed] [Google Scholar]
- Robert‐Seilaniantz, A. , Navarro, L. , Bari, R. and Jones, J.D. (2007) Pathological hormone imbalances. Curr. Opin. Plant Biol. 10, 372–379. [DOI] [PubMed] [Google Scholar]
- Robert‐Seilaniantz, A. , Grant, M. and Jones, J.D. (2011) Hormone crosstalk in plant disease and defense: more than just jasmonate‐salicylate antagonism. Annu. Rev. Phytopathol. 8, 317–343. [DOI] [PubMed] [Google Scholar]
- Schaefer, D. , Zrÿd, J.P. , Knight, C.D. and Cove, D.J. (1991) Stable transformation of the moss Physcomitrella patens . Mol. Gen. Genet. 226, 418–424. [DOI] [PubMed] [Google Scholar]
- Schaefer, D.G. (2002) A new moss genetics: targeted mutagenesis in Physcomitrella patens . Annu. Rev. Plant Biol. 53, 477–501. [DOI] [PubMed] [Google Scholar]
- Schaefer, D.G. and Zrÿd, J.P. (2001) The moss Physcomitrella patens, now and then. Plant Physiol. 127, 1430–1438. [PMC free article] [PubMed] [Google Scholar]
- Schmelz, E.A. , Engelberth, J. , Tumlinson, J.H. , Block, A. and Alborn, H.T. (2004) The use of vapor phase extraction in metabolic profiling of phytohormones and other metabolites. Plant J. 39, 790–808. [DOI] [PubMed] [Google Scholar]
- Siewers, V. , Smedsgaard, J. and Tudzynski, P. (2004) The P450 monooxygenase BcABA1 is essential for abscisic acid biosynthesis in Botrytis cinerea . Appl. Environ. Microbiol. 70, 3868–3876. [DOI] [PMC free article] [PubMed] [Google Scholar]
- Staswick, P.E. , Su, W.P. and Howell, S.H. (1992) Methyl jasmonate inhibition of root‐growth and induction of a leaf protein are decreased in an Arabidopsis thaliana mutant. Proc. Natl. Acad. Sci. USA, 89, 6837–6840. [DOI] [PMC free article] [PubMed] [Google Scholar]
- Stintzi, A. , Weber, H. , Reymond, P. , Browse, J. and Farmer, E.E. (2001) Plant defense in the absence of jasmonic acid: the role of cyclopentenones. Proc. Natl. Acad. Sci. USA, 98, 12 837–12 842. [DOI] [PMC free article] [PubMed] [Google Scholar]
- Stumpe, M. , Göbel, C. , Faltin, B. , Beike, A.K. , Hause, B. , Himmelsbach, K. , Bode, J. , Kramell, R. , Wasternack, C. , Frank, W. , Reski, R. and Feussner, I. (2010) The moss Physcomitrella patens contains cyclopentenones but no jasmonates: mutations in allene oxide cyclase lead to reduced fertility and altered sporophyte morphology. New Phytol. 188, 740–749. [DOI] [PubMed] [Google Scholar]
- Swiatek, A. , Lenjou, M. , Van Bockstaele, D. , Inze, D. and Van Onckelen, H. (2002) Differential effect of jasmonic acid and abscisic acid on cell cycle progression in tobacco BY‐2 cells. Plant Physiol. 128, 201–211. [PMC free article] [PubMed] [Google Scholar]
- Taki, N. , Sasaki‐Sekimoto, Y. , Obayashi, T. , Kikuta, A. , Kobayashi, K. , Ainai, T. , Yagi, K. , Sakurai, N. , Suzuki, H. , Masuda, T. , Takamiya, K. , Shibata, D. , Kobayashi, Y. and Ohta, H. (2005) 12‐Oxo‐phytodienoic acid triggers expression of a distinct set of genes and plays a role in wound‐induced gene expression in Arabidopsis . Plant Physiol. 139, 1268–1283. [DOI] [PMC free article] [PubMed] [Google Scholar]
- Tanaka, E. , Koga1, H. , Mori, M. and Mori, M. (2011) Auxin production by the rice blast fungus and its localization in host tissue. J. Phytopathol. 159, 522–530. [Google Scholar]
- Ton, J. , Flors, V. and Mauch‐Mani, B. (2009) The multifaceted role of ABA in disease resistance. Trends Plant Sci. 14, 310–317. [DOI] [PubMed] [Google Scholar]
- Vellosillo, T. , Martinez, M. , Lopez, M.A. , Vicente, J. , Cascon, T. , Dolan, L. , Hamberg, M. and Castresana, C. (2007) Oxylipins produced by the 9‐lipoxygenase pathway in Arabidopsis regulate lateral root development and defense responses through a specific signaling cascade. Plant Cell, 19, 831–846. [DOI] [PMC free article] [PubMed] [Google Scholar]
- Veronese, P. , Nakagami, H. , Bluhm, B. , Abuqamar, S. , Chen, X. , Salmeron, J. , Dietrich, R.A. , Hirt, H. and Mengiste, T. (2006) The membrane‐anchored Botrytis‐induced kinase1 plays distinct roles in Arabidopsis resistance to necrotrophic and biotrophic pathogens. Plant Cell, 18, 257–273. [DOI] [PMC free article] [PubMed] [Google Scholar]
- Vicedo, B. , Flors, V. , de la O Leyva, M. , Finiti, I. , Kravchuk, Z. , Real, M.D. , García‐Agustín, P. and González‐Bosch, C. (2009) Hexanoic acid‐induced resistance against Botrytis cinerea in tomato plants. Mol. Plant–Microbe Interact. 22, 1455–1465. [DOI] [PubMed] [Google Scholar]
- Vidal, S. , Ponce de León, I. , Denecke, J. and Palva, E.T. (1997) Salicylic acid and the plant pathogen Erwinia carotovora induce defense genes via antagonistic pathways. Plant J. 11, 115–123. [Google Scholar]
- Wang, D. , Pajerowska‐Mukhtar, K. , Culler, A.H. and Dong, X. (2007) Salicylic acid inhibits pathogen growth in plants through repression of the auxin signaling pathway. Curr. Biol. 17, 1784–1790. [DOI] [PubMed] [Google Scholar]
- Wang, Y. , Nowak, G. , Culley, D. , Hadwiger, L.A. and Fristensky, B. (1999) Constitutive expression of pea defense gene DRR206 confers resistance to blackleg (Leptosphaeria maculans) disease in transgenic canola (Brassica napus). Mol. Plant–Microbe Interact. 12, 410–418. [Google Scholar]
- Wang, Y.P. and Fristensky, B. (2001) Transgenic canola lines expressing pea defense gene DRR206 have resistance to aggressive blackleg isolates and to Rhizoctonia solani . Mol. Breed. 8, 263–271. [Google Scholar]
- Wolf, L. , Rizzini, L. , Stracke, R. , Ulm, R. and Rensing, S.A. (2010) The molecular and physiological responses of Physcomitrella patens to ultraviolet‐B radiation. Plant Physiol. 153, 1123–1134. [DOI] [PMC free article] [PubMed] [Google Scholar]
- Xu, Z. , Zhang, D. , Hu, J. , Zhou, X. , Ye, X. , Reichel, K.L. , Stewart, N.R. , Syrenne, R.D. , Yang, X. , Gao, P. , Shi, W. , Doeppke, C. , Sykes, R.W. , Burris, J.N. , Bozell, J.J. , Cheng, M.Z. , Hayes, D.G. , Labbe, N. , Davis, M. , Stewart, C.N. Jr and Yuan, J.S. (2009) Comparative genome analysis of lignin biosynthesis gene families across the plant kingdom. BMC Bioinformatics, 10, S3. [DOI] [PMC free article] [PubMed] [Google Scholar]
- Yan, Y. , Stolz, S. , Chételat, A. , Reymond, P. , Pagni, M. , Dubugnon, L. and Farmer, E.E. (2007) A downstream mediator in the growth repression limb of the jasmonate pathway. Plant Cell, 19, 2470–2483. [DOI] [PMC free article] [PubMed] [Google Scholar]
- Yang, W. , Devaiah, S.P. , Pan, X. , Isaac, G. , Welti, R. and Wang, X. (2007) AtPLAI is an acyl hydrolase involved in basal jasmonic acid production and Arabidopsis resistance to Botrytis cinerea . J. Biol. Chem. 22, 18 116–18 128. [DOI] [PubMed] [Google Scholar]
- Yasuda, M. , Ishikawa, A. , Jikumaru, Y. , Seki, M. , Umezawa, T. , Asami, T. , Maruyama‐Nakashita, A. , Kudo, T. , Shinozaki, K. , Yoshida, S. and Nakashita, H. (2008) Antagonistic interaction between systemic acquired resistance and the abscisic acid‐mediated abiotic stress response in Arabidopsis . Plant Cell, 20, 1678–1692. [DOI] [PMC free article] [PubMed] [Google Scholar]
Associated Data
This section collects any data citations, data availability statements, or supplementary materials included in this article.
Supplementary Materials
Table S1 Endogenous free linolenic acid (LNA), 12‐oxo‐phytodienoic acid (OPDA) and jasmonic acid (JA) levels [ng/g fresh weight (FW)] were analysed at the indicated time points in Physcomitrella patens tissues after inoculation with Botrytis cinerea, Pythium irregulare and Pythium debaryanum, or after treatment with elicitors of Pectobacterium carotovorum ssp. carotovorum. Potato dextrose agar (PDA)‐ and water‐treated tissues were used as controls. Values are means and standard errors of three independent experiments.
Supporting info item