

Summary
The Stagonospora nodorum–wheat interaction involves multiple pathogen‐produced necrotrophic effectors that interact directly or indirectly with specific host gene products to induce the disease Stagonospora nodorum blotch (SNB). Here, we used a tetraploid wheat mapping population to identify and characterize a sixth effector–host gene interaction in the wheat–S. nodorum system. Initial characterization of the effector SnTox5 indicated that it is a proteinaceous necrotrophic effector that induces necrosis on host lines harbouring the Snn5 sensitivity gene, which was mapped to the long arm of wheat chromosome 4B. On the basis of ultrafiltration, SnTox5 is probably in the size range 10–30 kDa. Analysis of SNB development in the mapping population indicated that the SnTox5–Snn5 interaction explains 37%–63% of the variation, demonstrating that this interaction plays a significant role in disease development. When the SnTox5–Snn5 and SnToxA–Tsn1 interactions occurred together, the level of SNB was increased significantly. Similar to several other interactions in this system, the SnTox5–Snn5 interaction is light dependent, suggesting that multiple interactions may exploit the same pathways to cause disease.
Introduction
Phaeosphaeria nodorum (E. Mull.) Hedjar (anamorph: Stagonospora nodorum), causal agent of Stagonospora nodorum blotch (SNB), is a major problem for wheat producers throughout the world. Resistance to SNB has been shown to be a complex quantitatively inherited trait (reviewed in Xu et al., 2004) and, until recently, the underlying mechanism of virulence and resistance was not understood. However, numerous recent studies to dissect wheat–S. nodorum interactions have elucidated the genetic basis of this system at the classical and molecular levels (reviewed in Friesen and Faris, 2010; Friesen et al., 2008a).
Several economically important necrotrophic effectors (formerly referred to as host‐selective toxins) are produced by necrotrophic fungi, especially those in the Dothideomycete class of the Ascomycetes (Wolpert et al., 2002). Most of the necrotrophic effectors described initially were defined as secondary metabolites, but several proteinaceous necrotrophic effectors have been identified recently (Friesen and Faris, 2010; Wolpert et al., 2002), ToxA being the best characterized. Nearly identical ToxA genes have been identified in Pyrenophora tritici‐repentis (Ballance et al., 1996; Ciuffetti et al., 1997) and S. nodorum (Friesen et al., 2006), and the ToxA protein serves as an effector of pathogenicity for both pathogens (Liu et al., 2006). Recent work has shown that Tsn1, the sensitivity gene associated with ToxA, produced by both S. nodorum (SnToxA) and P. tritici‐repentis (Ptr ToxA), contains resistance gene‐like features. For example, Tsn1 contains nucleotide‐binding (NB) and leucine‐rich repeat (LRR) domains, but also a serine/threonine protein kinase domain (Faris et al., 2010). The presence of a dominant susceptibility gene belonging to the NB‐LRR class, which is typically found to be associated with resistance, provides evidence that S. nodorum and P. tritici‐repentis, as well as other necrotrophic fungi (Lorang et al., 2007; Nagy and Bennetzen, 2008), can subvert host resistance mechanisms to induce disease.
To date, we have identified five necrotrophic effector–host gene interactions that all play significant roles in SNB disease development, accounting for a range of 18%–95% of disease development in various segregating host populations (reviewed in Friesen and Faris, 2010; Friesen et al., 2008a). Here, we characterized a sixth interaction, including the partial purification and initial characterization of the pathogen‐produced necrotrophic effector (SnTox5), the identification and mapping of the corresponding host gene (Snn5) and the evaluation of the effects of a compatible SnTox5–Snn5 interaction in causing disease. The current work adds another significant piece of evidence that the S. nodorum–wheat system involves pathogen‐produced necrotrophic effector proteins that act in effector‐triggered susceptibility to induce disease. In addition, we describe the genetic relationship of the SnTox5–Snn5 interaction with the SnToxA–Tsn1 and SnTox3–Snn3–B1 interactions, giving insight into the disease manifestation of this complex necrotrophic host–pathogen system.
Results
Identification, genetic analysis and map location of Snn5, the SnTox5 sensitivity gene
Evaluation of the LP749 population for reaction to Sn2000 culture filtrates indicated that the Tsn1 locus was a significant factor in conferring sensitivity to the necrosis‐inducing components of the cultures, which was expected as Sn2000 is known to produce SnToxA (Fig. 1). However, in addition to Tsn1, a locus on chromosome 4B was also found to govern reaction to Sn2000 culture filtrates and was more significant than Tsn1 (Fig. 1). This indicated that an effector other than SnToxA was present in the culture filtrates, and, because the host sensitivity locus was on chromosome 4B, and no S. nodorum effector sensitivity has yet been described on 4B, this other effector was newly identified. Therefore, we propose to designate this effector as SnTox5 and the corresponding host sensitivity gene on wheat chromosome 4B as Snn5.
Figure 1.
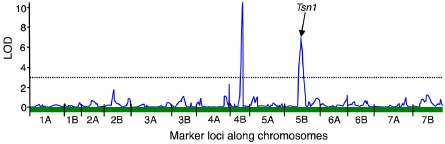
A genomic scan of marker loci in the LP749 population associated with reaction to Sn2000 culture filtrates (containing both SnToxA and SnTox5) using simple linear regression. Logarithm of the odds (LOD) values are plotted along the y axis and marker loci on the 14 chromosomes are arranged end‐to‐end along the x axis. The significant LOD threshold of 3.1 is indicated by the dotted line. The significant peak on chromosome 5B is caused by the Tsn1 locus and the peak on 4B is the SnTox5 necrotrophic effector sensitivity locus identified in this research, designated as Snn5.
The LP749 parental line Lebsock harbours sensitivity to SnToxA, SnTox3 and SnTox5. Therefore, we used the fungal strain Sn2000KO6‐1 for SnTox5 production and genetic mapping of the Snn5 locus because this strain does not produce SnToxA or SnTox3 (Friesen et al., 2006). When infiltrated with culture filtrates of Sn2000KO6‐1, Lebsock and 64 of the 120 doubled haploid (DH) lines showed necrosis within the infiltrated area, 3 days after infiltration, whereas PI94749 and the remaining 56 DH lines showed no necrosis. Therefore, the segregation ratio of the LP749 population for reaction to Sn2000KO6‐1 was not significantly different from 1:1 (χ 2 = 0.533, P = 0.465), indicating that a single gene, Snn5, was responsible for sensitivity to SnTox5 ( Table 1).
Table 1.
Genetic analysis of Snn5 in the Lebsock × PI94749 F2 population and of Snn5, Tsn1 and Snn3 in the LP749 doubled haploid population
| Population | Genotype | Observed | Expected | χ 2 | P |
|---|---|---|---|---|---|
| LP F2 | Snn5_/snn5snn5 | 24:8 | 3:1 | 0 | 1.00 |
| LP749 | Snn5Snn5/snn5snn5 | 64:56 | 1:1 | 0.533 | 0.465 |
| LP749 | Tsn1Tsn1/tsn1tsn1 | 63:57 | 1:1 | 0.3 | 0.584 |
| LP749 | Snn3Snn3/snn3snn3 | 51:69 | 1:1 | 2.7 | 0.100 |
F2 individuals of a cross between Lebsock and PI 94749 were used to evaluate the dominance of Snn5. A total of 32 F2 individuals was infiltrated with Sn2000KO6‐1 culture filtrates; they segregated in a ratio of 24:8 (sensitive : insensitive), which perfectly fits a 3:1 ratio (χ 2 = 0.0, P = 1.0) (Table 1), indicating that Snn5 functions in a dominant manner to confer sensitivity to SnTox5, similar to all the other necrotrophic effector sensitivity genes in the S. nodorum–wheat system.
The phenotypic scores of the LP749 DH population for reaction to Sn2000KO6‐1 culture filtrates were used to infer Snn5 genotypes, and subsequent linkage analysis indicated that Snn5 was located on the long arm of chromosome 4B (Fig. 3). Three additional simple sequence repeat (SSR) markers, Xcfa2149, Xcfd22 and Xwmc349, were also placed on this linkage group. The Snn5 locus mapped 2.8 cM proximal to the marker Xwmc349 and 13.3 cM distal to markers Xbarc163 and Xcfd22.
Figure 3.
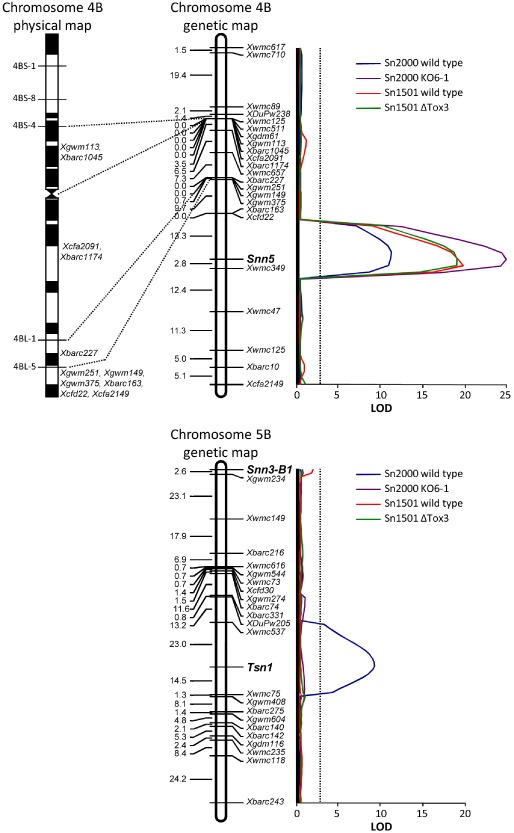
Genetic mapping and interval regression analysis of the Snn5, Tsn1 and Snn3–B1 loci. Genetic linkage maps of chromosomes 4B and 5B developed in the LP749 population are in the middle. Marker loci are shown along the right of the maps and centiMorgan distances along the left. The Snn5, Tsn1 and Snn3–B1 loci are indicated in bold. The deletion‐based physical map of chromosome 4B (Sourdille et al., 2004) is shown to the left of the 4B linkage map. Comparisons of common markers demonstrate that the Snn5 locus is distal to the 4BL‐5 breakpoint and therefore lies in the distal 15% of the chromosome arm. Results of the interval regression analysis using SNB data obtained from inoculation of the LP749 population with Stagonospora nodorum isolates Sn2000 (SnToxA + SnTox5), Sn2000KO6‐1 (SnTox5), Sn1501 (SnTox3 + SnTox5) and Sn1501ΔTox3 (SnTox5) are shown to the right of the linkage maps. Logarithm of the odds (LOD) values are plotted along the x axis and the significance threshold of 3.1 is indicated by the dotted line.
Markers along the genetic linkage map of chromosome 4B were compared with the deletion‐based physical map of chromosome 4B constructed by Sourdille et al. (2004) to determine the deletion interval encompassing the Snn5 locus (Fig. 3). Markers Xgwm251, Xgwm149, Xgwm375, Xbarc163, Xcfd22 and Xcfa2149 were located distal to the 4BL‐5 deletion breakpoint by Sourdille et al. (2004). Therefore, all markers distal to Xbarc227, including Snn5, are probably located in the most distal deletion bin of 4BL, which accounts for approximately 15% of the chromosome arm.
Separation parameters and initial characterization of SnTox5
Dialysed culture filtrates containing SnTox5 were subjected to cation exchange chromatography using a 5‐mL SPXL cation exchange column (GE Healthcare, Waukesha, WI, USA). The strongest SnTox5 activity eluted between 60 and 110 mm NaCl (data not shown). Size estimation was performed by ultrafiltration using 3‐, 10‐ and 30‐kDa molecular weight cut‐off (MWCO) Centricon ultrafiltration filters. SnTox5 was identified in filtrates of the 30‐kDa filter, but not in the filtrates of the 3‐ or 10‐kDa filters. This result indicates that SnTox5 is between 10 and 30 kDa in size (Fig. 2a–g).
Figure 2.
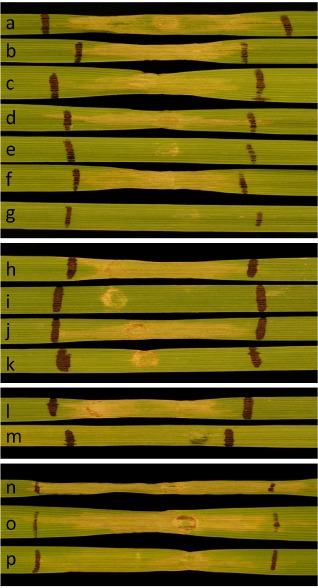
Characterization of SnTox5 using culture filtrates of Sn2000KO6‐1, an isolate that produces SnTox5, but does not produce SnTox3 or SnToxA. All reactions are on the Snn5 differential line LP749‐29. Size estimation of SnTox5 using molecular weight cut‐off filters (a–g): (a) culture filtrate reaction; (b) 30‐kDa concentrate; (c) 30‐kDa filtrate; (d) 10‐kDa concentrate; (e) 10‐kDa filtrate; (f) 3‐kDa concentrate; (g) 3‐kDa filtrate. Sensitivity to Pronase (h–k): (h) culture filtrate alone; (i) Pronase alone (1 mg/mL); (j) culture filtrate diluted to the same concentration as leaf (k) with water alone (5% dilution); (k) culture filtrate with Pronase at 1 mg/mL final concentration. Evaluation of light dependence (l, m): (l) 12‐h photoperiod for 48 h after infiltration ; (m) 48 h of darkness after infiltration. Evaluation of SnTox5 sensitivity to heat treatment (n–p): (n) culture filtrate unboiled; (o) culture filtrate subjected to boiling water for 30 min; (p) culture filtrate subjected to boiling water for 60 min.
Pronase, a combination of exo‐ and endoproteases, was used to verify the proteinaceous nature of SnTox5. Culture filtrates containing active SnTox5 subjected to Pronase treatment at a final concentration of 1 mg/mL showed no signs of necrosis production on LP749‐29 after 48 h. However, the same culture filtrate diluted to the same concentration in water without Pronase showed complete necrosis after the same time period. Pronase alone showed no reaction on LP749‐29 (Fig. 2h–k).
Because other effector–host interactions have been shown to be dependent on or influenced by light, including SnToxA–Tsn1, SnTox1–Snn1, SnTox2–Snn2 and SnTox4–Snn4, light dependence was evaluated. The SnTox5 differential line LP749‐29 was used in light dependence experiments because it is sensitive to SnTox5, but not SnToxA or SnTox3. Culture filtrates of Sn2000 KO6‐1 containing active SnTox5 were infiltrated into secondary leaves of LP749‐29 that had been kept in the dark for 12 h. After infiltration, plants were either placed in the dark for 48 h or under a 12‐h photoperiod for 48 h. Plants treated in the dark for 48 h did not develop necrosis, whereas plants subjected to a 12‐h photoperiod developed visible necrosis at 48 h, indicating that the ability of a compatible SnTox5–Snn5 interaction to cause cell death is dependent on light (Fig. 2l–m).
Heat stability was evaluated by boiling Sn2000 KO6‐1 culture filtrates for 30 and 60 min, followed by infiltration into leaves of LP749‐29 (Fig. 2n–p). Both the 30‐ and 60‐min treatments maintained activity on LP749‐29, although a significant reduction in activity was visible in the 60‐min treatment (Fig. 2p).
Characterization of the role of the SnTox5–Snn5 interaction and its relationship with the SnToxA–Tsn1 and SnTox3–Snn3–B1 interactions in disease development
Analysis of the mean disease reaction types conferred by S. nodorum isolate Sn2000 revealed quantitative trait loci (QTLs) on chromosome arms 4BL and 5BL, corresponding to the Snn5 and Tsn1 loci, respectively, which were significantly associated with disease (Fig. 3). Susceptibility was conferred by Snn5 and Tsn1 alleles contributed by Lebsock, which individually accounted for 37% and 31% of the variation, respectively (Table 2); together, they accounted for 60% of the variation (data not shown). This result was not unexpected, given the fact that Sn2000 produces the effectors SnTox5 and SnToxA. It also indicates that the effects of the SnTox5–Snn5 and SnToxA–Tsn1 interactions are working together and independently to play prominent roles in conferring SNB susceptibility.
Table 2.
Quantitative trait locus (QTL) analysis of effector sensitivity loci in the LP749 population on inoculation of the population with Stagonospora nodorum strains Sn2000 (SnToxA + SnTox5), Sn2000KO6‐1 (SnTox5), Sn1501 (SnTox3 + SnTox5) and Sn1501ΔSnTox3 (SnTox5)
| Locus | Chromosome arm | Sn2000 | Sn2000KO6‐1 | Sn1501 | Sn1501ΔSnTox3 | ||||||||
|---|---|---|---|---|---|---|---|---|---|---|---|---|---|
| LOD | R 2 | Add. effects | LOD | R 2 | Add. effects | LOD | R 2 | Add. effects | LOD | R 2 | Add. effects | ||
| Snn3‐B1 | 5BS | –a | – | – | – | – | – | 2.0 | 0.03 | –0.17 | NS | NS | NS |
| Snn5 | 4BL | 11.6 | 0.37 | –0.57 | 25.0 | 0.63 | –0.79 | 19.8 | 0.53 | –0.74 | 18.5 | 0.51 | –0.71 |
| Tsn1 | 5BL | 9.1 | 0.31 | –0.51 | NS | NS | NS | – | – | – | – | – | – |
NS, not significant.
–, the effector recognized by the corresponding sensitivity locus is not produced by the given isolates; therefore, the interaction is not relevant.
Further analysis of Sn2000 phenotypic data (Table 3) showed that genotypes harbouring either susceptibility allele (Snn5Snn5/tsn1tsn1 or snn5snn5/Tsn1Tsn1 genotype) or both alleles (Snn5Snn5/Tsn1Tsn1) gave a significantly higher disease reaction than did genotypes harbouring neither allele (snn5snn5/tsn1tsn1). In the case of Sn2000, the SnTox5–Snn5 and SnToxA–Tsn1 interactions induced similar amounts of disease, and lines harbouring Snn5 alone (Snn5Snn5/tsn1tsn1) and lines harbouring Tsn1 alone (snn5snn5/Tsn1Tsn1) were not significantly different in their average disease reaction types (Table 3, Fig. 4A).
Table 3.
Average disease reaction types of parents and doubled haploid (DH) lines of the LP749 population for the allelic state combinations for Snn5 and Tsn1 after inoculation with conidia of Stagonospora nodorum isolates Sn2000 (SnToxA + SnTox5) and Sn2000KO6‐1 (SnTox5)
| Genotype | Means | Mean differenced | |
|---|---|---|---|
| Sn2000c | Sn2000KO6‐1c | ||
| Lebsock | 3.33 | 2.83 | |
| PI94749 | 0.67 | 0.50 | |
| All LP progeny | 2.25 | 1.85 | 0.40a |
| snn5snn5/tsn1tsn1 | 1.09a | 1.12a | 0.03NS |
| snn5snn5/Tsn1Tsn1 | 2.41b | 0.89a | 1.52b |
| Snn5Snn5/tsn1tsn1 | 2.46b | 2.65b | 0.19NS |
| Snn5Snn5/Tsn1Tsn1 | 2.94c | 2.47b | 0.47a |
| LSD0.05 | 0.31 | 0.33 | |
LSD, least‐significant difference; NS, not significant.
Significance at the probability level of P < 0.01.
Significance at the probability level of P < 0.001.
Numbers followed by the same letter are not significantly different at the 0.05 level of probability.
Mean differences between the same genotypic class inoculated with different strains of the pathogen.
Figure 4.
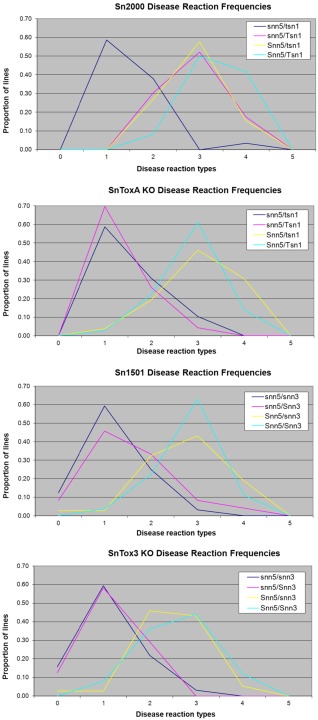
Average disease reaction types by genotype caused by Stagonospora nodorum isolates Sn2000 (a), the corresponding SnToxA gene knockout (KO) strain Sn2000KO6‐1 (b), Sn1501 (c) and its corresponding SnTox3 KO strain Sn1501ΔTox3 (d).
Evaluation of the LP749 population for SNB produced by S. nodorum strain Sn2000KO6‐1, which is a strain of Sn2000 with a disrupted SnToxA gene (Friesen et al., 2006), allowed further comparisons of the effects of the SnTox5–Snn5 and SnToxA–Tsn1 interactions. QTL analysis indicated that only the Snn5 locus was significantly associated with SNB (Table 3). As expected, the Tsn1 locus was not associated with disease because of a lack of SnToxA production by Sn2000KO6‐1 (Fig. 4, Table 3). Although the Snn5 locus explained 63% of the variation in SNB caused by Sn2000KO6‐1, as opposed to 37% for SNB caused by the wild‐type strain Sn2000 (Table 2), the mean disease reaction type for the whole population decreased significantly from 2.25 to 1.85 (Table 3). In addition, significant differences were found between inoculations of Sn2000 and Sn2000KO6‐1 for the genotypes snn5snn5/Tsn1Tsn1 and Snn5Snn5/Tsn1Tsn1, because of the lack of SnToxA production by Sn2000KO6‐1 (Table 3).
Analysis of SNB in the LP749 population caused by S. nodorum isolate Sn1501, which produces SnTox5 and SnTox3, but not SnToxA, revealed a significant QTL at the Snn5 locus that explained 53% of the variation (Fig. 3, Table 2). This was the only locus significantly associated with SNB caused by Sn1501 at the logarithm of the odds (LOD) threshold of 3.1. However, the Snn3–B1 locus was significant at LOD = 2.0 and explained about 3% of the variation (Fig. 3, Table 2). Together, Snn5 and Snn3–B1 explained 56% of the variation in SNB caused by Sn1501 in a multiple regression model (data not shown). When comparing the average disease reaction types of the four genotypic classes involving Snn3–B1 and Snn5, significant differences were identified between lines harbouring both sensitivity alleles at both loci (Snn5Snn5/Snn3Snn3) and lines harbouring neither sensitivity allele (snn5snn5/snn3snn3), as well as between lines differing for SnTox5 sensitivity (Snn5 or snn5) (Table 4, Fig. 4C,D). Lines differing for Snn3–B1 were only significantly different in the absence of the Snn5 allele, suggesting that a compatible Snn5–SnTox5 interaction masks the effects of the Snn3–B1–SnTox3 interaction in this population because of the more severe levels of disease contributed by the former.
Table 4.
Average disease reaction types of parents and doubled haploid (DH) lines of the LP749 population for the allelic state combinations for Snn5 and Snn3 after inoculation with conidia of Stagonospora nodorum isolates Sn1501 and Sn1501ΔTox3
| Genotype | Means | Mean differenceb | |
|---|---|---|---|
| Sn1501a | Sn1501ΔTox3a | ||
| Lebsock | 2.33 | 2.5 | |
| PI94749 | 0.17 | 0.67 | |
| All LP progeny | 1.67 | 1.47 | 0.20NS |
| snn5snn5/snn3snn3 | 0.71a | 0.77a | 0.06NS |
| snn5snn5/Snn3Snn3 | 1.12b | 0.76a | 0.36NS |
| Snn5Snn5/snn3snn3 | 2.32c | 2.09b | 0.23NS |
| Snn5Snn5/Snn3Snn3 | 2.40c | 2.12b | 0.28NS |
| LSD0.05 | 0.36 | 0.36 | |
LSD, least‐significant difference; NS, not significant.
Numbers followed by the same letter are not significantly different at the 0.05 level of probability.
Mean differences between the same genotypic class inoculated with different strains of the pathogen.
Inoculation of the LP749 population with strain Sn1501ΔTox3, which is the same as Sn1501, except that it does not produce SnTox3, indicated that the Snn5 locus accounted for 51% of the variation in SNB (Fig. 3, Table 2), and the average disease reaction type observed for the whole population was not significantly different from that observed for the wild‐type strain Sn1501 (Table 4). In addition, no significant differences were observed when comparing the four genotypic classes involving Snn5 and Snn3–B1 between Sn1501 and Sn1501ΔTox3 at the 0.05 level of probability (Table 4, Fig. 4C,D). However, it is noteworthy that the difference between the two strains for the snn5snn5/Snn3Snn3 class was nearly significant (P = 0.08), suggesting that SnTox3–Snn3–B1 contributes to the development of SNB in the absence of a compatible Snn5–SnTox5 interaction.
Discussion
Until recently, SNB was thought to be quantitatively controlled and a complicated disease because little was known regarding the mechanisms underlying S. nodorum–wheat interactions at the molecular level. We have now identified and characterized six S. nodorum effector–wheat gene interactions, with several more yet to be published, making this the most extensively characterized system of inverse gene‐for‐gene interactions known in a necrotrophic fungal pathosystem. This system has a complex necrotrophic effector‐based virulence system that is critical for disease induction, and it relies on the host (wheat) to harbour the corresponding effector sensitivity genes, which recognize the effectors. Effector recognition leads to successful elicitation of necrosis, thereby providing an area of dead tissue and nutrients for sporulation and the initiation of secondary disease cycles.
The recent cloning of the Tsn1 gene showed that it contained hallmark features of genes that confer resistance to biotrophic pathogens, including serine/threonine protein kinase, NB and LRR domains. However, instead of conferring resistance to a biotroph, Tsn1 confers susceptibility to SnToxA‐producing strains of S. nodorum, suggesting that S. nodorum subverts resistance mechanisms to cause disease (Faris et al., 2010). It is possible that many, if not all, of the wheat S. nodorum effector sensitivity genes, including Snn5, are actually classic biotroph resistance‐like genes whose functions are being exploited by S. nodorum, a necrotrophic pathogen, to trigger programmed cell death. The recognition of necrotrophic effectors by resistance‐like genes to induce disease has been shown in three necrotrophic plant–pathogen systems (Faris et al., 2010; Lorang et al., 2007; Nagy and Bennetzen, 2008), with each interaction showing hallmarks of the induction of programmed cell death in response to the molecule associated with the resistance‐like gene (Dunkle and Macko, 1995; Lorang et al., 2007; Manning et al., 2009; Rasmussen et al., 2004).
Properties of SnTox5 and the SnTox5–Snn5 interaction are similar to those reported previously in the SNB system. On the basis of ultrafiltration, SnTox5 is between 10 and 30 kDa, which is typical for a small secreted protein, and is in the same size range as SnToxA (Friesen et al., 2006), SnTox3 (Liu et al., 2009) and SnTox1 (Liu et al., 2012). Although the SnTox5–Snn5 interaction is unique, it is dependent on light, and is therefore similar to several of the other necrotrophic effector–host gene interactions in the wheat–S. nodorum system (reviewed in Friesen and Faris, 2010; Friesen et al., 2008a). It is possible that all the light‐dependent interactions, which include SnToxA–Tsn1, SnTox1–Snn1, SnTox2–Snn2, SnTox4–Snn4 and now SnTox5–Snn5, may lead to the subversion of the same downstream pathway(s) to manifest disease. SnTox5 was also shown to be fairly stable after heat treatment. A similar level of heat stability was also shown for SnTox1 (Liu et al., 2012), a highly cysteine‐rich protein.
SnTox5–Snn5 is a strong interaction that accounts for as much as 63% of the disease variation in the LP749 population when it is the only interaction segregating in the population. In the presence of the SnToxA–Tsn1 interaction, the SnTox5–Snn5 interaction accounts for relatively less, but, when the SnToxA–Tsn1 and SnTox5–Snn5 interactions are present together, the disease reaction is significantly higher. The additive nature of compatible interactions is common in this system (Chu et al., 2010b; Friesen et al., 2007, 2008b), reinforcing the idea that the production of multiple effectors by the pathogen leads to compounding effects when in the presence of the corresponding host sensitivity/susceptibility genes. In the case of the combinations of SnTox5–Snn5 and SnToxA–Tsn1 or SnTox5–Snn5 and SnTox3–Snn3–B1, the presence of two interactions leads to more severe reaction types (larger lesions) than a single interaction, and therefore the pathogen can colonize a greater area for spore production. Because SNB is a polycyclic disease and the pathogen moves up the plant by splashed spore dispersal during the growing season, increased spore production will increase the rate and significance of an epidemic in the field.
Liu et al. (2004b) reported a QTL on chromosome arm 4BL in the International Triticeae mapping Initiative (ITMI) wheat mapping population that accounted for 9% of the variation in SNB caused by isolate Sn2000. However, no necrotrophic effector–wheat gene interaction was reported to be associated with this QTL. Because both Snn5 in the LP749 population and the minor QTL reported in the ITMI population were located to the same chromosome arm, and both were detected using the same S. nodorum isolate, it is possible that the underlying gene in the ITMI population is actually Snn5. However, further comparative mapping analysis and evaluation of the ITMI population with SnTox5‐containing cultures are needed to determine whether the Snn5–SnTox5 interaction is responsible for the effects of the 4BL QTL in the ITMI population.
A large body of evidence demonstrating that the S. nodorum–wheat system consists of an arsenal of pathogen‐produced necrotrophic effectors that target corresponding host sensitivity/susceptibility gene products to cause disease is now available. Therefore, it would be beneficial for breeders to identify and remove host sensitivity/susceptibility genes from their breeding lines to develop varieties with high levels of SNB resistance. This can be accomplished through the use of effector‐containing culture filtrates, purified necrotrophic effectors or molecular markers tightly linked to wheat genes that govern effector sensitivity. The use of these bioassays and molecular genetics tools to characterize lines and select against effector sensitivity genes may greatly expedite the development of SNB‐resistant germplasm. In areas in which SNB is a problem, the elimination of effector sensitivities will lead to decreased pathogen colonization of the host, resulting in increased yield and quality. The current work led to the identification and genetic characterization of the SnTox5–Snn5 interaction, the sixth in a growing list of necrotrophic effector–host sensitivity gene interactions in the wheat–S. nodorum system.
Experimental Procedures
Plant materials
A tetraploid wheat population (hereafter referred to as the LP749 population), consisting of 120 DH lines derived from a cross between the North Dakota durum wheat variety ‘Lebsock’ and the T. turgidum ssp. carthlicum (2n = 4x = 28, AABB) accession PI 94749 (Chu et al., 2010a), was used for molecular mapping and genetic analyses of reactions to SNB and S. nodorum‐produced effectors (see below). Molecular linkage maps consisting of 280 SSR markers spanning 2034.1 cM and covering all 14 chromosomes have been developed previously (Chu et al., 2010a). Lebsock is susceptible to SNB because it harbours several effector sensitivity genes, including Tsn1, Snn3‐B1 and Snn5. PI94749 is moderately resistant to SNB and is insensitive to the currently known S. nodorum‐produced necrotrophic effectors.
Culture filtrate production, effector bioassays and identification of a novel effector–host gene interaction
The LP749 population was screened with culture filtrates of isolates Sn2000 (Liu et al., 2004a, b) and Sn1501 (Friesen et al., 2008b; Zhang et al., 2011) to determine whether the population segregated for sensitivity to any previously unidentified S. nodorum effectors. Sn2000 produces SnToxA, but not SnTox3, because of the absence of the SnTox3 gene, whereas Sn1501 is deficient in SnToxA production because of the absence of SnToxA, but does produce SnTox3 (Liu et al., 2009). Culture filtrates of the isolates were produced and assayed as described in Friesen and Faris (2012). Approximately 50 μL of culture filtrate were infiltrated into the second leaf of seedling plants (approximately 14 days old) of the entire LP749 population using a 1‐mL syringe with the needle removed. Areas of infiltration were marked with a felt pen. Three days after infiltration, the reactions to the culture filtrates were scored using the 0–3 scale described by Friesen and Faris (2012). At least three replications were completed for each isolate used. The phenotypic data were then subjected to simple linear regression against the entire marker dataset for the LP749 population to identify marker loci associated with effector sensitivity, as described in Friesen et al. (2008b).
Partial purification of a newly identified effector
The DH line LP749‐29 from the LP749 population was selected for use as a differential line for subsequent experiments because it was found to be sensitive to a newly identified effector, but insensitive to SnToxA and SnTox3. Culture filtrates of Sn2000, Sn1501, and also Sn2000KO6‐1 and Sn1501ΔTox3, which contain site‐directed disruptions of SnToxA (Friesen et al., 2006) and SnTox3 (Liu et al., 2009), respectively, were grown as described previously (Liu et al., 2004a, 2009) and used for partial effector purification. Briefly, culture filtrates were dialysed for 4 h to overnight against water using 3500 MWCO dialysis tubing (Fisher Scientific, Pittsburgh, PA, USA). Dialysed culture filtrates were subjected to low‐pressure cation exchange chromatography using a 5‐mL SPXL cation exchange column (GE Healthcare). A 0–300 mm NaCl linear gradient in a running buffer of 20 mm sodium acetate, pH 5.2, was used to elute 1‐mL fractions from the column at 1 mL/min. Fractions were assayed on the differential line LP749‐29 to evaluate when the effector was eluting, and active fractions were then used in further experiments.
Effector characterization
Protease sensitivity was assayed as described by Friesen and Faris (2012). Active fractions were treated for 4 h at room temperature with Pronase (EMD Biosciences, Billerica, MA, USA) dissolved in water at a final concentration of 1 mg/mL. Active effector‐containing cultures subjected to water alone and Pronase (1 mg/mL) alone were also incubated at room temperature for 4 h and used as controls.
Preliminary size estimation was obtained using Centricon ultrafiltration devices (Millipore, Billerica, MA, USA). Culture filtrate or semi‐purified samples containing the newly identified effector were subjected to ultrafiltration using 5‐, 10‐ and 30‐kDa MWCO ultrafiltration devices. Concentrates and filtrates were assayed on the differential line LP749‐29 for each MWCO filter size. Following infiltration, all plants were placed at 21 °C under a 12‐h photoperiod. Plants were evaluated at 3 days post‐infiltration. Sensitivity to filtrates indicated that the necrosis‐inducing component was smaller than the cut‐off of that particular MWCO filter, e.g. sensitivity to the 30‐kDa filtrate indicates a size smaller than 30 kDa.
Light dependence for necrosis production was evaluated by infiltrating individual plants of line LP749‐29 with active cultures produced from isolate Sn2000KO6‐1. Before infiltration, all plants were subjected to a 12‐h dark period and then infiltrated with culture filtrates containing the active effector. After infiltration, plants were placed in either a 24‐h dark or 12‐h light–12‐h dark photoperiod, both at 21 °C. Three replicates of three plants each were infiltrated for each treatment.
Heat stability of the SnTox5 protein was evaluated using boiling treatments for 30 and 60 min. A 1‐mL volume of culture filtrate of Sn2000KO6‐1 was added to a 1.5‐mL centrifuge tube and subjected to water that had been brought to a rolling boil. Tubes were removed and allowed to cool to room temperature before infiltrating the treated culture filtrates onto LP749‐29 to evaluate the visible level of necrosis development. Two replicates consisting of infiltrations of three leaves each of untreated Sn2000KO6‐1 culture filtrates, Sn2000KO6‐1 culture filtrates subjected to boiling water for 30 min and Sn2000KO6‐1 culture filtrates subjected to boiling water for 60 min were examined.
Disease evaluations
Conidial inoculations were performed as described by Friesen et al. (2008b) with slight modifications. The 120 DH lines of the LP749 population, together with parental lines Lebsock and PI94749, were planted in racks consisting of 98 cones (Steuwe & Sons, Corvallis, OR, USA) including a complete border of the susceptible cultivar ‘Grandin’ to reduce any edge effect. For each of three replicates, each line was planted in a single cone with three seeds in each cone. Conidia were produced and harvested as described in Liu et al. (2004b), and plants were inoculated using 1 × 10⁶ spores/mL until runoff. Following inoculations, plants were placed in 100% relative humidity at 21 °C in the light for 24 h, followed by 6 days at 21 °C under a 12‐h photoperiod. Plants were evaluated at 7 days post‐inoculation using the 0–5 scale described by Liu et al. (2004b), where ‘0’ is highly resistant and ‘5’ is highly susceptible. Three replicates were completed for each isolate/strain tested and direct comparisons between wild‐type and mutant strains were performed simultaneously.
Molecular mapping and QTL analysis
The SSR primer pair sets CFA2149, CFD22 (Sourdille et al., 2004) and WMC349 (Somers et al., 2004) were used to amplify DNA of Lebsock and PI94749 employing the conditions described in Chu et al. (2010a). All three primer sets revealed polymorphisms and were subsequently used to genotype the entire set of 120 DH lines of the LP749 population. The three resulting SSR markers (Xcfa2149, Xcfd22 and Xwmc349) were added to the linkage group for chromosome 4B constructed by Chu et al. (2010a) using the ‘TRY’ command in Mapmaker v2.0 for Macintosh (Lander et al., 1987).
Composite interval mapping (CIM) regression analysis was used to evaluate the effects of individual effector–host sensitivity gene interactions using the computer software QGene v4.0 (Joehanes and Nelson, 2008). A permutation test consisting of 1000 iterations indicated that a LOD threshold of about 3.1 showed a significant effect contributed by the effector–host gene interaction.
Statistical analysis
Fisher's protected least‐significant differences (LSDs) were used to compare SNB disease severity difference among allelic combinations of lines, and Student's t‐test was used to test disease difference caused by different isolates within the same allelic combination. LSDs were calculated using the command PROC GLM and the t‐test was performed under the command PROC TTEST in SAS (SAS Institute, 2011).
Acknowledgements
We thank Danielle Holmes for technical support and Drs Zengcui Zhang and Lynn Dahleen for critical review of the manuscript. This work was funded by the US Department of Agriculture‐National Institute of Food and Agriculture, Agriculture and Food Research Initiative (USDA‐NIFA AFRI) Microbial Biology Program—Competitive grant #2009‐04265 and USDA‐Agricultural Research Service Current Research Information System (USDA‐ARS CRIS) #5442‐22000‐043‐09G.
References
- Ballance, G.M. , Lamari, L. , Kowatsch, R. and Bernier, C.C. (1996) Cloning, expression and occurrence of the gene encoding the Ptr necrosis toxin from Pyrenophora tritici‐repentis . Mol. Plant Pathol. (online first: http://www.bspp.org.uk/mppol/1996/1209ballance). [Google Scholar]
- Chu, C.‐G. , Chao, S. , Friesen, T.L. , Faris, J.D. , Zhong, S.B. and Xu, S.S. (2010a) Identification of novel tan spot resistance QTLs using an SSR‐based linkage map of tetraploid wheat. Mol. Breed. 25, 327–338. [Google Scholar]
- Chu, C.‐G. , Faris, J.D. , Xu, S. and Friesen, T.L. (2010b) Genetic analysis of disease susceptibility contributed by the compatible Tsn1–SnToxA and Snn1–SnTox1 interactions in the wheat–Stagonospora nodorum pathosystem. Theor. Appl. Genet. 120, 1451–1459. [DOI] [PubMed] [Google Scholar]
- Ciuffetti, L.M. , Tuori, R.P. and Gaventa, J.M. (1997) A single gene encodes a selective toxin causal to the development of tan spot of wheat. Plant Cell, 9, 135–144. [DOI] [PMC free article] [PubMed] [Google Scholar]
- Dunkle, L.D. and Macko, V. (1995) Peritoxins and their effects on sorghum. Can. J. Bot. 73, S444–S452. [Google Scholar]
- Faris, J.D. , Zhang, Z. , Lu, H. , Lu, S. , Reddy, L. , Cloutier, S. , Fellers, J.P. , Meinhardt, S.W. , Rasmussen, J.B. , Xu, S.S. , Oliver, R.P. , Simons, K.J. and Friesen, T.L. (2010) A unique wheat disease resistance‐like gene governs effector‐triggered susceptibility to necrotrophic pathogens. Proc. Natl. Acad. Sci. USA, 107, 13 544–13 549. [DOI] [PMC free article] [PubMed] [Google Scholar]
- Friesen, T.L. and Faris, J.D. (2010) Characterization of the wheat–Stagonospora nodorum disease system: what is the molecular basis of this quantitative necrotrophic disease interaction? Can. J. Plant Pathol. 32, 20–28. [Google Scholar]
- Friesen, T.L. and Faris, J.D. (2012) Characterization of plant–fungal interactions involving necrotrophic effector‐producing plant pathogens In: Plant Fungal Pathogens: Methods and Protocols, Methods in Molecular Biology, Vol. 835 (Bolton M.D. and Thomma B.P.H.J., eds), pp. 191–207. New York: Humana Press. [DOI] [PubMed] [Google Scholar]
- Friesen, T.L. , Stukenbrock, E.H. , Liu, Z.H. , Meinhardt, S.W. , Ling, H. , Faris, J.D. , Rasmussen, J.B. , Solomon, P.S. , McDonald, B.A. and Oliver, R.P. (2006) Emergence of a new disease as a result of interspecific virulence gene transfer. Nat. Genet. 38, 953–956. [DOI] [PubMed] [Google Scholar]
- Friesen, T.L. , Meinhardt, S.W. and Faris, J.D. (2007) The Stagonospora nodorum–wheat pathosystem involves multiple proteinaceous host‐selective toxins and corresponding host sensitivity genes that interact in an inverse gene‐for‐gene manner. Plant J. 51, 681–692. [DOI] [PubMed] [Google Scholar]
- Friesen, T.L. , Faris, J.D. , Solomon, P.S. and Oliver, R.P. (2008a) Host specific toxins: effectors of necrotrophic pathogenicity. Cell. Microbiol. 10, 1421–1428. [DOI] [PubMed] [Google Scholar]
- Friesen, T.L. , Zhang, Z. , Solomon, P.S. , Oliver, R.P. and Faris, J.D. (2008b) Characterization of the interaction of a novel Stagonospora nodorum host‐selective toxin with a wheat susceptibility gene. Plant Physiol. 146, 682–693. [DOI] [PMC free article] [PubMed] [Google Scholar]
- Joehanes, R. and Nelson, J.C. (2008) QGene 4.0, an extensible Java QTL‐analysis platform. Bioinformatics, 24, 2788–2789. [DOI] [PubMed] [Google Scholar]
- Lander, E.S. , Green, P. , Abrahamson, J. , Barlow, A. , Daly, M.J. , Lincoln, S.E. and Newberg, L. (1987) MAPMAKER: an interactive computer package for constructing primary genetic linkage maps of experimental and natural populations. Genomics, 1, 174–181. [DOI] [PubMed] [Google Scholar]
- Liu, Z.H. , Faris, J.D. , Meinhardt, S.W. , Ali, S. , Rasmussen, J.B. and Friesen, T.L. (2004a) Genetic and physical mapping of a gene conditioning sensitivity in wheat to a partially purified host‐selective toxin produced by Stagonospora nodorum . Phytopathology, 94, 1056–1060. [DOI] [PubMed] [Google Scholar]
- Liu, Z.H. , Friesen, T.L. , Meinhardt, S.W. , Ali, S. , Rasmussen, J.D. and Faris, J.D. (2004b) QTL analysis and mapping of resistance to Stagonospora nodorum leaf blotch in wheat. Phytopathology, 94, 1061–1067. [DOI] [PubMed] [Google Scholar]
- Liu, Z.H. , Friesen, T.L. , Ling, H. , Meinhardt, S.W. , Rasmussen, J.B. and Faris, J.D. (2006) The Tsn1–ToxA interaction in the wheat–Stagonospora nodorum pathosystem parallels that of the wheat–tan spot system. Genome, 49, 1265–1273. [DOI] [PubMed] [Google Scholar]
- Liu, Z.‐H. , Faris, J.D. , Oliver, R.P. , Tan, K.‐C. , Solomon, P.S. , McDonald, M.C. , McDonald, B.A. , Nunez, A. , Lu, S. , Rasmussen, J.B. and Friesen, T.L. (2009) SnTox3 acts in effector triggered susceptibility to induce disease on wheat carrying the Snn3 gene. PLoS Pathog. 5, e1000581. [DOI] [PMC free article] [PubMed] [Google Scholar]
- Liu, Z.‐H. , Zhang, Z. , Faris, J.D. , Oliver, R.P. , Syme, R. , McDonald, M.C. , McDonald, B.M. , Solomon, P.S. , Lu, S. , Shelver, W.L. , Xu, S.S. and Friesen, T.L. (2012) The necrotrophic effector SnTox1 produced by Stagonospora nodorum triggers susceptibility of wheat lines harboring Snn1 . PLoS Pathog. 8, e1002467. [DOI] [PMC free article] [PubMed] [Google Scholar]
- Lorang, J.M. , Sweat, T.A. and Wolpert, T.J. (2007) Plant disease susceptibility conferred by a ‘resistance’ gene. Proc. Natl. Acad. Sci. USA, 104, 14 861–14 866. [DOI] [PMC free article] [PubMed] [Google Scholar]
- Manning, V.A. , Chu, A.L. , Steeves, J.E. , Wolpert, T.J. and Ciuffetti, L.M. (2009) A host‐selective toxin of Pyrenophora tritici‐repentis, Ptr ToxA, induces photosystem changes and reactive oxygen species accumulation in sensitive wheat. Mol. Plant–Microbe Interact. 22, 665–676. [DOI] [PubMed] [Google Scholar]
- Nagy, E.D. and Bennetzen, J.L. (2008) Pathogen corruption and site‐directed recombination at a plant disease resistance gene cluster. Genome Res. 18, 1918–1923. [DOI] [PMC free article] [PubMed] [Google Scholar]
- Rasmussen, J.B. , Kwon, C.Y. and Meinhardt, S.W. (2004) Requirement of host signaling mechanisms for the action of Ptr ToxA in wheat. Eur. J. Plant Pathol. 110, 333–335. [Google Scholar]
- SAS Institute (2011) SAS/STAT User's Guide, Releases 9.3. Cary, NC: SAS Institute. [Google Scholar]
- Somers, D.J. , Isaac, P. and Edwards, K. (2004) A high‐density microsatellite consensus map for bread wheat (Triticum aestivum L.). Theor. Appl. Genet. 109, 1105–1114. [DOI] [PubMed] [Google Scholar]
- Sourdille, P. , Singh, S. , Cadalen, T. , Brown‐Guedira, G.L. , Gay, G. , Qi, L. , Gill, B.S. , Dufour, P. , Murigneux, A. and Bernard, M. (2004) Microsatellite‐based deletion bin system for the establishment of genetic–physical map relationships in wheat (Triticum aestivum L.). Funct. Integr. Genomics, 4, 12–25. [DOI] [PubMed] [Google Scholar]
- Wolpert, T.J. , Dunkle, L.D. and Ciuffetti, L.M. (2002) Host‐selective toxins and avirulence determinants: what's in a name? Annu. Rev. Phytopathol. 40, 251–285. [DOI] [PubMed] [Google Scholar]
- Xu, S. , Friesen, T. and Mujeeb‐Kazi, A. (2004) Seedling resistance to tan spot and Stagonospora nodorum blotch in synthetic hexaploid wheats. Crop Sci. 44, 2238–2245. [Google Scholar]
- Zhang, Z. , Friesen, T.L. , Xu, S.S. , Shi, G.J. , Liu, Z.H. , Rasmussen, J.B. and Faris, J.D. (2011) Two putatively homoeologous wheat genes mediate the recognition of SnTox3 to confer effector‐triggered susceptibility to Stagonospora nodorum . Plant J. 65, 27–38. [DOI] [PubMed] [Google Scholar]