

Abstract
Background:
Atrial fibrillation (AF) is associated with elevated risk for ischemic stroke and myocardial infarction (MI). The aim of the study is to assess the role of insulin use on the risk of stroke and MI in AF patients with diabetes.
Methods:
We identified Medicare beneficiaries with new AF in 2011-2013. Primary outcomes were ischemic stroke and MI. Multivariate Cox regression models were used to assess the association between AF and time to stroke and MI. We adjusted for anticoagulant as a time-dependent covariate.
Results:
Out of 798,592 AF patients, 53212 (6.7%) were insulin-requiring diabetics (IRD), 250214 (31.3%) were non-insulin requiring diabetics (NIRD) and 495166 (62%) were non-diabetics (ND). IRD had a higher risk of stroke when compared to NIRD (adjusted HR: 1.15, 95% CI 1.10-1.21) and ND (aHR 1.24, 95% CI 1.18-1.31) (P<0.01 for both). The risk of stroke was higher in NIRD compared to ND (aHR 1.08, 95% CI 1.05-1.12). For the outcome of MI, IRD had a higher risk compared to NIRD (aHR 1.24, 95% CI 1.18-1.31) and ND (aHR 1.46, 95% CI 1.38-1.54)]. NIRD had a higher risk compared to ND (aHR 1.17, 95% CI 1.13-1.22). Anticoagulation were most effective at preventing stroke in ND [0.72 (0.69-0.75)], and NIRD [0.88 (0.85-0.92)], but were not associated with significant reduction in stroke in IRD [0.96 (0.89-1.04)].
Conclusion:
There is an incremental risk of ischemic stroke and MI from non-diabetics to non-insulin diabetics with the highest risk in insulin users. Protective effect of anticoagulation is attenuated with insulin use.
Keywords: Atrial fibrillation, Diabetes mellitus, Insulin therapy, anticoagulation, stroke, myocardial infarction
Introduction
Patients with non-valvular atrial fibrillation (AF) have 3 – 5 fold higher risk of stroke and acute myocardial infarction (Ml). [1–3] There are two predominant mechanisms that orchestrate these cardiovascular (CV) outcomes in patients with AF: 1) thromboembolism; embolization of left atrial clot to distant vascular beds leading to ischemia[4], 2) atherothrombosis; a state of systemic inflammation associated with AF that potentially accelerates atherosclerosis and creates a prothombotic state that leads to enhanced platelet activation and thrombosis. [5,6]
Diabetes mellitus (DM) significantly increases risk of CV events in patients with AF. As a result, DM was included in the most widely accepted risk scoring algorithms; the CHADS2 and the CHA2DS2-VASc scores.[7,8] However, important knowledge gaps exist in our understanding of the mechanism via which DM increases risk of CV outcomes in patients with AF. One study showed that longer duration of DM, not poor glycemic control per se, increases stroke risk. [9] On the other hand, another study showed that insulin use, and not the presence of DM, is the factor that increases risk of stroke.[10] Given that DM is present in about 15% of AF patients, it is important to better define the role of insulin in risk of stroke and MI in AF diabetic patients. [11] Furthermore, it is unknown whether oral anticoagulation (OAC) therapy is equally effective in different DM types.
We used Medicare claims data to compare outcomes of stroke and MI in AF patients who were insulin-requiring diabetics (IRD), non-insulin requiring diabetics (NIRD) and non-diabetics. We also assessed the protective effect of OAC against both outcomes in presence of insulin use.
Methods
The institutional review board of the University of Iowa approved the study protocol. Considering the retrospective cohort design of this investigation the need for informed consent was waived. We used Centers for Medicare & Medicaid (CMS) data from November 2011 to October 2013, including: 1) beneficiary summary file base and chronic conditions segments; 2) inpatient (part A) and carrier (part B) standard analytic files; and 3) pharmacy drug event (part D). Patients were included in the study if they had AF diagnosis during the period November 2011 through October 2013. AF was defined based on previously published algorithms (i.e., 1 inpatient claim or 2 outpatient claims within a year with International Classification of Diseases-Ninth Revision-Clinical Modification [ICD-9-CM] code 427.31 as primary or first secondary diagnosis).[12,13] We excluded patients if they were younger than 66 years at the time of diagnosis (to ensure at least 12 months of Medicare eligibility before diagnosis), were enrolled in a Medicare managed care during the observation period, or were not enrolled in a Part D drug prescription plan at the time of AF diagnosis. Using these criteria we identified 828,051 patients with AF. From this, we excluded 29,459 patients whose AF diagnosis occurred during the same hospitalization as open-heart surgery or within 30 days, as these may represent post-operative AF. Hence, our final study cohort comprised of 798,592 patients with AF.
Exposure and cohort definition
DM diagnosis was identified using ICD-9-CM codes (250.xx). Study cohort participants were identified as IRD if they had a diagnosis of DM and were using insulin at the time of AF diagnosis. Insulin type (short vs. long acting) and dosage were identified in insulin users. Participants were defined as NIRD if they had a diagnosis of DM at the time of AF diagnosis but were not using insulin. Prevalence of different oral hypoglycemics use was identified and was classified into metformin, thiazolidiones, dipeptidyl peptidase-4 (DPP-4) inhibitors, and sulfonylureas. Finally, non-diabetics were those study participants without a diagnosis of DM.
We identified patient characteristics from Medicare enrollment data and inpatient and carrier claims. Age, sex, and race were identified from Medicare enrollment data. Comorbid diseases defined by Elixhauser et al. were identified by ICD-9-CM diagnoses in inpatient and outpatient claims during the 12 months preceding AF diagnosis.[14] We identified additional comorbidities of importance to AF outcomes, including: other dysrhythmias (ICD-9-CM codes 427.X, excluding 427.3), cardiomyopathy (ICD9 codes 425.X), cardiac conduction disorder (e.g. bundle branch block; ICD9 codes 426.X), and previous implantable cardiac device (e.g. pacemaker; ICD9 codes V45.0, V53.3). To avoid multicollinearity, the CHA2DS2-VASc stroke risk score was calculated without the DM element of it (1 point each for congestive heart failure diagnosis, female sex, hypertension diagnosis, age 65-75 years, and vascular disease diagnosis; 2 points each for age >75 years and prior stroke or transient ischemic attack). [8] The HAS-BLED (Hypertension, Abnormal renal and liver functions, Stroke, Bleeding, Labile INR, Elderly, Drugs or alcohol) score was used to represent bleeding risk in our study patients.[15] To adjust for diabetes duration as a risk factor, we used presence of microvascular diabetic complications as a proxy to duration (defined with the following ICD-9 codes: 250.4× for renal complications, 250.5× for ophthalmic complications, and 250.6× for neurological complications and 250.7× for peripheral circulatory complications). Further we calculated health care utilization during the 12 months prior to AF diagnosis (number of inpatient hospital days, skilled nursing facility stay and extended care stay) and medication use within 90 days of AF diagnosis (insulin, statins, beta blockers, calcium channel blockers, aspirin, clopidogrel, proton pump inhibitors, amiodarone, non-steroidal anti-inflammatory drugs, and oral hypoglycemics). Use of oral anticoagulants after AF diagnosis was also assessed.
Study outcomes
Inpatient hospitalizations for incident stroke and incident MI were the outcomes assessed in this study. We followed the definition reported by Rothendler et al based on the primary ICD-9-CM diagnosis on inpatient standard analytical file claims for acute care stays to define incident stroke in our study [16,17]. Similarly, primary ICD-9-CM codes from inpatient claims were used to identify MI admissions. Patients were followed from the time of initial AF diagnosis until the outcome of interest (stroke or MI), death, or end of follow-up (December 31st 2013).
Statistical analysis
The study cohort was divided into IRD, NIRD and ND using criteria mentioned above. Continuous variables were reported as mean (standard deviation) or median (interquartile range) depending on the normality of data distribution. Categorical variables were reported as number and percentages. We used chi-square test or 1-way analysis of variance, as appropriate, to compare demographic variables, comorbid conditions, health care utilization, medication use, CHA2DS2-VASc and HAS-BLED scores between the 3 groups. Then we reported the study outcomes, stroke and MI, as number of events, percentage and events/hundred patient years of follow-up separately for the 3 groups. We used Cox proportional hazards regression, with time to stroke and time to MI as dependent variables and the 3 diabetes categories as independent variables, to assess the hazard of the respective outcomes comparing the 3 DM categories to each other. Additional models were estimated using Fine & Gray’s [18] approach to competing events to account for censoring due to death; results were nearly identical to those reported. Nearly 50 variables that may confound the association between DM and the study outcomes were candidates for multivariable models (Supplemental Table 1). Candidate variables were assessed for multicollinearity, and variables were selected for inclusion in Cox models based on relationship to the outcome (using a statistical criterion of 0.05), and consistency with prior literature and clinical experience. We repeated the Cox regression models after including anticoagulant use as a time dependent variable, in order to assess the relative effect of anticoagulation by diabetes category. We assessed the impact of the interaction between diabetes type and anticoagulation on the outcomes stroke and MI using a multiplicative model and also using an additive model (i.e. relative excess risk due to interdependence (RERI) as described by VanderWeele and Knol.[19] The results of the Cox models were reported as hazard ratios (HR) and 95% confidence intervals. Analysis was done with SAS version 9.4 (SAS Institute, Cary, North Carolina) and R 3.4.3 (R foundation for Statistical Computing, Vienna, Austria). P value < 0.05 was considered statistically significant. This study is supported by funding from the Agency for Healthcare Research and Quality and by the health services research and development service of the department of Veterans Affairs. The authors are solely responsible for the design and conduct of this study, all study analyses, the drafting and editing of the paper and its final contents.
Results
A total of 798,592 patients with AF formed the final study cohort. Among them, 53,212 (6.7%) were IRD, 250,214 (31.3%) were NIRD and 495,166 (62%) were ND. Table 1 details the demographic variables, comorbid conditions, risk scores, health care utilization and medication use comparisons between the 3 DM categories. In particular, IRD were younger, less likely to be women and more likely to be African American compared to the other DM categories. Further, IRD had a significantly greater proportion of comorbid diseases compared to the other 2 DM categories. Mean CHA2DS2-VASC score, FIAS-BLED score, and Gagne score were higher in the IRD compared to the other 2 DM groups. Also, health care utilization and cardiac medication use were also higher in the IRD compared to the other 2 groups. Oral anticoagulation use was highest in IRD, with warfarin the most used anticoagulant during our study period. Table 1 shows comparative persistence of OAC use among the three groups.
Table 1:
Baseline characteristics of the study three groups
| Variables | Insulin requiring diabetics | Non-insulin requiring diabetics | Non-diabetics | P value |
|---|---|---|---|---|
| (N =53,212) | (N = 250,214) | (N = 495,166) | ||
| Age | ||||
| Mean age (years) | 77.1 | 78.5 | 79.7 | <0.001 |
| 65 – 74 years – n (%) | 22,374 (42.1) | 86,707 (34.7) | 153,291 (30.9) | <0.001 |
| 75 – 84 years – n (%) | 20,962 (39.4) | 102,141 (40.8) | 187,894 (37.9) | |
| > 85 years – n (%) | 9,876 (18.6) | 61,366 (24.5) | 153,981 (31.1) | |
| Women – n (%) | 30,866 (58.0) | 139,829 (55.9) | 297,336 (60.0) | |
| Race | ||||
| White – n (%) | 39,755 (74.7) | 196,782 (78.7) | 439,855 (88.8) | <0.001 |
| Black – n (%) | 6,083 (11.4) | 24,149 (9.7) | 24,624 (4.9) | |
| Asian – n (%) | 1,621 (3.1) | 8,064 (3.2) | 9,609 (1.9) | |
| Hispanics – n (%) | 5,111 (9.6) | 18,520 (7.4) | 17,472 (3.5) | |
| Native – n (%) | 239 (0.5) | 968 (0.4) | 1,328 (0.3) | |
| Others – n (%) | 403 (0.8) | 1,731 (0.7) | 2,278 (0.5) | |
| Comorbid diseases | ||||
| Hypertension- n (%) | 50,567 (94.8) | 236,279 (94.4) | 406,378 (82.1) | <0.001 |
| Heart failure– n (%) | 29,921 (56.2) | 112,585 (45.0) | 151,274 (30.6) | <0.001 |
| Prior stroke – n (%) | 8,931 (16.8) | 38,913 (15.6) | 60,533 (12.2) | <0.001 |
| Prior transient ischemic attack – n (%) | 4,259 (8.0) | 20,014 (8.0) | 32,654 (6.6) | <0.001 |
| Prior Myocardial infarction– n (%) | 12,131 (22.8) | 46,991 (18.7) | 61,889 (12.5) | <0.001 |
| Peripheral vascular disease – n (%) | 21,976 (41.3) | 89,111 (35.6) | 127,151 (25.7) | <0.001 |
| Diabetes complications – n (%) | 34,419 (64.7) | 93,646 (37.4) | 0 | <0.001 |
| Obesity – n (%) | 14,430 (27.1) | 45,426 (18.2) | 35,722 (7.2) | <0.001 |
| Prior valvular heart disease – n (%) | 18,450 (34.7) | 89,349 (35.7) | 155,186 (31.3) | <0.001 |
| Prior cardiomyopathy – n (%) | 8,050 (14.5) | 32,095 (12.3) | 42,313 (8.3) | <0.001 |
| Prior conduction disorders – n (%) | 8,878 (16.7) | 38,585 (15.4) | 59,433 (12.0) | <0.001 |
| Other arrhythmias – n (%) | 22,419 (42.1) | 106,554 (42.6) | 188,615 (38.1) | <0.001 |
| Renal disease – n (%) | 24,922 (46.8) | 84,979 (32.4) | 86,525 (17.5) | <0.001 |
| Liver disease – n (%) | 4,447 (8.4) | 20,575 (8.2) | 24,517 (4.9) | <0.001 |
| Prior coagulation disorders – n (%) | 65,00 (12.2) | 29,838 (11.9) | 41,004 (8.3) | <0.001 |
| Prior alcohol use – n (%) | 638 (1.2) | 3,381 (1.4) | 6,455 (1.3) | 0.014 |
| Prior peptic ulcer disease – n (%) | 1,645 (3.1) | 8,054 (3.2) | 11,546 (2.3) | <0.001 |
| Prior depression – n (%) | 13,826 (25.9) | 50,292 (20.1) | 81,282 (16.4) | <0.001 |
| Prior dementia – n (%) | 7,812 (14.7) | 27,688 (11.7) | 46,645 (9.4) | <0.001 |
| Prior bleeding – n (%) | 1,245 (2.3) | 5,881 (2.4) | 8,993 (1.8) | <0.001 |
| Comorbidity scores | ||||
| Mean CHA2DS2VASC score* | 5.2 | 5.0 | 4.5 | <0.001 |
| HAS-BLED score | 3.4 | 3.2 | 2.7 | <0.001 |
| Health care utilization | ||||
| Number of inpatient hospital days | 11.6 | 9.9 | 6.1 | <0.001 |
| Skilled nursing facility stay – n (%) | 13,468 (24.3) | 39,554 (15.2) | 53,615 (10.5) | <0.001 |
| Extended care stay – n (%) | 17,302 (31.2) | 52,224 (20.0) | 76,960 (15.1) | <0.001 |
| Medication use at time of AF diagnosis | ||||
| Statin use – n (%) | 31,099 (58.4) | 120,060 (47.9) | 174,430 (35.2) | <0.001 |
| Beta-blockers – n (%) | 29,150 (54.8) | 114,678 (45.8) | 195,215 (39.4) | <0.001 |
| Calcium channel blockers – n (%) | 5,580 (10.5) | 22,836 (9.1) | 45,347 (9.2) | <0.001 |
| Clopidogrel – n (%) | 5,643 (10.6) | 20,075 (8.0) | 26,644 (5.4) | <0.001 |
| Proton pump inhibitors – n (%) | 24,218 (45.5) | 89,092 (35.6) | 144,752 (29.2) | <0.001 |
| NSAIDS – n (%) | 13,742 (25.8) | 61,385 (24.5) | 104,650 (21.1) | <0.001 |
| Insulin Glargine | 23853 (44.8) | 0 | 0 | NA |
| Insulin Detemir | 5574 (10.5) | 0 | 0 | NA |
| Insulin Aspart | 8909 (16.7) | 0 | 0 | NA |
| Insulin Lispro | 4966 (9.3) | 0 | 0 | NA |
| Regular insulin | 5692 (10.7) | 0 | 0 | NA |
| Metformin | 7567 (14.2) | 37056 (14.8) | 2388 (0.5) | <0.001 |
| Thiazolidiones | 1117 (2.1) | 5223 (2.1) | 0 | <0.001 |
| DPP-4 inhibitors | 2983 (5.6) | 9020 (3.6) | 0 | <0.001 |
| Sulfonylureas | 8354 (15.7) | 33947 (13.6) | 0 | <0.001 |
| Any Oral anticoagulation | 30,561 (57.4%) | 131,890 (52.7%) | 260,020 (52.5%) | <0.001 |
| Warfarin | 24,914 (46.8%) | 98,952 (39.6%) | 190,959 (38.6%) | <0.001 |
| Dabigatran | 3965 (7.5%) | 22,323 (8.9%) | 48,331 (9.8%) | <0.001 |
| Rivaroxaban | 3271 (6.2%) | 18,231 (7.3%) | 40,286 (8.1%) | <0.001 |
| Total duration of warfarin use Median (IQR), days | 367 (114-745) | 349 (110-742) | 365 (114-776) | <0.01** |
| Total duration of any anticoagulation Median (IQR), days | 371 (127-735) | 355 (133-725) | 365 (138-746) | <0.01*** |
| At least 3 months of anticoagulation | 45.3% | 41.9% | 41.8% | <0.01 |
CHA2DS2-Vasc score was calculated without points for diabetes
P=0.005 for comparison between insulin and non-insulin requiring diabetics, and P=0.04 for comparison between insulin diabetics and non-diabetics.
P=0.04 for comparison between insulin and non-insulin requiring diabetics, P=0.17 for comparison between insulin requiring and nondiabetics.
Table 2 details the event rates of stroke and MI. Unadjusted rates of stroke and MI were highest in IRD patients, followed by the NIRD. The ND had the lowest unadjusted event rate. Table 3 details the hazard of stroke and MI comparing the 3 DM groups. In the adjusted model, IRD had higher risk of stroke compared to NIRD (Hazards ratio (HR): 1.15 (95% confidence interval (CI) 1.10 – 1.21)] and ND [HR 1.24 (95% CI 1.18 – 1.31), p<0.001 for both], NIRD had higher risk of stroke compared to ND [HR 1.08 (95% CI 1.05 – 1.12), p<0.001]. Supplemental Table 2 shows the full-adjusted model for the outcome of stroke. When anticoagulant use was added to the model as a time dependent variable, the overall hazard ratio (HR) for stroke associated with anticoagulant use was 0.85 (95% CI, 0.83 - 0.87; p<0.001). However, there was a significant interaction between diabetes category and anticoagulant use (p<0.001). Anticoagulants were most effective at preventing stroke in ND (HR=0.74; 95% CI, 0.72-0.77; p<0.001), and NIRD (HR=0.86; 95% CI, 0.83-0.90; p<0.001), but were not associated with significant reduction in stroke among patients using insulin (HR=0.94 (0.87-1.02; p=0.09). Similarly in the relative excess risk due to interdependence (RERI) model, anticoagulation use was not associated with significant reduction in stroke risk among IRD patients (RERI=0.0001, 95% CI (−0.1559, 0.1562), p=NS). When analysis was restricted to patients who never initiated OAC, and in analysis that separately examined patients with and without any OAC in the first 365 days after AF diagnosis, results remained the same (Table 3).
Table 2:
Primary study outcomes, stroke and acute myocardial infarction (MI), in the three study groups
| Insulin requiring diabetics | Non-insulin requiring diabetics | Non-diabetics | P value | ||
|---|---|---|---|---|---|
| Stroke | Number of events | 2,347 (4.4%) | 9,314 (3.7%) | 16,797 (3.4%) | <0.001 |
| Event rate per 100 person-year follow up | 2.6 | 2.3 | 2.0 | ||
| MI | Number of events | 2,274 (4.3%) | 7,014 (2.8%) | 9,632 (1.9%) | <0.001 |
| Event rate per 100 person-year follow up | 2.5 | 1.7 | 1.1 |
Table 3:
Relative hazard of Stroke and Myocardial Infarction by diabetes group based on multivariable Cox regression models with and without controlling for oral anticoagulant use
| Outcome | Model | Hazard ratio | 95% confidence interval | P value |
|---|---|---|---|---|
| Stroke | Without adjusting for anticoagulation* | |||
| Insulin requiring diabetics vs. non-diabetics | 1.24 | 1.18-1.31 | <0.01 | |
| Insulin vs. non-insulin requiring diabetics | 1.15 | 1.10-1.21 | <0.01 | |
| Non-insulin requiring diabetics vs. non-diabetics | 1.08 | 1.05-1.12 | <0.01 | |
| With time dependent anticoagulation use* | ||||
| Insulin requiring diabetics vs. non-diabetics | 1.24 | 1.18-1.31 | <0.01 | |
| Insulin vs. non-insulin requiring diabetics | 1.15 | 1.09-1.20 | <0.01 | |
| Non-insulin requiring diabetics vs. non-diabetics | 1.08 | 1.05-1.12 | <0.01 | |
| In patients who did not use anticoagulation* | ||||
| Insulin-requiring diabetics vs. non-diabetics. | 1.21 | 1.11-1.32 | <0.01 | |
| Non-insulin requiring diabetics vs. non-diabetics | 1.08 | 1.03-1.14 | 0.002 | |
| Insulin vs. Non-insulin requiring diabetics | 1.12 | 1.04-1.21 | 0.005 | |
| MI | Without adjusting for anticoagulation* | |||
| Insulin requiring diabetics vs. non-diabetics | 1.46 | 1.38-1.54 | <0.01 | |
| Insulin vs. non-insulin requiring diabetics | 1.24 | 1.18-1.31 | <0.01 | |
| Non-insulin requiring diabetics vs. non-diabetics | 1.17 | 1.13-1.22 | <0.01 | |
| With time dependent anticoagulation use* | ||||
| Insulin requiring diabetics vs. non-diabetics | 1.47 | 1.39-1.55 | <0.01 | |
| Insulin vs. non-insulin requiring diabetics | 1.25 | 1.19-1.31 | <0.01 | |
| Non-insulin requiring diabetics vs. non-diabetics | 1.18 | 1.13-1.22 | <0.01 | |
Cox multivariable models controlled for patient demographics (age, sex, race), comorbidity, diabetes microvascular complications, medication use at time of AF diagnosis, and prior health services use. Full models are shown in supplemental material.
For the outcome of MI, in the adjusted model, IRD had a higher risk of MI compared to NIRD [HR 1.24 (95% CI 1.18 – 1.31)] and ND [HR 1.46 (95% CI 1.38 – 1.54), P<0.001 for both]. Similarly, NIRD had higher risk of MI compared to ND [1.17 (1.13 – 1.22), p<0.001]. Supplemental Table 3 shows the full-adjusted model for the outcome of MI. When anticoagulant use was added to the model as a time dependent variable, the overall hazard ratio (HR) for MI associated with anticoagulant use was 0.86 (95% CI, 0.83-0.88; p<0.001). Similar to stroke, there was a significant interaction between diabetes category and anticoagulant use (p<0.001). Anticoagulants were most effective at preventing MI in ND (HR=0.84; 95% CI, 0.81-0.87; p<0.001), and NIRD (HR=0.85; 95% CI, 0.82-0.90; p<0.001), but were not associated with significant reduction in MI among patients using insulin (HR=0.94; 95% CI, 0.86-1.02). Similarly on the additive model with relative excess risk due to interdependence model, anticoagulation was not associated with significant reduction in MI risk in IRD (RERI=0.0099, 95% CI (−0.1297, 0.1494), P=NS).
Discussion
We report several findings in this study of Medicare population with AF. First, there was a significant incremental risk for stroke and MI in our three groups based on diabetic status and insulin use, where IRD had the highest risk, followed by NIRD and then non-diabetics. Second, while OAC therapy was effective overall in reducing risk of stroke and MI, this protective effect was diminished in diabetic AF patients who used insulin.
Multiple mechanisms may explain the hierarchical risk association, whereby IRD have the highest risk for both stroke and MI outcomes, followed by NIRD and then ND. First, DM can alter the left atrium both structurally (deposition of glycated products and connexin-mediated fibrosis) and electrically (affecting intra-atrial conduction)[20,21], thereby promoting thromboembolism. Second, DM, in addition to accelerating atherosclerosis, is associated with higher levels of Von Willibrand factor, soluble P-selectin, and markers of platelet activation and inflammation [22,23]. These mechanisms increase risk of atherothrombosis. Finally, IRD, by virtue of having more advanced disease and/or via exogenous insulin use, are hypercoagulable [24] with a higher tendency to form clots [25–27] and have greater oxidative stress and inflammation. [28,29]
Our study raises the question whether advanced diabetes requiring insulin therapy confers a significantly elevated risk of thromboembolism beyond what can be mitigated by anticoagulant therapy, and whether this should be reflected in scores used to calculate risk for stroke and MI in AF patients (e.g., CHA2DS2-Vasc). In a recent study from the prospective PREFER registry,[10] stroke risk was higher in IRD, compared to NIRD and ND. However, contrary to our study, risk of stroke was similar between NIRD and ND. This could be due to the small sample size of NRD included in that study (n=1000) compared to 250,000 in our study, given that the magnitude of risk difference is modest in our study. Furthermore, in the PREFER study, controlling for OAC use did not alter their findings. Other studies using contemporary AF registries such as the ORBIT-AF and others have shown that among anticoagulated patients with AF, the risk of stroke in all DM patients were similar to their counterparts without DM [30,31] . They attribute this attenuation of risk in DM patients to effective anticoagulation. These studies did not examine stroke risk according to insulin use among DM patients, and failure to distinguish IRD and NIRD may dilute any increased stroke risk among DM patients. However, comparative inference that may be drawn based on these registries, our analysis, and Patti et el. [10], is that anticoagulation may mitigate thromboembolic risk in most diabetic patients except those with advanced disease who have the need for insulin to maintain euglycemia.
Similar to our findings regarding stroke risk, the risk of MI (an atherothrombotic outcome) also suggests a hierarchical risk association: IRD had highest risk, followed by NIRD and then ND. We were unable to find another study that had assessed MI outcome by categories of insulin use among DM patients with AF. In a sub-study by Marzona et al [32] that included patients with DM at very high risk and one or more CV risk factors or microvascular disease, multivariate analysis showed that insulin treatment in diabetics was associated with 81% risk of major CV events (non-fatal MI, non-fatal stroke and CV death) compared with no insulin treatment. That study was however not limited to patients with atrial fibrillation and there was no comparison to non-diabetics. In a study using the ORBIT-AF [30] registry, DM patients had higher risk of CV hospitalization, sudden cardiac death and CV mortality compared to patients without DM in spite of anticoagulation use. As with stroke, MI outcomes were not reported by categories of insulin use. From ORBIT-AF and our results, it may be inferred that anticoagulation alone may not suffice to decrease risk of CV outcomes in AF patients with advanced DM requiring insulin. A question remains whether direct oral anticoagulants such as dabigatran or apixaban offer better protection in this setting or not.
An analysis using Framingham data[33] showed that although DM significantly increased risk of cardiovascular events, much of this excess risk may be attributed to comorbid diseases like hypertension and advanced renal impairment (nearly 30 - 40% attributable risk). Hence, it may be the comorbid illnesses that accompany DM, rather than DM itself, that increases MI risk and also explains the increased MI risk in all DM patients regardless of insulin use. It is unclear whether exogenous insulin use increases adverse outcomes in IRD, or whether insulin use represents advanced disease that predisposes patients with DM to worse outcomes. Explaining these important pathological underpinnings is beyond the scope of our paper and future studies are needed to answer these questions. It may be of interest to see if newer oral hypoglycemic drugs such as glucagon-like peptides or sodium glucose cotransporter-2 inhibitors can be used in lieu of insulin in high risk patients to further reduce adverse outcomes [34].
Although the strengths of our study include using a large, nationally representative sample, with robust adjustment for confounders, several limitations of our analysis needs to be considered. First, we lacked some prognostic variables that may be related to stroke risk, such as duration of diabetes, insulin dose, and glycated hemoglobin values. However, we used presence of microvascular complications as a proxy measure to duration of diabetes in our models. Second, for the outcome of MI, patients hospitalized for AF may have had troponin elevation because of the mechanism of demand-supply mismatch and could have received a diagnosis of MI. This is a known limitation of ICD-9 based MI outcome determination [35]. Future prospective studies with validated MI outcome determination are needed. Also, we had a relatively short follow-up period after AF diagnosis (median 14 months). Hence it needs to be determined if these associations will persist with longer follow-up. We also lacked information on INR levels in patients who were using warfarin and time in therapeutic range. Finally, we did not control for possible differences in anticoagulation adherence in our analysis, which may explain the lack of effective stroke and MI protection in IRD patients if IRD patients have poorer adherence or persistence compared to NIRD and ND patients. However, additional analysis revealed that OAC persistence is at least as good or better among IRD patients compared to the other two groups (e.g., among patients who initiated OAC, the prevalence of at least three months of continuous use of OAC in insulin-requiring diabetics was 45.3% compared to 41.9% and 41.8% in non-insulin diabetics and nondiabetics, respectively (p<0.001). Given that persistence of OAC use in insulin-requiring diabetics was at least as good or better than OAC use in non-insulin diabetics and non-diabetics, differences in OAC persistence do not explain the poor efficacy of OAC use in insulin-requiring diabetics.
In conclusion, among patients with AF, IRD is associated with higher risk of thromboembolic and atherothrombotic outcomes compared to NIRD and ND. In fact IRD appear to derive the least benefit from anticoagulation in terms of mitigating these risks. Hence, future studies should assess if incorporation of IRD in stroke prediction risk algorithms will improve stroke prediction in this high risk group and whether DOAC’s or new diabetic medications might offer additional protection against CV outcomes in this setting.
Supplementary Material
Figure 1:

Kaplan Meier curves for the outcome stroke in the three study groups. Log-rank test p <0.0001
Figure 2:
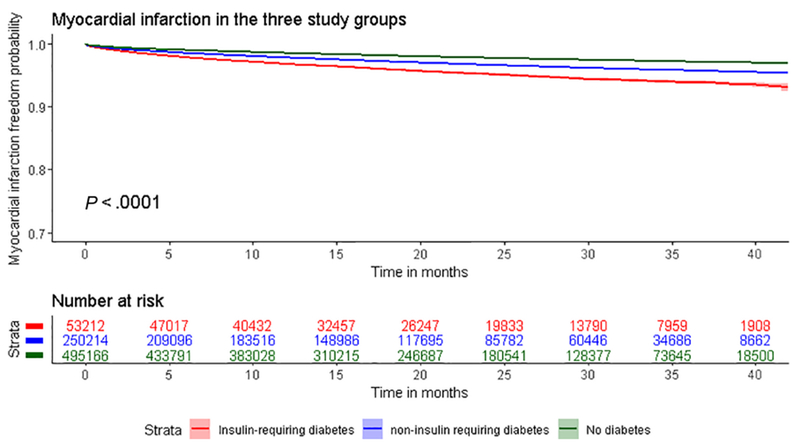
Kaplan Meier curves for the outcome acute myocardial infarction in the three study groups. Log-rank test p <0.0001
Risk of stroke and MI is incremental in AF diabetic patients.
Risk of stroke in AF is higher in insulin versus non-insulin requiring diabetics.
Risk of MI in AF is higher in insulin versus non-insulin requiring diabetics.
Insulin use seems to attenuate the protective effect of oral anticoagulation in AF.
Acknowledgments
Funding: This study is supported by funding from the Agency for Healthcare Research and Quality (AHRQ; R01 HS023104), and by the Health Services Research and Development Service (HSR&D) of the Department of Veterans Affairs.
Footnotes
Publisher's Disclaimer: This is a PDF file of an unedited manuscript that has been accepted for publication. As a service to our customers we are providing this early version of the manuscript. The manuscript will undergo copyediting, typesetting, and review of the resulting proof before it is published in its final citable form. Please note that during the production process errors may be discovered which could affect the content, and all legal disclaimers that apply to the journal pertain.
Disclosures: The authors do not have any conflicts of interest or financial relationships related to the content of this manuscript. All authors had access to the data and participated in the design and writing of the manuscript. The views expressed here are those of the authors and do not represent the Department of Veterans Affairs.
Reference:
- 1.Piccini JP, Hammill BG, Sinner MF, et al. Incidence and Prevalence of Atrial Fibrillation and Associated Mortality Among Medicare Beneficiaries: 1993-2007. Circ Cardiovasc Qual Outcomes 2012;5:85–93. doi: 10.1161/CIRCOUTCOMES.111.962688 [DOI] [PMC free article] [PubMed] [Google Scholar]
- 2.Wolf PA, Abbott RD, Kannel WB. Atrial fibrillation as an independent risk factor for stroke: the Framingham Study. Stroke 1991;22:983–8. doi: 10.1161/01.STR.22.8.983 [DOI] [PubMed] [Google Scholar]
- 3.Violi F, Soliman EZ, Pignatelli P, et al. Atrial Fibrillation and Myocardial Infarction: A Systematic Review and Appraisal of Pathophysiologic Mechanisms. J Am Heart Assoc 2016;5:e003347. doi: 10.1161/JAHA.116.003347 [DOI] [PMC free article] [PubMed] [Google Scholar]
- 4.Hart RG, Pearce LA, Aguilar MI. Meta-analysis: Antithrombotic therapy to prevent stroke in patients who have nonvalvular atrial fibrillation. Ann. Intern. Med. 2007;146:857–67. doi: 10.7326/0003-4819-146-12-200706190-00007 [DOI] [PubMed] [Google Scholar]
- 5.Guo Y, Lip GYH, Apostolakis S. Inflammation in Atrial Fibrillation. J Am Coll Cardiol 2012;60:2263–70. doi: 10.1016/j.jacc.2012.04.063 [DOI] [PubMed] [Google Scholar]
- 6.O’Neal WT, Soliman EZ, Howard G, et al. Inflammation and hemostasis in atrial fibrillation and coronary heart disease: The REasons for Geographic And Racial Differences in Stroke study. Atherosclerosis 2015;243:192–7. doi: 10.1016/j.atherosclerosis.2015.09.009 [DOI] [PMC free article] [PubMed] [Google Scholar]
- 7.Gage BF, Waterman AD, Shannon W, et al. Validation of clinical classification schemes for predicting stroke: results from the National Registry of Atrial Fibrillation. JAMA 2001;285:2864–70. doi: 10.1001/jama.285.22.2864 [DOI] [PubMed] [Google Scholar]
- 8.Lip GYH, Nieuwlaat R, Pisters R, et al. Refining clinical risk stratification for predicting stroke and thromboembolism in atrial fibrillation using a novel risk factor-based approach: the euro heart survey on atrial fibrillation. Chest 2010;137:263–72. doi: 10.1378/chest.09-1584 [DOI] [PubMed] [Google Scholar]
- 9.Ashburner JM, Go AS, Chang Y, et al. Effect of diabetes and glycemic control on ischemic stroke risk in AF patients ATRIA study. J Am Coll Cardiol 2016;67:239–47. doi: 10.1016/j.jacc.2015.10.080 [DOI] [PMC free article] [PubMed] [Google Scholar]
- 10.Patti G, Lucerna M, Cavallari I, et al. Insulin-Requiring Versus Noninsulin-Requiring Diabetes and Thromboembolic Risk in Patients With Atrial Fibrillation: PREFER in AF. J Am Coll Cardiol 2017;69:409–19. doi: 10.1016/j.jacc.2016.10.069 [DOI] [PubMed] [Google Scholar]
- 11.Go AS, Hylek EM, Chang Y, et al. Anticoagulation therapy for stroke prevention in atrial fibrillation: how well do randomized trials translate into clinical practice? JAMA 2003;290:2685–92. doi: 10.1001/jama.290.20.2685 [DOI] [PubMed] [Google Scholar]
- 12.Ellis ER, Culler SD, Simon AW, et al. Trends in utilization and complications of catheter ablation for atrial fibrillation in Medicare beneficiaries. Hear Rhythm 2009;6:1267–73. doi: 10.1016/j.hrthm.2009.06.009 [DOI] [PMC free article] [PubMed] [Google Scholar]
- 13.Gage BF, Boechler M, Doggette AL, et al. Adverse outcomes and predictors of underuse of antithrombotic therapy in medicare beneficiaries with chronic atrial fibrillation. Stroke 2000;31:822–7. [DOI] [PubMed] [Google Scholar]
- 14.Elixhauser A, Steiner C, Harris DR, et al. Comorbidity measures for use with administrative data. Med Care 1998;36:8–27. [DOI] [PubMed] [Google Scholar]
- 15.Pisters R, Lane DA, Nieuwlaat R, et al. A novel user-friendly score (HAS-BLED) to assess 1-year risk of major bleeding in patients with atrial fibrillation: the Euro Heart Survey. Chest 2010;138:1093–100. doi: 10.1378/chest.10-0134 [DOI] [PubMed] [Google Scholar]
- 16.Rothendler JA, Rose AJ, Reisman JI, et al. Choices in the use of ICD-9 codes to identify stroke risk factors can affect the apparent population-level risk factor prevalence and distribution of CHADS2 scores. Am J Cardiovasc Dis 2012;2:18491. [PMC free article] [PubMed] [Google Scholar]
- 17.Suh D-C, Nelson WW, Choi JC, et al. Risk of Hemorrhage and Treatment Costs Associated With Warfarin Drug Interactions in Patients With Atrial Fibrillation. Clin Ther 2012;34:1569–82. doi: 10.1016/j.clinthera.2012.05.008 [DOI] [PubMed] [Google Scholar]
- 18.Fine JP, Gray RJ. A Proportional Hazards Model for the Subdistribution of a Competing Risk. J Am Stat Assoc 1999;94:496–509. doi: 10.1080/01621459.1999.10474144 [DOI] [Google Scholar]
- 19.Vanderweele TJ, Knol MJ. A Tutorial on Interaction. Epidemiol Methods 2014;:aop. doi: 10.1515/em-2013-0005 [DOI] [Google Scholar]
- 20.Plitt A, McGuire DK, Giugliano RP. Atrial Fibrillation, Type 2 Diabetes, and Non-Vitamin K Antagonist Oral Anticoagulants: A Review. JAMA Cardiol 2017;2:442–8. doi: 10.1001/jamacardio.2016.5224 [DOI] [PubMed] [Google Scholar]
- 21.Goudis CA, Korantzopoulos P, Ntalas IV., et al. Diabetes mellitus and atrial fibrillation: Pathophysiological mechanisms and potential upstream therapies. IntJ Cardiol 2015;184:617–22. doi: 10.1016/j.ijcard.2015.03.052 [DOI] [PubMed] [Google Scholar]
- 22.Conway DSG, Pearce LA, Chin BSP, et al. Plasma von Willebrand factor and soluble p-selectin as indices of endothelial damage and platelet activation in 1321 patients with nonvalvular atrial fibrillation: relationship to stroke risk factors. Circulation 2002;106:1962–7. [DOI] [PubMed] [Google Scholar]
- 23.Ferro D, Loffredo L, Polimeni L, et al. Soluble CD40 ligand predicts ischemic stroke and myocardial infarction in patients with nonvalvular atrial fibrillation. Arterloscler Thromb Vase Biol 2007;27:2763–8. doi: 10.1161/ATVBAHA.107.152777 [DOI] [PubMed] [Google Scholar]
- 24.El Khawand C, Jamart J, Donckier J, et al. Hemostasis variables in type I diabetic patients without demonstrable vascular complications. Diabetes Care 1993;16:1137–45. [DOI] [PubMed] [Google Scholar]
- 25.Rathcke CN, Persson F, Tarnow L, et al. YKL-40, a Marker of Inflammation and Endothelial Dysfunction, Is Elevated in Patients With Type 1 Diabetes and Increases With Levels of Albuminuria. Diabetes Care 2009;32:323–8. doi: 10.2337/dc08-1144 [DOI] [PMC free article] [PubMed] [Google Scholar]
- 26.Carmassi F, Morale M, Puccetti R, et al. Coagulation and fibrinolytic system impairment in insulin dependent diabetes mellitus. Thromb Res 1992;67:643–54. [DOI] [PubMed] [Google Scholar]
- 27.Madonna R, De Caterina R. Cellular and molecular mechanisms of vascular injury in diabetes-part I: pathways of vascular disease in diabetes. Vascul Pharmacol 2011;54:68–74. doi: 10.1016/j.vph.2011.03.005 [DOI] [PubMed] [Google Scholar]
- 28.Fasching P, Veitl M, Rohac M, et al. Elevated concentrations of circulating adhesion molecules and their association with microvascular complications in insulin-dependent diabetes mellitus. J Clin Endocrinol Metab 1996;81:4313–7. doi: 10.1210/jc.81.12.4313 [DOI] [PubMed] [Google Scholar]
- 29.Elhadd TA, Kennedy G, Hill A, et al. Abnormal markers of endothelial cell activation and oxidative stress in children, adolescents and young adults with type 1 diabetes with no clinical vascular disease. Diabetes Metab Res Rev 1999;15:405–11. [DOI] [PubMed] [Google Scholar]
- 30.Echouffo-Tcheugui JB, Shrader P, Thomas L, et al. Care Patterns and Outcomes in Atrial Fibrillation Patients With and Without Diabetes. J Am Coll Cardiol 2017;70:1325–35. doi: 10.1016/j.jacc.2017.07.755 [DOI] [PubMed] [Google Scholar]
- 31.Stöllberger C, Chnupa P, Abzieher C, et al. Mortality and Rate of Stroke or Embolism in Atrial Fibrillation during Long-Term Follow-Up in the Embolism in Left Atrial Thrombi (ELAT) Study. Clin Cardiol 2004;27:40–6. doi: 10.1002/clc.4960270111 [DOI] [PMC free article] [PubMed] [Google Scholar]
- 32.Marzona I, Avanzini F, Lucisano G, et al. Are all people with diabetes and cardiovascular risk factors or microvascular complications at very high risk? Findings from the Risk and Prevention Study. Acta Diabetol 2017;54:123–31. doi: 10.1007/s00592-016-0899-0 [DOI] [PubMed] [Google Scholar]
- 33.Chen G, McAlister FA, Walker RL, et al. Cardiovascular outcomes in framingham participants with diabetes: The importance of blood pressure. Hypertension 2011;57:891–7. doi: 10.1161/HYPERTENSIONAHA.110.162446 [DOI] [PMC free article] [PubMed] [Google Scholar]
- 34.Marso SP, Bain SC, Consoli A, et al. Semaglutide and Cardiovascular Outcomes in Patients with Type 2 Diabetes. N Engl J Med 2016;375:1834–44. doi: 10.1056/NEJMoal607141 [DOI] [PubMed] [Google Scholar]
- 35.Díaz-Garzón J, Sandoval Y, Smith SW, et al. Discordance between ICD-coded myocardial infarction and diagnosis according to the Universal Definition of Myocardial Infarction. Clin Chem 2017;63:415–9. doi: 10.1373/clinchem.2016.263764 [DOI] [PubMed] [Google Scholar]
Associated Data
This section collects any data citations, data availability statements, or supplementary materials included in this article.