

Abstract
Although the postoperative recurrence rate for pancreatic neuroendocrine tumors (PNETs) is reported to be 13.5%‐30%, the paucity of valuable biomarkers to predict recurrence poses a problem for the early detection of relapse. Hence, this study aimed to identify new biomarkers to predict the recurrence of PNETs. We performed RNA sequencing (RNA‐Seq) on RNA isolated from frozen primary tumors sampled from all localized G1/G2 PNETs resected curatively from 1998 to 2015 in our institution. We calculated differentially expressed genes (DEGs) in tumor with and without recurrence (≥3 years) for the propensity‐matched cohort. Gene ontology analysis for the identified DEGs was also performed. Furthermore, we evaluated the expression levels of candidate genes as recurrence predictors via immunostaining. Comparison of transcriptional levels in tumors with and without recurrence identified 166 DEGs. Up‐ and downregulated genes with high significance in these tumors were mainly related to extracellular organization and cell adhesion, respectively. We observed the top three upregulated genes, C‐type lectin domain family 3 member A (CLEC3A), matrix metalloproteinase‐7 (MMP7), and lipocalin2 (LCN2) immunohistochemically and compared their levels in recurrent and nonrecurrent tumors. Significantly higher recurrence rate was shown in patients with positive expression of CLEC3A (P = 0.028), MMP7 (P = 0.003), and LCN2 (P = 0.040) than that with negative expression. We identified CLEC3A, MMP7, and LCN2 known to be associated with the phosphatidylinositol‐3‐kinase/Akt pathway, as potential novel markers to predict the postoperative recurrence of PNETs.
Keywords: C type lectin domain family 3 member A, lipocalin2, matrix metalloproteinase‐7, pancreatic neuroendocrine tumors
1. INTRODUCTION
The detection of pancreatic neuroendocrine tumors (PNETs) is increasing due to improved diagnostic performance, with the incidence is reported to have increased by 10%.1, 2
Surgical resection—the only treatment known to achieve a cure—is recommended for locoregional disease control and should still be considered for patients with advanced disease if it can be performed safely.3 However, the recurrence rate is reported to be 13.5%‐30%,4, 5, 6, 7 with the median duration from resection to recurrence from 2 to 3.3 years.8 Certain studies identified mitotic rates,2 nonfunctioning status,2, 4 tumor size > 2 cm,9 G2 tumor grade,4 N1 status,9 and the presence of vascular invasion4 as recurrence predictors. Studies have established a risk stratification to predict recurrence by combining TNM stage, Ki‐67,10 and functionality.5 However, the identification of patients with high risk for recurrence remains challenging.
Currently, transcriptome analysis with microarray and RNA‐sequencing (RNA‐Seq) in PNETs has become widespread, as is also the case with other malignant tumors. Several studies have explored the differences in messenger RNA (mRNA) expression associated with the clinicopathological aspects of PNETs.11, 12, 13, 14 For instance, a bioinformatics analysis using GEO datasets identified CXCR4‐CXCL12‐CXCR7 as an overexpressed axis in PNETs with metastasis compared with PNETs without metastasis.14
Furthermore, successful transcriptomic analysis to identify PNETs biomarkers has been reported. A PCR‐based 51‐transcript signature (NETest) identified by a multianalyte assay is available as a blood biomarker for PNETs detection and prediction of disease progression.15, 16, 17 The accuracy of this test was superior to that of monoanalyte markers such as chromogranin A and neuron‐specific enolase.
Recently, Kudo et al18 identified the downregulation of pancreatic beta cell genes in tumors with simultaneous liver metastasis and found that low expression levels of PAX6, one of the pancreatic beta cell genes, was the most useful predictor for poor prognosis using genome‐wide gene expression analysis.
However, to the best of our knowledge, no study has yet performed comprehensive gene expression analysis to compare tumors with and without recurrence after R0 resection. Herein, we performed RNA‐Seq analysis for PNETs that included those with recurrence. We also confirmed the utility of some DEGs identified as predictive markers using immunohistochemistry.
2. MATERIALS AND METHODS
2.1. Patients
Candidates for the present study were patients with localized G1/G2 PNETs, as defined by the WHO 2017 classification,19 who underwent curative resection between January 1998 and December 2015 and received follow‐up care for three or more years at Kyushu University Hospital. None received neoadjuvant therapy. After surgical treatment for PNETs, all patients underwent laboratory tests and contrast‐enhanced computed tomography (CT) and/or magnetic resonance imaging (MRI) every 3 to 6 months. The disease‐free survival (DFS) was defined as the duration between surgery and detection of a new lesion. For the analysis, we acquired the retrospective clinical information as following: age at surgery, disease stage, tumor size, tumor grade, lymph node status, recurrence. Written informed consent was obtained from each subject as required by the Declaration of Helsinki. All study procedures were approved by an institutional review board (The Human Research Ethics Committee, Kyushu University ID: 29‐183).
2.2. Tissue samples
Within 2 hours of resection, tumor and nonneoplastic pancreatic tissues were chopped into 3‐4 mm cubes using a double‐edged razor then placed into the shallow pockets of a freezing plate (Meiko Medical) with 2‐3 mL a small amount of Tissue‐Tek® OCT™ compound (Sakura Finetek) and frozen by liquid nitrogen for 20‐30 seconds until completely frozen as previously described.20 We conducted gene expression analysis by performing RNA‐Seq on frozen primary tumor specimens and nonneoplastic pancreatic tissues from the patients.
2.3. RNA extraction and sequencing
The tissue‐embedded frozen tablets were transferred into cryovial tubes and stored at −70°C. Frozen sections were then cut into 5‐μm thick specimens according to the general procedure used for conventional OCT blocks, then mounted on glass slides. Hematoxylin and eosin (H&E) staining was performed to confirm that the sample was a neoplastic (or nonneoplastic) section. Then 10 slices of 10‐μm specimen were mixed with RLT solution and the RNA was extracted with RNeasy® Mini Kit (QIAGEN) according to the manufacturer's instructions. RNA‐Seq library preparation using CEL‐Seq2 was performed as previously described,21, 22 using 10‐30 ng of RNA for each library. The libraries were sequenced on Illumina HiSeq 1500 sequencers (Illumina) and the reads were mapped to the GRCh38 human reference genome assembly using HISAT (v. 2.2.6).23
2.4. Gene expression analysis
For downstream analysis, the mapped data were converted to counts per million (CPM) and log2‐transformed. To obtain enough counts for each gene, samples with at least 1 CPM in the third quartile of the transcripts were extracted as objects. Differential gene expression analysis between representative samples was performed using the R statistical software package, version 3.0.3 (R Project) and edgeR.24 Genes with an adjusted false discovery rate (FDR) <0.01 and absolute values of log FC > 1 were considered to be differentially expressed genes (DEGs). Furthermore, to investigate the differences in gene expression patterns between groups, gene ontology enrichment analysis was conducted with the clusterProfiler package in R.25
2.5. Primary antibodies
We used the following antibodies: rabbit polyclonal CLEC3A antibody (#185282; Abcam) at 1:5000; goat polyclonal LCN2 antibody (AF1757; R&D‐Systems) at 5 μg/mL; rabbit polyclonal MMP7 antibody (10374‐2‐AP; Proteintech) at 1:100; and rabbit polyclonal GHRH antibody (#187512; Abcam) at 1:100.
All antibodies were diluted with phosphate‐buffered saline (PBS).
2.6. Immunohistochemistry (IHC)
Four‐micrometer‐thick paraffin tissue sections were deparaffinized with xylene and graded ethanol. After deparaffinization and washing in PBS for three times, antigen retrieval was performed by heating citrate buffer (pH 6.0) at 100°C for 20 minutes. Endogenous peroxidase activity was blocked by incubating the sliced sections with 3% hydrogen peroxide in methanol for 30 minutes. After washing in PBS for three times and incubation in blocking buffer, primary antibody was applied to the tissue sections for 1 hour at room temperature. We applied a streptavidin‐biotin‐peroxidase method for the immunohistochemical reaction against CLEC3A, MMP7, and GHRH using a VECTASTAIN Elite ABC Rabbit IgG Kit (Vector Laboratories). For immunoreaction against LCN2, a polymer system was applied using Goat IgG VisUCyte HRP Polymer (VC004‐025, R&D‐Systems). All tissue sections were visualized with diaminobenzidine (DAB) and counterstained with hematoxylin. Representative photomicrographs were recorded using a digital camera (BZ‐X700; Keyence).
2.7. Evaluation of immunostaining
All slides were evaluated by two experienced observers in the absence of patients' clinical data. The immunostaining was assessed in five fields (×200 magnification) for each slide. To evaluate MMP7 expression, the intensity of the staining was graded into four (0 = negative; 1 = weak; 2 = moderate; 3 = strong) and the extent of staining was divided into five categories: 0 = 0%‐5%; 1 = 6%‐25%; 2 = 26%‐50%; 3 = 51%‐75%; and 4 = 76%‐100%. The score was calculated by multiplying the intensity and the extent of staining to produce a range of immunostaining scores from 0 to 12. The immunostaining was considered positive when the scores were ≥3, as a previous study conducted.26
For evaluation of LCN2 expression, we applied a four‐grade scoring system27 corresponding to the sum of staining intensity (0 = negative; 1 = weak; 2 = moderate; 3 = strong) and the percentage of positive cells (0 = 0%; 1 = 1%‐25%; 2 = 26%‐50%; 3 = 51%‐100% positive cells), as described in a previous study.28 A score ≥3 represented a positive expression. We also apply the same method as LCN2 to evaluate the CLEC3A, because there is no literature to refer.
As for GHRH, score was assessed by only staining area; 0 = 0%;1 = 1%‐9%; 2 = 10%‐49%; 3 = 50%‐100%), and a score 3 was considered to be positive expression according to a previous study.29
2.8. Propensity score matching (PSM)
To compare the expression levels in PNETs with and without recurrence while minimizing the effect of confounders on the selection bias, we calculated propensity scores by using binary logistic regression which included the following variables: gender, age (<60/≥60), tumor grade (G1/G2), functionality (functioning/nonfunctioning), tumor site (Ph/other site), tumor size (<2 cm/≥2 cm), lymph node status (N0/N1), operative approach (open surgery/laparoscopic surgery), history of diabetes mellitus (presence/absence), and BMI (<25/≥25). The resultant score was then used to match tumors with recurrence to those without recurrence for one to one propensity score matching.30, 31
2.9. Statistical analyses
Statistical analyses were performed using JMP ver. 12 (SAS Institute Inc.). The Chi‐squared test or Fisher's exact test was applied to analyze categorical variables. Two‐sided Student's t‐tests were used to analyze the differences between continuous values of two independent groups. P‐values ≤ 0.05 in the two‐tailed tests were considered significant. Survival curves for relapse were generated using the Kaplan‐Meier method.
3. RESULTS
3.1. Study population
A total of 115 patients underwent R0 surgical resection and were diagnosed with G1/G2 PNETs from 1998 to 2015. Ninety‐three patients received follow‐up care for more than 3 years at our institution. The median follow‐up period for the patients was 83.3 months with a range from 3 to 227 months. In this population, 16 patients (13.9%) experienced recurrence with a median time to recurrence of 19 months and a range from 2 to 77 months; 5 patients (4.3%) died as a result of their PNETs. Twelve in sixteen (75%) patients experienced relapse within 3 years after resection (Figure S1). Figure 1 shows the flowchart for the selection of samples for RNA‐Seq. After excluding 10 samples for RNA‐Seq, 83 samples of the patients followed up more than 3 years were available. Among them, we chose 18 samples (each 9 samples with and without recurrence) for IHC analysis by applying PSM.
Figure 1.
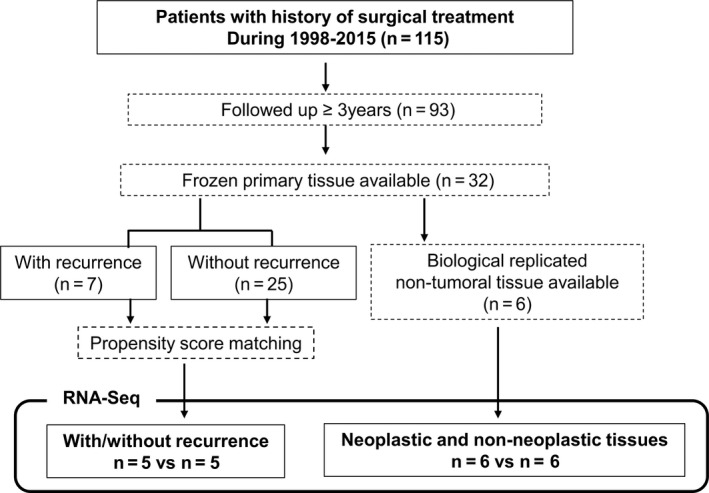
Flowchart for the selection of samples for RNA‐sequencing (RNA‐Seq). Seven and twenty‐five frozen samples of tumors with and without recurrence were available, respectively. The one to one propensity score matching selected five tumor samples in each group (total of 10 samples). We also performed RNA‐Seq for six pairs of samples (neoplastic and nonneoplastic tissue), enabling us to analyze biological replicates
3.2. DEG analysis and GO analysis of tumor and nonneoplastic tissue
To validate the sequencing data, we conducted pairwise comparisons of differential gene expression profiles by analyzing six independent biological replicates from each tumor and nonneoplastic tissue. We identified 1765 DEGs with false discovery rates <0.01(Table S1). According to GO analysis, upregulated genes in neoplastic tissues were related to transsynaptic signaling and transport function. Downregulated genes in tumors were related to digestion and immune response (Table S2). These results are consistent with a previous study of a microarray‐based gene expression database of PNET tissue samples.11
3.3. DEG analysis in tumors with and without recurrence
We compared gene expression profiles between tumors with and without recurrence for 10 samples (five pairs) selected by PSM. Table1 shows characteristics of the 10 patients. One hundred and sixty‐six DEGs (114 upregulated genes and 52 downregulated genes) in tumors with recurrence vs without recurrence were identified (Table S3). The significantly upregulated genes in tumors were CLEC3A, MMP7, LCN2, JCHAIN, OLFM4, and PIGR. The significantly downregulated genes were GHRH, PCDH19, DAPL1, CAPN13, ATP6V1B1, and FAM132B (Table 2).
Table 1.
Characteristics of RNA‐Seq cohort (five cases with recurrence and five cases without recurrence)
| Case | Recurrence | Age | Sex | Grade | Ki 67 index | Functioning/NF | Stage | Tumor size (mm) | Tumor site | MEN I | DFS (y) | Observation time (y) | Surgical procedure | Surgical approach | Recurrence site |
|---|---|---|---|---|---|---|---|---|---|---|---|---|---|---|---|
| 1 | Yes | 38 | M | G2 | 16 | NF | III | 55 | Pt | No | 0.46 | DP | Open | Liver | |
| 2 | Yes | 74 | M | G1 | 1 | Glucagonoma | III | 40 | Ph | No | 1.22 | PD | Open | Liver | |
| 3 | Yes | 54 | F | G2 | 3 | NF | IIB | 34 | Ph | No | 1.60 | PD | Open | Lymph node | |
| 4 | Yes | 46 | F | G2 | 5 | NF | III | 20 | Pb | No | 1.52 | DP | Open | Liver | |
| 5 | Yes | 26 | M | G1 | 1 | NF | IIA | 45 | Ph | No | 4.36 | PD | Open | Pt | |
| 6 | No | 58 | F | G1 | 1.4 | NF | IIA | 55 | Pt | Yes | 11.54 | DP | Open | ||
| 7 | No | 65 | F | G1 | 1 | NF | IB | 28 | Ph | No | 8.58 | PD | Open | ||
| 8 | No | 22 | M | G2 | 5 | Insulinoma | IB | 26 | Ph | No | 8.12 | PD | Open | ||
| 9 | No | 61 | M | G1 | 2 | NF | IA | 9 | Pt | No | 6.61 | DP | Laparo | ||
| 10 | No | 54 | M | G1 | 1 | NF | IIA | 45 | Pb | No | 4.47 | DP | Open |
Abbreviations: DP, distal pancreatectomy; Laparo, laparoscopic surgery; NF, nonfunctioning; Open, open surgery; PD, pancreatoduodenectomy; Pt, pancreatic tail.
Table 2.
Top 10 up‐ and down‐ differentially expressed genes in PNETs with versus without recurrence
| Genea | Full name | Log FC | Log CPM | P‐value | FDR | |
|---|---|---|---|---|---|---|
| Up | CLEC3A | C‐type lectin domain family 3 member A | 7.449534 | 6.033011 | 3.24E−20 | 4.41E−16 |
| MMP7 | Matrix metallopeptidase 7 | 6.349328 | 6.362255 | 1.45E−19 | 1.32E−15 | |
| LCN2 | Lipocalin 2 | 6.997872 | 5.460392 | 1.39E−17 | 9.48E−14 | |
| JCHAIN | Joining chain of multimeric IgA and IgM | 5.994763 | 6.460908 | 1.21E−16 | 6.60E−13 | |
| OLFM4 | Olfactomedin 4 | 5.480873 | 5.699948 | 1.47E−15 | 6.68E−12 | |
| PIGR | Immunoglobulin (Ig)‐like domain in the polymeric Ig receptor | 5.97792 | 4.957046 | 6.05E−15 | 2.36E−11 | |
| GLYATL3 | Glycine‐N‐acyltransferase like 3 | 4.910107 | 5.993577 | 3.24E−14 | 1.10E−10 | |
| PNLIPRP2 | Pancreatic lipase related protein 2 | 5.041008 | 6.376985 | 9.56E−14 | 2.89E−10 | |
| PIP | Prolactin induced protein | 5.868028 | 4.421805 | 1.32E−12 | 2.99E−09 | |
| IGLL5 | Immunoglobulin lambda like polypeptide 5 | 4.847139 | 5.856089 | 1.46E−12 | 3.06E−09 | |
| Down | GHRH | Growth hormone releasing hormone | −9.53901 | 7.635353 | 4.09E−26 | 1.11E−21 |
| PCDH19 | Protocadherin 19 | −5.52537 | 5.223632 | 1.41E−13 | 3.84E−10 | |
| DAPL1 | Death associated protein like 1 | −5.96133 | 4.898389 | 1.31E−12 | 2.99E−09 | |
| CAPN13 | Calpain 13 | −5.21838 | 4.241004 | 3.81E−10 | 4.14E−07 | |
| ATP6V1B1 | ATPase H + transporting V1 subunit B1 | −5.71936 | 4.048973 | 3.95E−10 | 4.14E−07 | |
| FAM132B | Family with sequence similarity 132, member B | −4.78501 | 4.266354 | 1.47E−09 | 1.38E−06 | |
| AMPH | Amphiphysin | −3.4293 | 6.888431 | 1.91E−09 | 1.71E−06 | |
| DCC | DCC netrin 1 receptor | −3.36619 | 4.150392 | 1.62E−06 | 0.00049 | |
| ZCCHC12 | Zinc finger CCHC‐type containing 12 | −3.33079 | 4.140206 | 1.21E−06 | 0.000385 | |
| NEFM | Neurofilament medium | −3.32982 | 6.450134 | 2.64E−08 | 1.56E−05 |
Abbreviations: CPM, count per million; Down, downregulated in PNETs with recurrence; FC, fold change; FDR, false discovery rate; Up, upregulated in PNETs with recurrence.
Genes are arranged in order of FDR from the smallest.
3.4. GO analysis in tumors with and without recurrence
As shown in Table 3, upregulated genes in tumors were related to extracellular organization. (eg, extracellular structure organization and extracellular matrix organization) and humoral response (eg, antimicrobial humoral response and humoral immune response). Downregulated genes in tumors were related to cell adhesion (eg, cell‐cell adhesion via plasma‐membrane adhesion molecules and hemophilic cell adhesion via plasmamembrane adhesion molecules).
Table 3.
Up and downregulated GO terms in gene ontology analysis of significant‐differentially regulated genes in PNETs with versus without recurrence
| IDa | GO term (biological process) | Gene ratio | Bg ratio | P‐value | P‐adjusted | |
|---|---|---|---|---|---|---|
| Up | GO:0043062 | Extracellular structure organization | 42/547 | 395/17 653 | 3.11E−12 | 1.29E−08 |
| GO:0030198 | Extracellular matrix organization | 36/547 | 341/17 653 | 1.42E−10 | 2.95E−07 | |
| GO:0019730 | Antimicrobial humoral response | 19/547 | 108/17 653 | 8.02E−10 | 1.11E−06 | |
| GO:0006959 | Humoral immune response | 32/547 | 329/17 653 | 1.15E−08 | 1.19E−05 | |
| GO:0006501 | C‐terminal protein lipidation | 14/547 | 77/17 653 | 8.90E−08 | 7.37E−05 | |
| GO:0007586 | Digestion | 18/547 | 134/17 653 | 1.72E−07 | 0.000119 | |
| GO:0018410 | C‐terminal protein amino acid modification | 14/547 | 86/17 653 | 3.72E−07 | 0.00022 | |
| GO:0002526 | Acute inflammatory response | 22/547 | 215/17653 | 9.69E−07 | 0.000501 | |
| GO:0031214 | Biomineral tissue development | 16/547 | 133/17 653 | 3.66E−06 | 0.001682 | |
| GO:0001503 | Ossification | 29/547 | 371/17 653 | 5.16E−06 | 0.002135 | |
| GO:0061844 | Antimicrobial humoral immune response mediated by antimicrobial peptide | 10/547 | 59/17 653 | 1.20E−05 | 0.004533 | |
| GO:0001649 | Osteoblast differentiation | 19/547 | 205/17 653 | 2.19E−05 | 0.007549 | |
| Down | GO:0098742 | Cell‐cell adhesion via plasma‐membrane adhesion molecules | 23/411 | 242/17 653 | 1.24E−08 | 4.16E−05 |
| GO:0007156 | Homophilic cell adhesion via plasma membrane adhesion molecules | 18/411 | 158/17 653 | 3.04E−08 | 5.11E−05 |
Genes expressed with the difference of the log FC value >2 or <−2 were defined as GO analysis objects.
Abbreviations: down, downregulated In PNETs with recurrence; Up, upregulated In PNETs with recurrence.
GO are listed in order of P‐adjusted from the smallest.
3.5. IHC analysis of CLEC3A, MMP7, LCN2, and GHRH expression
We chose a few genes—upregulated CLEC3A, LCN2, and MMP7 and downregulated GHRH—in cases with relapse as candidates for recurrence predictors. To confirm the protein expression and location of these genes, we conducted immunostaining for each tumor sample with and without recurrence. Table 4 shows the clinical characteristics of the IHC cohort (nine samples in each) before and after PSM. The confounding factors became balanced between the two groups. Figure 2 displays representative immunohistochemical staining patterns of formalin‐fixed, paraffin‐embedded sections for CLEC3A, MMP7, LCN2, and GHRH. The immunostaining positivity for each gene and clinical characteristics of 18 patients are summarized in Table 5.
Table 4.
Patient background and clinical characteristics of IHC cohort pre‐ and post‐adjustment with one‐to‐one nearest‐neighbor matching method
| Pre‐propensity score matching (n = 83) | Post‐propensity score matching (n = 18) | |||||
|---|---|---|---|---|---|---|
| With recurrence (n = 11) | Without recurrence (n = 72) | P‐value | With recurrence (n = 9) | Without recurrence (n = 9) | P‐value | |
| Gender—male | 3 (27.3) | 30 (41.6) | 0.51 | 5 (55.6) | 6 (66.7) | 0.62 |
| Age (years old, median [range]) | 56 [28‐82] | 55.5 [19‐79] | 0.83 | 53 [33‐74] | 54 [22‐64] | 0.66 |
| Functionality—Functioning | 2 (18.2) | 23 (31.9) | 0.49 | 2 (22.2) | 2 (22.2) | 1.00 |
| Tumor size (mm, median [range]) | 30 [5‐120] | 15 [5‐57] | 0.002* | 7 (77.8) | 6 (66.7) | 0.60 |
| Presence of LN metastasis | 5 (45.5) | 6 (18.3) | 0.005* | 5 (55.6) | 4 (44.4) | 0.63 |
| Differentiation (G1/G2)‐G2 | 9 (81.8) | 10 (13.9) | <0.0001* | 2 (22.2) | 3 (33.3) | 0.60 |
| Tumor Location (Ph/Pb/Pt)‐Ph | 7 (62.6) | 45 (62.5) | 0.94 | 5 (55.6) | 5 (55.6) | 1.00 |
| Approach (Open/Laparo)‐Open | 10 (90.1) | 38 (52.8) | 0.002* | 8 (88.9) | 8 (88.9) | 1.00 |
| Association with MEN1—yes | 3 (27.3) | 7 (9.7) | 0.10 | 2 (22.2) | 3 (33.3) | 0.59 |
| History of DM—yes | 2 (18.2) | 10 (13.9) | 0.70 | 2 (22.2) | 2 (22.2) | 1.00 |
| BMI (median [range]) | 21.2 [17.6‐34.2] | 22.5 [16.9‐31.9] | 0.13 | 22 [17.6‐26.9] | 21.5 [18.1‐26.3] | 0.72 |
Numerical value represents mean number (%) or number [range]. P‐value was calculated using Chi‐squared test or Whitney's U test.
Abbreviations: F, functioning; Laparo, laparoscopic surgery; NF, nonfunctioning; Open, open surgery; Pb, pancreatic body; Ph, pancreatic head; Pt, pancreatic tail.
P < 0.05, significant.
Figure 2.
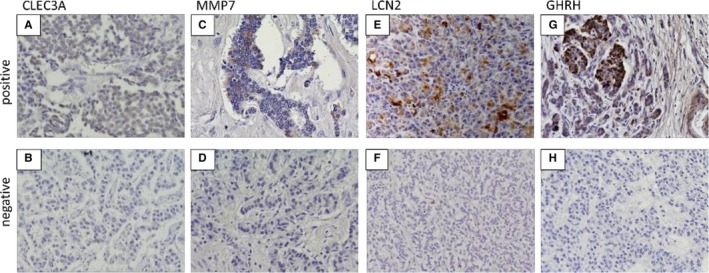
Representative immunohistochemical staining patterns of formalin‐fixed, paraffin‐embedded (FFPE) sections (magnification 200×) for CLEC3A (A, B), MMP7 (C, D), LCN2 (E, F), and GHRH (G, H). Upper images (A, C, E, G) are positive patterns. Lower images (B, D, F, H) are negative patterns
Table 5.
IHC results and characteristics of 18 patients
| Patient No. | IHC Expression | Clinical features | Duration (y) | ||||||||||||||||||
|---|---|---|---|---|---|---|---|---|---|---|---|---|---|---|---|---|---|---|---|---|---|
| CLEC3A | MMP7 | LCN2 | GHRH | Age | Sex | Grade | Ki‐67 index | Tumor size (mm) | Location | Functionality | MEN I | LN metastasis | Recurrence site | Stage | DFS | Observation period | |||||
| Scorea | •/×b | Score | •/× | Score | •/× | Score | •/× | ||||||||||||||
| R1 | 0 | × | 3 | • | 0 | × | 1 | × | 33 | M | G1 | 0.1 | 30 | Pt | Nonfunctioning | Yes | (+) | Liver | IIB | 3.8 | 10.3 |
| R2 | 4 | • | 6 | • | 4 | • | 3 | • | 74 | M | G1 | 1 | 40 | Ph | Glucagonoma | No | (+) | Liver | III | 1.2 | 5.9 |
| R3 | 4 | • | 4 | • | 3 | • | 2 | × | 55 | F | G1 | 1 | 5 | Ph | Gastrinoma | Yes | (+) | Liver | IIB | 6.5 | 10.5 |
| R4 | 4 | • | 2 | × | 4 | • | 3 | • | 40 | M | G2 | 2.6 | 25 | Pb | Nonfunctioning | No | (−) | Liver | IB | 6.8 | 19.5 |
| R5 | 4 | • | 4 | • | 2 | × | 3 | • | 54 | F | G2 | 3 | 34 | Ph | Nonfunctioning | No | (+) | Lymph node | IIB | 1.6 | 6.5 |
| R6 | 4 | • | 9 | • | 4 | • | 2 | × | 51 | F | G2 | 8 | 15 | Pb | Nonfunctioning | No | (−) | Liver | IA | 2.6 | 6.5 |
| R7 | 12 | • | 4 | • | 0 | × | 3 | • | 61 | F | G2 | 9.85 | 27 | Ph | Nonfunctioning | No | (−) | Liver | IIA | 0.2 | 5.8 |
| R8 | 2 | × | 2 | × | 4 | • | 2 | × | 66 | M | G2 | 12 | 37 | Ph | Nonfunctioning | No | (+) | Liver | IV | 1.0 | 4.6 |
| R9 | 4 | • | 0 | × | 4 | • | 0 | × | 38 | M | G2 | 16 | 55 | Pt | Nonfunctioning | No | (+) | Liver | IV | 0.5 | 3.8 |
| N1 | 0 | × | 0 | × | 2 | × | 2 | × | 58 | F | G1 | 1.4 | 55 | Pb | Nonfunctioning | Yes | (−) | ‐ | IIA | 11.4 | 11.5 |
| N2 | 0 | × | 0 | × | 0 | × | 3 | •• | 51 | M | G1 | 2 | 5 | Pt | NF + Gastrinoma | Yes | (+) | ‐ | IIB | 4.7 | 4.7 |
| N3 | 1 | × | 0 | × | 0 | × | 1 | × | 54 | F | G2 | 3 | 9 | Pb | Gastrinoma | No | (−) | ‐ | IA | 9.0 | 9.0 |
| N4 | 0 | × | 0 | × | 0 | × | 0 | × | 58 | M | G2 | 3 | 45 | Ph | Nonfunctioning | No | (+) | ‐ | IIB | 5.8 | 6.0 |
| N5 | 0 | × | 1 | × | 4 | • | 3 | • | 53 | M | G2 | 3 | 57 | Ph | Nonfunctioning | No | (+) | ‐ | IV | 4.8 | 5.2 |
| N6 | 0 | × | 0 | × | 0 | × | 0 | × | 64 | M | G2 | 4 | 43 | Ph | Nonfunctioning | No | (+) | ‐ | III | 3.5 | 3.7 |
| N7 | 0 | × | 0 | × | 0 | × | 0 | × | 34 | M | G2 | 4.2 | 33 | Pb | Nonfunctioning | No | (−) | ‐ | IB | 13.1 | 13.1 |
| N8 | 0 | × | 0 | × | 0 | × | 3 | • | 22 | M | G2 | 4.8 | 26 | Ph | Insulinoma | No | (−) | ‐ | IB | 3.6 | 3.6 |
| N9 | 0 | × | 0 | × | 0 | × | 2 | × | 47 | F | G2 | 7 | 16 | Pt | Nonfunctioning | Yes | (−) | ‐ | IA | 3.1 | 3.1 |
Abbreviations: DFS, disease‐free survival; N1‐9, cases without recurrence; Pb, pancreatic body; Ph, pancreatic head; Pt, pancreatic tail; R1‐9, cases with recurrence.
Scores were determined as described in the method.
•, positive (score ≥ 3); ×, negative (others).
3.6. Disease‐free survival in patients with CLEC3A, MMP7, LCN2, and GHRH
Kaplan‐Meier survival analysis showed that recurrence rate in patients with positive expression of CLEC3A (P = 0.028), MMP7 (P = 0.003), and LCN2 (P = 0.040) was significantly higher than patients with negative expression by log‐rank test. Recurrence curves were shown in Figure 3. No recurrence occurred among patients with negative expression for all three genes in the resected tumor. In contrast, no significant difference was observed in recurrence rate between patients with positive and negative GHRH expression.
Figure 3.
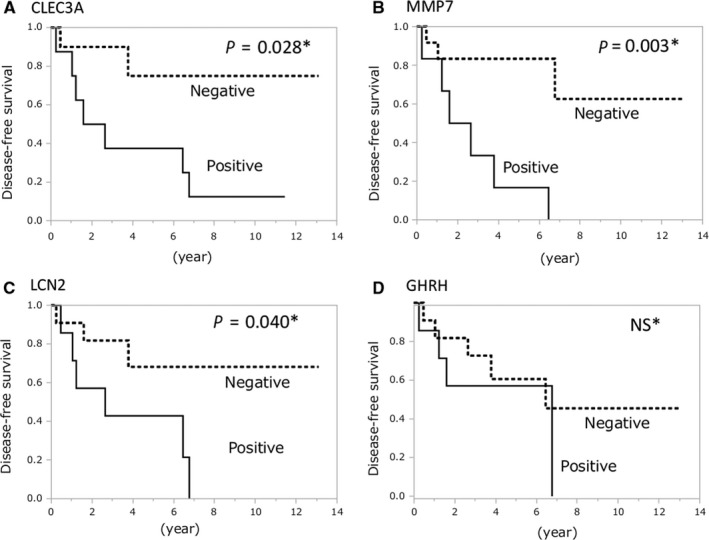
Disease‐free survival after the resection in patients. Significant differences were observed between patients with CLEC3A (A), MMP7 (B), LCN2 (C), and GHRH (D) by log‐rank test
4. DISCUSSION
Though PNETs with postoperative recurrence are not rare, no biological predictive markers have yet been established. We compared gene expression levels in PNETs with recurrence and to those without recurrence using RNA‐seq, aiming to identify important biological factors and predictive markers for recurrence.
The major finding in the present study is that the top three upregulated genes CLEC3A, LCN2, and MMP7 showed significantly higher expression at the protein level in tumors with recurrence than in those without recurrence by IHC, which might be useful for predicting recurrence.
Although significant downregulated genes in tumor with recurrence were related to cell‐cell adhesion as mentioned in the result, the difference in gene expression between recurrence and nonrecurrence was too small to expect to be a marker predicting recurrences. Meanwhile, the most downregulated gene, GHRH displayed the prominent expression difference. Furthermore, GHRH has been well known to be secreted by neuroendocrine tumors ectopically.32, 33 Considering the possibility that GHRH is a valuable marker with high accuracy, we investigated GHRH protein expression in tumors. However, no relationship between GHRH expression and postoperative recurrence was observed.
Additionally, we selected the top three upregulated genes, CLEC3A, MMP7, and LCN2, because the expression of CLEC3A, MMP7, and LCN2 have been reported to be useful markers in other kind of malignant tumors, and known to be associated with the PI3K (phosphatidylinositol 3‐kinase)‐Akt pathway, which plays an important role in a subset of PNETs 34 as described below.
CLEC3A, belonging to the superfamily of C‐type lectins, has been reported to be expressed in cartilage and is associated with osteoarthritis.35 CLEC3A expression has also been reported in breast cancer tissue and high CLEC3A expression significantly correlated with poor prognosis. A previous study indicated that CLEC3A promotes invasion and metastasis of breast cancer cells by activating the PI3K/Akt signaling pathway.36
Matrix metalloproteinases are a family of zinc‐dependent endopeptidases.37 MMP7 is secreted specifically by epithelial cells38 and its overexpression has been observed in many tumor types including colorectal cancer,38 bladder cancer,39 gastric cancers,40 pancreatic cancer,41 and esophageal cancer.42 Additionally, a study of prostate cancer with neuroendocrine differentiation demonstrated that MMP7 leads to increased endothelial cell coverage and enlarged vessel size, resulting in increased invasion of neighboring tissue.43 It has been reported that upregulation of MMP7 expression is caused by activation of the PI3K/Akt pathway and is required for the migration and invasion of colorectal cancer cells.44 A study of gastric cancer indicated that the EGF‐induced overexpression of MMP7 depends on the PI3K signaling cascade.45
Moreover, a previous study revealed that MMP7 cleaves CLEC3A bound to the cell surfaces of various cancer cell lines, including colon, breast, and lung cancer cells.46 The cleavage of CLEC3A by MMP7 promotes the migration of cancer cells thorough the suppression of cell‐adhesion activity.46
LCN2, a 25 kDa secreted glycoprotein47also known as neutrophil gelatinase associated lipocalin (NGAL), was originally isolated with matrix metalloproteinase 9 in human neutrophils and identified as an antibacterial factor of natural immunity. Thereafter, it was found to be expressed in various cells and to participate in the growth, development, and differentiation of many tissues.48, 49 Currently, the roles of LCN2 in human neoplasia attract attention because its increased expression has been observed in malignant tumors48, 49 and its pro‐tumoral effects have been observed in epithelial ovarian cancer,28 pancreatic cancer,50 and esophageal cancer.47 In colon cancer, it has also observed that LCN2 overexpressed during the transition from adenoma to carcinoma, indicating that LCN2 drives tumor progression.51, 52 Meanwhile, the antitumoral and antimetastatic effects of LCN2 were demonstrated in hepatocellular carcinoma,53 lung cancer,54 and pancreatic cancer.55 The cell type‐specific function of LCN2 remains controversial. According to previous studies, the role of LCN2 in cancer metastasis might be related to plakophilin3 (PKP3) loss, which leads to an increase in invasion, tumor formation, and metastasis.56, 57, 58
A microarray analysis showed that the expression levels of MMP7 and LCN2 increased upon PKP3 loss in multiple cell lines.59 LCN2 and MMP7 may play a crucial role in cell invasion and tumor formation upon PKP loss via the PI3K/Akt‐dependent pathway.60
Referring to the previous studies, CLEC3A, MMP7, and LCN2 could play roles in tumor cell migration through the pathway as shown in Figure 4. Briefly, PI3K/AKT signaling pathway, activated by CLEC3A36 and other molecules, upregulates MMP760 and LCN259 thorough loss of PKP3, which promotes cell migration56 (Figure 4A). CLEC3A is also located in cell membrane, and support adhesion between tumor cells by interacting with Extracellular matrix (ECM) on the cell surface.46 However, MMP7 promotes cell migration by cleaving CLEC3A, which inhibits the function of CLEC3A (Figure 4B).
Figure 4.
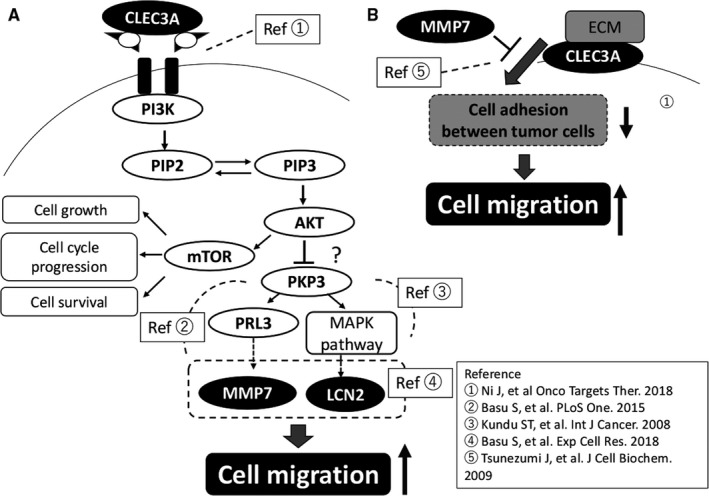
The conceivable migration pathway related to PNETs based on literatures. Ref., reference; Ref.1, Ni J, et al Onco Targets Ther. 2018; Ref.2, Basu S, et al. PLoS One. 2015; Ref.3, Kundu ST, et al. Int J Cancer. 2008; Ref.4, Basu S, et al. Exp Cell Res. 2018; Ref.5, Tsunezumi J, et al. J Cell Biochem. 2009. CLEC3A, C type lectin domain family 3 member A; ECM, extracellular matrix; LCN2, lipocalin2; MMP7, matrix metalloproteinase‐7; mTOR, mammalian target of rapamycin; PI3K, phosphoinositide 3‐kinase; PIP2, phosphatidylinositol‐4,5‐bisphosphate; PIP3, phosphatidylinositol‐3,4,5‐trisphosphate; PKP3, Plakophilin3; PRL3, phosphatases of regenerating liver 3
To the best of our knowledge, this study is the first to show that these three genes may play some roles in the recurrence of PNETs. Further studies are required to elucidate the detailed mechanism.
The study has some limitations. First, we were unable to analyze the relationship between gene expression and survival time because the mortality rate in all patients in the study was less than 4%. Second, the results of expression analysis using bulk RNA samples are likely influenced not only by tumor cells but also by the tumor stroma. Third, we evaluated the immunopositivity by one‐slice staining. A tissue microarray immunostaining analysis would be preferable for a more accurate evaluation. Moreover, investigation should have been confirmed by using a validation cohort setting. The adequate samples, however, were not available. Further prospective evaluation in our institution is under planning.
In conclusion, we demonstrated that the recurrence potential in PNETs is characterized by the upregulation of genes related to ECM organization and cell adhesion. This study identified three genes—CLEC3, MMP7, and LCN2—that contribute to the prediction of postoperative recurrence of PNETs in clinical practice.
CONFLICT OF INTEREST
The authors of this article declared they have no conflicts of interest.
Supporting information
ACKNOWLEDGMENTS
We would like to thank N. Torata for providing frozen tissue samples and the staff at the Division of Transcriptomics (Kyushu University) for technical support. This work was supported in part by JSPS KAKENHI Grant Number 19K17402.
Miki M, Oono T, Fujimori N, et al. CLEC3A, MMP7, and LCN2 as novel markers for predicting recurrence in resected G1 and G2 pancreatic neuroendocrine tumors. Cancer Med. 2019;8:3748–3760. 10.1002/cam4.2232
REFERENCES
- 1. Halfdanarson TR, Rabe KG, Rubin J, Petersen GM. Pancreatic neuroendocrine tumors (PNETs): Incidence, prognosis and recent trend toward improved survival. Ann Oncol. 2008;19(10):1727‐1733. [DOI] [PMC free article] [PubMed] [Google Scholar]
- 2. Ye L, Ye H, Zhou Q, et al. A retrospective cohort study of pancreatic neuroendocrine tumors at single institution over 15 years: New proposal for low‐ and high‐grade groups, validation of a nomogram for prognosis, and novel follow‐up strategy for liver metastases. Int J Surg. 2016;29:108‐117. [DOI] [PubMed] [Google Scholar]
- 3. Kunz PL, Reidy‐Lagunes D, Anthony LB, et al. Consensus guidelines for the management and treatment of neuroendocrine tumors. Pancreas. 2013;42:557‐577. [DOI] [PMC free article] [PubMed] [Google Scholar]
- 4. Marchegiani G, Landoni L, Tommaso P, et al. The evolution of surgical strategies for pancreatic neuroendocrine tumors (Pan‐NENs). Ann Surg. 2017;269(4):725‐732. [DOI] [PubMed] [Google Scholar]
- 5. Gao H, Liu L, Wang W, et al. Novel recurrence risk stratification of resected pancreatic neuroendocrine tumor. Cancer Lett. 2018;412:188‐193. [DOI] [PubMed] [Google Scholar]
- 6. Haynes AB, Deshpande V, Ingkakul T, et al. Implications of incidentally discovered, nonfunctioning pancreatic endocrine tumors: Short‐term and long‐term patient outcomes. Arch Surg. 2011;146(5):534‐538. [DOI] [PMC free article] [PubMed] [Google Scholar]
- 7. Sato S, Tsuchikawa T, Nakamura T, et al. Impact of the tumor microenvironment in predicting postoperative hepatic recurrence of pancreatic neuroendocrine tumors. Oncol Rep. 2014;32(6):2753‐2759. [DOI] [PubMed] [Google Scholar]
- 8. Wei IH, Harmon CM, Arcerito M, Cheng DF, Minter RM, Simeone DM. Tumor‐associated macrophages are a useful biomarker to predict recurrence after surgical resection of nonfunctional pancreatic neuroendocrine tumors. Ann Surg. 2014;260(6):1088‐1094. [DOI] [PMC free article] [PubMed] [Google Scholar]
- 9. Fitzgerald TL, Mosquera C, Vora HS, Vohra NA, Zervos EE. Indications for surgical resection in low‐grade pancreatic neuroendocrine tumors. Am Surg. 2016;82(8):737‐742. [PubMed] [Google Scholar]
- 10. Genç CG, Falconi M, Partelli S, et al. Recurrence of pancreatic neuroendocrine tumors and survival predicted by Ki67. Ann Surg Oncol. 2018;25(8):2467‐2474. [DOI] [PMC free article] [PubMed] [Google Scholar]
- 11. Wang D‐D, Liu Z‐W, Han M‐M, et al. Microarray based analysis of gene expression patterns in pancreatic neuroendocrine tumors. Eur Rev Med Pharmacol Sci. 2015;19:3367‐3374. [PubMed] [Google Scholar]
- 12. Sadanandam A, Wullschleger S, Lyssiotis CA, et al. A cross‐species analysis in pancreatic neuroendocrine tumors reveals molecular subtypes with distinctive clinical, metastatic, developmental, and metabolic characteristics. Cancer Discov. 2015;5(12):1296‐1313. [DOI] [PMC free article] [PubMed] [Google Scholar]
- 13. Scarpa A, Chang DK, Nones K, et al. Whole‐genome landscape of pancreatic neuroendocrine tumours. Nature. 2017;543:65‐71. [DOI] [PubMed] [Google Scholar]
- 14. Zhou H, Chen Q, Tan W, et al. Integrated clinicopathological features and gene microarray analysis of pancreatic neuroendocrine tumors. Gene. 2017;625:72‐77. [DOI] [PubMed] [Google Scholar]
- 15. Modlin IM, Oberg K, Taylor A, Drozdov I, Bodei L, Kidd M. Neuroendocrine tumor biomarkers: current status and perspectives. Neuroendocrinology. 2014;100(4):265‐277. [DOI] [PubMed] [Google Scholar]
- 16. Modlin IM, Drozdov I, Alaimo D, et al. A multianalyte PCR blood test outperforms single analyte ELISAs (chromogranin A, pancreastatin, neurokinin A) for neuroendocrine tumor detection. Endocr Relat Cancer. 2014;21(4):615‐628. [DOI] [PubMed] [Google Scholar]
- 17. Pavel M, Jann H, Prasad V, Drozdov I, Modlin IM, Kidd M. NET blood transcript analysis defines the crossing of the clinical rubicon: when stable disease becomes progressive. Neuroendocrinology. 2016;104(2):170‐182. [DOI] [PubMed] [Google Scholar]
- 18. Kudo A, Akahoshi K, Ito S, et al. Downregulated Pancreatic Beta Cell Genes Indicate Poor Prognosis in Patients With Pancreatic Neuroendocrine Neoplasms. Ann Surg. [Epub ahead of print]. 10.1097/SLA.0000000000002911. [DOI] [PubMed] [Google Scholar]
- 19. Lloyd RV, Osamura RY, Kloppel G, et al. WHO Classification of Tumours of Endocrine Organs. WHO/IARC Classification of Tumours. 4th ed Lyon Cedex, France: International Agency for Research on cancer (IARC); 2017. [Google Scholar]
- 20. Torata N, Ohuchida K, Akagawa S, et al. Tissue tablet method: an efficient tissue banking procedure applicable to both molecular analysis and frozen tissue microarray. Hum Pathol. 2014;45(1):143‐152. [DOI] [PubMed] [Google Scholar]
- 21. Hashimshony T, Senderovich N, Avital G, et al. CEL‐Seq2: sensitive highly‐multiplexed single‐cell RNA‐Seq. Genome Biol. 2016;17(77):1‐7. [DOI] [PMC free article] [PubMed] [Google Scholar]
- 22. Liu H, Li Y, He J, et al. Robust transcriptional signatures for low‐input RNA samples based on relative expression orderings. BMC Genom. 2017;18(1):1‐9. [DOI] [PMC free article] [PubMed] [Google Scholar]
- 23. Kim D, Langmead B, Salzberg SL. HISAT: a fast spliced aligner with low memory requirements Daehwan. Nat Methods. 2016;12(4):357‐360. [DOI] [PMC free article] [PubMed] [Google Scholar]
- 24. Law CW, Chen Y, Shi W, Smyth GK. Voom: precision weights unlock linear model analysis tools for RNA‐seq read counts. Genome Biol. 2014;15(2):1‐17. [DOI] [PMC free article] [PubMed] [Google Scholar]
- 25. Yu G, Wang L‐G, Han Y, He Q‐Y. clusterProfiler: an R package for comparing biological themes among gene clusters. OMICS. 2012;16(5):284‐287. [DOI] [PMC free article] [PubMed] [Google Scholar]
- 26. Wu Q, Yang Y, Wu S, et al. Evaluation of the correlation of KAI1/CD82, CD44, MMP7 and β‐catenin in the prediction of prognosis and metastasis in colorectal carcinoma. Diagn Pathol. 2015;10(1):1‐9. [DOI] [PMC free article] [PubMed] [Google Scholar]
- 27. Takashi S, Shijubo Noriharu AS. Tumor angiogenesis and vascular endothelial growth factor expression in Stage I lung adenocarcinoma. Clin Cancer Res. 1998;4:1483‐1488. [PubMed] [Google Scholar]
- 28. Cho HB, Kim JH. Lipocalin2 expressions correlate significantly with tumor differentiation in epithelial ovarian cancer. J Histochem Cytochem. 2009;57(5):513‐521. [DOI] [PMC free article] [PubMed] [Google Scholar]
- 29. Kővári B, Vranic S, Marchio C, Sapino A, Cserni G. The expression of GHRH and its receptors in breast carcinomas with apocrine differentiation—further evidence of the presence of a GHRH pathway in these tumors. Hum Pathol. 2017;64:164‐170. [DOI] [PubMed] [Google Scholar]
- 30. Austin PC. Statistical criteria for selecting the optimal number of untreated subjects matched to each treated subject when using many‐to‐one matching on the propensity score. Am J Epidemiol. 2010;172(9):1092‐1097. [DOI] [PMC free article] [PubMed] [Google Scholar]
- 31. D'Agostino RB. Tutorials in biostatistics propencity score methods for bias reduction in the comparison of a treatment to a non‐randomized control group. Stat Med. 1998;17:2265‐2281. [DOI] [PubMed] [Google Scholar]
- 32. Verbeek WH, Korse CM, Tesselaar ME. Secreting gastro‐enteropancreatic neuroendocrine tumours and biomarkers. Eur J Endocrinol. 2016;174:1‐7. [DOI] [PubMed] [Google Scholar]
- 33. Kulke MH, Anthony LB, Bushnell DL, et al. NANETS treatment guidelines: well‐differentiated neuroendocrine tumors of the stomach and pancreas. Pancreas. 2010;39:735‐752. [DOI] [PMC free article] [PubMed] [Google Scholar]
- 34. Gajate P, Alonso‐Gordoa T, Martínez‐Sáez O, Molina‐Cerrillo J, Grande E. Prognostic and predictive role of the PI3K–AKT–mTOR pathway in neuroendocrine neoplasms. Clin Transl Oncol. 2018;20(5):561‐569. [DOI] [PubMed] [Google Scholar]
- 35. Karlsson C, Dehne T, Lindahl A, et al. Genome‐wide expression profiling reveals new candidate genes associated with osteoarthritis. Osteoarthr Cartil. 2010;18(4):581‐592. [DOI] [PubMed] [Google Scholar]
- 36. Ni J, Peng Y, Yang F, Xi X, Huang X, He C. Overexpression of CLEC3A promotes tumor progression and poor prognosis in breast invasive ductal cancer. Onco Targets Ther. 2018;4(11):3303‐3312. [DOI] [PMC free article] [PubMed] [Google Scholar]
- 37. Li KQ, Li CH. Matrix metalloproteinase and their inhibitors: molecular aspects of their roles in the tumor metastasis. Chin J Cancer Res. 2000;12(4):239‐243. [Google Scholar]
- 38. McDonnell S, Navre M, Coffey RJ, Matrisian LM. Expression and localization of the matrix metalloproteinase pump‐1 (MMP‐7) in human gastric and colon carcinomas. Mol Carcinog. 1991;4(6):527‐533. [DOI] [PubMed] [Google Scholar]
- 39. El Demery M, Demirdjian‐Sarkissian G, Thezenas S, et al. Metalloproteinase‐7 is an independent prognostic biomarker in advanced bladder cancer. Clin Transl Med. 2014;3(1):31. [DOI] [PMC free article] [PubMed] [Google Scholar]
- 40. Lu L, Ma G, Liu X, Sun R, Wang Q. Correlation between GDF15, MMP7 and gastric cancer and its prognosis. Eur Rev Med Pharmacol Sci. 2017;21:535‐541. [PubMed] [Google Scholar]
- 41. Jakubowska K, Pryczynicz A, Joanna J, et al. Expressions of matrix metalloproteinases 2, 7, and 9 in carcinogenesis of pancreatic ductal adenocarcinoma. Dis Markers. 2016;2016:9895721. [DOI] [PMC free article] [PubMed] [Google Scholar]
- 42. Kivisaari AK, Kallajoki M, Ala‐aho R, et al. Matrix metalloproteinase‐7 activates heparin‐binding epidermal growth factor‐like growth factor in cutaneous squamous cell carcinoma. Br J Dermatol. 2010;163(4):726‐735. [DOI] [PubMed] [Google Scholar]
- 43. Littlepage LE, Sternlicht MD, Rougier N, et al. Matrix metalloproteinases contribute distinct roles in neuroendocrine prostate carcinogenesis, metastasis, and angiogenesis progression. Cancer Res. 2010;70(6):2224‐2234. [DOI] [PMC free article] [PubMed] [Google Scholar]
- 44. Xu CL, Wang JZ, Xia XP, et al. Rab11‐FIP2 promotes colorectal cancer migration and invasion by regulating PI3K/AKT/MMP7 signaling pathway. Biochem Biophys Res Commun. 2016;470(2):397‐404. [DOI] [PubMed] [Google Scholar]
- 45. Liu G, Jiang C, Li D, Wang R, Wang W. MiRNA‐34a inhibits EGFR‐signaling‐dependent MMP7 activation in gastric cancer. Tumor Biol. 2014;35(10):9801‐9806. [DOI] [PubMed] [Google Scholar]
- 46. Tsunezumi J, Higashi S, Miyazaki K. Matrilysin (MMP‐7) cleaves C‐type lectin domain family 3 member A (CLEC3A) on tumor cell surface and modulates its cell adhesion activity. J Cell Biochem. 2009;106(4):693‐702. [DOI] [PubMed] [Google Scholar]
- 47. Bolignano D, Donato V, Lacquaniti A, et al. Neutrophil gelatinase‐associated lipocalin (NGAL) in human neoplasias: a new protein enters the scene. Cancer Lett. 2010;288(1):10‐16. [DOI] [PubMed] [Google Scholar]
- 48. Chakraborty S, Kaur S, Guha S, Batra SK. The multifaceted roles of neutrophil gelatinase associated lipocalin (NGAL) in inflammation and cancer. Biochim Biophys Acta ‐ Rev Cancer. 2012;1826(1):129‐169. [DOI] [PMC free article] [PubMed] [Google Scholar]
- 49. Rodvold JJ, Mahadevan NR, Zanetti M. Lipocalin 2 in cancer: when good immunity goes bad. Cancer Lett. 2012;316(2):132‐138. [DOI] [PubMed] [Google Scholar]
- 50. Leung L, Radulovich N, Zhu C‐Q, et al. Promotes invasion, tumorigenicity and gemcitabine resistance in pancreatic ductal adenocarcinoma. PLoS ONE. 2012;7(10):e46677. [DOI] [PMC free article] [PubMed] [Google Scholar]
- 51. Sun Y, Yokoi K, Li H, et al. NGAL expression is elevated in both colorectal adenoma‐carcinoma sequence and cancer progression and enhances tumorigenesis in xenograft mouse models. Clin Cancer Res. 2011;17(13):4331‐4340. [DOI] [PMC free article] [PubMed] [Google Scholar]
- 52. McLean MH, Thomson AJ, Murray GI, Fyfe N, Hold GL, El‐Omar EM. Expression of neutrophil gelatinase‐associated lipocalin in colorectal neoplastic progression: a marker of malignant potential? Br J Cancer. 2013;108(12):2537‐2541. [DOI] [PMC free article] [PubMed] [Google Scholar]
- 53. Lee EK, Kim HJ, Lee KJ, et al. Inhibition of the proliferation and invasion of hepatocellular carcinoma cells by lipocalin 2 through blockade of JNK and PI3K/Akt signaling. Int J Oncol. 2011;38(2):325‐333. [DOI] [PubMed] [Google Scholar]
- 54. Hanai J‐I, Mammoto T, Seth P, et al. Lipocalin 2 diminishes invasiveness and metastasis of Ras‐transformed cells. J Biol Chem. 2005;280(14):13641‐13647. [DOI] [PubMed] [Google Scholar]
- 55. Tong Z, Kunnumakkara AB, Wang H, et al. Neutrophil gelatinase‐associated lipocalin: a novel suppressor of invasion and angiogenesis in pancreatic cancer. Cancer Res. 2008;68(15):6100‐6108. [DOI] [PMC free article] [PubMed] [Google Scholar]
- 56. Basu S, Chaudhary N, Shah S, et al. Plakophilin3 loss leads to an increase in lipocalin2 expression, which is required for tumour formation. Exp Cell Res. 2018;369(2):251‐265. [DOI] [PubMed] [Google Scholar]
- 57. Aigner K, Descovich L, Mikula M, et al. The transcription factor ZEB1 (δEF1) represses Plakophilin 3 during human cancer progression. FEBS Lett. 2007;581(8):1617‐1624. [DOI] [PMC free article] [PubMed] [Google Scholar]
- 58. Furukawa C, Daigo Y, Ishikawa N, et al. Plakophilin 3 oncogene as prognostic marker and therapeutic target for lung cancer. Cancer Res. 2005;65(16):7102‐7110. [DOI] [PubMed] [Google Scholar]
- 59. Kundu ST, Gosavi P, Khapare N, et al. Plakophilin3 downregulation leads to a decrease in cell adhesion and promotes metastasis. Int J Cancer. 2008;123(10):2303‐2314. [DOI] [PubMed] [Google Scholar]
- 60. Basu S, Thorat R, Dalal SN. MMP7 is required to mediate cell invasion and tumor formation upon plakophilin3 loss. PLoS ONE. 2015;10(4):1‐17. [DOI] [PMC free article] [PubMed] [Google Scholar]
Associated Data
This section collects any data citations, data availability statements, or supplementary materials included in this article.
Supplementary Materials