

Abstract
Background
Accumulating evidence shows an important relationship between the gastrointestinal (GI) microbiota and host health. Microbial metabolites are believed to play a critical role in host‐microbial interactions. Short‐chain fatty acids (SCFAs) are major end products of bacterial carbohydrate fermentation in the intestinal tract. Decreased concentrations of SCFAs have been observed in humans with GI disease. However, large‐scale clinical data in dogs are lacking.
Hypothesis/Objective
To evaluate fecal concentrations of SCFAs and the fecal microbiota in healthy control (HC) dogs and dogs with chronic enteropathy (CE).
Animals
Forty‐nine privately owned HC dogs and 73 dogs with CE.
Methods
Prospective cohort study. Fecal concentrations of SCFAs were measured using gas chromatography/mass spectrometry. Illumina sequencing and quantitative real‐time polymerase chain reaction were utilized to evaluate the fecal microbiota.
Results
Fecal concentrations (median [range] μmol/g of dry matter) of acetate were lower (P = .03) in dogs with CE (185.8 [20.1‐1042.1]) than in HC dogs (224.0 [87.7‐672.8]). Propionate were also lower (P < .001) in dogs with CE (46.4 [0.4‐227.9]) than in HC dogs (105.9 [1.6‐266.9]). Moreover, total SCFAs were lower (P = .005) in dogs with CE (268.1 [21.8‐1378.2]) than in HC dogs (377.2 [126.6‐927.0]). Dysbiosis in dogs with CE was characterized by decreased bacterial diversity and richness, distinct microbial community clustering compared with that in HC dogs, and a higher dysbiosis index.
Conclusions and Clinical Importance
Dogs with CE had an altered fecal SCFA concentration accompanied by significant changes of the fecal microbiota.
Keywords: canine chronic enteropathy, dysbiosis, fecal metabolites, short‐chain fatty acids
Abbreviations
- ANOSIM
analysis of similarity
- ARE
antibiotic responsive enteropathy
- CE
chronic enteropathy
- DM
dry matter
- FRE
food responsive enteropathy
- GC/MS
gas chromatography/mass spectrometry
- GI
gastrointestinal
- HC
healthy control
- IBD
inflammatory bowel disease
- PLE
protein losing enteropathy
- qPCR
quantitative real‐time polymerase chain reaction
- RT
room temperature
- SCFAs
short‐chain fatty acids
- SRE
steroid/immunosuppressant responsive enteropathy
1. INTRODUCTION
Despite well‐documented evidence that the intestinal microbiota plays a role in the pathogenesis of gastrointestinal (GI) disease, the actual mechanisms of the host‐microbe interactions remain elusive. However, it is believed that microbial metabolites that are derived from the intestinal microbiota mediate these interactions.1 Short‐chain fatty acids (SCFAs), primarily acetate, propionate, and butyrate, are primary end products of bacterial fermentation of nondigestible dietary fibers. Because of their beneficial effects on host health, including immunomodulatory effects, antidiarrheic effects, and a regulatory effect on GI motility, SCFAs have been the focus of past studies.2, 3, 4, 5
Clinical studies in humans have revealed decreased fecal concentrations of SCFAs in patients with chronic GI disorders such as inflammatory bowel disease (IBD)6 and colorectal cancer.7 Decreased SCFAs might contribute to the inflammatory status of these disorders. Short‐chain fatty acids modulate inflammation by increasing the production of anti‐inflammatory cytokines (eg, IL‐10 and TGFβ), decreasing proinflammatory cytokines (eg, IL‐6, IL‐8, and TNFα), and activating transcription factor Foxp3, which is crucial to suppression and regulation of inflammation.8, 9 Short‐chain fatty acids might not only have an effect on host physiology but could also affect the GI microbiota. The production of SCFAs provides an acidic luminal environment that prevents overgrowth of pH‐sensitive pathogenic bacteria, such as Enterobacteriaceae and Clostridia.10, 11 Data from in vitro studies and experimental animal models suggest that the compositions of the intestinal microbiota as well as luminal concentrations of the various SCFAs are important influences for virulence factors and colonization of some enteropathogens.12, 13, 14, 15, 16
In veterinary medicine, limited information is available with regard to fecal concentrations of SCFA in dogs with CE. Most of the studies that are available mainly evaluate the effects of nutritional intervention on fecal concentrations of SCFAs in healthy research dogs.17, 18 In the current study, we aimed to characterize fecal concentrations of SCFAs in healthy dogs and dogs with CE. We also aimed to evaluate the correlation between the fecal microbial communities and fecal SCFA concentrations.
2. MATERIALS AND METHODS
2.1. Sample collection
Fecal samples from healthy control (HC) dogs and dogs with clinical signs of CE were collected prospectively from April 2011 to June 2013. The protocol for sample collection was approved by the Texas A&M University Institutional Animal Care and Use Committee (AUP #2012‐83). Fresh fecal samples were collected at home by the owners and immediately frozen, then shipped on ice to the Gastrointestinal Laboratory.
2.2. Animal enrollment
2.2.1. Healthy control dogs
Healthy, privately owned dogs without clinical signs of GI disease, such as vomiting, diarrhea, anorexia, or weight loss, within the past 3 months of sample collection were enrolled. Physical examination was conducted by a board‐certified veterinary internist or a veterinarian. Dogs with an abnormal physical examination finding, abnormal laboratory testing result (fecal GI panel, blood work [if available], or both diagnostics) or underlying chronic diseases that were symptomatic and needed medical treatment were excluded.
2.2.2. Dogs with chronic enteropathy
Dogs with clinical signs of chronic GI disease (ie, vomiting, diarrhea, anorexia, or weight loss, for a period of at least 3 weeks) based on the clinical history were enrolled for this study. The time of fecal sample collection after the onset clinical sings of GI disease varied between samples depending on the time the dog was presented to the veterinarian. The disease severity for each dog was evaluated using the canine chronic enteropathy (CE) activity index and classified into 5 categories (ie, insignificant, mild, moderate, severe, and very severe disease).19 Histological evaluation of intestinal biopsies was conducted if biopsy samples were available. Dogs with histological evaluation were further classified into 3 phenotypes: food responsive enteropathy (FRE), antibiotic responsive enteropathy (ARE), and steroid/immunosuppressant responsive enteropathy (SRE) based on their response to treatment. Dogs without histological evaluation, with unknown clinical response, or both were assigned to the unclassified group.
2.2.3. Clinical history of dogs
Questionnaires were sent to veterinarians and owners who submitted fecal samples from the dogs. The questionnaire was comprised of 3 major parts: (1) signalment (ie, breed, age, sex, sexual status, body weight, and body condition score), (2) health status at time of fecal sample collection (ie, presence of GI signs and its characteristics, and duration of GI signs), and (3) medical history (ie, medication(s) [use of antibiotics, immunosuppressants, probiotics, etc.] and concurrent diseases) and dietary information. For the dogs with CE, the second questionnaire was sent to the veterinarians at least 3 months after sample submission. The second questionnaire was consisted of 3 major parts: (1) medical treatments, (2) patient outcome, and (3) tentative/final diagnosis.
2.3. Analysis of fecal SCFAs
Concentrations of SCFAs (ie, acetate, propionate, and butyrate) in feces were measured using a stable isotope dilution gas chromatography‐mass spectrometry (GC‐MS) assay as previously described20 with some modifications. Briefly, the fecal samples were weighed, diluted 1:5 in extraction solution (2N hydrochloric acid [HCl]), and frozen at −80°C until analysis (up to 3 months). After thawing, samples were homogenized by a multitube vortexer for 30 minutes at room temperature (RT), and then fecal suspensions were centrifuged for 20 minutes at 2100g and 4°C. Supernatants were then collected using serum filters (Fisherbrand serum filter system, Fisher Scientific Inc, Pittsburgh, Pennsylvania). From each sample, 500 μL of supernatant was mixed with 10 μL of internal standard (200 mM heptadeuterated butyric acid) and extracted using a C18 solid phase extraction column (Sep‐Pak C18 1 cc Vac Cartridge, Waters Corporation, Milford, Massachusetts). Samples were derivatized using N‐tert‐butyldimethylsilyl‐N‐methyltrifluoroacetamide (MTBSTFA) at RT for 60 minutes. A GC (Agilent 6890N, Agilent Technologies Inc, Santa Clara, California) coupled with an electron ionization MS (Agilent 5975C, Agilent Technologies Inc) was used for chromatographic separation and quantification of the derivatized samples. Separation was achieved using a DB‐1 ms capillary column (Agilent Technologies Inc). The GC temperature program was as follows: 40°C held for 0.1 minute, increased to 70°C at 5°C/min, 70°C held for 3.5 minutes, increased to 160°C at 20°C/min, and finally increased to 280°C at 35°C/min, then held for 3 minutes. The total run time was 20.53 minutes. The MS was operated in electron impact positive‐ion mode with selective ion monitoring at mass‐to‐charge ratios (M/Z) of 117 (acetate), 131 (propionate), 145 (butyrate), and 152 (heptadeuterated butyrate; internal standard). Quantification was based on the ratio of the area under the curve of the internal standard and each of the fatty acids. The assay was validated for canine fecal samples and the performance characteristics of this modified protocol are summarized in Table S1. The lower detection limits of fecal concentrations of acetate, propionate, and butyrate were 1.33, 0.43, and 0.12 μmol/g, respectively. Samples with fecal SCFA concentrations less than the lower detection limits of acetate, propionate, and butyrate were considered as 1.32, 0.42, and 0.11 μmol/g, respectively. To take into account the difference in water content between fecal samples, final concentrations of fecal SCFAs were adjusted by fecal dry matter (DM) and expressed as μmol/g of fecal DM.
2.4. Evaluation of stability of fecal SCFAs
To test the stability of SCFAs in feces, fecal sample from 8 HC dogs each was subdivided into 168 aliquots and then evaluated after being stored at 4 storage conditions (at RT, 4°C, −20°C, and −80°C) and 4 time points (day 1 after being stored at RT, 4°C, and −20°C; day 3 after being stored at 4°C and −20°C; day 7 after being stored at 4°C, −20°C, and −80°C; and day 84 after being stored at −20°C and −80°C) with or without 2N HCl.
2.5. Analysis of the fecal microbiota
2.5.1. DNA isolation
An aliquot of 100 mg (wet weight) of each fecal sample was extracted by a bead‐beating method using the ZR Fecal DNA Kit (Zymo Research Corporation, Irvine, California), following the manufacturer's instructions. The bead‐beating step was performed on a homogenizer (FastPrep‐24, MP Biomedicals, Santa Ana, California) for 60 seconds at a speed of 4 m/s. Fecal DNA was stored at −80°C until analysis.
2.5.2. Quantitative real‐time PCR (qPCR)
To measure abundances of selected bacterial taxa, qPCR assays were performed for bacteria on various phylogenetic levels: total bacteria; phylum level—Bacteroidetes, Firmicutes; family level—Ruminococcaceae; genus level—Bifidobacterium spp., Blautia spp., Faecalibacterium spp., Fusobacterium spp., Lactobacillus spp., Streptococcus spp., and Turicibacter spp.; and species level—Clostridium hiranonis (C. hiranonis), Clostridium perfringens (C. perfringens), and Escherichia coli (E. coli). The qPCR cycling, oligonucleotide sequences of primers and probe, and respective annealing temperatures for selected bacterial groups were described previously.21, 22, 23 A commercial real‐time PCR thermal cycler (CFX 96 Touch Real‐Time PCR Detection System; Biorad Laboratories, Hercules, California) was used for all qPCR assays and all samples were run in duplicate fashion. Results from 8 bacterial groups were also utilized to generate a recently developed qPCR dysbiosis index.24
2.5.3. Illumina sequencing of 16S rRNA genes
To evaluate the fecal microbiota community structure, a high throughput sequencing method, Illumina sequencing, was utilized by targeting 16S rRNA genes. The V4 region of the 16S rRNA gene was amplified with primers 515F (5′‐GTGCCAGCMGCCGCGGTAA‐3′) and 806R (5′‐GGACTACVSGGGTATC TAAT‐3′) at the MR DNA Laboratory (Shallowater, Texas) as previously described.25 The raw sequence data were screened, trimmed, filtered, denoised, and barcodes and chimera sequences were depleted from the data set using QIIME v1.8 pipeline and UCHIME.26 Operational taxonomic units were assigned based on at least 97% sequence similarity against the Greengenes reference database v13.8.27 Sequences were rarefied to an even depth of 5350 sequences per sample to account for unequal sequencing depth across samples. Principal coordinate analysis and analysis of similarity (ANOSIM) were utilized on UniFrac distances to evaluate the global differences in fecal microbiota between samples.
2.6. Statistical analyses
Data sets for HC dogs and dogs with CE were tested for normality using a Shapiro‐Wilk test, and then compared using a Wilcoxon rank‐sum test. The data sets for the stability study were evaluated using a paired t test, a 1‐way ANOVA, or a repeated measures ANOVA, wherever appropriate. Spearman's rank correlation coefficient was used to evaluate the correlation between the fecal SCFA concentrations and the abundances of bacterial groups. For analyses of the fecal SCFA concentrations and the fecal SCFAs stability, P < .05 was considered significant. For analyses of the fecal microbiota, the Benjamini & Hochberg's false discovery rate was utilized in order to adjust for multiple comparisons, and a q < .05 was considered significant. All statistical analyses were conducted using statistical software packages (JMP Pro version 10, SAS Institute Inc, Cary, North Carolina, and Prism version 5 Graph Pad Software Inc, La Jolla, California). Sequencing data were analyzed using QIIME v1.8 in a similar way to previous studies.22, 25, 28
3. RESULTS
3.1. Signalment of dogs
Fecal samples from 49 HC dogs and 73 dogs with CE were utilized for this study. None of the HC dogs received antibiotics within the last 3 months before sample collection.
The median age of HC dogs and dogs with CE was 4.5 years (min to max: 0.8 to 11.7 years) and 6.1 years (min to max: 0.5 to 13.2 years), respectively (P = .07). Of the 49 HC dogs, 25 were male (2 intact, 23 castrated) and 24 were female (all spayed). Of the 73 dogs with CE, 39 were male (5 intact, 34 castrated) and 34 were female (4 intact, 30 spayed). There was no significant difference of the sex between the 2 groups (P = .32). The body weight of the HC dogs (median: 17.7 kg, min to max: 1.5 to 42.2 kg) was not significantly different from dogs with CE (median: 21.3 kg, min to max: 1.7 to 72.6 kg; P = .11). A large variety of breeds was represented in this study population, and dogs lived in diverse home environments and were fed a variety of diets. The protein content of diet was significantly lower in dogs with CE (median [min to max]: 56.6 [40.1 to 71.0] g/1000 kcal ME) compared to that fed to the HC dogs (median [min to max]: 73.3 [51.7 to 104.0] g/1000 kcal ME; P < .001). No significant differences in the amount of fat and crude fiber of the diets between the 2 groups were observed. Of the dogs with CE, intestinal biopsy samples were available for 47 dogs. Of those 47 dogs, 4 were classified as FRE, 2 as ARE, 11 as SRE, and 30 remained unclassified. Detailed information regarding animal characteristics is summarized in Table S2.
3.2. Evaluation of fecal SCFAs
3.2.1. Stability of fecal SCFAs
A total of 162 aliquots from 8 HC dogs were analyzed to evaluate the stability of SCFAs in feces over 3 months at various storage conditions with or without the addition of 2N HCl. Because of the small total amount of fecal volume available for 2 dogs, there were 6 data points that were not evaluated (day 84 at −20 and −80°C). No significant changes in fecal SCFA concentrations were observed when samples were frozen. There were significant changes in fecal SCFA concentrations (acetate and butyrate) when samples were stored at RT for a day and at 4°C for 7 days. There was no significant effect on fecal SCFA concentrations when HCl was added to the samples. Data are summarized in Table S3.
3.2.2. Fecal SCFA concentrations in HC dogs and dogs with CE
The DM proportion of feces was significantly lower in dogs with CE (median 28.0% [min to max: 5.5 to 67.4%]) than in HC dogs (median 33.4% [min to max: 17.3 to 77.6%], P < .001). When adjusted for fecal DM, total fecal concentrations of SCFAs were significantly lower in dogs with CE than in HC dogs (P = .005; Figure 1). More specifically, fecal concentrations of acetate and propionate were significantly lower in dogs with CE than in HC dogs (P = .03 and P < .001, respectively; Figure 1). In contrast, there was no significant difference in fecal concentrations of butyrate between both groups (P = .16; Figure 1). Without adjusting for fecal DM (ie, μmol/g of wet feces), fecal concentrations of all SCFAs, including butyrate, were significantly lower in dogs with CE (Table 1).
Figure 1.
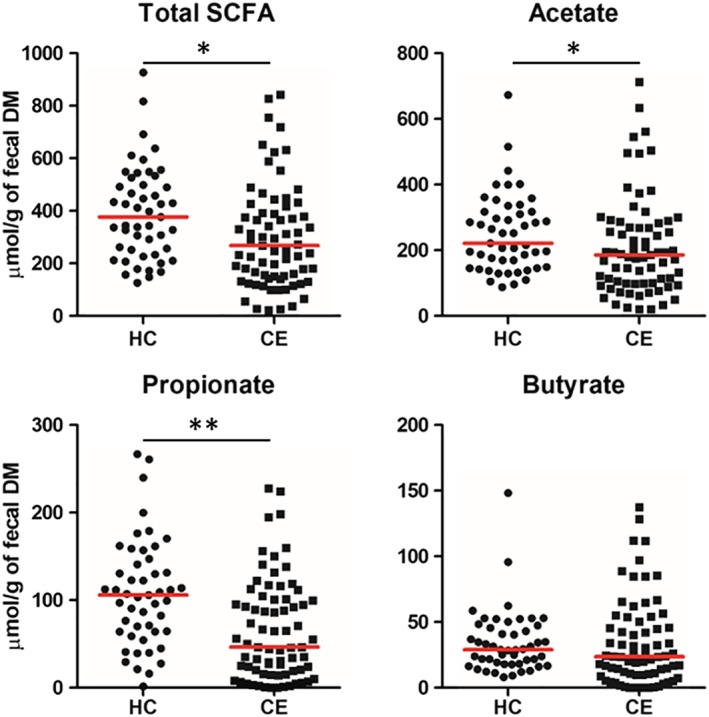
Fecal short‐chain fatty acid (SCFA) concentrations in healthy control (HC) dogs and dogs with chronic enteropathy (CE). Red lines represent the median of fecal SCFA concentrations. *P < .05 and **P < .001
Table 1.
Fecal SCFA concentrations in HC dogs and dogs with CE
| Adjusted for DM (μmol/g of fecal DM) | Not adjusted for DM (μmol/g of wet feces) | |||||||||
|---|---|---|---|---|---|---|---|---|---|---|
| HC | CE | HC | CE | |||||||
| SCFA | Median | Range | Median | Range | P‐value | Median | Range | Median | Range | P‐value |
| Acetate | 224.0 | 87.7‐672.8 | 185.8 | 20.1‐1042.1 | .03 | 81.0 | 25.3‐224.1 | 53.3 | 3.8‐151.3 | <.001 |
| Propionate | 105.9 | 1.6‐266.9 | 46.4 | 0.4‐227.9 | <.001 | 36.2 | 0.4‐81.6 | 13.8 | 0.4‐62.2 | <.001 |
| Butyrate | 28.8 | 8.1‐148.1 | 23.6 | 0.1‐137.6 | .16 | 10.3 | 1.5‐30.3 | 7.2 | 0.1‐31.2 | .004 |
| Total SCFAs | 377.2 | 126.6‐927.0 | 268.1 | 21.8‐1378.2 | .005 | 126.6 | 27.3‐292.9 | 70.4 | 4.4‐229.3 | <.001 |
Abbreviations: CE, dogs with chronic enteropathy; DM, dry matter; HC, healthy control dogs; SCFA, short‐chain fatty acid.
We also evaluated the proportional changes of fecal SCFAs in each group. Although the proportion of acetate was higher in dogs with CE (P = .02), the proportion of propionate was lower than that in HC dogs (P < .001; Figure 2). The proportion of butyrate did not differ significantly between groups (P = .56; Figure 2).
Figure 2.

Molar ratio of fecal short‐chain fatty acids (SCFAs) in healthy control (HC) dogs and dogs with chronic enteropathy (CE). Bar graph was made based on the median proportion of each SCFA. *P < .05
Fecal SCFA concentrations in dogs with CE were also evaluated based on body weight (ie, small [<10 kg], medium [≥10 and <25 kg], and large [≥25 kg]), the severity of disease, the type of diarrhea (ie, no diarrhea, small bowel diarrhea, large bowel diarrhea, or mixed diarrhea), the disease phenotype, and the presence of protein losing enteropathy (PLE). No significant differences were observed between these subclasses (data not shown).
3.2.3. Effects of medical treatment on fecal SCFA concentrations
To evaluate if the administration of antibiotics, anti‐inflammatory agents, or both medications at the time of sample collection had any effect on fecal SCFA concentrations, samples from dogs with CE were analyzed based on the history of medical treatment. Of 73 dogs with CE, 18 dogs were receiving antibiotics, 9 dogs were receiving immunosuppressive agents, and 5 dogs were receiving both. No significant differences in fecal concentrations of any of the SCFA analyzed were observed between dogs with CE that were receiving medical treatment and those that did not (Table S4).
3.3. Evaluation of the fecal microbiota
A total of 99 DNA samples (40 samples from HC dogs and 59 samples from dogs with CE) were utilized for Illumina Sequencing and qPCR assays.
3.3.1. Sequence analysis of fecal microbiota
The Illumina sequencing yielded 6 778 786 quality sequences with an average of 67 166 sequences per sample. To account for unequal sequencing depth across samples, the subsequent analysis was performed on a randomly selected subset of 5350 sequences per sample. A total of 11 phyla and 210 genera were identified. Relative abundances of individual bacterial groups were analyzed, and the abundance of several bacterial taxa was significantly different between HC dogs and dogs with CE (Table S5).
Alpha diversity
Observed species, Chao1, and Shannon index were utilized to determine taxonomic diversity (species richness and evenness) within the samples. All diversity measures were significantly decreased in dogs with CE (P = .003, .008, and <.001, respectively; Figure 3 and Table 2).
Figure 3.

Rarefaction analysis (number of observed species) of 16S rRNA gene sequences. Lines represent the mean of each group, whereas the error bars represent the standard deviations
Table 2.
Alpha diversity measures
| HC | CE | ||||
|---|---|---|---|---|---|
| Measures | Median | (Min‐max) | Median | (Min‐max) | P‐value |
| Observed species | 331 | 155‐521 | 274 | 93‐534 | .003 |
| Chao1 index | 753.3 | 307.1‐1331 | 596.2 | 197.1‐1445 | .008 |
| Shannon index | 5.2 | 3.6‐6.5 | 4.3 | 1.3‐6.0 | <.001 |
Abbreviations: CE, dogs with chronic enteropathy; HC, healthy control dogs; Min, minimum; Max, maximum.
Beta diversity
Significantly different fecal microbial communities between the dogs with CE and HC dogs was found (unweighted UniFrac, ANOSIM R = .53, P = .001; weighted UniFrac, ANOSIM R = .17, P = .001; Figure 4). In dogs with CE, ANOSIM was also applied to evaluate the similarities of microbial communities based on age, body sizes, sex, type of diarrhea, the presence of PLE, disease severities, disease phenotype, use of an antibiotic, and use of an immunosuppressive agent (Table S6).
Figure 4.

Three dimensional representation of principal coordinate analysis (PCoA) plots of A, unweighted and B, weighted UniFrac distances of 16S rRNA genes. Red circles represent data from dogs with chronic enteropathy (CE) and blue circles represent data from healthy control (HC) dogs
3.3.2. qPCR analysis of the fecal microbiota
The fecal samples were evaluated using 14 qPCR assays for selected bacterial groups. The abundances for total bacteria, Bacteroidetes, Blautia spp., Faecalibacterium spp., Fusobacterium spp., Turicibacter spp., and C. hiranonis were significantly lower in dogs with CE compared with those in HC dogs (all q < .010; Figure 3). In contrast, the abundances for Bifidobacterium spp., Lactobacillus spp., Streptococcus spp., and E. coli were significantly higher in dogs with CE compared with those in HC dogs (all q < .001; Figure 5). The abundances of Firmicutes (q = .34), Ruminococcaceae (q = .068), and C. perfringens (q = .34) did not differ between groups (Figure 5). The dysbiosis index was significantly higher in dogs with CE compared with that in HC dogs (P < .001, Figure 5).
Figure 5.

The abundances of selected bacterial groups and dysbiosis index in healthy control (HC) dogs and dogs with chronic enteropathy (CE). Red lines represent the median of log DNA. *q < .01, **q < .001, and ***P < .001
3.3.3. Effects of medical treatment on the fecal microbiota
To evaluate whether the administration of antibiotics, anti‐inflammatory agents, or both medications at the time of sample collection had a confounding effect on the abundances of bacterial groups, samples from dogs with CE were analyzed based on the history of medical treatment. Of the 59 dogs with CE, 8 dogs were receiving antibiotics, 7 dogs were receiving immunosuppressive agents, and 5 dogs were receiving both. No significant differences were observed in the abundance of any bacterial groups between dogs with CE that were receiving medical treatment and those not receiving such treatment (Table S7).
3.4. Correlations of fecal SCFAs and the fecal microbiota
There were 12 significant correlations between fecal SCFA (propionate and butyrate) concentrations and the abundance of evaluated bacterial groups (Table 3). No significant correlations were observed between fecal acetate concentrations and the abundance of evaluated bacterial groups.
Table 3.
Significant correlations between short‐chain fatty acid (SCFA) concentrations and bacterial groups
| SCFA | Bacterial group | Spearman ρ | P‐value | q‐Value |
|---|---|---|---|---|
| Propionate | Bacteroidetes | .433 | <.001 | <.001 |
| Fusobacterium spp. | .351 | <.001 | .001 | |
| Faecalibacterium spp. | .335 | <.001 | .001 | |
| C. hiranonis | .315 | .001 | .004 | |
| Blautia spp. | .309 | .001 | .004 | |
| Streptococcus spp. | −.307 | .002 | .005 | |
| Ruminococcaceae | .247 | .01 | .031 | |
| Bifidobacterium spp. | −.239 | .02 | .036 | |
| C. perfringens | .235 | .02 | .040 | |
| E. coli | −.210 | .04 | .071 | |
| Butyrate | C. perfringens | .269 | .007 | .016 |
| Fusobacterium spp. | .249 | .01 | .029 | |
| Bacteroidetes | .247 | .01 | .030 | |
| Faecalibacterium spp. | .211 | .03 | .070 |
4. DISCUSSION
In this study, dogs with CE had lower fecal concentrations of SCFAs, more specifically lower concentrations of acetate and propionate, than did HC dogs. These changes were accompanied by significant changes in fecal microbial communities. Our stability study suggests that SCFAs are stable at the storage conditions used in this study where all samples were stored at −80°C with HCl and analyzed within 3 months.
Although the fecal concentration of acetate was lower in dogs with CE than in HC dogs, its proportion (ie, acetate/total SCFAs) was significantly higher than in control dogs. On the other hand, the proportion of propionate (ie, propionate/total SCFAs) was significantly lower than that of CE dogs. These findings are of interest, as changes in SCFAs concentration are involved in the activation of Salmonella virulence factors.12, 13, 29 The expression of the Salmonella typhimurium invasion gene, SPI‐1 gene, is induced at low total SCFA concentrations and a predominance of acetate. In contrast, the expression of the SPI‐1 gene is suppressed at high total SCFA concentrations and at a higher proportion of propionate.13 Similar findings, where propionate and butyrate suppress the expression of the SPI‐1 gene, are reported for in vitro studies.12, 29
In the current study, the magnitude of the difference in fecal propionate concentrations between HC dogs and dogs with CE was most prominent among all SCFAs. Propionate is important because of its anti‐inflammatory effects in the intestine. Propionate decreases the production of pro‐inflammatory cytokines such as IL‐6, IL‐8, and TNFα.30, 31 In addition, there is a regulatory effect of propionate on colonic T regs. 8 In 1 in vivo study, the treatment with propionate stimulates the expression of IL‐10 and 1 of the transcription factors, Foxp3. Activation of Foxp3 is crucial for suppression/regulation of intestinal inflammation. Moreover, treatment with propionate increases the T regs population and improves its function through GPR43 signaling, and ameliorates the severity of experimental colitis in mice.8 Similarly to these findings of in vitro and rodent model studies, there are decreased numbers of Foxp3 positive T regs in the duodenal mucosa of dogs with IBD.32 Therefore, it is possible that a decrease in concentration of propionate plays a role in pathogenesis of chronic intestinal inflammation in dogs. Persistent inflammation can damage the intestinal epithelial cells and lead to malabsorption of dietary nutrients.
In contrast to other SCFAs, the fecal concentration of butyrate did not differ significantly between HC dogs and dogs with CE. This was an unanticipated finding, as many of the decreased bacterial groups in dogs with CE in this study are considered to be butyrate producers.33 Interestingly, when results of fecal SCFAs were not adjusted for DM content, fecal concentrations of all SCFAs, including that of butyrate, were significantly lower in dogs with CE than those in HC dogs. This raised the question regarding whether normalization for the measurement of fecal concentrations of SCFAs by DM is necessary. Although most of the studies evaluating fecal concentrations of SCFAs in dogs report the concentrations adjusted by fecal DM (ie, μmol/g of fecal DM), most of the clinical studies in humans and studies using rodent models report the concentrations without adjustment to fecal DM (ie, μmol/g of fecal content or wet feces). No consensus has been reached at this point whether normalization is necessary or not. One possible explanation why the fecal concentration of butyrate did not differ between groups might be a difference of absorption/utilization of butyrate compared to that of acetate or propionate. Butyrate is preferentially utilized as an energy source by intestinal epithelial cells, and only small amounts (<10%) of butyrate reach the portal circulation. In contrast, most of acetate and propionate (up to 70%) enter the portal circulation and are metabolized in the liver and utilized for lipid metabolism (acetate) and gluconeogenesis (propionate). Only acetate reaches the systemic circulation in relatively high concentrations, and can be utilized by muscle, heart, adipose tissue, and the kidneys. A small proportion of unabsorbed SCFAs are excreted in the feces.3, 34, 35, 36 Therefore, we speculate that the utilization of butyrate by epithelial cells is reduced or butyrate is lost into the lumen with intestinal epithelial cells because of chronic intestinal inflammation. Similarly, increased fecal concentrations of butyrate accompanied by decreased concentration of propionate were observed in dogs with acute diarrhea when compared to those in HC dogs.28
Similar to our findings, decreased concentrations of SCFAs in the intestinal tract are associated with GI diseases such as IBD and colorectal cancer in humans and rodent models.6, 7 However, it is clear that we cannot differentiate animal's phenotype based on the concentrations of SCFAs. In other words, there is no diagnostic utility of SCFAs measurement in dogs with CE. Nonetheless, our findings provide a new insight into the pathogenesis of CE in dogs. In studies mentioned above, the protective and therapeutic effects of SCFAs on GI disease have also been reported. Therefore, therapeutic interventions that manipulate fecal SCFA concentrations in the GI tract could be a potential treatment option for suppressing intestinal inflammation and restore proper immune responses. Further research is warranted to determine the efficacy of SCFAs manipulation in dogs with GI disease.
The analysis of the fecal microbiota revealed significant differences in microbial communities between HC dogs and dogs with CE. A number of recent studies have emphasized the importance of balanced GI microbial communities for GI health in humans and animal models of intestinal inflammation.37, 38, 39, 40 To evaluate the global picture of fecal microbial communities, we utilized a high‐throughput sequencing technique in this current study. This current study is 1 of the largest studies utilizing this technique to evaluate canine GI microbial communities and confirming findings from previous studies where dogs with GI diseases show distinct microbial communities and lower microbial diversity compared to HC dogs. Moreover, the patterns of alteration of bacterial communities observed in the current study are consistent with those from previous studies.41, 42 In fact, dogs with CE have a higher dysbiosis index, a recently developed mathematical algorithm based on the abundances of 8 bacterial groups in canine fecal samples.24
As mentioned previously, SCFAs are major end products of carbohydrate fermentation.11 The primary fermenters such as Bacteroidetes can transform simple sugars derived from the breakdown of complex carbohydrates to acetate and propionate. Then, secondary fermenters such as Firmicutes further utilize acetate to generate butyrate.43, 44 Although the abundance of Bacteroidetes (phylum level) was significantly lower in dogs with CE, no differences were observed in the abundances of Firmicutes (phylum level) and Ruminococcaceae (family level) between groups. However, at lower phylogenetic levels (ie, genus level), we observed lower abundances of members of Firmicutes such as Blautia spp., Faecalibacterium spp., and Turicibacter spp. Moreover, we observed mild to moderate and significant correlation between SCFA concentrations and these bacterial groups. The abundances of Bifidobacterium spp., Lactobacillus spp., Streptococcus spp., and potential pathogenic E. coli were higher in diseased dogs than in HC dogs. Although their role in CE in dogs largely remains unknown, previous studies also indicate that these bacterial groups are found in higher abundances in dogs with GI diseases.21, 22, 41 Although a causative relationship between dysbiosis and decreased fecal SCFA concentrations cannot be concluded on the basis of our findings, the alteration of fecal SCFA concentrations could indicate the presence of dysbiosis in dogs with CE. Therefore, treatments aiming to reestablish normal healthy bacterial communities might be warranted in dogs with GI diseases.
Because of the nature of clinical studies in dogs with spontaneous diseases, we faced several limitations. The subject dogs were living in different environments and were fed a variety of diets. As for the diseased dogs, most of the samples were collected at different institutions, the medications and the timing of sample collection after the onset of clinical signs varied between patients. These can be confounding factors. Especially, diet history and medication were of our concern because studies have shown the effects of diet and antibiotics on GI microbial communities in healthy research dogs.12, 45, 46 However, in the current study, no significant differences were observed between groups in terms of global microbial communities, the abundances of selected bacterial groups, and the fecal concentrations of SCFAs based on diet and use of medications. In the current study, although we found that the protein content of fed diet was significantly lower in dogs with CE, there was a wide overlap in protein content fed to the diseased and healthy dogs. A study evaluated the effect of the amount of protein content on fecal volatile fatty acids in healthy research dogs and found that the high protein diet group had lower fecal concentrations of acetate and propionate compared with the commercial diet group. In that study, the high protein diet group was fed about a 2.3 times higher protein content than the commercial diet group.47 In contrast, in our current study, we observed higher fecal concentrations of acetate and propionate in the healthy dogs that were fed a higher protein content in their diet. Moreover, the difference in the amount of protein content in our study was much less (1.3 times higher in the healthy dogs) than that study. Additionally, previous studies aimed to identify associations of microbial abundance with antibiotic administration, diet, or both also report similar findings where no significant effects of medication, diet, or both on GI microbial communities in dogs with GI disease were found.21, 22, 48, 49 It is possible that there was a type II error because of small sample size, and we could not detect the effects in this current study. However, we believe that these changes are mainly because of a dog's GI health status, and the disease is a stronger driver to alter the GI microbiota. Further multicenter studies with a standardized protocol are warranted to validate these findings by eliminating the potential effects of confounding factors.
In conclusion, this study demonstrated lower fecal concentrations and altered patterns of SCFAs in concert with changes of the fecal microbial communities in dogs with CE. These findings mandate further clinical studies to determine whether fecal SCFAs can be manipulated by various interventions and whether manipulating SCFAs concentrations and patterns in the GI tract could be beneficial in these patients, leading to the restoration of a proper immune response and remission of clinical signs.
CONFLICT OF INTEREST DECLARATION
Authors declare no conflict of interest.
OFF‐LABEL ANTIMICROBIAL DECLARATION
Authors declare no off‐label use of antimicrobials.
INSTITUTIONAL ANIMAL CARE AND USE COMMITTEE (IACUC) OR OTHER APPROVAL DECLARATION
The protocol for sample collection was approved by the Texas A&M University IACUC (AUP #2012‐83).
HUMAN ETHICS APPROVAL DECLARATION
Authors declare human ethics approval was not needed for this study.
Supporting information
Supplementary Table 1 Assay validation parameters for the GC/MS protocol for the measurement of acetate, propionate, and butyrate in canine fecal samples
Supplementary Table 2 Animal characteristics of study animals
Supplementary Table 3 Stability of fecal SCFAs at various storage conditions
Supplementary Table 4 Fecal SCFA concentrations in dogs with chronic GI disease receiving medical treatment and those without
Supplementary Table 5 Relative abundances and statistical differences of the most abundant bacterial groups (phylum and genus level) of 16S rRNA gene sequences in fecal samples from HC and dogs with CE
Supplementary Table 6 Evaluation of the similarities of microbial communities in dogs with CE
Supplementary Table 7 The abundances of selected bacterial groups in dogs with chronic GI disease receiving medical treatment and those without
ACKNOWLEDGMENT
A portion of this study was presented at the 2015 American College of Veterinary Internal Medicine Forum in Indianapolis, Indiana.
Minamoto Y, Minamoto T, Isaiah A, et al. Fecal short‐chain fatty acid concentrations and dysbiosis in dogs with chronic enteropathy. J Vet Intern Med. 2019;33:1608–1618. 10.1111/jvim.15520
REFERENCES
- 1. Brestoff JR, Artis D. Commensal bacteria at the interface of host metabolism and the immune system. Nat Immunol. 2013;14(7):676‐684. [DOI] [PMC free article] [PubMed] [Google Scholar]
- 2. Binder HJ. Role of colonic short‐chain fatty acid transport in diarrhea. Annu Rev Physiol. 2010;72:297‐313. [DOI] [PubMed] [Google Scholar]
- 3. Bergman EN. Energy contributions of volatile fatty acids from the gastrointestinal tract in various species. Physiol Rev. 1990;70(2):567‐590. [DOI] [PubMed] [Google Scholar]
- 4. Rondeau M. Short chain fatty acids stimulate feline colonic smooth muscle contraction. J Feline Med Surg. 2003;5(3):167‐173. [DOI] [PMC free article] [PubMed] [Google Scholar]
- 5. Kamath PS, Hoepfner MT, Phillips SF. Short‐chain fatty acids stimulate motility of the canine ileum. Am J Physiol. 1987;253(4 Pt 1):427‐433. [DOI] [PubMed] [Google Scholar]
- 6. Marchesi J, Holmes E. Rapid and noninvasive metabonomic characterization of inflammatory bowel disease. J Proteome Res. 2007;6(2):546‐551. [DOI] [PubMed] [Google Scholar]
- 7. O'Keefe SJD, Ou J, Aufreiter S, et al. Products of the colonic microbiota mediate the effects of diet on colon cancer risk. J Nutr. 2009;139(11):2044‐2048. [DOI] [PMC free article] [PubMed] [Google Scholar]
- 8. Smith PM, Howitt MR, Panikov N, et al. The microbial metabolites, short‐chain fatty acids, regulate colonic Treg cell homeostasis. Science. 2013;341(6145):569‐573. [DOI] [PMC free article] [PubMed] [Google Scholar]
- 9. Kim MH, Kang SG, Park JH, Yanagisawa M, Kim CH. Short‐chain fatty acids activate GPR41 and GPR43 on intestinal epithelial cells to promote inflammatory responses in mice. Gastroenterology. 2013;145(2):396‐406.e10. [DOI] [PubMed] [Google Scholar]
- 10. Cherrington CA, Hinton M, Pearson GR, Chopra I. Short‐chain organic acids at ph 5.0 kill Escherichia coli and Salmonella spp. without causing membrane perturbation. J Appl Bacteriol. 1991;70(2):161‐165. [DOI] [PubMed] [Google Scholar]
- 11. Sun Y, O'Riordan MX. Regulation of bacterial pathogenesis by intestinal short‐chain fatty acids. Adv Appl Microbiol. 2013;85:93‐118. [DOI] [PMC free article] [PubMed] [Google Scholar]
- 12. Hung C‐C, Garner CD, Slauch JM, et al. The intestinal fatty acid propionate inhibits Salmonella invasion through the post‐translational control of HilD. Mol Microbiol. 2013;87(5):1045‐1060. [DOI] [PMC free article] [PubMed] [Google Scholar]
- 13. Lawhon SD, Maurer R, Suyemoto M, Altier C. Intestinal short‐chain fatty acids alter Salmonella typhimurium invasion gene expression and virulence through BarA/SirA. Mol Microbiol. 2002;46(5):1451‐1464. [DOI] [PubMed] [Google Scholar]
- 14. May T, Mackie RI, Fahey GC, Cremin JC, Garleb KA. Effect of fiber source on short‐chain fatty acid production and on the growth and toxin production by Clostridium difficile . Scand J Gastroenterol. 1994;29(10):916‐922. [DOI] [PubMed] [Google Scholar]
- 15. Tanner SA, Chassard C, Zihler Berner A, Lacroix C. Synergistic effects of Bifidobacterium thermophilum RBL67 and selected prebiotics on inhibition of Salmonella colonization in the swine proximal colon PolyFermS model. Gut Pathog. 2014;6(1):44. [DOI] [PMC free article] [PubMed] [Google Scholar]
- 16. Fukuda S, Toh H, Hase K, et al. Bifidobacteria can protect from enteropathogenic infection through production of acetate. Nature. 2011;469(7331):543‐547. [DOI] [PubMed] [Google Scholar]
- 17. Barry KA, Hernot DC, Middelbos IS, et al. Low‐level fructan supplementation of dogs enhances nutrient digestion and modifies stool metabolite concentrations, but does not alter fecal microbiota populations. J Anim Sci. 2009;87(10):3244‐3252. [DOI] [PubMed] [Google Scholar]
- 18. Beloshapka AN, Wolff AK, Swanson KS. Effects of feeding polydextrose on faecal characteristics, microbiota and fermentative end products in healthy adult dogs. Br J Nutr. 2012;108(4):638‐644. [DOI] [PubMed] [Google Scholar]
- 19. Allenspach K, Wieland B, Gröne a, Gaschen F. Chronic enteropathies in dogs: evaluation of risk factors for negative outcome. J Vet Intern Med. 2007;21(4):700‐708. [DOI] [PubMed] [Google Scholar]
- 20. Moreau NM, Goupry SM, Antignac JP, et al. Simultaneous measurement of plasma concentrations and 13C‐enrichment of short‐chain fatty acids, lactic acid and ketone bodies by gas chromatography coupled to mass spectrometry. J Chromatogr B Analyt Technol Biomed Life Sci. 2003;784(2):395‐403. [DOI] [PubMed] [Google Scholar]
- 21. Minamoto Y, Dhanani N, Markel ME, Steiner JM, Suchodolski JS. Prevalence of Clostridium perfringens, Clostridium perfringens enterotoxin and dysbiosis in fecal samples of dogs with diarrhea. Vet Microbiol. 2014;174(3–4):463‐473. [DOI] [PubMed] [Google Scholar]
- 22. Minamoto Y, Otoni CC, Steelman SM, et al. Alteration of the fecal microbiota and serum metabolite profiles in dogs with idiopathic inflammatory bowel disease. Gut Microbes. 2015;6(1):33‐47. [DOI] [PMC free article] [PubMed] [Google Scholar]
- 23. Suchodolski JS, Camacho J, Steiner JM. Analysis of bacterial diversity in the canine duodenum, jejunum, ileum, and colon by comparative 16S rRNA gene analysis. FEMS Microbiol Ecol. 2008;66(3):567‐578. [DOI] [PubMed] [Google Scholar]
- 24. AlShawaqfeh M, Wajid B, Minamoto Y, et al. A dysbiosis index to assess microbial changes in fecal samples of dogs with chronic inflammatory enteropathy. FEMS Microbiol Ecol. 2017;93(11):Fix136. [DOI] [PubMed] [Google Scholar]
- 25. Bell ET, Suchodolski JS, Isaiah A, et al. Faecal microbiota of cats with insulin‐treated diabetes mellitus. PLoS One. 2014;9(10):e108729. [DOI] [PMC free article] [PubMed] [Google Scholar]
- 26. Caporaso JG, Kuczynski J, Stombaugh J, et al. QIIME allows analysis of high‐throughput community sequencing data. Nat Methods. 2010;7(5):335‐336. [DOI] [PMC free article] [PubMed] [Google Scholar]
- 27. DeSantis TZ, Hugenholtz P, Larsen N, et al. Greengenes, a chimera‐checked 16S rRNA gene database and workbench compatible with ARB. Appl Environ Microbiol. 2006;72(7):5069‐5072. [DOI] [PMC free article] [PubMed] [Google Scholar]
- 28. Guard BC, Barr JW, Reddivari L, et al. Characterization of microbial dysbiosis and metabolomic changes in dogs with acute diarrhea. PLoS One. 2015;10(5):e0127259. [DOI] [PMC free article] [PubMed] [Google Scholar]
- 29. Gantois I, Ducatelle R, Pasmans F, et al. Butyrate specifically down‐regulates Salmonella Pathogenicity Island 1 gene expression. Appl Environ Microbiol. 2006;72(1):946‐949. [DOI] [PMC free article] [PubMed] [Google Scholar]
- 30. Vinolo MAR, Rodrigues HG, Hatanaka E, Sato FT, Sampaio SC, Curi R. Suppressive effect of short‐chain fatty acids on production of proinflammatory mediators by neutrophils. J Nutr Biochem. 2011;22(9):849‐855. [DOI] [PubMed] [Google Scholar]
- 31. Usami M, Kishimoto K, Ohata A, et al. Butyrate and trichostatin A attenuate nuclear factor κB activation and tumor necrosis factor α secretion and increase prostaglandin E2 secretion in human peripheral blood mononuclear cells. Nutr Res. 2008;28(5):321‐328. [DOI] [PubMed] [Google Scholar]
- 32. Maeda S, Ohno K, Fujiwara‐Igarashi A, Uchida K, Tsujimoto H. Changes in Foxp3‐positive regulatory t cell number in the intestine of dogs with idiopathic inflammatory bowel disease and intestinal lymphoma. Vet Pathol. 2015;53(1):102‐112. [DOI] [PubMed] [Google Scholar]
- 33. Morgan XC, Tickle TL, Sokol H, et al. Dysfunction of the intestinal microbiome in inflammatory bowel disease and treatment. Genome Biol. 2012;13(9):R79. [DOI] [PMC free article] [PubMed] [Google Scholar]
- 34. Pomare EW, Branch WJ, Cummings JH. Carbohydrate fermentation in the human colon and its relation to acetate concentrations in venous blood. J Clin Invest. 1985;75(5):1448‐1454. [DOI] [PMC free article] [PubMed] [Google Scholar]
- 35. Macfarlane GT, Gibson GR, Cummings JH. Comparison of fermentation reactions in different regions of the human colon. J Appl Bacteriol. 1992;72(1):57‐64. [DOI] [PubMed] [Google Scholar]
- 36. Knowles SE, Jarrett IG, Filsell OH, Ballard FJ. Production and utilization of acetate in mammals. Biochem J. 1974;142(2):401‐411. [DOI] [PMC free article] [PubMed] [Google Scholar]
- 37. Weingarden AR, Chen C, Bobr A, et al. Microbiota transplantation restores normal fecal bile acid composition in recurrent Clostridium difficile infection. Am J Physiol Gastrointest Liver Physiol. 2014;306(4):G310‐G319. [DOI] [PMC free article] [PubMed] [Google Scholar]
- 38. Theriot CM, Koenigsknecht MJ, Carlson PE, et al. Antibiotic induced shifts in the mouse gut microbiome and metabolome increase susceptibility to Clostridium difficile infection. Nat Commun. 2014;5:3114. [DOI] [PMC free article] [PubMed] [Google Scholar]
- 39. Antharam VC, Li EC, Ishmael A, et al. Intestinal dysbiosis and depletion of butyrogenic bacteria in Clostridium difficile infection and nosocomial diarrhea. J Clin Microbiol. 2013;51(9):2884‐2892. [DOI] [PMC free article] [PubMed] [Google Scholar]
- 40. Duboc H, Rajca S, Rainteau D, et al. Connecting dysbiosis, bile‐acid dysmetabolism and gut inflammation in inflammatory bowel diseases. Gut. 2013;62(4):531‐539. [DOI] [PubMed] [Google Scholar]
- 41. Suchodolski JS, Markel ME, Garcia‐Mazcorro JF, et al. The fecal microbiome in dogs with acute diarrhea and idiopathic inflammatory bowel disease. PLoS One. 2012;7(12):e51907. [DOI] [PMC free article] [PubMed] [Google Scholar]
- 42. Suchodolski JS, Dowd SE, Wilke V, Steiner JM, Jergens AE. 16S rRNA gene pyrosequencing reveals bacterial dysbiosis in the duodenum of dogs with idiopathic inflammatory bowel disease. PLoS One. 2012;7(6):e39333. [DOI] [PMC free article] [PubMed] [Google Scholar]
- 43. Macfarlane GT, Macfarlane S. Bacteria, colonic fermentation, and gastrointestinal health. J AOAC Int. 2012;95(1):50‐61. [DOI] [PubMed] [Google Scholar]
- 44. Louis P, Hold GL, Flint HJ. The gut microbiota, bacterial metabolites and colorectal cancer. Nat Rev Microbiol. 2014;12(10):661‐672. [DOI] [PubMed] [Google Scholar]
- 45. Suchodolski JS, Dowd SE, Westermarck E, et al. The effect of the macrolide antibiotic tylosin on microbial diversity in the canine small intestine as demonstrated by massive parallel 16S rRNA gene sequencing. BMC Microbiol. 2009;9:210. [DOI] [PMC free article] [PubMed] [Google Scholar]
- 46. Igarashi H, Maeda S, Ohno K, Horigome A, Odamaki T, Tsujimoto H. Effect of oral administration of metronidazole or prednisolone on fecal microbiota in dogs. PLoS One. 2014;9(9):e107909. [DOI] [PMC free article] [PubMed] [Google Scholar]
- 47. Hang I, Heilmann RM, Grützner N, et al. Impact of diets with a high content of greaves‐meal protein or carbohydrates on faecal characteristics, volatile fatty acids and faecal calprotectin concentrations in healthy dogs. BMC Vet Res. 2013;9:201. [DOI] [PMC free article] [PubMed] [Google Scholar]
- 48. Rossi G, Pengo G, Caldin M, et al. Comparison of microbiological, histological, and immunomodulatory parameters in response to treatment with either combination therapy with prednisone and metronidazole or probiotic VSL#3 strains in dogs with idiopathic inflammatory bowel disease. PLoS One. 2014;9(4):e94699. [DOI] [PMC free article] [PubMed] [Google Scholar]
- 49. Vázquez‐Baeza Y, Hyde ER, Suchodolski JS, Knight R. Dog and human inflammatory bowel disease rely on overlapping yet distinct dysbiosis networks. Nat Microbiol. 2016;1:16177. [DOI] [PubMed] [Google Scholar]
Associated Data
This section collects any data citations, data availability statements, or supplementary materials included in this article.
Supplementary Materials
Supplementary Table 1 Assay validation parameters for the GC/MS protocol for the measurement of acetate, propionate, and butyrate in canine fecal samples
Supplementary Table 2 Animal characteristics of study animals
Supplementary Table 3 Stability of fecal SCFAs at various storage conditions
Supplementary Table 4 Fecal SCFA concentrations in dogs with chronic GI disease receiving medical treatment and those without
Supplementary Table 5 Relative abundances and statistical differences of the most abundant bacterial groups (phylum and genus level) of 16S rRNA gene sequences in fecal samples from HC and dogs with CE
Supplementary Table 6 Evaluation of the similarities of microbial communities in dogs with CE
Supplementary Table 7 The abundances of selected bacterial groups in dogs with chronic GI disease receiving medical treatment and those without