Abstract
Background:
The introduction of digital pathology into clinical practice has led to the development of clinical workflows with digital images, in connection with pathology reports. Still, most of the current work is time-consuming manual analysis of image areas at different scales. Links with data in the biomedical literature are rare, and a need for search based on visual similarity within whole slide images (WSIs) exists.
Objectives:
The main objective of the work presented is to integrate content-based visual retrieval with a WSI viewer in a prototype. Another objective is to connect cases analyzed in the viewer with cases or images from the biomedical literature, including the search through visual similarity and text.
Methods:
An innovative retrieval system for digital pathology is integrated with a WSI viewer, allowing to define regions of interest (ROIs) in images as queries for finding visually similar areas in the same or other images and to zoom in/out to find structures at varying magnification levels. The algorithms are based on a multimodal approach, exploiting both text information and content-based image features.
Results:
The retrieval system allows viewing WSIs and searching for regions that are visually similar to manually defined ROIs in various data sources (proprietary and public datasets, e.g., scientific literature). The system was tested by pathologists, highlighting its capabilities and suggesting ways to improve it and make it more usable in clinical practice.
Conclusions:
The developed system can enhance the practice of pathologists by enabling them to use their experience and knowledge to control artificial intelligence tools for navigating repositories of images for clinical decision support and teaching, where the comparison with visually similar cases can help to avoid misinterpretations. The system is available as open source, allowing the scientific community to test, ideate and develop similar systems for research and clinical practice.
Keywords: Clinical decision support, digital pathology, image retrieval, whole slide imaging
INTRODUCTION
Visual inspection of tissue samples is currently the standard method to diagnose a considerable number of diseases and to grade/stage most types of cancer.[1,2] In recent years, various pathology departments have started a digitization of patient data and stored samples.[3] Whole slide image (WSI) scanning now enables the on-screen visualization of high-resolution images from patient tissue slides. This opens the door to a wide range of image navigation and analysis solutions for histopathology practice.[4] For instance, a full implementation of digital pathology allows making diagnoses out of the laboratory, facilitate online consultations, and browsing cases,[5] enable faster access to pathology services in remote areas and promote the development of novel computer vision and artificial intelligence (AI) algorithms. In the future, AI tools may modify the workflow of pathologists in fundamental ways, i.e., through computer-aided diagnosis, or simply by speeding up time-consuming manual tasks (such as relying on automatic mitosis counting algorithms).[6]
One of the main challenges in this digitization process is how to store and structure the patient studies together with their diagnostic metrics and metadata.[7] The increasing amount of generated patient data and a larger variety and complexity of diagnostic tests requires efficient storage and access techniques and a logical structuring of health repositories. Pathologists should then gain faster and more direct access to relevant patient data stored in these hospital repositories[8] and also links between several data sources based on visual similarity. Over the past 20 years, many domains have embraced specific information retrieval systems as a solution for this problem. A retrieval system is an approach for browsing, searching, and retrieving relevant data from structured data, free text, or unstructured data such as images, signals, or videos. For example, web search engines allow browsing the internet and quickly accessing many kinds of information, using keywords or images to find similar content. Available retrieval systems are commonly based on these two main search strategies: text search and visual search (based on visual features such as texture, color, and shape).
Medical retrieval of images and patient cases was evaluated using radiology data with good results in its contribution to differential diagnosis and for education.[9,10] A few retrieval algorithms have been proposed using pathology data.[11,12,13,14] Caicedo et al.[11] used matrix factorization algorithms for fusing multimodal information of histopathology patches into a joint semantic space. This multimodal fusion embedding increased the overall performance of the method. Qi et al.[15] proposed a content-based image retrieval system (CBIR) in which region of interest (ROI) localization was performed using multiple scales and annular histograms. A hierarchical search with relevance feedback further improved the quality of the results. In Zhang et al.,[13] a scalable algorithm was presented to retrieve histopathology breast cancer images. The approach compressed high-dimensional feature vectors into a few hashing bits, thus computing similarities in near real-time using lookup tables.
The main application of the system presented here is thus the use for teaching and clinical decision making. Teaching can well be supported by supplying cases with visually similar regions and different or the same diagnosis/grading/staging. In clinical decision-making, a comparison with rare or unusual cases from the medical literature allows the clinician to visually compare a case to examples that are rare in clinical practice, and that can thus easily be misinterpreted.
Deep learning (DL) methods have in recent years outperformed traditional machine learning algorithms in many applications and have been adopted broadly by the biomedical image analysis community, also for a wide array of digital pathology tasks.[7] Recently, multimodal queries coming from pathology reports and WSIs were evaluated using DL features by Jimenez-del-Toro et al.[8] Automatically generated ROIs in WSIs from dense cell areas were fused with the free text of pathology reports to retrieve cases with similar Gleason scores. This approach was initially evaluated for classifying Gleason grades in prostate cancer, relying only on weakly annotated data, i.e., only using the global cancer grading of WSIs without any additional manual annotations in images.[16]
An essential requisite to introduce these and other AI algorithms into the digital workflow is the development of dynamic and user-friendly platforms dealing with large-scale WSIs in real time. Several pathology image platforms have been proposed in the literature [Table 1].[17,18,19] Many of these platforms target a specific research topic, i.e., Drosophila research.[28] On the other hand, some of the recent approaches have a flexible design that allows the inclusion of several data models and extensions for multiple applications.[19] The more recent platforms are web based,[17] which facilitates online sharing of large-scale imaging datasets[26] and collaborative research.[20] Nevertheless, few of these platforms handle WSI in an interactive and dynamic way, as the images are extremely large and not easy to visualize on-screen. Moreover, most of these systems only deal with predefined ROIs, usually analyzing selected areas in an offline fashion. Such constraints reduce the applicability of the platforms in real applications, where queries are arbitrarily selected over WSI areas.
Table 1.
Pathology image analysis platforms
| Platform | Basic image analysis | Web-based | Dynamic WSI | WSI retrieval | Scientific literature retrieval | Deep learning analysis |
|---|---|---|---|---|---|---|
| CellProfiler[18] | ✔ | - | - | - | - | ✔ |
| CATMAID[20] | ✔ | ✔ | - | ✔ | - | - |
| Bisque[19] | ✔ | ✔ | ✔ | ✔ | - | - |
| PIIP[21] | ✔ | - | ✔ | - | - | - |
| Ilastik[22] | ✔ | - | - | - | - | - |
| Icy[23] | ✔ | - | - | - | - | - |
| Fiji[24] | ✔ | - | - | - | - | - |
| OMERO[25] | ✔ | ✔ | - | ✔ | - | - |
| BigDataViewer[26] | ✔ | ✔ | - | - | - | - |
| Cytomine[17] | ✔ | ✔ | ✔ | ✔ | - | - |
| Luigi[27] | ✔ | ✔ | - | ✔ | - | ✔ |
| DESUTO | ✔ | ✔ | ✔ | ✔ | ✔ | ✔ |
-: Missing feature, ✔: Included feature. CATMAID: Collaborative Annotation Toolkit for Massive Amounts of Image Data, Pathology Image Informatics Platform, DESUTO: Decision Support Tools, OMERO: Open Microscopy Environment Remote Objects, WSI: Whole slide image, Fiji: Fiji is just ImageJ, PIIP: Pathology image informatics platform
Finally, to the best of our knowledge, the development of these platforms has lacked a relevance feedback process involving pathologists and their user experience. Therefore, addressing the pathologists' needs from an early development phase is crucial to better understand which functions are most useful and how pathologists can interact with such tools.
In this article, we propose a digital pathology system with an embedded WSI viewer with fast scale changes that retrieve visually similar local areas within the same image, as well as in other images from large databases and scientific literature. This dynamic histopathology image retrieval system is built using DL and classical handcrafted features and can also retrieve relevant documents from the scientific literature using multimodal queries (including text and visual information).
The methods used are based on quantitative features extracted from the pathological samples at several magnification levels. The viewer/annotation tool and the retrieval system were developed using modern web technologies and several existing software tools and libraries.
The code for the developed components, as well as instructions for starting a new instance of the platform, can be found at the following repository: https://c4science.ch/source/desuto-platform. The following sections present an overview of how the platform was built, its functions, a qualitative assessment obtained with user tests performed by pathologists and a quantitative evaluation of the system's retrieval performance.
System description
Programming languages and technologies
The viewer/annotation tool was developed as a “Node.js” (http://nodejs.org, as of October 25, 2018, v8.x) application using the “Express” (http://expressjs.com, as of October 25, 2018, v4.x) web framework, with JavaScript as the programming language for both front and backend code.
All data relative to annotations made by pathologists were stored using “CouchDB” (http://couchdb.apache.org, as of October 25, 2018, v2.x), a document-oriented database system designed for the web: It uses JavaScript Object Notation as a data format and the HyperText Transfer Protocol (HTTP) for communication.
The retrieval system is based on a client-side only frontend developed with HyperText Markup Language 5 (HTML5) and JavaScript, communicating with a Java-based retrieval backend using Representational State Transfer web services.
No web framework (e.g., Angular, React) was used in the development of these tools, but rather a plain JavaScript approach with the use of libraries for specific features.
Libraries and tools
Several existing libraries and software components were combined to develop the viewer/annotation tool, outlined below and shown in Figure 1:
Figure 1.

Libraries and software components used in the retrieval system
jQuery (http://jquery.com/, as of March 29, 2018, v2.1.3) was used as the base for interactions with HTML elements, event handling, and asynchronous HTTP calls on the client side
OpenSeaDragon (http://openseadragon.github.io, as of October 25, 2018, v2.2.1) was used as the viewer for the high-resolution histopathology images. It allows loading, zooming and panning around high-resolution images while dynamically loading image tiles from a given tile source. Several plugins for OpenSeaDragon were also used, such as the “Scalable Vector Graphics (SVG) Overlay for OpenSeaDragon” (https://git.io/vA0tP, as of October 25, 2018) plugin for integrating the annotation tool with the viewer
IIPImage (http://iipimage.sourceforge.net/, as of October 25, 2018, v1.0) was used as the image server generating the tiles loaded by the OpenSeaDragon viewer. It is a fast server that supports various high-resolution formats and protocols, including “DeepZoom” (https://en.wikipedia.org/wiki/Deep_Zoom, as of October 25, 2018), which was used for interacting with the viewer
OpenSlide (http://openslide.org, as of October 25, 2018, v3.4.0) was used to read WSIs from various proprietary formats (e.g., Aperio, Hamamatsu)
The VASARI Image Processing System (VIPS) (http://jcupitt.github.io/libvips, as of October 25, 2018, v8.2.2) was used in combination with OpenSlide to convert WSIs to a standard pyramidal Big Tagged Image File Format image that can be served by IIPImage, using the DeepZoom image protocol
SVG-Edit (http://github.com/SVG-Edit/svgedit, as of October 25, 2018, v2.8.1) was used as the tool for drawing annotations on the images. It is a full-featured drawing application that was simplified for the needs of the project
The Shambala retrieval interface (http://shambala.khresmoi.eu, as of October 25, 2018, v1.0) was used as the basis for the development of the retrieval system's frontend.[9] The main objective of the interface is to provide an easy-to-use and intuitive search interface for images
The Parallel Distributed Image Search Engine (ParaDISE) (http://paradise.khresmoi.eu, as of October 25, 2018, v0.0.1) was used as the backend for the retrieval system.[29] The main objectives of ParaDISE are to enable indexing and retrieval of images using several types of visual features (both local features and global descriptors) in a simple and efficient manner.
Design process
The platform was developed in an iterative way, with short iterations followed by user feedback and adjustments, especially in the beginning of the process. The various features (viewer, annotation tool, and retrieval) were built up step-by-step, taking into account the user comments, ensuring that the final product would fit their needs.
Features
This section presents an overview of the main features implemented in the platform. It details the workflow of the user and illustrates how the system can help in fulfilling the pathologists' information needs.
Workflow
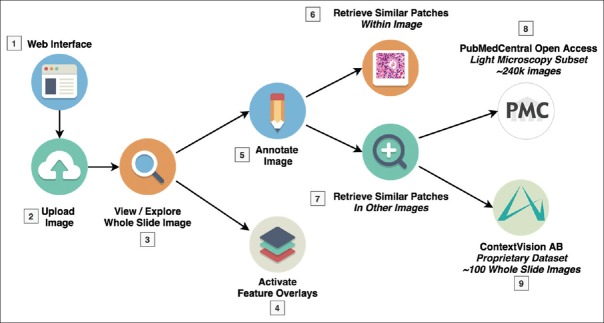
This section shows an overview of the workflow of a pathologist using the platform [Figure 2 and Table 2].
Figure 2.
Illustration of a typical user workflow within the platform showing the options and possibilities that are available in terms of search
Table 2.
Description of user workflow within the platform
| Step | Description |
|---|---|
| Step 1: Login | The user accesses the Web interface and logs in with his account, then accesses existing datasets and images |
| Step 2: Upload | The user can upload a new image, which triggers the image processing pipeline (described in section “image processing”) |
| Step 3: Explore | Once the image is processed, it is available for viewing, exploring t panning and zooming into various regions |
| Step 4: Overlays | The user can choose to activate one or more “feature overlays,” that superimpose visual information on top of the WSI, e.g., highlighting automatically segmented and classified ROIs |
| Step 5: Annotate | The user can then create new annotations by drawing a ROI with one of several drawing tools (rectangle, ellipse, freehand, etc.) |
| Step 6: Search within WSI | The user can then search for similar patches within the same WSI. When a ROI is selected, the system retrieves similar patches from the same image at the same scale. The user can click on the results to navigate to the relevant section of the WSI for further inspection |
| Step 7: Retrieval interface | The user can also decide to click on a link to open the retrieval interface, allowing to perform a search of similar patches contained in other images. Two datasets are available in the current prototype (see section “datasets”) |
| Step 8: PubMed central | The user can search for similar patches contained in scientific articles and navigate to those articles by following a link |
| Step 9: ContextVision AB | The user can search for similar patches contained in WSIs of the same dataset and navigate to the retrieved patch in the viewer |
ROIs: Regions of Interest, WSIs: Whole slide images, AB: Aktiebolag
User interface
This section presents an overview of the user interface that was developed and it details each function. The main user interface, as shown in Figure 3, can be split into three principal areas:
Figure 3.
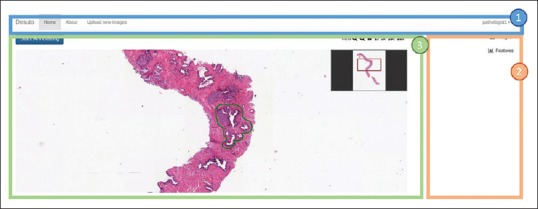
Overview of the main user interface. The three following sections are highlighted: (1) The navigation bar, (2) the database/feature selection panel and annotation edition zone and (3) the main viewer container
The navigation bar provides access to the various pages of the interface, including the homepage, a page with more information about the platform and a page allowing authorized users to upload new images to the platform
The database/feature selection and annotation edition zone allows switching between images contained in different datasets, as well as selecting feature overlays to display on top of an image (see section “Visual Feature Selection” below). In the same space, the annotation edition zone appears, as detailed in Figure 4
The viewer is the main section where users can interact with images, zoom in and out quickly, create and edit annotations.
Figure 4.

Annotation edition zone. From left to right: Annotation description textbox, region characteristics and region preview
Visual feature selection
One of the developed functions is the ability to activate feature overlays to superimpose visual information on top of the WSI, aiming to help pathologists with identifying ROIs that warrant closer inspection more easily, for example, regions with the highest cancer grades. An example of a feature overlay using a clustering algorithm is shown in Figure 5. The opacity of the feature overlay can be adjusted by the user.
Figure 5.
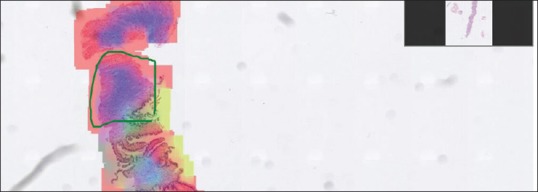
Coloured feature overlay of several types of computed features
Image viewer
The OpenSeaDragon viewer provides several functions and plugins, detailed below and shown in Figure 6:
Figure 6.
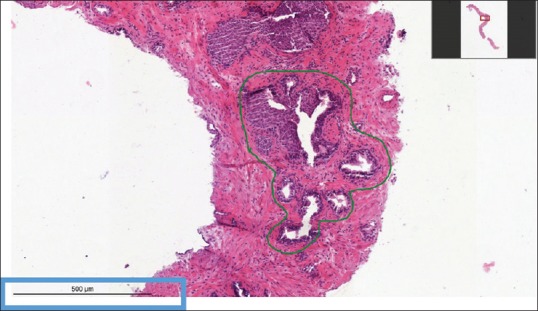
Image viewer showing a zoomed in portion of a whole slide image. Top right corner: the viewport navigator. Bottom left corner: the scalebar
The smooth zooming and panning with dynamic loading of image tiles from the IIPImage server
The viewport navigator [top right corner of the viewer in Figure 6] that shows the position of the currently shown portion of the image within the whole slide
The scalebar plugin that shows a customizable scalebar [bottom left corner in Figure 6]. The correct scale is computed using pixel size information extracted from the WSI with OpenSlide.
Annotation tool
A layer allowing to draw annotations (with the help of the SVG-Edit drawing library) using several shapes is superimposed on top of the image viewer. Several drawing tools are provided, allowing pathologists to highlight areas of any shape, including lines, rectangles, ellipses, and freehand drawings. In addition, a dropdown list is provided for indicating the severity of the selected region (based on the Gleason grading system in the example shown). Each major group of Gleason grades has a different color, allowing pathologists to quickly find severe regions that were annotated in the past. These tools are illustrated in Figure 7.
Figure 7.
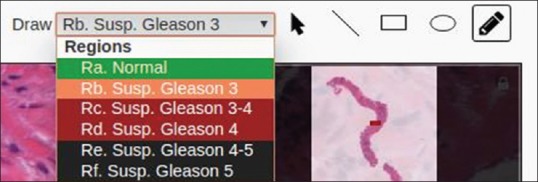
Drawing tool selection. From left to right: region severity dropdown list, selection tool, line tool, rectangle tool, ellipse tool and freehand drawing tool
Once a shape is drawn, it can be edited directly. Furthermore, any shape can be selected using the selection tool [arrow icon in Figure 7]. Selected shapes can be resized, rotated, and moved easily.
When a single annotation is selected, a textbox allows to write a description of the region. In addition, characteristics of the region (the size in millimeters for example) and a preview of the selected region, based on a rectangular bounding box are shown [Figure 4].
Two more functions can be found in the same zone below the preview. The first is a link that opens the retrieval system interface, allowing pathologists to search for similar regions in other images, within the same or a different dataset. The second is a list showing similar patches found within the currently displayed image [Figure 8].
Figure 8.
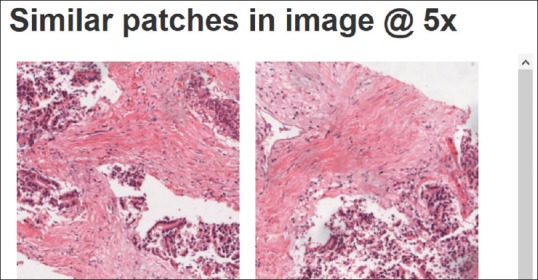
List of similar patches found within the same whole slide image
Retrieval interface
The retrieval interface is tightly integrated with the viewer and opens in a popup window when the “Search for similar images” link is clicked in the annotation zone of a selected region. It is composed of the following two main sections [Figure 9]:
Figure 9.
Retrieval interface. Query images on the left, results list on the right. The Gleason grade of results is shown when a patch has a Gleason annotation (example shown with a blue box)
The query section contains a list of relevant query images and/or keywords
The results list shows the retrieved results.
It is flexible and supports multiple search modalities and options:
CBIR: By default, the region selected in the viewer appears in the “Relevant images” column in the retrieval interface, and visually similar patches are retrieved from the selected dataset. Any of the retrieved results can be dragged to the same column, in order to refine the search. Various distance/similarity measures provided by ParaDISE (Euclidean distance, Canberra distance, Histogram Intersection, and Cosine similarity) are supported for the visual comparison of images[29]
Text-based retrieval: If text information regarding the query images or the search results (e.g., figure captions) is available, it is possible to add text search terms (keyword search). This is the case for the PubMed Central dataset, where each image has an associated caption that can be used for retrieval, using keywords or a combination of visual and text retrieval [Figure 10]
Dataset and magnification options: The user can choose among the available datasets (e.g. ContextVision AB, PubmedCentral), magnification levels and visual features used for the retrieval.
Figure 10.
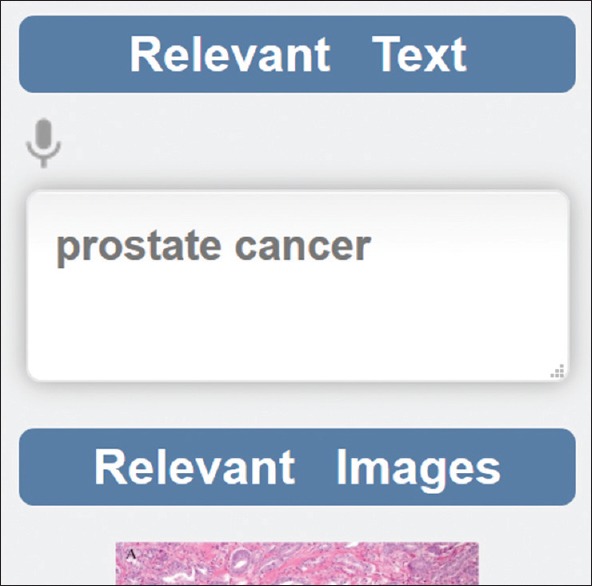
Keyword input for text search in the retrieval interface
Once the results list is displayed, the user can click on a result to see a more detailed view. The exact information shown depends on the type of dataset used.
In the case of a WSI dataset, the selected patch is shown in its parent image, highlighted with a square to help users understand in which context a given patch is located. From there, users can also link back to the viewer, opening the currently shown image (centered on the highlighted patch) for further inspection.
If the dataset is a repository of figures with captions (e.g., the PubMed Central database), the result is displayed alongside basic image editing tools for modifying contrast and brightness. Furthermore, a link to the article containing the image is shown under the image, as well as the image caption [Figure 11]. The automatically extracted image modality is shown as a four-letter code following an ad hoc image type classification hierarchy.[30]
Figure 11.
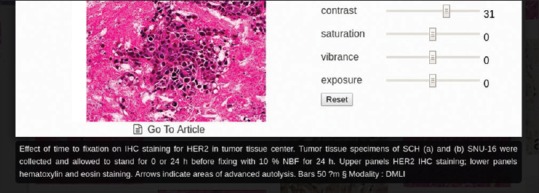
Visualization of a retrieved image with its associated caption
Backend and image processing pipeline
This section explores the various processes and features that were implemented in the backend of the platform.
Image processing
Currently, the process of including new images in the platform is split into two processes:
Uploading and converting WSIs to make them available for viewing and annotating
Extracting patches from WSIs, indexing their visual features, and making them available for retrieval.
The first process is largely automated, as illustrated in Figure 12. The process consists of three steps:
Figure 12.
Whole slide image upload and processing pipeline
A user imports a WSI file using the web interface
Once the image is successfully uploaded, the VIPS tool is automatically started, converting the image to a pyramidal format that can be used by the IIPImage server (when necessary). This process typically takes around 4–5 min, even for very large images (e.g., ~20GB, ~80,000 × 80,000 pixels)
The file can then be accessed by the OpenSeaDragon viewer using the DeepZoom image protocol.
The second process currently requires several manual steps:
The patch extraction process consists of two steps, depending on whether the WSI has manual segmentations or not. When there are manual annotations, a Python script (using the “scikit,” “Pillow,” and “openslide” libraries) is run to compute the overlap of the segmentation with the annotated areas and then extract nonoverlapping patches. When there are no annotations, a uniform extraction of patches is performed over the entire WSI. An upper bound of 2000 patches per WSI was set due to storage constraints. An important factor that affects the quality of the results is the quality of the annotations made by the pathologists, as some of them draw very precise areas and others mark only a rough region consisting of several classes and background
For each magnification level, sets of visual features can be extracted. This is done through a call to the ParaDISE indexer that supports several built-in handcrafted unsupervised descriptors (e.g., Colour and Edge Directivity Descriptor, Fuzzy Colour and Texture Histogram, Bag of Visual Words). In our system, DL features generated by several deep architectures are extracted as well, using the Keras (http://keras.io, as of October 25, 2018) DL framework and several patch magnifications to enforce that the network learns features at several levels of magnification
The user interface is updated with the new dataset/magnification levels.
Experimental evaluation
This section presents the datasets currently available in the prototype, as well as qualitative and quantitative evaluations of the system. They were performed through a user test with pathologists and measuring the retrieval performance. Evaluating a content-based retrieval system consists of the following two main parts: the qualitative evaluation (targeting interface usability, user experience, and speed of the system) and the quantitative evaluation (targeting the retrieval performance itself, i.e., how good the system is to retrieve relevant images from the database).
Datasets
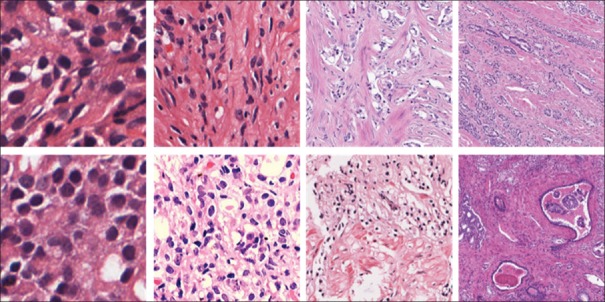
The main dataset used is a proprietary database of ContextVision AB (CVDB), including 112 WSIs of the prostate that were uploaded to the viewer with ROIs of healthy tissue (manually annotated by two pathologists) and Gleason patterns graded from three to five according to the Gleason grading system.[31,32] This dataset highlights the capability of the retrieval system to manage proprietary datasets (such as the ones owned by research groups or clinical pathology departments). Since some of the annotations were in disagreement at the moment of writing the manuscript, we did not evaluate our system at the Gleason level but just at the healthy tissue versus tissue containing an annotated Gleason pattern. One of the goals was to evaluate the ability of the system to retrieve similar patterns in the WSI database given a query. Such patterns can arise at different magnification levels, for example, a mitotic cell is better observed at ×40 magnification, whereas a Gland pattern can be seen in any magnification from ×5 to ×10 and cell characteristics are barely visible at such low magnifications. This poses an important computational limitation because if the user is interested in doing an exhaustive search of all the patterns at a high magnification, millions of patches must be extracted. In our experiments, we limited the extraction to an upper bound of 2000 patches per WSI for all the magnifications, extracting patches from the annotated areas when available. Patches at distinct levels of magnification were extracted from the pyramidal content of the WSI to account for the scale-specific nature of some of the patterns. Besides this, state-of-the-art DL networks applied in histopathology have shown that learning the scale of a given histopathology image patch is feasible and that including patches from multiple scales improves the performance of classification tasks.[33,34] Using the openslide library, ×5, ×10, ×20, and × 40 magnification patches were extracted from manually annotated ROIs [Table 3 and Figure 13]. For each of the patches, both handcrafted Color and Edge Directivity Descriptor (CEDD)[35] and DL features were extracted.
Table 3.
Number of patches per magnification used in each partition
| Partition/magnification | ×5 | ×10 | ×20 | ×40 |
|---|---|---|---|---|
| Train | 1925H-1205G | 3730H-8300G | 15644H-23985G | 20700H-7425G |
| Test | 825H-517G | 1599H-3557G | 6705H-10280G | 8872H-3182G |
| Total | 2750H-1722G | 5329H-11857G | 22349H-34264G | 29572H-10607G |
H stands for patches extracted from healthy ROIs and G for patches with some Gleason grades. In total, our dataset consists of 118,450 patches: 82,913 for training/validation and 35,537 for testing. ROIs: Regions of interest
Figure 13.
Patches from the CVDB dataset at whole slide image levels zero, one, two, and three (×40, ×20, ×10 and × 5). Top row: Patches from healthy regions of interest; bottom row: Patches from regions of interest with Gleason patterns greater or equal to three
The second dataset used for the validation is a subset of images from the PubMed Central dataset of biomedical open access literature. Images of the dataset were automatically classified as “light microscopy” images.[29] This second dataset has very different characteristics, as it is not composed of WSIs (with patches extracted at various magnification levels), but rather of figures extracted from articles contained in a variety of medical journals. The data has the added benefit of including a caption for each figure, enabling text-based search. It includes around 240,000 images. This dataset highlights the capability of the retrieval system to manage publicly available collections of data, characterized by extremely high variability in scale and color.
Deep learning model and features indexing
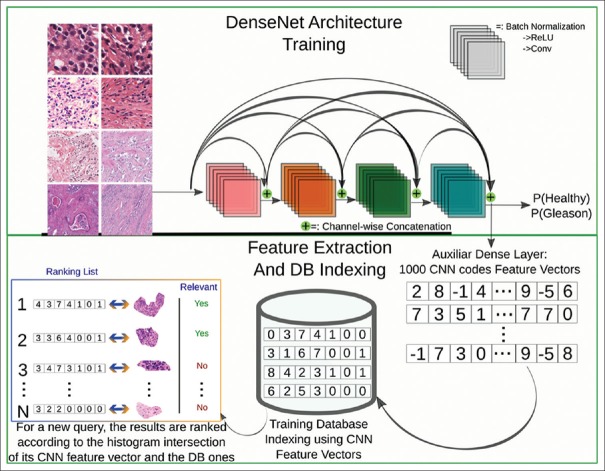
For leveraging the discriminative power of DL models in our system, we trained a state-of-the-art architecture, the DenseNet model[36] that has a dense connectivity pattern among its layers. DenseNet introduces direct connections between any two subsequent layers with the same feature map size. The main advantage of DenseNet over other very deep architectures is that it reuses information at multiple levels without drastically increasing the number of parameters in the model, particularly with the inclusion of bottleneck and compression layers. The bottleneck layer applies a 1 × 1 convolution just before each 3 × 3 convolution to reduce the number of input feature maps. The compression layer uses a fraction of the feature maps in each transition layer. The details of the DenseNet architecture trained are:
DenseNet-BC 121: We chose the 121-layer variation of DenseNet with seven million parameters and performed experiments fine-tuning all the layers from pre-trained ImageNet weights
The network was optimized to minimize the binary cross-entropy (healthy vs. cancer patches) using the Adam method with initial learning rates explored logarithmically between 0.01 and 10 − 7. The best learning rate was found to be 0.001
We implemented the architecture using the Keras DL framework with the TensorFlow backend. The training was set to five epochs; nevertheless, an early convergence after two to three epochs was observed
The training of the models took from 2–3 h using a Nvidia Titan Xp Graphics Processing Unit
The dataset used for learning the model was the CVDB. We trained with 70% of the training patches and validated with the remaining 30%. The retrieval performance is then computed using the test data. All the patches from a single WSI are kept in the same partition (training/validation/test) to avoid bias.
Once the network is trained, an auxiliary layer shown in Figure 14 is added, to account for the fact that the retrieval system computes similarities based on feature vectors. It is thus necessary to extract feature vectors instead of having a probability of cancer/no cancer as output. The auxiliary layer is a dense layer which extracts 1000-dimensional feature vectors. After the feature vectors of all the patches are extracted, an index is built for each magnification level and then included in the ParaDISE retrieval engine.
Figure 14.
Schema of the deep learning model training and the subsequent feature extraction to index the database
Retrieval performance
For assessing the retrieval performance of our system, the following standard evaluation metrics were selected: mean average precision (MAP), geometric MAP, precision after ten patches retrieved (P10), and precision after 30 patches retrieved (P30). Precision-recall graphs also show the performance in a graphical way.
We report these performance metrics that are common measures in the assessment of retrieval systems, also for image retrieval, and that assess different aspects of the system. This evaluation purely analyses the algorithm performance in a standard way. The user tests described below perform a qualitative evaluation of the user interface that also includes the retrieval quality.
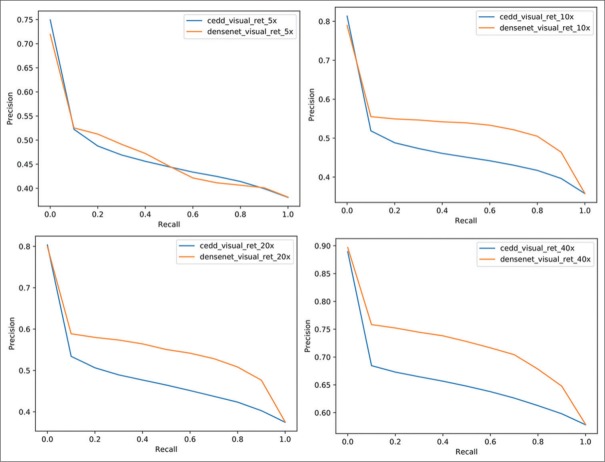
As shown in Figure 15, the precision-recall graphs for both DL and CEDD features are compared. As shown in other articles,[7] the deep learning-based representations outperform handcrafted features such as CEDD in digital pathology tasks.
Figure 15.
Precision-Recall graph of the retrieval performance using visual features extracted with the DenseNet architecture (orange line) and the Color and Edge Directivity Descriptor features (blue line) in four magnification levels. The DenseNet features are systematically leading to slightly higher results
Instead of computing the performance on a WSI basis, the reported measures are at a patch level, as there are several annotated areas in a WSI, which makes it hard to assign a single label to compare relevance with another WSI in the database. The number of patches evaluated was not exhaustive as this would result in a massive number of 35,539 × 82,925 = 2,947,071,575 entries (~40GB). We uniformly sampled 10% of the training patches and 50% of the testing patches to have an estimation of the quantitative performance of our system, i.e., 8292 training patches and 17,769 testing patches. Even with this small sample, the computation of the ranking matrix took ~18 h, since computing the histogram intersection for such a large number of samples incurs in a high computational cost. The performance measures are shown in Table 4.
Table 4.
Performance measures computed with trec_eval software for the deep learning based features
| Performance measure | Value |
|---|---|
| MAP | 0.2573 |
| GM-MAP | 0.2572 |
| Rprec | 0.2331 |
| bpref | 0.4889 |
| P@10 | 0.2507 |
| P@15 | 0.2312 |
MAP: Mean average precision, GM-MAP: Geometric mean average precision
An interesting measure is P@10 (0.2507) that can easily be interpreted: On average, 2.5 retrieved patches in the first ten retrieved patches are relevant or in this case of the same Gleason pattern. Sometimes also similar patterns and not only the same can be relevant in the differential diagnosis, so the chosen relevance criterion of considering only the exact same Gleason pattern is very strict. The other measures also show that the general performance of the system is good.
User tests
The interface of the system was evaluated qualitatively by two senior pathologists (P1 and P2) who interacted with the system through a series of five tasks:
-
Open the WSI number 1, mark a gland region and search for similar results in the WSI database.
P1: Pathologist 1 remarked the ease of use of the interface but that the results can be improved, suggesting that training with more powerful features in larger datasets should be performed.
P2: Pathologist 2 pointed out that the results are not all relevant – some results are benign for malignant queries. Despite this, he remarked the large collection of relevant patches and that results take you to directly to the WSI image to which it belongs. He said that the results quality needs to be improved, possibly through a larger data set with annotated areas.
-
Open a WSI, mark an area of inflammation, search in the PubMed Central database.
P1: Pathologist 1 pointed out the ease of use of the interface and that the PubMed Central images included results from monkeys and rats, which are not of interest for clinical use when compared to humans. This aspect was improved subsequently using the MeSH terms attached to the articles for filtering out animal tissue.
P2: Pathologist 2 said that the articles found were not all relevant to the prostate cases he searched with. He liked the easiness for starting the query and opening the articles. He said that the retrieved articles could be better focused.
-
Open a WSI, mark a Gleason 4 cribriform area and search for similar results in the WSI database.
P1: Pathologist 1 remarked that the results were sufficiently good and that it would be nice to have a split screen with “side-by-side” view of the images. The high incidence of good results may be related to the high incidence of Gleason 4 cribriform areas within the ContextVision database (i.e., otherwise very small), which allows good retrieval results.
P2: Pathologist 2 liked the fact that the more specific you are with your annotation, the more relevant images were found and that the interface is easy to use. He remarked again the need for including a larger number of relevant images in the database.
-
Open a WSI, mark a Gleason 4 cribriform area and search for similar results in the PubMed Central database.
P1: Pathologist 1 pointed out that the quality of the results is not optimal for use in research or clinical practice, which suggests that more work needs to be done to extract and filter valuable information in the PubMed Central database (which was done after the end of the user tests leading to an improvement in retrieved results).
P2: Pathologist 2 mentioned that showing the caption of the article with the image would be useful. He liked the speed of the search and that the interface was easy to use. Finally, he commented on the relevance of the results and insisted to include a larger number of relevant articles.
-
Free Interaction with the system.
P1: Several points were mentioned:
- The system should include a larger database, as it only included few WSIs at the time of the tests
- The tool can be helpful in the daily job of general pathologists and residents
- The speed of the system was considered good for research use but possibly slightly slow for clinical use
- The system was considered useful for finding patterns in radical prostatectomie
- The magnification at which the search was performed had an impact on the quality and the type of the results retrieved.
P2: The following was given as feedback:
- The system is useful but needs more images to make it even more powerful
- The most useful functionality is the ability to refine the search with relevance feedback and find images in the PubMed Central database
- The principal improvement was considered to be a larger data set to have more relevant cases.
DISCUSSION
This article describes the concept, the first implementation, and test of a web-based digital pathology retrieval system that provides an interactive visualization and the possibility to perform visual similarity retrieval in proprietary WSIs and publicly available datasets of the biomedical literature. The retrieval system is based on automatically extracted hand-crafted and DL-based visual features. The retrieval is possible with text, as content-based visual retrieval and a combination of the two. This approach allows to include hospital archives where no annotations exist, as well as image datasets with additional data such as text. Unlike most other pathology viewers, features generated with a convolutional neural network trained and fine-tuned on pathology images are used for the integrated retrieval. The method uses manually annotated regions for training. However, once trained, the model can also be used on large nonannotated data sets, for which manual annotations can be too time-consuming and expensive (e.g., digital pathology repositories in hospital).
The system was tested on two strongly differing databases (in this paper, using a proprietary dataset of WSIs and the PubMed Central dataset). The platform was tested using prostate cancer biopsies, although it can easily be extended to other cellular and tissue samples. The use of proprietary datasets allows clinical departments and scientific research groups to develop their own resources to guide difficult diagnoses or train students. The use of publicly available datasets, such as the PubMed Central data allows pathologists to benefit from the increasing number of images in the biomedical literature that are available. The proposed retrieval system could be particularly helpful when dealing with rare patterns and it allows to save time in comparison to searching in books.
A user test with two pathologists was performed to have feedback already in an early development stage by potential users of the platform. The overall impression of the interface was very positive, particularly the speed and the user-friendly interaction of the different functions in the platform were mentioned. Comments were made regarding the retrieval quality and the limited number of available images: the version of the system described here was already improved in terms of retrieval results and amount of indexed data, integrating the comments of both pathologists. Further fine-tuning of the retrieval results was performed and should ease the integration into clinical workflows.
An online video demonstration of the platform is available at the following link: https://youtu.be/uwIezxabiaw (as of November 20, 2018).
CONCLUSIONS
Interactive systems equipped with AI-based models may change the current work in histopathology. Thanks to the recent approval that digital histopathology can also be billed in the US, new systems for slide storage, analysis and retrieval can be used for diagnosis and not only for research. Image retrieval on histopathology data is a solution that can enhance the usage of AI resources according to the pathologists' experience and requirements.
The developed retrieval prototype enables the viewing of WSIs and the search for images similar to manually defined ROIs in diverse data sources, including proprietary and public datasets. The presented results and user tests show that visual retrieval is possible, even with extremely large WSIs. The proposed solution aims to reduce the pathologists' workload while increasing the reproducibility of their assessment on digitally scanned tissue slides. The technical implementation is based on the combination of open source solutions, thus helping the scientific community to test, develop improved similar systems for research and clinical practice. Further improvements to the system should be studied to introduce this tool into the clinical workflow and facilitate the diagnostic process.
Financial support and sponsorship
This work was partially supported by the Eurostars project E! 9653 SLDESUTO-BOX and by Nvidia. This project has received funding from the European Union's Horizon 2020 research and innovation programme under grant agreement No 825292. Otálora thanks Colciencias through the call 756 for PhD studies.
Conflicts of interest
There are no conflicts of interest.
Acknowledgments
Thanks to ContextVision for their support throughout the project.
Footnotes
Available FREE in open access from: http://www.jpathinformatics.org/text.asp?2019/10/1/19/261955.
REFERENCES
- 1.Gurcan MN, Boucheron LE, Can A, Madabhushi A, Rajpoot NM, Yener B. Histopathological image analysis: A review. IEEE Rev Biomed Eng. 2009;2:147–71. doi: 10.1109/RBME.2009.2034865. [DOI] [PMC free article] [PubMed] [Google Scholar]
- 2.Rubin R, Strayer DS, Rubin E, McDonald JM. Rubin's Pathology: Clinicopathologic Foundations of Medicine. Philadelphia: Lippincott Williams & Wilkins; 2008. [Google Scholar]
- 3.Weinstein RS, Graham AR, Richter LC, Barker GP, Krupinski EA, Lopez AM, et al. Overview of telepathology, virtual microscopy, and whole slide imaging: Prospects for the future. Hum Pathol. 2009;40:1057–69. doi: 10.1016/j.humpath.2009.04.006. [DOI] [PubMed] [Google Scholar]
- 4.Ho J, Parwani AV, Jukic DM, Yagi Y, Anthony L, Gilbertson JR. Use of whole slide imaging in surgical pathology quality assurance: Design and pilot validation studies. Hum Pathol. 2006;37:322–31. doi: 10.1016/j.humpath.2005.11.005. [DOI] [PubMed] [Google Scholar]
- 5.Fraggetta F, Garozzo S, Zannoni GF, Pantanowitz L, Rossi ED. Routine digital pathology workflow: The Catania experience. J Pathol Inform. 2017;8:51. doi: 10.4103/jpi.jpi_58_17. [DOI] [PMC free article] [PubMed] [Google Scholar]
- 6.Cheung CC, Torlakovic EE, Chow H, Snover DC, Asa SL. Modeling complexity in pathologist workload measurement: The automatable activity-based approach to complexity unit scoring (AABACUS) Mod Pathol. 2015;28:324–39. doi: 10.1038/modpathol.2014.123. [DOI] [PubMed] [Google Scholar]
- 7.Jimenez-del-Toro O, Otálora S, Andersson M, Eurén K, Hedlund M, Rousson M, et al. Biomedical Texture Analysis. Ch. 10. Cambridge: Academic Press; 2017. Analysis of Histopathology Images: From Traditional Machine Learning to Deep Learning; pp. 281–314. [Google Scholar]
- 8.Jimenez-del-Toro O, Otálora S, Atzori M, Müller H. Patch-Based Techniques in Medical Imaging. Cham: Springer; 2017. Deep Multimodal Case – Based Retrieval for Large Histopathology Datasets; pp. 149–57. [Google Scholar]
- 9.Schaer R, Müller H. A Modern Web Interface for Medical Image Retrieval. Basel: Swiss Med Inform; 2014. p. 30. [Google Scholar]
- 10.Jimenez-del-Toro O, Hanbury A, Langs G, Foncubierta-Rodríguez A, Müller H. Multimodal Retrieval in the Medical Domain. Cham: Springer; 2015. Overview of the VISCERAL Retrieval Benchmark 2015; pp. 115–23. [Google Scholar]
- 11.Caicedo JC, Vanegas JA, Páez F, González FA. Histology image search using multimodal fusion. J Biomed Inform. 2014;51:114–28. doi: 10.1016/j.jbi.2014.04.016. [DOI] [PubMed] [Google Scholar]
- 12.Doyle S, Hwang M, Naik S, Feldman MD, Tomaszewski JE, Madabhushi A. Using Manifold Learning for Content-Based Image Retrieval of Prostate Histopathology. Workshop on Content-Based Image Retrieval for Biomedical Image Archives (in conjunction with MICCAI) 2007:53–62. [Google Scholar]
- 13.Zhang X, Liu W, Zhang S. Mining histopathological images via hashing-based scalable image retrieval. 2014 IEEE 11th International Symposium on Biomedical Imaging (ISBI) 2014:1111–4. [Google Scholar]
- 14.Zhang X, Liu W, Dundar M, Badve S, Zhang S. Towards large-scale histopathological image analysis: Hashing-based image retrieval. IEEE Trans Med Imaging. 2015;34:496–506. doi: 10.1109/TMI.2014.2361481. [DOI] [PubMed] [Google Scholar]
- 15.Qi X, Wang D, Rodero I, Diaz-Montes J, Gensure RH, Xing F, et al. Content-based histopathology image retrieval using CometCloud. BMC Bioinformatics. 2014;15:287. doi: 10.1186/1471-2105-15-287. [DOI] [PMC free article] [PubMed] [Google Scholar]
- 16.Jimenez-del-Toro O, Atzori M, Otálora S, Andersson M, Eurén K, Hedlund M, et al. Convolutional neural networks for an automatic classification of prostate tissue slides with high-grade Gleason score. Medical Imaging 2017: Digital Pathology. International Society for Optics and Photonics. 2017:10140. [Google Scholar]
- 17.Marée R, Rollus L, Stévens B, Hoyoux R, Louppe G, Vandaele R, et al. Collaborative analysis of multi-gigapixel imaging data using cytomine. Bioinformatics. 2016;32:1395–401. doi: 10.1093/bioinformatics/btw013. [DOI] [PMC free article] [PubMed] [Google Scholar]
- 18.Carpenter AE, Jones TR, Lamprecht MR, Clarke C, Kang IH, Friman O, et al. CellProfiler: Image analysis software for identifying and quantifying cell phenotypes. Genome Biol. 2006;7:R100. doi: 10.1186/gb-2006-7-10-r100. [DOI] [PMC free article] [PubMed] [Google Scholar]
- 19.Kvilekval K, Fedorov D, Obara B, Singh A, Manjunath BS. Bisque: A platform for bioimage analysis and management. Bioinformatics. 2010;26:544–52. doi: 10.1093/bioinformatics/btp699. [DOI] [PubMed] [Google Scholar]
- 20.Saalfeld S, Cardona A, Hartenstein V, Tomancak P. CATMAID: Collaborative annotation toolkit for massive amounts of image data. Bioinformatics. 2009;25:1984–6. doi: 10.1093/bioinformatics/btp266. [DOI] [PMC free article] [PubMed] [Google Scholar]
- 21.Martel AL, Hosseinzadeh D, Senaras C, Zhou Y, Yazdanpanah A, Shojaii R, et al. An image analysis resource for cancer research: PIIP-pathology image informatics platform for visualization, analysis, and management. Cancer Res. 2017;77:e83–e86. doi: 10.1158/0008-5472.CAN-17-0323. [DOI] [PMC free article] [PubMed] [Google Scholar]
- 22.Sommer C, Straehle C, Köthe U, Hamprecht FA. Ilastik: Interactive Learning and Segmentation Toolkit. 2011 IEEE International Symposium on Biomedical Imaging: From Nano to Macro. 2011:230–3. [Google Scholar]
- 23.de Chaumont F, Dallongeville S, Chenouard N, Hervé N, Pop S, Provoost T, et al. Icy: An open bioimage informatics platform for extended reproducible research. Nat Methods. 2012;9:690–6. doi: 10.1038/nmeth.2075. [DOI] [PubMed] [Google Scholar]
- 24.Schindelin J, Arganda-Carreras I, Frise E, Kaynig V, Longair M, Pietzsch T, et al. Fiji: An open-source platform for biological-image analysis. Nat Methods. 2012;9:676–82. doi: 10.1038/nmeth.2019. [DOI] [PMC free article] [PubMed] [Google Scholar]
- 25.Allan C, Burel JM, Moore J, Blackburn C, Linkert M, Loynton S, et al. OMERO: Flexible, model-driven data management for experimental biology. Nat Methods. 2012;9:245–53. doi: 10.1038/nmeth.1896. [DOI] [PMC free article] [PubMed] [Google Scholar]
- 26.Pietzsch T, Saalfeld S, Preibisch S, Tomancak P. BigDataViewer: Visualization and processing for large image data sets. Nat Methods. 2015;12:481–3. doi: 10.1038/nmeth.3392. [DOI] [PubMed] [Google Scholar]
- 27.Komura D, Fukuta K, Tominaga K, Kawabe A, Koda H, Suzuki R, et al. Luigi: Large-scale histopathological image retrieval system using deep texture representations. bioRxiv. 2018:345785. [Google Scholar]
- 28.Jug F, Pietzsch T, Preibisch S, Tomancak P. Bioimage informatics in the context of drosophila research. Methods. 2014;68:60–73. doi: 10.1016/j.ymeth.2014.04.004. [DOI] [PubMed] [Google Scholar]
- 29.Markonis D, Schaer R, García Seco de Herrera A, Müller H. The Parallel Distributed Image Search Engine (ParaDISE) ArXiv170105596 Cs. 2017 [Google Scholar]
- 30.Müller H, Kalpathy-Cramer J, Demner-Fushman D, Antani S. Creating a classification of image types in the medical literature for visual categorization. Medical Imaging 2012: Advanced PACS-based Imaging Informatics and Therapeutic Applications. 2012;8319:83190P. [Google Scholar]
- 31.Delahunt B, Miller RJ, Srigley JR, Evans AJ, Samaratunga H. Gleason grading: Past, present and future. Histopathology. 2012;60:75–86. doi: 10.1111/j.1365-2559.2011.04003.x. [DOI] [PubMed] [Google Scholar]
- 32.Epstein JI, Allsbrook WC, Jr, Amin MB, Egevad LL ISUP Grading Committee. The 2005 International Society of Urological Pathology (ISUP) consensus conference on Gleason grading of prostatic carcinoma. Am J Surg Pathol. 2005;29:1228–42. doi: 10.1097/01.pas.0000173646.99337.b1. [DOI] [PubMed] [Google Scholar]
- 33.Liu Y, Gadepalli K, Norouzi M, Dahl GE, Kohlberger T, Boyko A, et al. Detecting Cancer Metastases on Gigapixel Pathology Images. ArXiv170302442 Cs. 2017 [Google Scholar]
- 34.Otálora S, Atzori M, Andrearczyk V, Müller H. Proceedings of the First International Workshop, COMPAY 2018, and 5th International Workshop, OMIA 2018, Held in Conjunction with MICCAI 2018; 2018 September 16-20. Granada, Spain. Cham: Springer International Publishing; 2018. Image Magnification Regression Using DenseNet for Exploiting Histopathology Open Access Content. Computational Pathology and Ophthalmic Medical Image Analysis; pp. 148–55. [Google Scholar]
- 35.Chatzichristofis SA, Boutalis YS. Proceedings of the 6th International Conference on Computer Vision Systems. 2008 May 12-15. Santorini, Greece. Berlin: Springer-Verlag; 2008. CEDD: Color and Edge Directivity Descriptor: A Compact Descriptor for Image Indexing and Retrieval; pp. 312–22. [Google Scholar]
- 36.Huang G, Liu Z, van der Maaten L, Weinberger KQ. Densely Connected Convolutional Networks. ArXiv160806993 Cs. 2016 [Google Scholar]


