Abstract
Protein turnover is a tightly controlled process that is crucial for the removal of aberrant polypeptides and for cellular signalling. Whereas ubiquitin marks eukaryotic proteins for proteasomal degradation, a general tagging system for the equivalent bacterial Clp proteases is not known. Here we describe the targeting mechanism of the ClpC–ClpP proteolytic complex from Bacillus subtilis. Quantitative affinity proteomics using a ClpP-trapping mutant show that proteins phosphorylated on arginine residues are selectively targeted to ClpC–ClpP. In vitro reconstitution experiments demonstrate that arginine phosphorylation by the McsB kinase is required and sufficient for the degradation of substrate proteins. The docking site for phosphoarginine is located in the amino-terminal domain of the ClpC ATPase, as resolved at high resolution in a co-crystal structure. Together, our data demonstrate that phosphoarginine functions as a bona fide degradation tag for the ClpC–ClpP protease. This system, which is widely distributed across Gram-positive bacteria, is functionally analogous to the eukaryotic ubiquitin–proteasome system.
Proteins destined for degradation are removed by energy-dependent proteases such as the eukaryotic proteasome or the bacterial Clp proteolytic complexes1. In these tightly regulated protein shredders, the proteolytic sites are sequestered within an inner chamber that is only accessible through axial entrance gates2. The gates are in turn guarded by regulatory AAA (ATPases associated with diverse cellular activities) complexes that are responsible for recognizing substrate proteins as well as for unfolding and translocating them into the protease cage3,4. In eukaryotes, substrate selection depends on a range of ubiquitin ligases that mark substrates with a polyubiquitin tag, a degradation signal recognized by the AAA regulatory particle of the 26S proteasome5,6. An analogous system involving the protein modifier Pup targets substrates to the eukaryotic-like core proteasome present in mycobacteria and closely related species7,8. However, it is not known whether the ATP-dependent Clp proteases, which are found in almost all bacteria, require a general post-translational tagging system. The Clp complexes are thought to use the N-terminal domains (NTD) of the AAA ATPases (ClpA, ClpC, ClpE or ClpX) to recognize specific degradation motifs, known as degrons, which are typically located at the N- or C-terminal ends of target proteins9–11. These degrons can also be introduced by the specialized SsrA tagging system, which is used for rescuing stalled ribosomes12. Alternatively, substrate recruitment may be aided by adaptor proteins that tether selected substrate proteins to the Clp proteolytic complex, thus facilitating their degradation9.
In B. subtilis and other Gram-positive bacteria, the ClpC–ClpP (ClpCP) protease, which is constituted by the AAA unfoldase ClpC and the protease ClpP, is an important proteolytic machine for eliminating unfolded and aggregated proteins. The ClpCP proteolytic complex is under the control of McsB, the founding member of a class of protein kinases targeting arginine residues13. First, McsB controls the amounts of ClpCP in the cell by phosphorylating and inhibiting the transcriptional repressor CtsR13–15, which in turn regulates clpC and clpP gene expression16. Second, McsB has been reported to function as an adaptor protein of ClpC by stimulating its ATPase activity and promoting degradation of the CstR substrate17,18. In addition to regulating CtsR and ClpC, McsB phosphorylates hundreds of diverse proteins in vivo, as revealed by B. subtilis phosphoproteomic analyses15,19. This promiscuous activity suggested a more general function of the protein arginine kinase in the stress response of Gram-positive bacteria.
ClpCP degrades pArg proteins in vivo
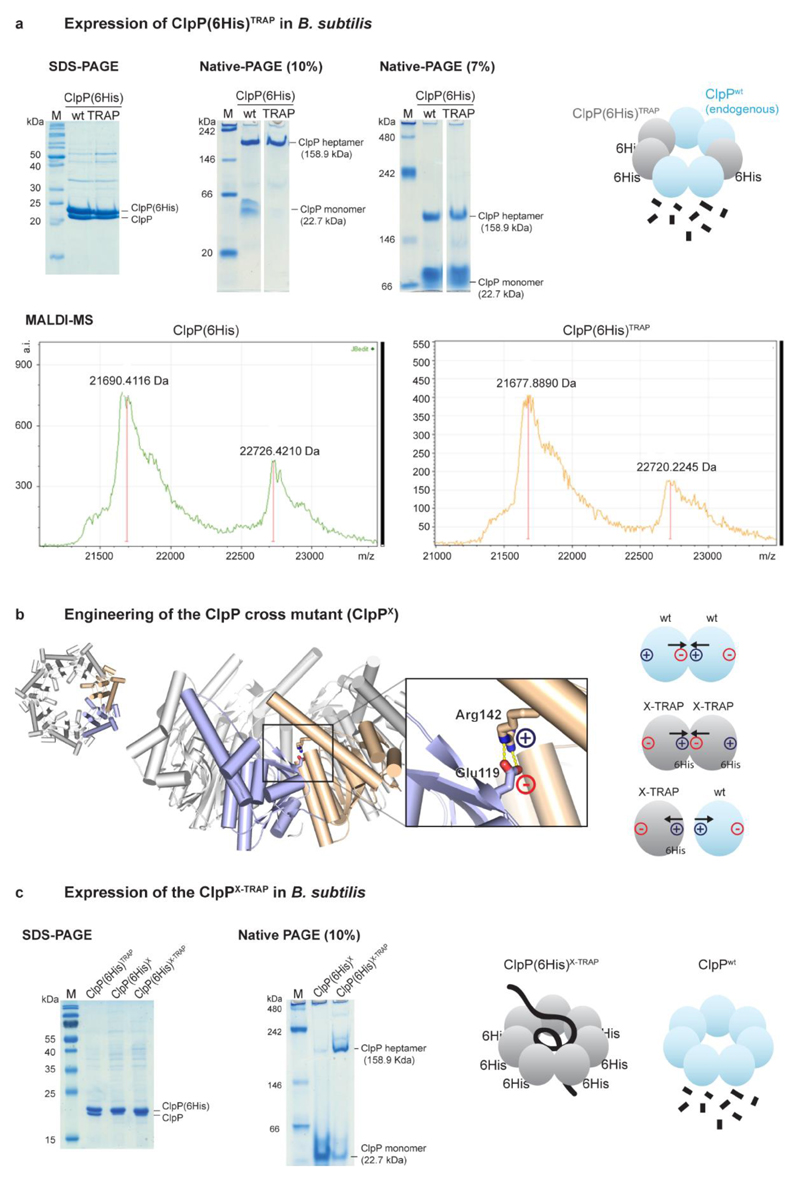
Arginine residues are frequently observed at molecular interfaces crucial for protein folding and assembly20. Therefore, arginine phosphorylation, resulting in a net-charge inversion, is predicted to have a strong effect on protein stability. Of note, the kinase catalysing this reaction, McsB, has many substrates in vivo and is transcriptionally co-regulated with ClpP, the major protease of B. subtilis. We thus proposed that arginine phosphorylation may have a direct role in the degradation of aberrant proteins. To test this assumption, we monitored the fate of phosphoarginine (pArg) proteins in vivo by expressing an inactive trapping variant of the ClpP protease (Ser98Ala, ClpPTRAP; refs 10,21).Substrates captured within the protease cage can be co-purified and analysed by mass spectrometry (MS). To perform the pull-down experiments in the wild-type B. subtilis background, we engineered a ClpP mutant that does not interact with the endogenous, active protease. For this purpose, we exchanged residues of an ion pair at the interface of the ClpP heptamer. The resulting cross mutant (Glu119Arg/Arg142Glu, ClpPX) did not form heterooligomers with wild-type ClpP, but maintained the ability to assemble a substrate-trapping cage (Extended Data Fig. 1).
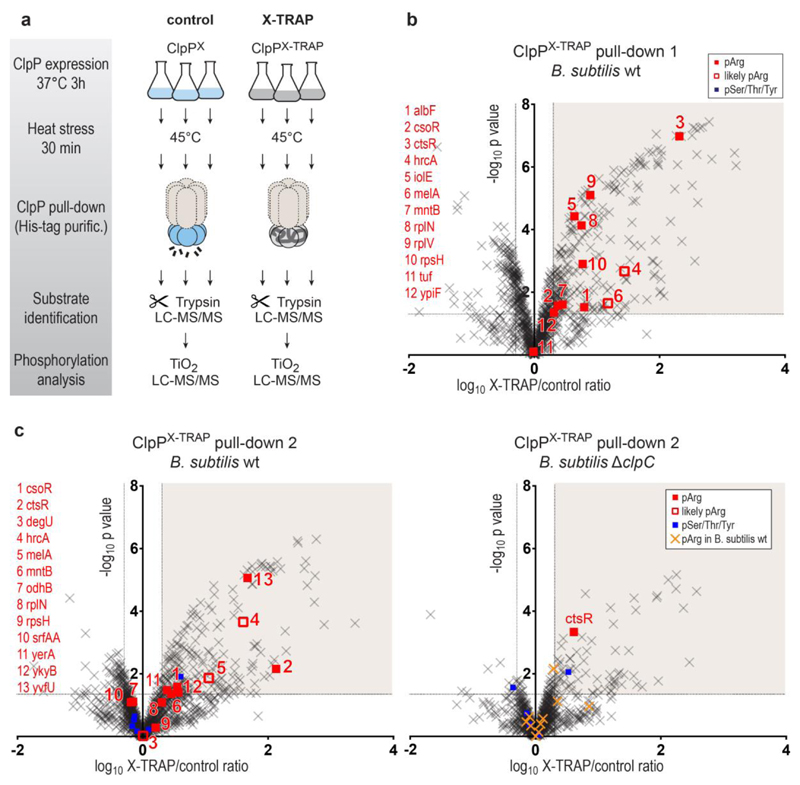
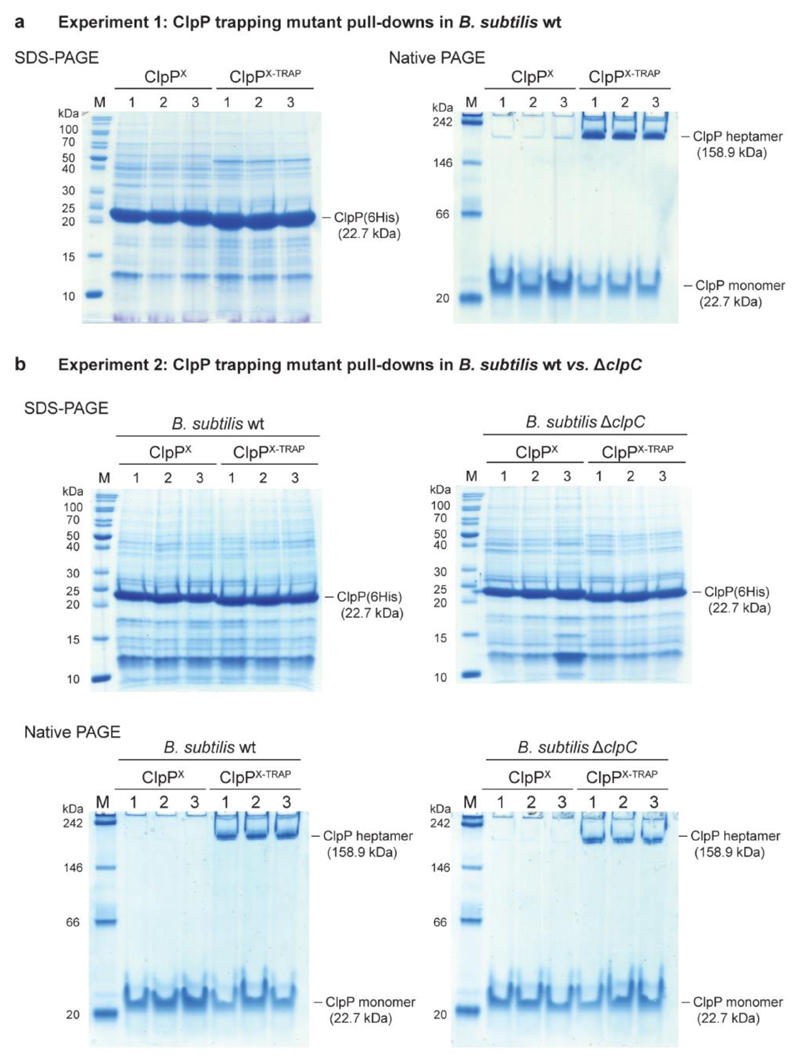
Quantitative MS analysis of ClpP pull-downs from heat-shocked bacteria (Extended Data Fig. 2a, b, strategy illustrated in Fig. 1a) revealed a large number of proteins that were specifically captured by the ClpPX-TRAP mutant (Fig. 1b and Supplementary Table 1). Despite the technical difficulties in identifying arginine phosphorylations15, we detected 13 pArg proteins among the 233 isolated ClpP substrates (Extended Data Table 1, Supplementary Table 2). Taking into account the functional connection between McsB and ClpC, which are found in the same operon, we next asked whether pArg proteins are transferred into the ClpP cage by ClpC. To this end, we performed ClpPX-TRAP pull-down analyses from wild-type and clpC knockout (ΔclpC) cells in parallel. Whereas we observed 14 pArg proteins in the pull-downs performed in wild-type cells, the pull-downs in ΔclpC cells revealed only a single pArg substrate (Fig. 1c, Extended Data Table 1). Of note, this substrate, CtsR, was also shown to be targeted to ClpP by the ClpX and ClpE unfoldases22,23. The almost complete absence of ClpP-trapped pArg proteins in ΔclpC bacteria is even more remarkable, as the deletion of ClpC increases the overall amounts of pArg proteins. Despite the presence of YwlE, a highly active arginine phosphatase preventing pArg identification in B. subtilis wild-type cells15,19,24, phosphoproteomics analysis of ΔclpC cell lysates revealed 25 pArg sites (Supplementary Table 3). This finding highlights the active role of ClpC in directing pArg proteins to ClpP-dependent proteolysis. Consistent with the proposed model, ΔclpP B. subtilis cell extracts also accumulated pArg proteins (Supplementary Table 4). To estimate the fraction of pArg proteins among the ClpP substrates, we analysed the overlap of the ClpP degradome (as defined by our pull-down experiments) and the pArg proteome (sites detected previously15,19,25 and in the ΔclpP mutant strain). Accordingly, 25% of the proteins degraded by ClpP are substrates of McsB and thus potential candidates of the pArg-dependent degradation pathway (see also Supplementary Discussion and Extended Data Fig. 2c).
Figure 1. Pull-down of ClpP trapping mutants.
a, Cartoon illustrating the experimental workflow. As indicated, all pull-down experiments were done in triplicates. LC–MS/MS, liquid chromatography tandem mass spectrometry. b, Volcano plot illustrating proteins identified in ClpPX (control) and ClpPX-TRAP pull-downs after expression in a B. subtilis wild-type (WT) strain. Proteins were considered as ClpP substrates (shaded area) when the X-TRAP/control relative protein intensity (x axis) was >2 and the corresponding limma P value (y axis) was <0.05. Phosphorylated proteins are shown as filled squares (red: pArg, blue: pSer/Thr/Tyr). In a few cases, the phosphorylated residue could not be unambiguously localized. As the same phosphopeptides have been observed to contain a pArg in previous experiments, they are labelled as probable pArg (open red squares). Identified pArg proteins are listed on the left. c, Volcano plots of the ClpP pull-downs performed in B. subtilis wild-type and ΔclpC strains in parallel. For comparison, pArg proteins identified in the B. subtilis wild-type pull-downs are marked in yellow/orange in the ΔclpC plot.
Protein phosphorylation stimulates ClpCP
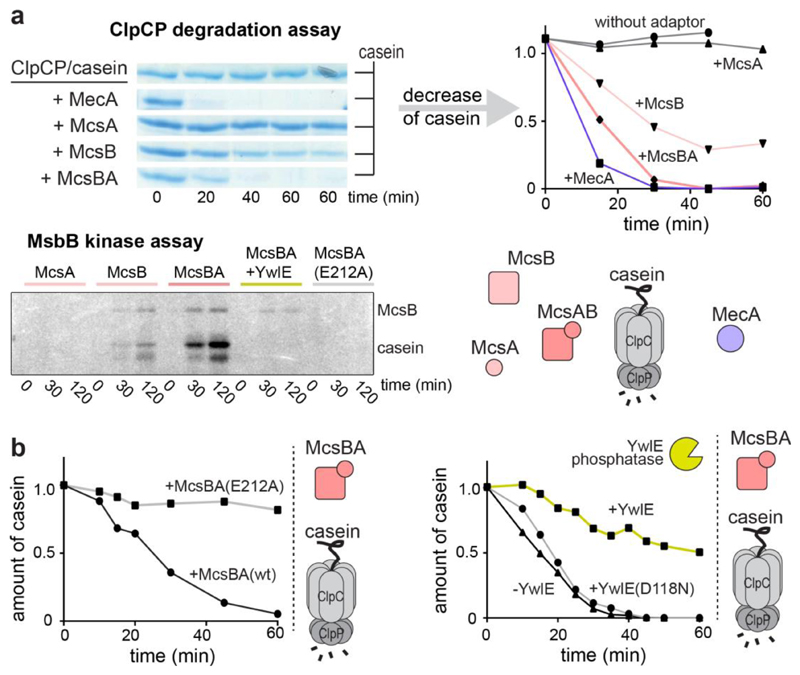
To analyse how ClpC selects pArg-containing substrates, we reconstituted the ClpCP–McsB system in vitro. McsB was previously described as an adaptor of ClpC targeting the transcriptional repressor CtsR for ClpCP-mediated proteolysis17,18. Although the kinase activity of McsB was shown to be required for CtsR degradation, it was not clear whether McsB itself, the substrate or the ClpCP protease became phosphorylated, and how this phosphorylation event enhanced protease activity. We thus recapitulated the corresponding kinase and protease assays using the intrinsically unfolded protein β-casein as a model substrate. We observed that the ClpCP protease complex alone was not active. However, in the presence of MecA, a well-characterized ClpC adaptor26, the substrate was efficiently hydrolysed (Fig. 2a). Similarly, McsB induced the degradation of β-casein by ClpCP. The stimulatory effect was enhanced by the MscB activator McsA27, which showed no effect on casein degradation by itself (Fig. 2a). To test whether the kinase activity of McsB is required for β-casein degradation, we used an inactive mutant of McsB (Glu212Ala; ref. 13), and, in parallel, probed the effect of the YwlE arginine phosphatase. Both kinase inactivation and phosphatase addition prevented substrate degradation (Fig. 2b, c), highlighting the importance of the arginine kinase activity of McsB for activating the ClpCP protease. This functional coupling is also reflected in the different kinase activities of the tested McsB variants (Fig. 2a).
Figure 2. Effect of McsB on the activity of ClpCP in vitro.
a, ClpCP-mediated degradation of β-casein in the presence of different effector proteins. Here and in the following, a quantification of the β-casein band is presented (original SDS–PAGE gels in Supplementary Fig. 2). Bottom panel shows the kinase activity of assayed McsB variants in an autoradiography plot. b, In contrast to active McsB, the inactive McsBE212A kinase cannot stimulate casein degradation by ClpCP. c, Effect of the YwlE arginine phosphatase on ClpCP activation by McsBA. The inactive YwlED118N mutant was used as a negative control.
pArg is a degradation tag for ClpCP
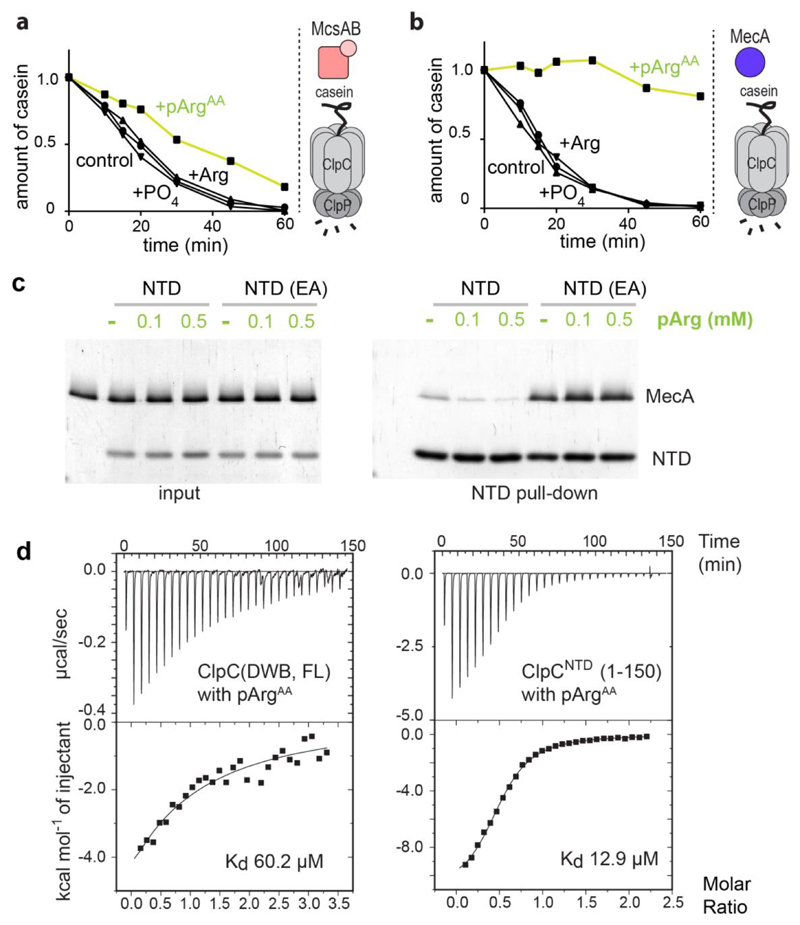
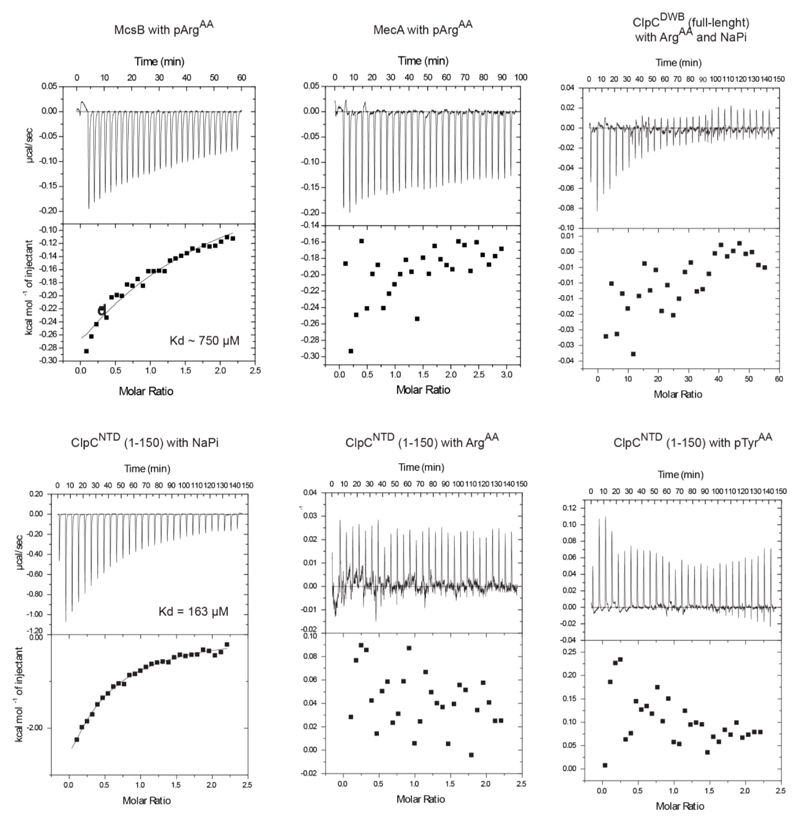
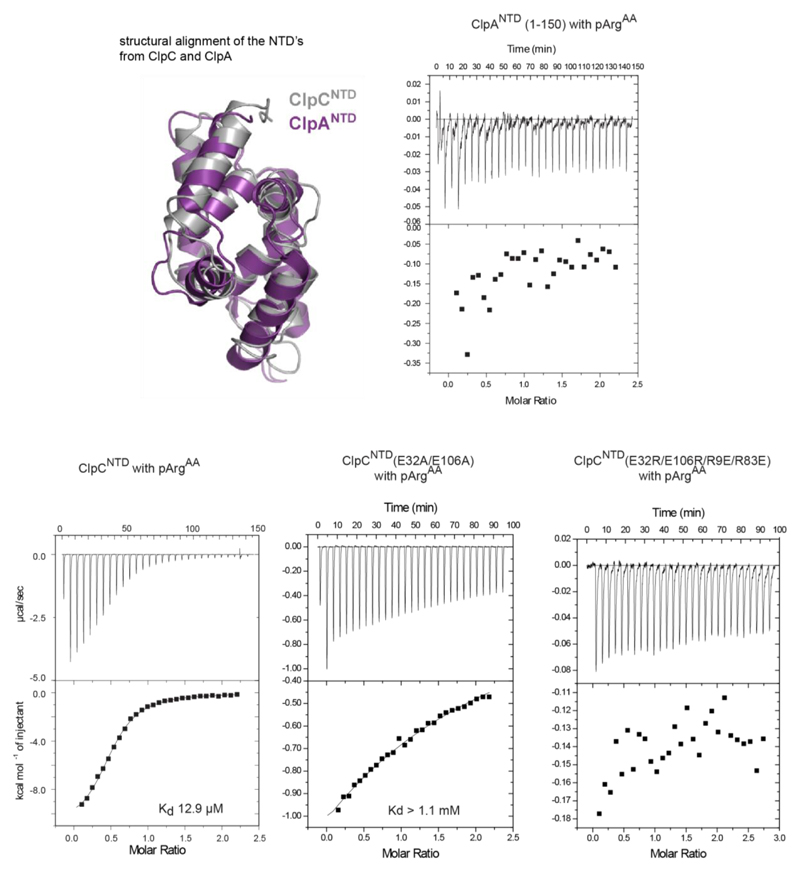
To explore the stimulatory effect of McsB further, we performed degradation assays in the presence of the free amino acid phosphoarginine (pArgAA, with AA denoting the amino acid). We reasoned that pArgAA may compete with, and thus reveal, the pArg-dependent activation event. When incubated with McsB and ClpCP, pArgAA reduced the rate of β-casein degradation (Fig. 3a). We next explored the influence of pArgAA on β-casein degradation by the ClpCP–MecA complex that should operate in a phosphorylation-independent manner. Unexpectedly, however, pArgAA also inhibited (and to a greater extent) the activity of the MecA-stimulated ClpCP protease (Fig. 3b). By contrast, unphosphorylated arginine or phosphate did not block degradation. As it is known that effector proteins such as MecA dock to the NTD of AAA unfoldases, we monitored how pArgAA influences this interaction (Fig.3c). A pull-down experiment using the NTD of ClpC (ClpCNTD) revealed that pArgAA inhibits the association between MecA and ClpC, probably by competing with MecA for the same binding site. When probing the direct interaction between pArgAA and ClpC by isothermal titration calorimetry (ITC), we measured dissociation constants (Kd values) of 60 µM for full-length ClpC and 13 µM for the isolated NTD (Fig. 3d). The pronounced specificity for pArgAA was confirmed by measuring the interaction with related compounds, which did not bind (pTyrAA, arginine) or did so only weakly (phosphate). Moreover, we observed that pArgAA did not bind to MecA, and has a very low affinity (Kd > 1 mM) for McsB (Extended Data Fig. 3). Finally, we tested the binding of pArgAA to the NTD of ClpA, the closest homologue of ClpC in Gram-negative bacteria, which lack a protein arginine kinase. Because no binding was observed (Extended Data Fig. 3), the ability to recognise pArgAA with high specificity seems to be a unique property of the ClpC unfoldase.
Figure 3. Binding of pArgAA to ClpC.
a, b, Inhibitory effect of pArgAA on McsBA-activated (a) and MecA-activated (b) ClpCP. c, Pull-down experiment monitoring the interaction of the NTD (wild type and E32A/E106A mutant) with MecA (10 μM each) in the presence pArgAA. d, ITC profile of pArgAA binding to full-length double Walker B mutant ClpC (ClpCDWB(FL); left) and the NTD of ClpC (ClpCNTD(1–150); right). Determined Kd values are indicated.
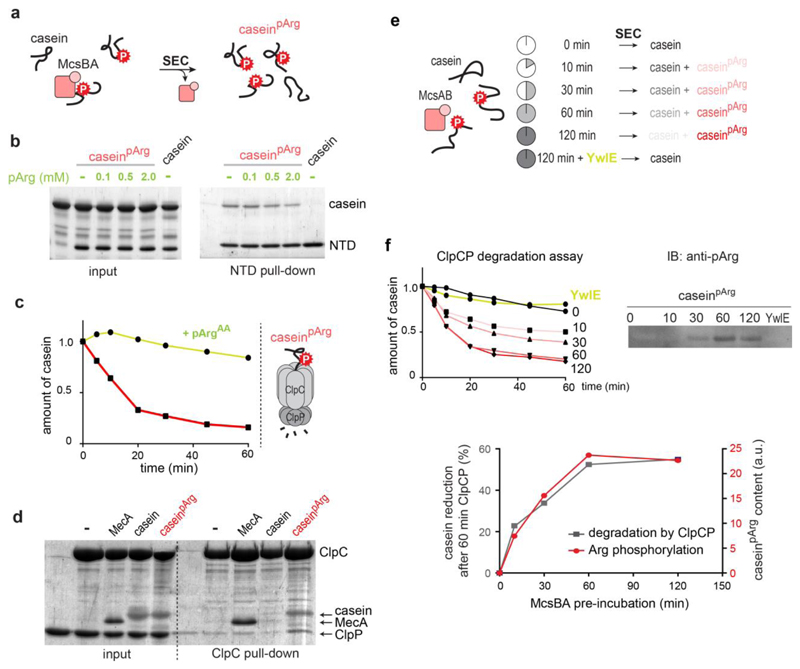
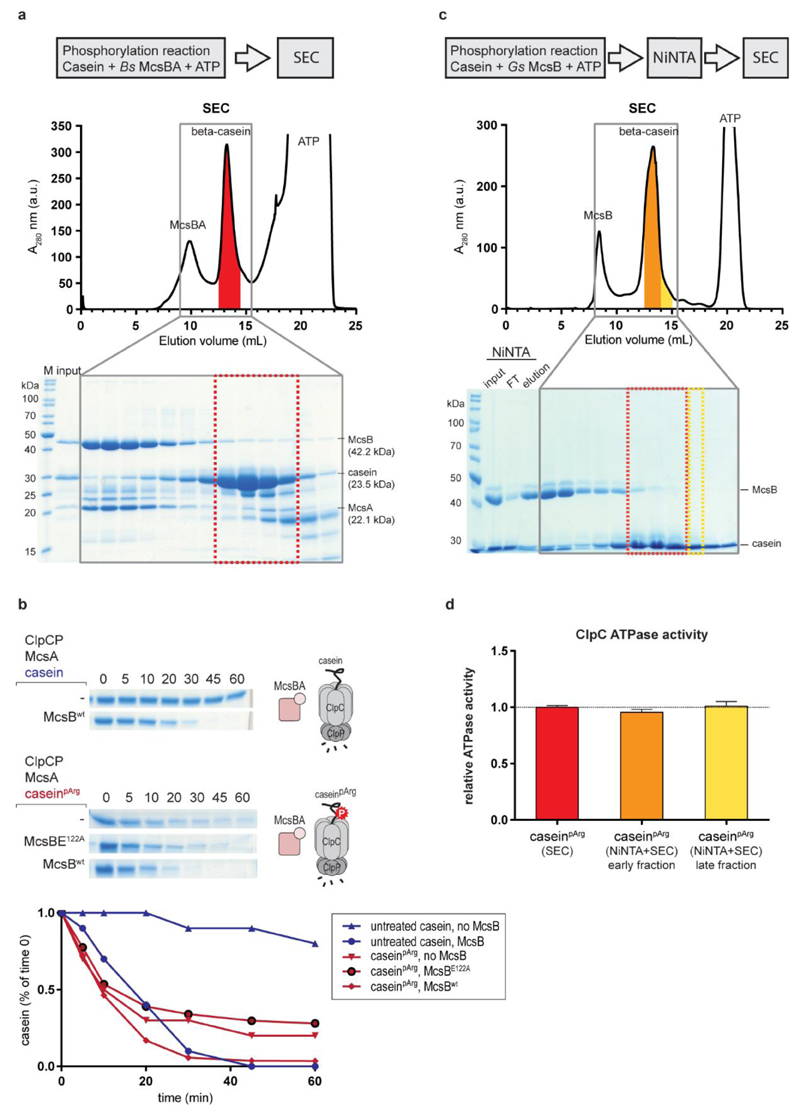
The pArg-binding site of ClpC could have two possible functions in protein degradation. It could serve as a docking site for the autophosphorylated form of McsB, which functions as an adaptor, or, alternatively, it could directly recognize pArg-containing substrates. To distinguish between these two possibilities, we enzymatically prepared pArg-modified β-casein (caseinpArg) (Fig. 4a and Extended Data Fig. 4). A pull-down assay showed that caseinpArg, but not unphosphorylated casein, binds to the ClpCNTD (Fig. 4b). Because inhibition of the caseinpArg‒NTD association required an excess of pArgAA, it seems that a pArg residue in a protein context interacts more strongly with the NTD than the free phospho amino acid. When testing caseinpArg as a direct ClpCP substrate, we observed that the ClpCP protease could degrade caseinpArg even in the absence of McsB or MecA (Fig. 4c). These data suggest that the assembly of the functional ClpCP protease can proceed without adaptor proteins. To corroborate this surprising finding, we performed ClpC and ClpP pull-down experiments after incubation with substrate. Consistent with the degradation assays results, we observed the formation of a transient ClpCP complex in the presence of caseinpArg, even to a higher degree than in the presence of MecA. Conversely, unphosphorylated casein could not promote ClpCP assembly (Fig. 4d). Together, these data show that the pArg modification is crucial for recruiting substrates to the NTD of ClpC and for promoting assembly of the functional ClpCP protease complex.
Figure 4. ClpCP protease activity towards a pArg-containing substrate protein.
a, Preparation of the caseinpArg model substrate. SEC, size exclusion chromatography. b, Binding of caseinpArg (35 μM) to ClpC NTD (10 μM) at increasing amounts of pArgAA. c, Degradation of caseinpArg by ClpCP without adaptor proteins and the inhibitory effect of pArgAA on this activity. d, Pull-down experiment monitoring ClpCP complex formation in the presence of MecA, casein and caseinpArg. e, Preparation of substrate samples that contain increasing amounts of caseinpArg after prolonged incubation with McsBA. ClpCP degradation of resultant caseinpArg samples is directly correlated to the degree of substrate phosphorylation seen in pArg immunoblots (Extended Data Fig. 3e). AU, arbitrary units.
To confirm the role of pArg as a degradation signal for the ClpCP protease, we analysed the digestion of substrate proteins that were arginine-phosphorylated to different degrees. For this purpose, we pre-incubated β-casein with McsB for increasing time intervals (Fig. 4e). ClpCP degradation assays of the resulting casein/caseinpArg mixtures showed a direct correlation between the amount of phosphorylated substrate and the extent of degradation (Fig. 4e and Extended Data Fig. 4e). Consistently, adding YwlE phosphatase to the pArg-modified substrates abolished their degradation. These results unambiguously demonstrate that ClpCP selectively degrades caseinpArg and does not recognize pArg-less proteins as substrates.
The pArg docking sites of ClpC
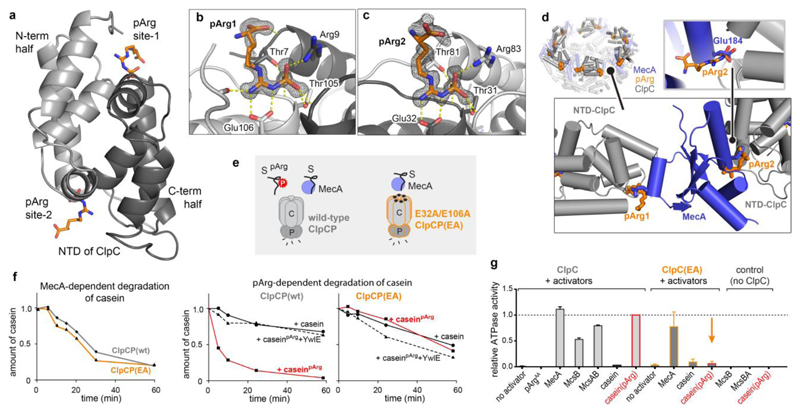
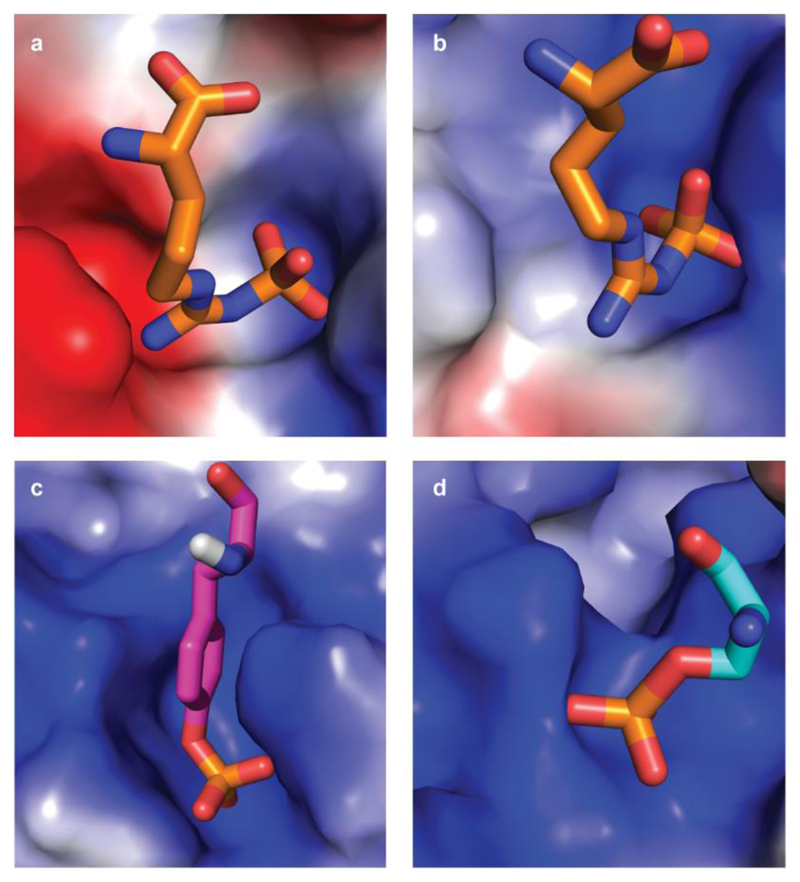
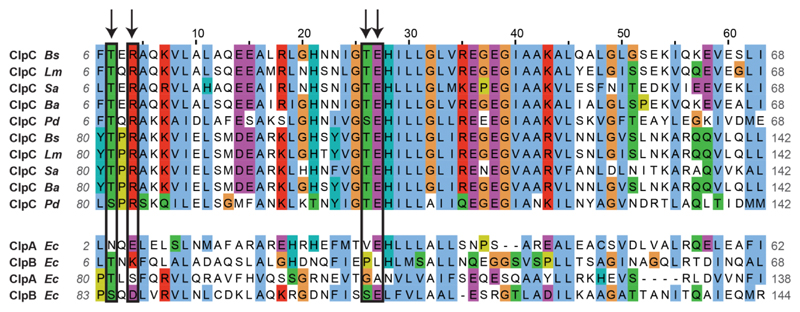
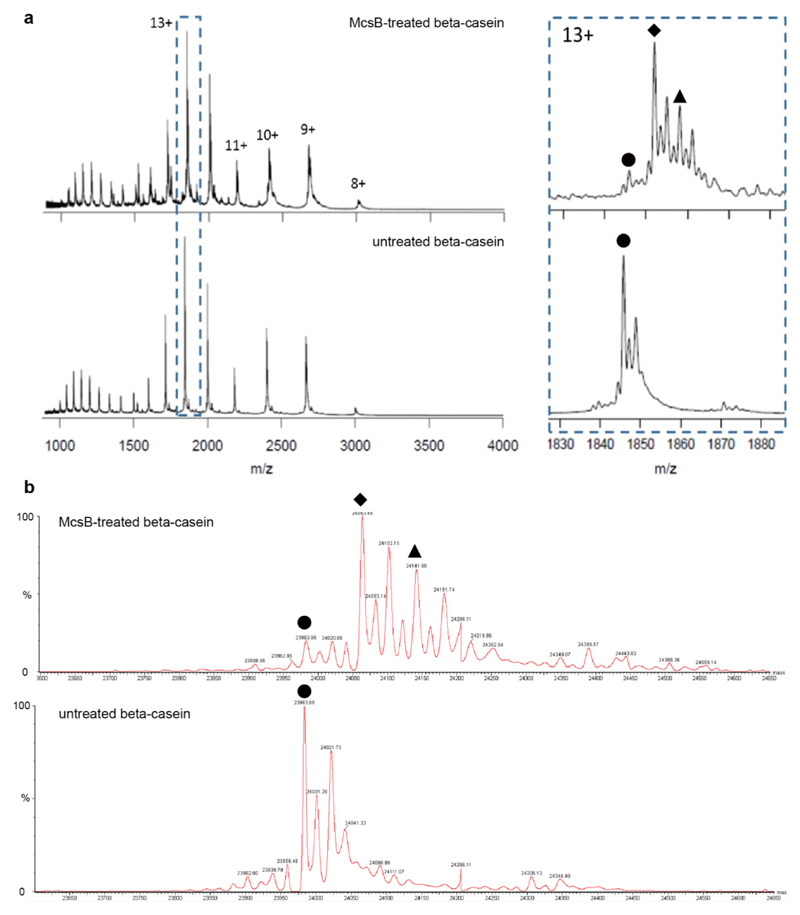
To visualize how pArg binds to ClpC, we performed co-crystallization experiments of the NTD from B. subtilis ClpC with pArgAA. The co-crystal structure was determined at 1.6 Å resolution (Extended Data Table 2) and, consistent with the symmetrical nature of the NTD protein fold28 (Fig. 5a), revealed two almost identical pArg-binding sites (Fig. 5b, c). Mapping the electrostatic potential of the NTD on its molecular surface illustrates the ‘bipolar’ architecture of the pArg-binding site that distinguishes it from pSer/Thr or pTyr binding sites (Extended Data Fig. 5). Such organization is perfectly suited for simultaneously recognizing the positively charged guanidinium and the negatively charged phosphoryl group. The functional importance of the pArg recruitment is reflected by the exact conservation of the interacting residues in ClpC proteins from other Gram-positive species (Extended Data Fig. 6). Since the structural data suggest that the ClpC hexamer has 12 pArg-docking sites, we asked how many pArg tags per substrate are required for degradation. Native MS analysis of the caseinpArg sample that resulted from prolonged incubation with McsB and that was completely degraded after ClpCP incubation revealed a mixture of mono- and di-phosphorylated molecules (Extended Data Fig. 7). Given the efficiency of also cleaving less phosphorylated substrates (Fig. 4f), we suppose that proteins carrying a single pArg mark can be degraded by ClpCP.
Figure 5. Crystal structure of the ClpC NTD in complex with pArg.
a, Overall structure of the ClpC NTD domain bound to two pArgAA molecules. The cartoon representation is coloured in light grey (residues 70–148) and dark grey (4–69) to highlight the two symmetrical halves of the NTD. b, c, Zoomed view of pArg-binding sites 1 (b) and 2 (c), with labelled interacting residues. The 2Fo – Fc omit electron densities of the pArgAA ligands, calculated at 1.6 Å resolution, are contoured at 1σ. d, Overlap of MecA- and pArg-binding sites. Shown is the hexameric organization of the ClpC1–485 (grey) complex with MecA121–218 (blue) (PDB code 3PXG; ref. 29) superimposed with pArgAA (orange). Bottom left, zoomed-in view shows two adjacent ClpC NTDs with pArgAA and MecA interactors. Bottom right, zoomed-in view illustrates that the pArg phosphoryl group and Glu184 (Glu198 in second binding site) of MecA compete for the same ClpC binding pocket. e, Scheme representing the distinct substrate (S) preferences of the wild-type ClpCP and ClpCPEA protease complexes. f, Degradation assays comparing the activity of wild-type ClpCP and ClpCPEA towards MecA-delivered (left) and pArg-labelled (middle, right) casein. YwlE was used as a control for the pArg-dependent degradation. g, ATPase activity of ClpC and ClpCEA in the presence of putative substrate proteins. Levels are normalized to the induced ATPase activity of the ClpC–caseinpArg complex. Error bars show the s.d. of three independent experiments.
Notably, the identified pArg-binding sites match the MecA-binding grooves observed in the MecA–ClpC complex29, with the phosphoryl moieties of pArgAA binding in place of the MecA glutamate residues 184 and 198 (Fig. 5d). This overlap explains the inhibition of MecA–ClpCP by pArgAA, as observed in our functional studies. Importantly, pArgAA binds to ClpC glutamate residues 32 and 106, which in the MecA–ClpC complex remain unbound. Therefore, the bipolar architecture of the pArg-binding sites can only be fully explored by the phosphoguanidinium moiety, whereas the MecA glutamate residues only dock into the positively charged half. To test the structurally characterized binding mode experimentally, we prepared NTD mutants carrying a Glu32Ala/Glu106Ala double mutation (EA) and measured the interaction with MecA and pArgAA. As predicted, mutating the two glutamate residues abolished pArgAA binding (Extended Data Fig. 3) but did not impair the interaction with MecA (Fig. 3c). Consistent with the binding data, the corresponding ClpCPEA protease efficiently degraded protein substrates with the help of MecA but failed to degrade substrates in a pArg-dependent manner (Fig. 5e, f). To confirm the selective failure in recognizing and degrading pArg protein, we measured the ClpC ATPase activity, which, in analogy to other AAA unfoldases30, should be stimulated by substrates. We observed that purified caseinpArg could stimulate the ATPase activity of wild-type ClpC to a similar extent to MecA (Fig. 5g). In strong contrast, the ATPase of the ClpCEA mutant could be induced by MecA, but not by caseinpArg, confirming the selective loss of pArg-dependent functions in this mutant.
Biological role of the pArg–ClpCP system
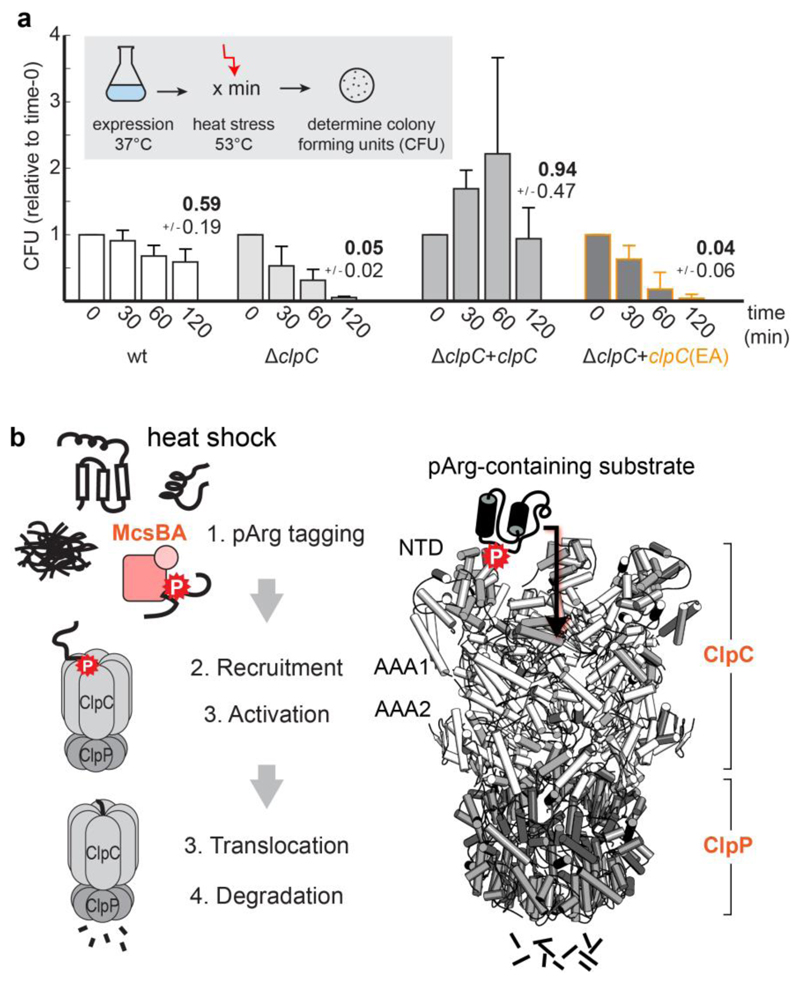
The developed ClpCEA mutant represents a valuable tool for addressing the biological role of pArg-dependent protein degradation. To this end, we analysed the ability of the ClpCEA mutant to suppress growth defects of a ΔclpC strain at increased temperatures (Fig. 6a). Whereas the expression of wild-type ClpC from a plasmid restored thermotolerance and even made the bacteria more robust in surviving increased temperatures, expression of the ClpCPEA mutant could not rescue the bacteria. As the ClpCPEA mutant is fully functional as a protease and can team up with adaptor proteins, these data highlight the essential role of the pArg-dependent degradation pathway in surviving proteotoxic stress situations.
Figure 6. The pArg–ClpCP degradation system.
a, Thermotolerance assay analysing the in vivo complementation of ΔclpC by expressing ClpC and ClpCEA. Levels are normalized to the values before heat shock (time 0), and numbers above bars represent the fraction of cells surviving after 2 h heat shock. CFU, colony-forming units. Error bars show the s.d. of three independent experiments. b, The pArg–ClpCP system. Left, cartoon representation shows that after phosphorylation by the McsB arginine kinase, pArg-tagged proteins are targeted to the ClpCP protease. Binding of pArg proteins to one of the 12 NTD binding pockets stimulates the ATPase activity of ClpC, leading to the translocation of the captured substrate into the ClpP protease cage and to protein degradation. Right, a model of the respective ClpCP complex (ClpC NTD in light grey, ClpC AAA1/2 in white, ClpP in dark grey, substrate in black).
Discussion
Energy-dependent proteases are essential for all living organisms to carry out protein quality control and degrade short-lived regulatory proteins. In contrast to eukaryotes, which universally use polyubiquitin chains for marking target proteins, a general post-translational modification regulating proteolysis in bacteria is not known. Here, we characterize such a tagging system. We show that pArg is a degradation mark for the ClpCP proteolytic machine, present in most Gram-positive species. Despite differing in size, the bacterial pArg modifier shares several features with the eukaryotic polyubiquitin degradation tag. Fist, both pArg and polyubiquitin are post-translationally attached to substrates, allowing for dynamic regulation of degradation that is not available to mechanisms relying on sequence-encoded degrons. Second, the pArg mark is recognized by highly specific receptor sites on the NTD of ClpC (Fig. 6b), as is ubiquitin by special receptor proteins of the 19S regulatory particle. Third, owing to charge inversion, the phosphorylation of arginine residues is predicted to destabilize the native structure of substrate proteins, priming them for subsequent catalysed unfolding. Similarly, the polyubiquitin tag affects the structure and stability of marked proteins31. Fourth, the pArg tag is reversibly attached to substrate proteins. As enzymes building polyubiqutin chains are opposed by de-ubiquitinases, the activity of the McsB kinase is counteracted by the pArg-specific phosphatase YwlE, thus allowing for regulation of the pArg degradation pathway.
In addition to revealing the pArg degradation tag, our study clarifies the mechanism of the ClpCP protease. Notably, ClpC has been reported to be a unique AAA enzyme that requires accessory proteins to assemble its functional hexameric form32. The present data suggest that this model is not fully correct, as the degradation of pArg-containing substrates does not require any additional co-factors. Substrate recruitment itself induces the ATPase activity of ClpC and promotes assembly of the functional ClpCP complex. Similar to the eukaryotic 26S proteasome, binding of specifically marked substrates is thus directly linked to protease activation. On the basis of the described functional similarities, the discovered pArg–ClpCP system seems to represent a simple bacterial version of the eukaryotic ubiquitin–proteasome system.
Our study also provides important insights into the biological role of pArg as a degradation tag. Analysis of the in vivo ClpP degradome suggests that the pArg tag is crucial not only for the regulatory proteolysis of CtsR but also for general turnover of structurally and functionally diverse proteins. Furthermore, we observed that pArg-dependent protein degradation is vital for coping with proteotoxic stress (Fig. 6a), and that pArg proteins are markedly enriched in the aggregate fraction of B. subtilis cells (Supplementary Tables 4 (ΔclpP) and 5 (wild-type)). Of note, 50% of the in vivo phosphorylated proteins15,19 carry the phosphomark in a region predicted to adopt a defined secondary structure, that is, in an α-helix or β-strand. Presumably, these sites would only be accessible to McsB when present in an at least partially unfolded state, indicating that McsB might target the damaged form of those proteins. Consistent with this, a recent in vivo study points to the importance of the McsB kinase for removing aberrant proteins in B. subtilis: the deletion of the kinase led to the accumulation and aggregation of an unstable model protein, while the levels of a stably folded counterpart of this model protein were not influenced33. We thus presume that protein arginine phosphorylation may have a role in the quality control of bacterial proteins, targeting unstable and aggregation-prone proteins for ClpCP degradation. Modifying arginine of all amino acids to decide about the fate of aberrant proteins seems to make sense. As arginine-rich patches correlate with aggregation propensity34, adding a phosphoryl group to arginine residues could hinder aggregation and, at the same time, promote the clearance of such problematic protein species by co-working protease machines.
Methods
DNA construct design
For recombinant protein overexpression in Escherichia coli, the clpP, mcsA, mcsB, clpC and clpC1–150 (NTD) genes/fragments from B. subtilis and clpA1–150 (NTD) from E. coli were cloned into pET21 or pET SUMO vectors (Novagen) conferring a terminal hexahistidine (6His) tag. Previously published pET21-derived plasmids were used for the expression of Geobacillus stearothermophilus McsB, YwlE and YwlED118N proteins13,24,25. For protein expression in B. subtilis, genes were cloned into the vector pHCMC05 (ref. 35) that contains the Psac IPTG-inducible promoter. For the expression of the ClpP, ClpPTRAP(S98A), ClpPX(E119A/R142E), ClpPX-TRAP(S98A/E119A/R142E), ClpC and ClpCEA(E32A/E106A),a C-terminal 6His tag including a Leu-Glu linker was introduced by PCR amplification. Single point mutations were generated using the QuikChange II mutagenesis kit (Agilent Technologies).
B. subtilis strains
The pHCMC05 plasmids described above were transformed into wild-type B. subtilis (strain 168) (ATCC 2385). To generate ClpC-knockout (ΔclpC) bacteria, genomic DNA from a B. subtilis ΔclpC::tet strain36 was transformed into the B. subtilis strains containing the pHCMC05, pHCMC05-clpPX, pHCMC05-clpPX-TRAP, pHCMC05-ClpC or pHCMC05-ClpC-E32A-E106A plasmids. The disruption of clpC in the resulting strains was confirmed by sequencing. A previously published B. subtilis ΔclpP::specR (ref. 37) strain was used to grow ClpP-knockout bacteria for phosphoproteomic analysis.
Culture procedures
All bacterial cultures were grown in Luria–Bertani (LB) medium. For the B. subtilis ΔclpC and ΔclpP strains, tetracycline (10 μg ml−1) and spectinomycin (100 μg ml−1) were added, respectively. E. coli and B. subtilis cultures containing the pHCMC05-derived plasmids were cultured in the presence of ampicilin (50 μg ml−1) and chloramphenicol (10 μg ml−1), respectively. E. coli BL21 (DE3) containing pET21- or pET SUMO-derived vectors were cultured in the presence of ampicilin (50 μg ml−1).
In vivo pull-downs using ClpP trapping mutants
For the ClpPX-TRAP pull-down experiment in the wild-type background of B. subtilis (Fig. 1b), 6 independent B. subtilis cultures were grown in LB media expressing either ClpPX (3 control cultures to identify unspecific binding partners) or ClpPX-TRAP (3 sample cultures). After the cells were grown at 37 °C until mid-exponential phase, expression of His-tagged ClpPX or ClpPX-TRAP proteins was induced with 1 mM IPTG. Recombinant protein expression proceeded for 3 h at 37 °C. To induce the activity of heat-shock proteins, including McsB and various Clp ATPases, the cultures were incubated in a pre-warmed incubator at 45 °C for 45 min. Cells were collected by centrifugation, resuspended in lysis buffer (25 mM Tris, pH 7.5, 150 mM NaCl, 10% glycerol) and stored at −80 °C. For the pull-down experiment comparing ClpP-trapped proteins in wild-type and ΔclpC backgrounds (Fig. 1c), the same procedure was applied using 12 independent B. subtilis cultures (3 wild type with ClpPX, 3 wild type with ClpPX-TRAP, 3 ΔclpC with ClpPX, 3 ΔclpC with ClpPX-TRAP).
The thawed cell suspensions were incubated for 1 h on ice with 2 mg ml−1 lysozyme (Sigma), Complete protease inhibitor cocktail (Roche), 0.2 mM PMSF (Sigma) and 10 μg ml−1 DNase (Sigma). Cells were sonicated and the resultant lysate was cleared by centrifugation at 4 °C. For the purification of 6His-tagged ClpP, the lysate was incubated with Dynabeads His-Tag Isolation & Pulldown (Invitrogen) for 1 h at 4°C. The beads were then washed 5× with lysis buffer and 2× with lysis buffer containing 50 mM imidazole. Two aliquots (5 or 10%) of the resulting beads were collected for SDS–PAGE analysis (protein elution with denaturing SDS–PAGE sample buffer) or Tris-acetate native-PAGE (protein elution with lysis buffer containing 500 mM imidazole). The remaining beads were subjected to reduction with 2 mM DTT (56 °C, 40 min), alkylation with 10 mM iodoacetamide (room temperature, in the dark, 45 min), and digestion with 2.5 μg Trypsin Gold (Promega) at 37 °C for 12 h.
MALDI-MS analysis of ClpP purifications
To analyse the mass of B. subtilis proteins co-purifying with ClpP(6His) under heat-shock conditions (Extended Data Fig. 1), matrix assisted laser desorption ionization time-of-flight mass spectrometry (MALDI–TOF-MS) was performed. The corresponding protein purifications were spotted on a MALDI plate using a sinapinic acid (10 mg ml−1) matrix prepared in 50% acetonitrile (ACN) and 0.1% trifluoroacetic acid (TFA). The samples were measured in a 4800 MALDI-TOF-TOF (AB Sciex) instrument operated in linear mode. Calibration was performed internally using cytochrome C as standard.
Sample preparation for phosphoproteomic analysis
For the phosphoproteomic analysis of total cell extracts of B. subtilis ΔclpC, cells were lysed by sonication in buffer 4% SDS, 100 mM Tris, pH 7.5, 100 mM DTT and further processed using a filter aided sample preparation (FASP)38 modified method, as described previously15, followed by trypsin digestion at 37 °C for 12–16 h. Protein aggregates were dissolved in the SDS buffer and processed in the same manner. Trypsin digestion completion was inspected by retention time and UV intensity (214 nm) distribution upon reverse-phase high-performance liquid chromatography (RP-HPLC) separation of a 0.1% aliquot of the resulting supernatants on a monolithic column (Ultimate Plus equipped with a PepSwift PS-DVB column, 5 cm × 200 μm, Dionex-Thermo-Fisher).
For the ClpP in vivo pull-down assays, a small aliquot (0.5%) of the on-bead trypsin digests was collected for subsequent quantitative analyses of co-purified proteins. The biological replicates were then pooled and further processed for phosphorylation analysis. Before phosphopeptide enrichment, sample digests were purified from buffer reagents by RP-C18 solid phase extraction at neutral pH using Oasis HLB cartridges (Waters). A previously described TiO2 protocol15, optimized in accordance to the acid-labile nature of phosphoarginine, was used for phosphopeptide enrichment.
LC–MS/MS analysis
Reverse-phase separation of all peptide mixtures was carried out on an Ultimate 3000 RSLC nano-flow chromatography system (Thermo Scientific), using 0.5% acetic acid (pH 4.5 with NH3) as loading solvent, to prevent phosphoarginine hydrolysis during removal of salts in the pre-column (PepMapAcclaim C18, 5 mm × 0.3 mm, 5 μm, Thermo Scientific). Peptide separation was achieved on a C18 separation column (PepMapAcclaim C18, 50 cm × 0.75 mm, 2 μm, Thermo Scientific) by applying a linear gradient from 2% to 35% solvent B (80% ACN, 0.08% formic acid) in 120 or 240 min (pull-down and total extract samples, respectively) at a flow rate of 230 nl min−1. Solvent A was 2% ACN, 0.1% formic acid. The separation was monitored by UV detection and the outlet of the detector was directly coupled to the nano-Electrospray ionization source (Proxeon Biosystems) for MS analysis.
For phosphorylation analysis, TiO2 elution samples were infused into the LTQ Orbitrap Velos Pro ETD mass spectrometer (Thermo Scientific) using PicoTip nanospray emitter tips (New Objective) at a voltage of 1.5 kV. Peptides were analysed in data-dependent fashion in positive ionization mode, applying two different fragmentation methods: collision-induced dissociation (CID) and electron-transfer dissociation (ETD). The survey scan was acquired at resolution 60,000 and the 6 most abundant signals with charge state equal or higher than 2+ and exceeding an intensity threshold of 1,500 counts were selected for peptide fragmentation analysis. For MS/MS experiments, precursor ions were isolated within a 2.1-Da window centred on the observed m/z. To prevent repeated fragmentation of highly abundant peptides, selected precursors were dynamically excluded for 30 s from MS/MS analysis. CID fragmentation was achieved at normalized collision energy (NCE) of 35% with additional activation of the neutral loss precursor at M-49, M-32.7 and M-98 AMU in a standard multistage activation method. For ETD, peptides were incubated with fluoranthene anions allowing for charge-state-dependent incubation times (90 ms for 3+ charged peptides), and resulting peptide fragments were detected in the ion trap analyser.
For the identification of co-purified proteins in the ClpP in vivo pull-down assays, slightly different instrument settings were used. The 12 most abundant signals with charge state equal to or higher than 2+ and exceeding an intensity threshold of 500 counts were selected for CID peptide fragmentation analysis, applying an isolation window of 2 Da. Multistage activation was disabled. Selected precursors were dynamically excluded for 60 s from MS/MS analysis. Each pull-down digest was analysed twice, to evaluate technical reproducibility.
MS data analysis
For the phosphorylation analysis of TiO2-enrchiment samples, raw data were extracted by the Proteome Discoverer software suite (version 1.4.0.288, Thermo Scientific) and searched against a combined forward/reversed database of B. subtilis Uniprot Reference Proteome with common contaminants added (4,455 entries in total) using MASCOT (version 2.2.07, Matrix Science). Carbamidomethylation of cysteine was set as fixed modification. Phosphorylation of serine, threonine, tyrosine and arginine plus oxidation of methionine were selected as variable modifications. Since tryptic cleavage is impaired at phosphorylated arginine, a maximum of two missed cleavage sites was allowed, whereas fully tryptic cleavage of both termini was required. The peptide mass deviation was set to 5 p.p.m.; fragment ions were allowed to have a mass deviation of 0.8 Da. False discovery rates were assessed using the Percolator tool39 within the Proteome Discoverer package. The results were filtered for peptide rank 1 and high identification confidence, corresponding to a 1% false discovery rate. Low-scoring peptides (Mascot ion score ≤ 20) were manually verified. In the rare cases in which a peptide was mapped to more than one protein sequence, both protein hits are reported. For reliable phosphorylation site analysis, all phosphopeptide hits were automatically re-analysed by the phosphoRS software40 within the Proteome Discoverer software suite. All the phosphopeptides identified in the ClpP in vivo pull-down assays were manually inspected. For other samples, we considered a phosphorylation site to be localized when the reported phosphoRS probability was higher than 90%. When multiple peptide-spectrum matches (PSMs) were obtained for the same phosphopeptide, only the PSM presenting the best identification/localization score compromise is presented. The multiple redundant PSMs were ranked according to their phosphoRS probability score into three categories (90–94%, 94–97% and 97–100%); the PSM presenting the best Mascot score within the highest phosphoRS category achieved was reported. PSMs presenting wrong or inconclusive localizations were thus excluded from the final list of phosphopeptides. Multiply phosphorylated peptides were also excluded from the analysis, because they cannot be classified into ‘phosphorylation type’ categories.
For quantitative analysis of ClpP-trapped proteins, MS data were analysed using the MaxQuant software environment41, version 1.5.1.2, and its built-in Andromeda search engine42, against the B. subtilis Uniprot database described above. Strict trypsin specificity with up to two missed cleavages was used. The minimum required peptide length was set to six amino acids. Carbamidomethylation of cysteine was set as a fixed modification and N-acetylation of proteins N termini (42.010565 Da) and oxidation of methionine were set as variable modifications. During the main search, parent masses were allowed an initial mass deviation of 4.5 p.p.m. and fragment ions were allowed a mass deviation of 0.5 Da. The mass accuracy of the precursor ions was improved by time-dependent recalibration algorithms of MaxQuant. The ‘match between runs’ option was enabled to match identifications across samples within a time window of 2 min of the aligned retention times. The second peptide identification option in Andromeda was enabled. PSM and protein identifications were filtered using a target–decoy approach at false discovery rate of 1% for PSMs and 5% for proteins. Relative, label-free quantification of proteins was done using the MaxLFQ algorithm43 integrated into MaxQuant using default parameters. Unique and razor peptides were considered for quantification.
Statistical evaluation of the resulting protein quantifications was performed using R scripting. Proteins quantified in less than 50% of the samples were filtered out. Missing LFQ values were substituted by the lowest value observed in the corresponding sample. For each protein, the fold change of LFQ-averaged intensities (ratio ClpPTRAP/control) and the corresponding P value (Limma test; Linear Models for Microarray Data) were calculated. A protein was considered to be a ClpP substrate when it was found to be enriched in the TRAP pull-down assays by a factor of at least 2 and P < 0.05. The ‘protein groups’ output file from MaxQuant containing the statistical evaluation is available in Supplementary Table 1. The mass spectrometry data have been deposited to the ProteomeXchange Consortium via the PRIDE partner repository44 (http://proteomecentral.proteomexchange.org). Representative spectra of the pArg peptides identified in the ClpP trapping mutant pull-downs are presented in Supplementary Fig. 1.
Expression and purification of recombinant proteins
For the overexpression of recombinant proteins in E. coli BL21 (DE3), LB cultures were grown at 37 °C until the exponential phase, when expression was induced with 0.5 mM IPTG. After expression, cells were collected by centrifugation, resuspended in buffer A and stored at −80 °C. As the B. subtilis ClpC protein was unstable when expressed in E. coli, the production of wild-type ClpC(6His) and ClpCEA(6His) was performed in B. subtilis containing the corresponding pHCMC05 plasmids, by induction with 1 mM IPTG for 3 h at 37 °C. The optimal expression strategies and purification buffers are summarized in Extended Data Table 3.
Cell suspensions were incubated on ice for 30 min in the presence of 1 mg ml−1 lysozyme, 0.1 mM PMSF, 10 μg ml−1 DNase and sonicated. Lysates were cleared by centrifugation and loaded on a 5 ml Ni- or Co-NTA column (GE Healthcare LifeSciences) equilibrated in buffer A. Washes were performed using a step-wise imidazole gradient, typically starting with 25 mM. The His-tagged proteins were eluted with buffer A containing 250 mM imidazole and concentrated using Vivaspin devices (Sartorius Stedim Biotech). Constructs expressed as a SUMO-fusion (SUMO-ClpP and SUMO-MecA) were incubated with SUMO Protease (Thermo Fisher Scientific) to obtain tag-free versions of the proteins. All resulting proteins were further purified by gel filtration on a Superdex-75 or -200 column (GE Healthcare LifeSciences) equilibrated with buffer B. For the purification of McsA(6His), the full-length protein was separated from an abundant cleavage product by ion exchange on a MonoQ column (GE Healthcare LifeSciences) using a 0.1–1 M NaCl gradient in 50 mM Tris, pH 8.5, 1 mM TCEP. All proteins were aliquoted and stored at −80 °C until further use.
For the purification of the B. subtilis ClpC NTD and NTDEA mutant, affinity, ion exchange, and size exclusion chromatography were carried out in a 0.5× PBS buffer (6 mM Na/K phosphate, pH 7.25, 1.35 mM KCl, 68.5 mM NaCl). After elution from Ni-NTA using the PBS buffer supplemented with 250 mM imidazole, the protein was passed through a ResourceQ column (GE Healthcare LifeSciences). This was followed by gel filtration on a Superdex 200 column (GE Healthcare LifeSciences).
In vitro pull-down assays
Varying amounts of the analysed components (individual proteins, pArgAA) were incubated in 200 μl of reaction buffer (10 mM Tris, pH 8.0, 50 mM NaCl, 5 mM MgCl2 and 25 mM imidazole). After 5 min, 50 μl of Ni-Sepharose was added to capture His-tagged proteins. Sepharose was washed three times with 200 μl reaction buffer and bound proteins were eluted with 50 μl of elution buffer (10 mM Tris, pH 8.0, 50 mM NaCl, 5 mM MgCl2 and 1 M imidazole). For visualization, input and elution, fractions were analysed by SDS–PAGE.
Native-PAGE
For the analysis of the oligomeric state of purified ClpP samples, a Tris-acetate non-denaturing PAGE system was used. Gel composition corresponded to 7, 10 or 15% acrylamide, 0.24% bis-acrylamide, 200 mM Tris-acetate, pH 7, polymerized in the presence of 0.042% ammonium persulfate (APS) and 0.125% N,N,N′,N′-tetramethylethylenediamine (TEMED). The running buffer composition was 25 mM Tris-HCl, 192 mM glycine, pH 8.3. Protein separation was performed at 4 °C and 150 mV for 3–4 h, and proteins were visualized by Coomassie-based InstantBlue protein stain (Expedeon). The NativeMark unstained protein standard (Thermo Fisher Scientific) was used for the estimation of ClpP oligomeric state.
Purification of caseinpArg
To produce the arginine-phosphorylated substrate, β-casein from bovine milk (Sigma) was incubated at 10 µM (all protein concentrations, if not otherwise mentioned, are for a single protomer) with 2 µM McsB and McsA from B. subtilis in 25 mM Tris, pH 7.5, 50 mM NaCl, 20 mM MgCl2, and 5 mM ATP at 30 °C for 2 h. The reaction mixture was concentrated with a Vivaspin device and applied to a Superdex-200 size exclusion column equilibrated with 25 mM Tris, pH 7.5, 50 mM NaCl. The fractions most strongly enriched in β-casein over McsB (Extended Data Fig. 5a) were then pooled, concentrated and stored at −80 °C. The presence of the pArg modification was confirmed by immunoblotting using a pArg-specific antibody as described below.
To obtain caseinpArg of higher purity, a similar phosphorylation reaction was performed, except that 4 µM of the G. stearothermophilus McsB(6His) was used instead of the B. subtilis McsBA complex. The reaction mixture was afterwards applied to a Ni-NTA column (GE Healthcare LifeSciences) to reduce the amounts of the His-tagged McsB before the final gel filtration purification step (Extended Data Fig. 5c).
To prepare β-casein phosphorylated to different degrees (Fig. 4e), a large-scale phosphorylation reaction was set-up with the B. subtilis McsBA at 30 °C. An aliquot (time 0) was collected before the addition of ATP. After adding ATP, aliquots were taken after 10, 30, 60 and 120 min. After adding 100 mM EDTA (to stop phosphorylation), each aliquot was concentrated by Vivaspin ultrafiltration and applied to a Superdex 200 size exclusion column. An additional sample, which was collected after 120 min incubation with McsBA, was treated with 1 µM YwlE arginine phosphatase for 2 h. The phosphatase was then inactivated by adding 2 mM pervanadate and the sample was concentrated and submitted to size exclusion chromatography. The different caseinpArg preparations were concentrated and stored at −80 °C.
To quantify the increase of arginine phosphorylation over time, a western blot was performed using the pArg-specific antibody described previously24. The caseinpArg preparations (2 µg) were separated by SDS–PAGE, transferred to a nitrocellulose membrane and fixed using a 0.4% formaldehyde solution in PBS, pH 7.5, for 30 min as previously described45. After blocking, the pArg-specific primary antibody (2 µg ml−1, Morphosys AG) was incubated overnight at 4 °C and the secondary antibody (goat anti human IgG F(ab′)2:HRP, AbD Serotec) was used at a 1:7,000 dilution for 1.5 h at room temperature. The detection was performed using ECL Plus western blotting substrate (Pierce). The signals were quantified using the ImageJ software46 and normalized to the band intensities observed in a coomassie-stained SDS–PAGE gel replicate having 1.3 µg of each protein preparation.
ClpCP in vitro degradation assays
In vitro degradation assays containing 0.16 µM ClpC (hexamer), 0.16 µM ClpP (heptamer) and 5 µM β-casein substrate were performed in 25 mM Tris, pH 7.5, 150 mM NaCl, 20 mM MgCl2 and 5 mM ATP at 30°C. A different β-casein concentration (10 µM) was used, for better resolution, when comparing ClpCP and ClpCPEA in MecA-dependent degradation. Small molecule compounds, for example, phospho-l-arginine (pArgAA, Toronto Biochemicals), l-arginine (Sigma) or sodium phosphate, pH 7.5, were added at 1 mM. Time-point aliquots were mixed with denaturing SDS–PAGE sample buffer containing 100 mM EDTA to stop the reaction and analysed by SDS–PAGE. The resulting gels were stained with InstantBlue dye (Expedeon) and quantified using ImageJ46. Supplementary Fig. 2 shows full SDS–PAGE gels and corresponding quantifications of Figs 2–5.
Radioactive kinase assay
The radioactive kinase assay was performed at 19 °C in 25 mM Tris, pH 7.5, 50 mM NaCl, 2% glycerol, and 20 mM MgCl2. 15 μM β-casein substrate was incubated with 1 μM McsB and/or other proteins (1 μM McsA, 5 μM YwlE) for 0, 30 and 120 min. The reaction was started by adding ATP (spiked with [γ-32P]ATP from Perkin Elmer) to a final concentration of 10 mM and stopped with denaturing SDS–PAGE sample buffer. After resolving the samples by SDS–PAGE, phosphorylation was visualized using phosphoimager technology (GE Healthcare Life Sciences).
ATPase assays
ATPase activity was determined by a coupled enzymatic reaction47. 0.125–0.5 μM ClpC was incubated with 18.75 U ml−1 pyruvate kinase, 21.45 U ml−1 lactate dehydrogenase, 0.2–0.3 mM NADH, 7.5 mM phosphoenolpyruvate and 2 mM ATP in 20 mM HEPES, pH 7.5, 100 mM NaCl, and 5 mM MgCl2. Further assay proteins (MecA, McsB, McsA and β-casein) were added at 4–6-fold excess over ClpC. The absorption at 340 nm (A340 nm) was recorded for 60 min using a Synergy H1 Multi-Mode Reader. The molar ATPase activity (v) was calculated by the equation: v =ΔA340 nm/(path length × 6,220 × [ClpC] × M−1 × cm−1). All activity data represent a minimum of three independent experiments and the variability is highlighted as standard deviation.
ITC
ITC measurements were performed using VP-ITC (Microcal). Ligands (pArgAA, L-arginine, phospho-L-tyrosine (pTyrAA, from Sigma), and sodium phosphate, pH 7.5, were prepared at 0.3–1.4 mM in 25 mM Tris, pH 8, 50 mM NaCl, 0.2 mM TCEP and titrated to a 20 µM ClpCDWB (full-length) or 140 µM ClpCNTD protein solution present in the same buffer. The same set-up was used for the analysis of ClpANTD. The following settings were used: 5 µl (first) and 10 µl (all subsequent injections) injection volume, 300 s spacing time between the injections, 300 r.p.m. stirring speed, 25 °C temperature and overflow mode. Control experiments were carried out to correct for dilution effects upon protein/ligand titration. Resulting data were analysed with the MicroCal ORIGIN software.
Structure determination of B. subtilis ClpC NTD in complex with pArgAA
Crystals of a ClpCNTD–pArgAA complex were obtained by the sitting-drop vapour diffusion method upon mixing 100 nl of reservoir with 200 nl of a ClpCNTD (2 mM) protein solution containing 2 mM pArgAA. The optimized crystallization solution contained 13.5% (w/w) polyethylene glycol 4000, 500 mM ammonium sulfate, and 100 mM sodium acetate at pH 5. Crystals formed overnight at 19 °C and were soaked/cryo-protected in 40% polyethylene glycol 400, 20 mM Tris pH 8, and 6 mM pArgAA before being flash-frozen. Diffraction data to 1.6 Å were collected at 100 K using a wavelength of 0.9763 Å at beamline P14, DESY, Hamburg and integrated with XDS48. Molecular replacement in Phaser49 using the NTD of ClpC from B. subtilis (PDB code 2Y1Q; ref. 29) as a search model yielded a high-confidence solution. Refinement in CNS50, automatic rebuilding in Phenix51, and manual rebuilding in Coot52,53 were carried out, followed by placing of ligands in Coot54. N(omega)-phospho-L-arginine structure and constraints were obtained with the respective SMILES code using eLBOW55. Rounds of refinement in Phenix56 and rebuilding in Coot yielded the final model with good statistics and geometry (Extended Data Table 2 and the following Ramachandran statistics: 98% favoured, 2% allowed, 0% outliers, 0% rotamer outliers). The featured-enhanced map, which is based on a composite residual omit map, was used to show ligand density. Figures were produced in Pymol57.
Purification of B. subtilis protein aggregates
For the phosphoproteomic analysis of B. subtilis protein aggregates, a 3-l culture of B. subtilis was grown at 37 °C until late exponential phase and then heat-shocked (50 °C) for 45 min. Cells were collected by centrifugation, resuspended in 25 mM Tris, pH 7.5, 150 mM NaCl, 0.5% Triton X-100 and stored at −80 °C.
A 30-ml cell suspension in 25 mM Tris, pH 7.5, 150 mM NaCl, 0.5% Triton X-100 was incubated on ice with 3 mg ml−1 lysozyme, Complete protease inhibitor cocktail (Roche), 20 µg ml−1 DNase, 0.2 mM PMSF and 2 mM vanadate for 30 min. After dilution to 100 ml, cells were gently lysed at 4 °C by French Press (Constant Cell Disruption Systems) at 1.7 kbar. Lysis efficiency, estimated by plating out serial dilutions, exceeded 99%. The lysates were centrifuged at 45,000g for 30 min. The resulting pellets, containing insoluble protein aggregates, were further washed with 20 ml lysis buffer containing 0.4 mg ml−1 lysozyme, 10 µg ml−1 DNase, 0.2 mM PMSF and 2 mM vanadate. After 40 min homogenization at 4 °C under gentle agitation, the pellets were re-centrifuged. The protein aggregates contained in the pellets were then solubilized in 7 ml 25 mM Tris, pH 7.5, 8 M urea by sonication. The samples were again centrifuged to separate the urea-solubilized protein aggregates from cell debris. The resulting supernatants were stored at −80 °C until MS sample processing.
Thermotolerance assay
To test the role of ClpC during heat stress, the following B. subtilis strains were investigated: wild type + pHCMC05, ΔclpC::tet + pHCMC05, ΔclpC::tet + pHCMC05-ClpC and ΔclpC::tet + pHCMC05-ClpCEA. For all experiment, cultures were grown at 37 °C in LB media containing 10 μg ml−1 chloramphenicol and 0.2 mM IPTG. After reaching exponential phase, the cultures were transferred to a pre-warmed incubator at 53 °C for 0, 30, 60 or 120 min, respectively. After heat stress, the samples were diluted sequentially and transferred to LB plates. To compare the survival rate after heat stress, we determined the number of colony-forming units (CFU). All experiments were independently performed three times and the observed variability is highlighted as standard deviation.
Native mass spectrometry
Native mass spectrometry experiments were carried out on a Synapt G2Si instrument (Waters) with a nanoelectrospray ionisation (nESI) source. Mass calibration was performed by a separate infusion of NaI cluster ions. Solutions were ionised through a positive potential applied to metal-coated borosilicate capillaries (Thermo Scientific). β-casein samples (5 μM) were sprayed from 25 mM ammonium acetate, pH 6.8. The temperature settings were capillary voltage 1.5 kV, sample cone voltage 30 V, extractor source offset 46 V, and source temperature 50 °C. Data were processed using Masslynx V4.1 software.
Data reporting
Source Data for Figs 1–5 are provided in the Supplementary Information. No statistical methods were used to predetermine sample size. The experiments were not randomized, and investigators were not blinded to allocation during experiments and outcome assessment.
Extended Data
Extended Data Figure 1. Development and validation of the ClpPX-TRAP mutant.
a, Co-NTA purification of wild-type and TRAP mutant ClpP(6His) expressed in heat-stressed B. subtilis wild-type cells. SDS–PAGE (left) reveals co-purification of two ClpP protein species. MALDI–MS analysis (bottom) estimates that the mass difference between the two ClpP species was 1,036 and 1,042 Da for wild-type and TRAP ClpP, respectively. These values fit to the expected mass of the 6His tag (1,065 Da), indicating that the purified proteins correspond to recombinant (tagged) and endogenous ClpP. Native-PAGE (right) shows that the two proteins are present predominantly as a composite, heptameric complex. Therefore, ClpP(6His)TRAP expression in B. subtilis under heat-stress conditions is complicated by the formation of mixed complexes with endogenous (active) ClpP (cartoon). As the untagged endogenous ClpP was observed at similar levels as ClpP(6His), it is unlikely that efficient substrate-trapping complexes—built up exclusively by inactive ClpPTRAP—are formed in vivo. b, Engineering of the ClpP cross mutant. Crystal structure of the ClpP heptamer (PDB code 3KTI; ref. 58) shown in top (left) and side (right) view. Zoomed-in picture shows interaction between Arg142 and Glu119 of two neighbouring subunits. To avoid the interaction of the recombinant ClpP(6His) trapping mutant with endogenous ClpP, these two residues were inter-exchanged (Glu119Arg/Arg142Glu), thus leading to an electrostatic repulsion between the cross-mutant ClpP(6His)X-TRAP and wild-type ClpP, while allowing formation of the respective homo-heptamers, as schematically indicated. c, Co-NTA purification of ClpP(6His)X and ClpP(6His)X-TRAP expressed in heat-stressed B. subtilis wild-type cells. SDS–PAGE (left) shows that the X variants do not co-purify with endogenous ClpP, demonstrating that the Glu119Arg/Arg142Glu mutation prevents the formation of hetero-oligomers (as shown in the cartoon). Native-PAGE analysis (middle) suggests that the ClpP(6His)X protein has a reduced heptamerization propensity. However, the inactive version (Ser98Ala, ‘TRAP’) of the ClpP(6His)X mutant is present predominantly as a heptameric complex, probably owing to the stabilization by trapped substrates. ClpP(6His)X-TRAP thus represents a tool to trap substrates in the wild-type background of B. subtilis. Our experimental approach has the advantage of avoiding the use of the ΔclpP B. subtilis strain, which has an extremely pleiotropic phenotype (including increased levels of McsB and McsA14) that would largely bias the characterization of ClpP substrates. The ClpPX protein represents the ideal negative control: it has reduced ability to heptamerize and therefore to degrade proteins, and its overexpression is expected to have little effect on the overall levels of protein degradation and consequently on the abundance of substrate proteins.
Extended Data Figure 2. In vivo characterization of ClpPX-TRAP variants used in pull-down experiments.
a, SDS–PAGE (left) and native-PAGE (right) analysis of co-NTA purifications of experiment 1: pull-down of His-tagged ClpP variants in wild-type B. subtilis. Numbers denote biological replicates. Each sample represents approximately 10% of the total purification. b, SDS–PAGE (top) and native-PAGE (bottom) analysis of co-NTA purifications of experiment 2: pull-down of His-tagged ClpP variants in the wild-type (left) and ΔclpC (right) B. subtilis strain. Each sample represents approximately 5% of the total purification.
Extended Data Figure 3. Preparation and validation of caseinpArg as a model substrate of ClpCP.
a, Top, size exclusion chromatography (SEC) separation of caseinpArg from the B. subtilis McsBA complex after in vitro phosphorylation. The red markings indicate the fractions that were pooled. Bottom, SDS–PAGE analysis of the fractions indicates that the SEC procedure could separate at least 95% of the McsB protein from the pooled β-casein fractions. b, Evaluating the effect of the McsB contamination on the degradation of caseinpArg. Top, ClpCP in vitro degradation assay towards untreated β-casein. Middle, ClpCP in vitro degradation of caseinpArg, with and without additional McsB kinase. Bottom, addition of either inactive or active McsB did not have an effect on the initial degradation rate of caseinpArg. Of note, the degradation of untreated casein in the presence of McsBA is slightly delayed compared to the degradation of pre-modified caseinpArg. c, An alternative, improved protocol for purifying caseinpArg. After in vitro phosphorylation of β-casein by G. stearothermophilus McsB(6His), a Ni-NTA column was used to capture the tagged kinase. The flow-through fraction was then applied to a SEC column to further separate remaining McsB from β-casein. Two different fractions of the β-casein peak were collected, the later-eluting one (yellow) having a higher degree of purity in relation to the earlier one (orange). d, Activation of the ClpC ATPase activity by the different caseinpArg preparations (2 µM concentration each). Each fraction contains a different (substoichiometric) amount of the McsB contamination. ATPase measurements reveal an almost identical activation of ClpC for all fractions, indicating that the residual amounts of McsB present in the caseinpArg sample do not contribute to ClpC activation. Error bars denote standard deviation of technical triplicates. e, To obtain substrate samples varying in the amount of arginine phosphorylation, casein was pre-incubated with McsBA for increasing times. The YwlE arginine phosphatase was added to the sample phosphorylated most strongly (120 min incubation with McsBA) as a negative control. The resultant caseinpArg samples were subjected to pArg immunoblots using a pArg-specific antibody24 (right, top) and to ClpCP degradation assays (right, bottom).
Extended Data Figure 4. ITC binding data.
For each binding study, the analysed interactions are indicated on the top, and the respective Kd values, when detected, are shown below. For reference, a structural alignment of the ClpC (grey) and ClpA (purple; PDB code 1K6K) NTDs, showing a high degree of structural similarity, is presented.
Extended Data Figure 5. Binding pockets of pArg, pTyr and pSer/Thr.
The binding pockets are shown as surface representation and coloured according to their electrostatics as calculated with PyMol (blue: positive, red: negative). Bound phosphoamino acids are presented as sticks with nitrogens and oxygens coloured blue and red, respectively. a, b, pArg-binding sites 1 and 2, respectively, of the ClpCNTD domain. The sites are characterized by a ‘bipolar’ architecture with both a positive and a negative area, jointly required to recognize a pArg side chain. c, d, pTyr-binding site of the Src SH2 domain (PDB code 1SPS; ref. 59) and pSer/Thr-binding site of the 14-3-3 domain (PDB code 1QJB; ref. 60). Both pTyr and pSer were part of a peptide but are shown in isolation for clarity. In contrast to the pArg-binding site, pTyr- and pSer/Thr-specific pockets are uniformly positively charged.
Extended Data Figure 6. Sequence alignment of the pArg-binding site of ClpC from different species and of the homologous regions of other Clp ATPases.
The two symmetrical regions (comprising residues 6–68 and 80–142, approximately) of each protein are aligned. Residues interacting with the pArg molecule (the Glu residue binding to the guanidinium group and the Arg/Thr residues interacting with the phosphate) are circled in black and marked by an arrow. Each of the two pArg-binding sites comprises Glu and Thr from one symmetrical region and Arg and Thr from the other. The alignment shows high conservation of the critical residues of ClpC proteins from different McsB-containing bacteria (B. subtilis, Listeria monocytogenes, Staphylococcus aureus, Bacillus anthracis and Peptoclostridium difficile). Conversely, the residues are not conserved in related Clp proteins (ClpA and ClpB) from McsB-deficient, Gram-negative bacteria.
Extended Data Figure 7. Intact mass analysis of McsB-treated and untreated (control) β-casein.
a, Unprocessed MS spectra. Zoomed view of the 13+ charge state species shows two predominant arginine phosphorylation states in the McsB-treated sample (top): 1 phopshorylation (diamond, m/z 1,852) and 2 phosphorylations (triangle, m/z 1,852), while only the non-pArg form (circle, m/z 1,848) can be visualized in the untreated control (bottom). b, Deconvoluted MS spectra, showing the average proportion of unmodified (circle, 23,982 Da), 1 pArg-containing (diamond, 24,063 Da) and 2 pArg-containing (triange, 24,142 Da) β-casein.
Extended Data Table 1. Summary of identified phosphosites in various ClpP trapping experiments.
| Experiment 1 |
Experiment 2 |
|||||||
|---|---|---|---|---|---|---|---|---|
|
B. subtilis |
wt |
B. subtilis |
wt |
B. subtilis |
ΔclpC |
|||
| Uniprot | Gene Id | Protein Descriptions | control | TRAP | control | TRAP | control | TRAP |
| Arg-phosphorylated proteins | ||||||||
| P71006 | albF | Putative zinc protease AlbF | R17 | |||||
| P37941 | bfmBAB | 2-oxoisovalerate dehydrogenase subunit b | R23 | |||||
| O32222 | csoR | Cu-sensing transcriptional repressor CsoR | R24 | R24 | ||||
| P37568 | ctsR | Transcriptional regulator CtsR | R55 | R55 | R55 | |||
| P42416 | iolE | Inosose dehydratase | R216 | |||||
| O34645 | melA | Alpha-galactosidase | R56 | R56 | ||||
| O34338 | mntB | Mn transport ATP-binding prot. MntB | R132, (R73) | R132 | ||||
| P16263 | odhB | 2-oxoglutarate dehydrogenase E2 | R300 | |||||
| P12875 | rplN | 50S ribosomal prot. L14 | R17 | R17 | ||||
| P42060 | rplV | 50S ribosomal prot. L22 | R11 | |||||
| P12879 | rpsH | 30S ribosomal prot. S8 | R47, R72, R79 | R47, R72 | ||||
| P27206 | srfAA | Surfactin synthase subunit 1 | R226 | R226 | ||||
| P33166 | tuf | Elongation factor Tu | R384 | |||||
| O34909 | yerA | Putative adenine deaminase YerA | R14 | |||||
| O34949 | ykoM | Uncharact. HTH-type transcript. regulator YkoM | R89 | |||||
| P42430 | ykyB | Uncharacterized prot. YkyB | R26 | R26 | ||||
| P54391 | ypiF | Uncharacterized prot. YpiF | R4 | |||||
| O07019 | yvfU | Uncharact. transcript. regulatory protein YvfU | R143 | |||||
| Phosphorylated proteins, likely pArg | ||||||||
| P13800 | degU | Transcriptional regulatory prot. DegU | (R184) | |||||
| P25499 | hrcA | Heat-inducible Transcriptional repressor HrcA | (R27) | (R27) | ||||
| Ser/Thr/Tyr-phosphorylated proteins | ||||||||
| P25953 | comGA | ComG operon prot. 1 | T178 | |||||
| O31461 | ilvE | Branched-chain aa transaminase 1 | T249 | |||||
| P42956 | mtlA | PTS system mannitol-specific EIICB | S365 | S365 | ||||
| P55874 | rpmI | 50S ribosomal prot. L35 | S47 | S47 | ||||
| P21476 | rpsS | 30S ribosomal prot. S19 | T77 | |||||
| O34607 | sdaAA | Probable L-serine dehydratase, α chain | T99 | |||||
| P54334 | xkdO | Phage-like element PBSX prot. XkdO | S295 | |||||
| O34833 | yceH | Uncharacterized prot. YceH | S296 | S296 | S296 | S296 | ||
| O32131 | yunB | Sporulatio n prot. YunB | T165 | |||||
| P39808 | yvyG | Uncharacterized prot. YvyG | Y49 | Y49 | Y49 | Y49 | ||
| P42294 | yxiB | Uncharacterized prot. YxiB | S88 | |||||
Extended Data Table 2. Summary of crystallographic data collection and analysis.
| Data collection | |
|---|---|
| Wavelength (Å) | 0.9763 |
| Resolution range (Å) | 42.3 - 1.60 (1.66 - 1.60) |
| Space group | P 65 |
| Unit cell | |
| a, b, c (Å) | 84.6, 84.6, 29.85 |
| α, β, γ (°) | 90, 90, 120 |
| Total reflections | 298,317 (14,879) |
| Unique reflections | 16,055 (1,350) |
| Multiplicity | 18.6 (11.0) |
| Completeness (%) | 0.98 (0.83) |
| Mean I/sigma(I) | 29.62 (4.73) |
| Wilson B-factor | 20.61 |
| R-merge | 0.062 (0.55) |
| R-meas | 0.064 (0.58) |
| R-pim | 0.015 (0.17) |
| CC1/2 | 0.999 (0.95) |
| CC* | 1 (0.987) |
| Structure Refinement | |
| Reflections used in refinement | 16,041 (1,349) |
| Reflections used for R-free | 1,585 (133) |
| R-work | 0.145 (0.195) |
| R-free | 0.166 (0.253) |
| Number of non-hydrogen atoms | |
| total | 1,264 |
| macromolecules | 1,147 |
| ligands | 77 |
| Protein residues | 145 |
| R.M.S. deviations | |
| bond lengths (Å) | 0.009 |
| angles (°) | 0.97 |
| Ramachandran favored (%) | 98 |
| Ramachandran allowed (%) | 2 |
| Ramachandran outliers (%) | 0 |
| Rotamer outliers (%) | 0 |
| Clashscore | 3.30 |
| Average B-factor (overall) | 28.7 |
| protein | 28.1 |
| ligands | 35.1 |
| solvent | 36.3 |
Extended Data Table 3. Expression and purification conditions.
| Protein | Expression | Buffer A | Buffer B |
|---|---|---|---|
| Bs ClpC | 37°C, 3h | 25 mM Tris pH 7.5, 300 mM NaCl | 25 mM Tris pH 7.5, 300 mM NaCl |
| Bs ClpCDWB | 37°C, 3h | 25 mM Tris pH 8, 300 mM NaCl | 25 mM Tris pH 7.5, 300 mM NaCl |
| Bs ClpCNTD | 37°C, 2h | 25 mM Tris pH 8.5, 150 mM NaCl, 1 mM TCEP | 5 mM Tris pH 8.5, 50 mM NaCl, 1 mM TCEP |
| Ec ClpANTD | 37°C, 2h | 25 mM Tris pH 8.5, 150 mM NaCl, 1 mM TCEP | 5 mM Tris pH 8.5, 50 mM NaCl, 1 mM TCEP |
| Bs ClpP | 37°C, 3h | 25 mM Tris pH 7.5, 150 mM NaCl, 10% glycerol | 25 mM Tris pH 7.5, 150 mM NaCl, 10% glycerol |
| Bs McsA | 20°C, 5h | 25 mM Tris pH 7.5, 300 mM NaCl, TCEP 1 mM | 25 mM Tris pH 7.5, 100 mM NaCl, TCEP 1 mM |
| Bs McsB | 18°C, O/N | 25 mM Tris pH 7.5, 300 mM KCl | 25 mM Tris pH 7.5, 50 mM KCl |
| Bs McsBE212A | 18°C, O/N | 25 mM Tris pH 7.5, 300 mM KCl | 25 mM Tris pH 7.5, 50 mM KCl |
| Gs McsB | 37°C, 3h | 25 mM Hepes pH 7.5, 300 mM KCl | 25 mM Hepes pH 7.5, 100 mM KCl |
| Gs McsBE122A | 18°C, O/N | 50 mM Tris pH 7.5, 50 mM NaCl | 50 mM Tris pH 7.5, 50 mM NaCl |
| Bs MecA | 25°C, 5h | 25 mM Hepes pH 8, 300 mM KCl | 25 mM Hepes pH 8, 300 mM KCl |
| Gs YwlE | 37°C, 3h | 25 mM Tris pH 7.5, 300 mM NaCl | 25 mM Tris pH 7.5, 100 mM NaCl |
| Gs YwlED118N | 37°C, 3h | 25 mM Tris pH 7.5, 300 mM NaCl | 25 mM Tris pH 7.5, 100 mM NaCl |
Bs: Bacillus subtilis, Ec: Escherichia coli, Gs: Geobacillus stearothermophilus, O/N: overnight
Acknowledgements
We thank E. Charpentier for providing B. subtilis strains and plasmids, S. Spiess for advice on B. subtilis genetic manipulation, G. Dürnberger for assistance with statistical analysis, A. Schmidt for help with mass spectrometry interpretation, R. Beveridge for performing native mass spectrometry analysis, J. Kley for help with ITC experiments and G. Bourenkov and T. Schneider at DESY for assistance during data collection. This work was supported by the Austrian Research Promotion Agency (FFG). The IMP is funded by Boehringer Ingelheim.
Footnotes
Author Contributions D.B.T. performed mass spectrometry and biochemical experiments; M.J.S. performed the structural analysis and biochemical experiments; A.H. and R.K. performed in vivo complementation assays and biochemical experiments; L.D. assisted with biochemical experiments; T.C. designed the study with expert assistance from K.M. for the mass spectrometry part; D.B.T., M.J.S. and T.C. wrote the manuscript, with contributions from all authors.
Author Information Atomic coordinates and structure factors have been deposited in the Protein Data Bank (PDB) under accession code 5HBN. The mass spectrometry data have been deposited to the ProteomeXchange Consortium (http://proteomecentral.proteomexchange.org) with the dataset identifier PXD003305.
Reprints and permissions information is available at www.nature.com/reprints.
The authors declare no competing financial interests.
Readers are welcome to comment on the online version of the paper.
Reviewer Information Nature thanks S. Gygi, Y. Shi and the other anonymous reviewer(s) for their contribution to the peer review of this work.
References
- 1.Goldberg AL. The mechanism and functions of ATP-dependent proteases in bacterial and animal cells. Eur J Biochem. 1992;203:9–23. doi: 10.1111/j.1432-1033.1992.tb19822.x. [DOI] [PubMed] [Google Scholar]
- 2.Löwe J, et al. Crystal structure of the 20S proteasome from the archaeon T. acidophilum at 3.4 A resolution. Science. 1995;268:533–539. doi: 10.1126/science.7725097. [DOI] [PubMed] [Google Scholar]
- 3.Glickman MH, et al. A subcomplex of the proteasome regulatory particle required for ubiquitin-conjugate degradation and related to the COP9-signalosome and eIF3. Cell. 1998;94:615–623. doi: 10.1016/s0092-8674(00)81603-7. [DOI] [PubMed] [Google Scholar]
- 4.Elsasser S, Finley D. Delivery of ubiquitinated substrates to protein-unfolding machines. Nat Cell Biol. 2005;7:742–749. doi: 10.1038/ncb0805-742. [DOI] [PubMed] [Google Scholar]
- 5.Kerscher O, Felberbaum R, Hochstrasser M. Modification of proteins by ubiquitin and ubiquitin-like proteins. Annu Rev Cell Dev Biol. 2006;22:159–180. doi: 10.1146/annurev.cellbio.22.010605.093503. [DOI] [PubMed] [Google Scholar]
- 6.Finley D. Recognition and processing of ubiquitin-protein conjugates by the proteasome. Annu Rev Biochem. 2009;78:477–513. doi: 10.1146/annurev.biochem.78.081507.101607. [DOI] [PMC free article] [PubMed] [Google Scholar]
- 7.Burns KE, Liu WT, Boshoff HI, Dorrestein PC, Barry CE. III. Proteasomal protein degradation in Mycobacteria is dependent upon a prokaryotic ubiquitin-like protein. J Biol Chem. 2009;284:3069–3075. doi: 10.1074/jbc.M808032200. [DOI] [PMC free article] [PubMed] [Google Scholar]
- 8.Pearce MJ, Mintseris J, Ferreyra J, Gygi SP, Darwin KH. Ubiquitin-like protein involved in the proteasome pathway of Mycobacterium tuberculosis. Science. 2008;322:1104–1107. doi: 10.1126/science.1163885. [DOI] [PMC free article] [PubMed] [Google Scholar]
- 9.Battesti A, Gottesman S. Roles of adaptor proteins in regulation of bacterial proteolysis. Curr Opin Microbiol. 2013;16:140–147. doi: 10.1016/j.mib.2013.01.002. [DOI] [PMC free article] [PubMed] [Google Scholar]
- 10.Flynn JM, Neher SB, Kim YI, Sauer RT, Baker TA. Proteomic discovery of cellular substrates of the ClpXP protease reveals five classes of ClpX-recognition signals. Mol Cell. 2003;11:671–683. doi: 10.1016/s1097-2765(03)00060-1. [DOI] [PubMed] [Google Scholar]
- 11.Sauer RT, Baker TA. AAA+ proteases: ATP-fueled machines of protein destruction. Annu Rev Biochem. 2011;80:587–612. doi: 10.1146/annurev-biochem-060408-172623. [DOI] [PubMed] [Google Scholar]
- 12.Keiler KC, Waller PR, Sauer RT. Role of a peptide tagging system in degradation of proteins synthesized from damaged messenger RNA. Science. 1996;271:990–993. doi: 10.1126/science.271.5251.990. [DOI] [PubMed] [Google Scholar]
- 13.Fuhrmann J, et al. McsB is a protein arginine kinase that phosphorylates and inhibits the heat-shock regulator CtsR. Science. 2009;324:1323–1327. doi: 10.1126/science.1170088. [DOI] [PubMed] [Google Scholar]
- 14.Krüger E, Zühlke D, Witt E, Ludwig H, Hecker M. Clp-mediated proteolysis in Gram-positive bacteria is autoregulated by the stability of a repressor. EMBO J. 2001;20:852–863. doi: 10.1093/emboj/20.4.852. [DOI] [PMC free article] [PubMed] [Google Scholar]
- 15.Schmidt A, et al. Quantitative phosphoproteomics reveals the role of protein arginine phosphorylation in the bacterial stress response. Mol Cell Proteomics. 2014;13:537–550. doi: 10.1074/mcp.M113.032292. [DOI] [PMC free article] [PubMed] [Google Scholar]
- 16.Derré I, Rapoport G, Msadek T. CtsR, a novel regulator of stress and heat shock response, controls clp and molecular chaperone gene expression in gram-positive bacteria. Mol Microbiol. 1999;31:117–131. doi: 10.1046/j.1365-2958.1999.01152.x. [DOI] [PubMed] [Google Scholar]
- 17.Kirstein J, Dougan DA, Gerth U, Hecker M, Turgay K. The tyrosine kinase McsB is a regulated adaptor protein for ClpCP. EMBO J. 2007;26:2061–2070. doi: 10.1038/sj.emboj.7601655. [DOI] [PMC free article] [PubMed] [Google Scholar]
- 18.Elsholz AK, Michalik S, Zühlke D, Hecker M, Gerth U. CtsR, the Gram-positive master regulator of protein quality control, feels the heat. EMBO J. 2010;29:3621–3629. doi: 10.1038/emboj.2010.228. [DOI] [PMC free article] [PubMed] [Google Scholar]
- 19.Elsholz AK, et al. Global impact of protein arginine phosphorylation on the physiology of Bacillus subtilis. Proc Natl Acad Sci USA. 2012;109:7451–7456. doi: 10.1073/pnas.1117483109. [DOI] [PMC free article] [PubMed] [Google Scholar]
- 20.Boisvert FM, Chénard CA, Richard S. Protein interfaces in signaling regulated by arginine methylation. Sci STKE. 2005;2005:re2. doi: 10.1126/stke.2712005re2. [DOI] [PubMed] [Google Scholar]
- 21.Feng J, et al. Trapping and proteomic identification of cellular substrates of the ClpP protease in Staphylococcus aureus. J Proteome Res. 2013;12:547–558. doi: 10.1021/pr300394r. [DOI] [PubMed] [Google Scholar]
- 22.Miethke M, Hecker M, Gerth U. Involvement of Bacillus subtilis ClpE in CtsR degradation and protein quality control. J Bacteriol. 2006;188:4610–4619. doi: 10.1128/JB.00287-06. [DOI] [PMC free article] [PubMed] [Google Scholar]
- 23.Derré I, Rapoport G, Msadek T. The CtsR regulator of stress response is active as a dimer and specifically degraded in vivo at 37 degrees C. Mol Microbiol. 2000;38:335–347. doi: 10.1046/j.1365-2958.2000.02124.x. [DOI] [PubMed] [Google Scholar]
- 24.Fuhrmann J, et al. Structural basis for recognizing phosphoarginine and evolving residue-specific protein phosphatases in Gram-positive bacteria. Cell Reports. 2013;3:1832–1839. doi: 10.1016/j.celrep.2013.05.023. [DOI] [PubMed] [Google Scholar]
- 25.Trentini DB, Fuhrmann J, Mechtler K, Clausen T. Chasing phosphoarginine proteins: development of a selective enrichment method using a phosphatase trap. Mol Cell Proteomics. 2014;13:1953–1964. doi: 10.1074/mcp.O113.035790. [DOI] [PMC free article] [PubMed] [Google Scholar]
- 26.Schlothauer T, Mogk A, Dougan DA, Bukau B, Turgay K. MecA, an adaptor protein necessary for ClpC chaperone activity. Proc Natl Acad Sci USA. 2003;100:2306–2311. doi: 10.1073/pnas.0535717100. [DOI] [PMC free article] [PubMed] [Google Scholar]
- 27.Kirstein J, Zühlke D, Gerth U, Turgay K, Hecker M. A tyrosine kinase and its activator control the activity of the CtsR heat shock repressor in B. subtilis. EMBO J. 2005;24:3435–3445. doi: 10.1038/sj.emboj.7600780. [DOI] [PMC free article] [PubMed] [Google Scholar]
- 28.Kojetin DJ, et al. Structural and motional contributions of the Bacillus subtilis ClpC N-domain to adaptor protein interactions. J Mol Biol. 2009;387:639–652. doi: 10.1016/j.jmb.2009.01.046. [DOI] [PMC free article] [PubMed] [Google Scholar]
- 29.Wang F, et al. Structure and mechanism of the hexameric MecA-ClpC molecular machine. Nature. 2011;471:331–335. doi: 10.1038/nature09780. [DOI] [PubMed] [Google Scholar]
- 30.Woo KM, Kim KI, Goldberg AL, Ha DB, Chung CH. The heat-shock protein ClpB in Escherichia coli is a protein-activated ATPase. J Biol Chem. 1992;267:20429–20434. [PubMed] [Google Scholar]
- 31.Hagai T, Levy Y. Ubiquitin not only serves as a tag but also assists degradation by inducing protein unfolding. Proc Natl Acad Sci USA. 2010;107:2001–2006. doi: 10.1073/pnas.0912335107. [DOI] [PMC free article] [PubMed] [Google Scholar]
- 32.Kirstein J, et al. Adaptor protein controlled oligomerization activates the AAA+ protein ClpC. EMBO J. 2006;25:1481–1491. doi: 10.1038/sj.emboj.7601042. [DOI] [PMC free article] [PubMed] [Google Scholar]
- 33.Stannek L, Gunka K, Care RA, Gerth U, Commichau FM. Factors that mediate and prevent degradation of the inactive and unstable GudB protein in Bacillus subtilis. Front Microbiol. 2015;5:758. doi: 10.3389/fmicb.2014.00758. [DOI] [PMC free article] [PubMed] [Google Scholar]
- 34.Chan P, Curtis RA, Warwicker J. Soluble expression of proteins correlates with a lack of positively-charged surface. Sci Rep. 2013;3 doi: 10.1038/srep03333. 3333. [DOI] [PMC free article] [PubMed] [Google Scholar]
- 35.Nguyen HD, et al. Construction of plasmid-based expression vectors for Bacillus subtilis exhibiting full structural stability. Plasmid. 2005;54:241–248. doi: 10.1016/j.plasmid.2005.05.001. [DOI] [PubMed] [Google Scholar]
- 36.Gerth U, et al. Fine-tuning in regulation of Clp protein content in Bacillus subtilis. J Bacteriol. 2004;186:179–191. doi: 10.1128/JB.186.1.179-191.2004. [DOI] [PMC free article] [PubMed] [Google Scholar]
- 37.Msadek T, et al. ClpP of Bacillus subtilis is required for competence development, motility, degradative enzyme synthesis, growth at high temperature and sporulation. Mol Microbiol. 1998;27:899–914. doi: 10.1046/j.1365-2958.1998.00735.x. [DOI] [PubMed] [Google Scholar]
- 38.Wiśniewski JR, Zougman A, Nagaraj N, Mann M. Universal sample preparation method for proteome analysis. Nat Methods. 2009;6:359–362. doi: 10.1038/nmeth.1322. [DOI] [PubMed] [Google Scholar]
- 39.Käll L, Canterbury JD, Weston J, Noble WS, MacCoss MJ. Semi-supervised learning for peptide identification from shotgun proteomics datasets. Nat Methods. 2007;4:923–925. doi: 10.1038/nmeth1113. [DOI] [PubMed] [Google Scholar]
- 40.Taus T, et al. Universal and confident phosphorylation site localization using phosphoRS. J Proteome Res. 2011;10:5354–5362. doi: 10.1021/pr200611n. [DOI] [PubMed] [Google Scholar]
- 41.Cox J, Mann M. MaxQuant enables high peptide identification rates, individualized p.p.b.-range mass accuracies and proteome-wide protein quantification. Nat Biotechnol. 2008;26:1367–1372. doi: 10.1038/nbt.1511. [DOI] [PubMed] [Google Scholar]
- 42.Cox J, et al. Andromeda: a peptide search engine integrated into the MaxQuant environment. J Proteome Res. 2011;10:1794–1805. doi: 10.1021/pr101065j. [DOI] [PubMed] [Google Scholar]
- 43.Cox J, et al. Accurate proteome-wide label-free quantification by delayed normalization and maximal peptide ratio extraction, termed MaxLFQ. Mol Cell Proteomics. 2014;13:2513–2526. doi: 10.1074/mcp.M113.031591. [DOI] [PMC free article] [PubMed] [Google Scholar]
- 44.Vizcaíno JA, et al. The PRoteomics IDEntifications (PRIDE) database and associated tools: status in 2013. Nucleic Acids Res. 2013;41:D1063–D1069. doi: 10.1093/nar/gks1262. [DOI] [PMC free article] [PubMed] [Google Scholar]
- 45.Suzuki Y, Takeda Y, Ikuta T. Immunoblotting conditions for human hemoglobin chains. Anal Biochem. 2008;378:218–220. doi: 10.1016/j.ab.2008.04.008. [DOI] [PMC free article] [PubMed] [Google Scholar]
- 46.Schneider CA, Rasband WS, Eliceiri KW. NIH Image to ImageJ: 25 years of image analysis. Nat Methods. 2012;9:671–675. doi: 10.1038/nmeth.2089. [DOI] [PMC free article] [PubMed] [Google Scholar]
- 47.Nørby JG. Coupled assay of Na+,K+-ATPase activity. Methods Enzymol. 1988;156:116–119. doi: 10.1016/0076-6879(88)56014-7. [DOI] [PubMed] [Google Scholar]
- 48.Kabsch W. Xds. Acta Crystallogr D. 2010;66:125–132. doi: 10.1107/S0907444909047337. [DOI] [PMC free article] [PubMed] [Google Scholar]
- 49.McCoy AJ, et al. Phaser crystallographic software. J Appl Crystallogr. 2007;40:658–674. doi: 10.1107/S0021889807021206. [DOI] [PMC free article] [PubMed] [Google Scholar]
- 50.Brünger AT, et al. Crystallography & NMR system: A new software suite for macromolecular structure determination. Acta Crystallogr D. 1998;54:905–921. doi: 10.1107/s0907444998003254. [DOI] [PubMed] [Google Scholar]
- 51.Terwilliger TC, et al. Iterative model building, structure refinement and density modification with the PHENIX AutoBuild wizard. Acta Crystallogr D. 2008;64:61–69. doi: 10.1107/S090744490705024X. [DOI] [PMC free article] [PubMed] [Google Scholar]
- 52.Emsley P, Cowtan K. Coot: model-building tools for molecular graphics. Acta Crystallogr D. 2004;60:2126–2132. doi: 10.1107/S0907444904019158. [DOI] [PubMed] [Google Scholar]
- 53.Emsley P, Lohkamp B, Scott WG, Cowtan K. Features and development of Coot. Acta Crystallogr D. 2010;66:486–501. doi: 10.1107/S0907444910007493. [DOI] [PMC free article] [PubMed] [Google Scholar]
- 54.Debreczeni JE, Emsley P. Handling ligands with Coot. Acta Crystallogr D. 2012;68:425–430. doi: 10.1107/S0907444912000200. [DOI] [PMC free article] [PubMed] [Google Scholar]
- 55.Moriarty NW, Grosse-Kunstleve RW, Adams PD. electronic Ligand Builder and Optimization Workbench (eLBOW): a tool for ligand coordinate and restraint generation. Acta Crystallogr D. 2009;65:1074–1080. doi: 10.1107/S0907444909029436. [DOI] [PMC free article] [PubMed] [Google Scholar]
- 56.Adams PD, et al. PHENIX: a comprehensive Python-based system for macromolecular structure solution. Acta Crystallogr D. 2010;66:213–221. doi: 10.1107/S0907444909052925. [DOI] [PMC free article] [PubMed] [Google Scholar]
- 57.Schrodinger, LLC. The PyMOL Molecular Graphics System v.1.3r1. 2010.
- 58.Lee BG, et al. Structures of ClpP in complex with acyldepsipeptide antibiotics reveal its activation mechanism. Nat Struct Mol Biol. 2010;17:471–478. doi: 10.1038/nsmb.1787. [DOI] [PubMed] [Google Scholar]
- 59.Waksman G, Shoelson SE, Pant N, Cowburn D, Kuriyan J. Binding of a high affinity phosphotyrosyl peptide to the Src SH2 domain: crystal structures of the complexed and peptide-free forms. Cell. 1993;72:779–790. doi: 10.1016/0092-8674(93)90405-f. [DOI] [PubMed] [Google Scholar]
- 60.Rittinger K, et al. Structural analysis of 14-3-3 phosphopeptide complexes identifies a dual role for the nuclear export signal of 14-3-3 in ligand binding. Mol Cell. 1999;4:153–166. doi: 10.1016/s1097-2765(00)80363-9. [DOI] [PubMed] [Google Scholar]


