Abstract
Reliable information processing is a hallmark of many physical and biological networked systems. In this paper, we propose a novel framework for modelling information transmission within a linear dynamical network. Information propagation is modelled by means of a digital communication protocol that takes into account the realistic phenomenon of inter-symbol interference. Building on this framework, we adopt Shannon information rate to quantify the amount of information that can be reliably sent over the network within a fixed time window. We investigate how the latter information metric is affected by the connectivity structure of the network. Here, we focus in particular on networks characterized by a normal adjacency matrix. We show that for such networks the maximum achievable information rate depends only on the spectrum of the adjacency matrix. We then provide numerical results suggesting that non-normal network architectures could benefit information transmission in our framework.
Index Terms: Linear dynamical networks, information transmission over networks, digital communication, Shannon capacity, normal networks, matrix non-normality
I. Introduction
A wide range of natural and engineered phenomena can be modelled as networks of interacting dynamical units. These units typically communicate with each other in order to accomplish some common goal. Seamless and profitable cooperation among units requires a robust and effective information transmission infrastructure at network level, especially in the presence of noise. Understanding how a network can enable efficient propagation of information across its units represents a central problem in many areas of engineering, biology and social sciences (see for instance [1]–[3], to cite just a few recent surveys). Perhaps, the most emblematic example is provided by the human brain wherein single neurons (or populations of neurons) are continuously rebroadcasting the information they receive to neighboring (populations of) neurons, in order to collectively execute complex tasks [4]–[6]. Unraveling the fundamental network principles at the core of efficient information transmission between neurons (or brain areas) is a current key challenge in neuroscience [3], [7]–[12].
In this paper, we propose a novel framework for modelling digital communication and quantifying the amount of information that can reliably be propagated through networks of linear dynamical units. Our approach builds upon the assumption that information is transmitted periodically through the network and encoded in the impulse response of the system. Whenever the network units retain some memory of their previous states, past transmissions interfere with the current signal being transmitted, thereby limiting the amount of information that the network can reliably process. In contrast to other communication models proposed in the literature [13], [14], we explicitly incorporate this interference phenomenon in our model. We measure the efficiency of information transmission via Shannon’s information rate and investigate how the structure of the network, described by its adjacency matrix, affects the latter information metric. Our primary aim is to dissect information transmission performance for the class of normal networks, i.e., networks characterized by a normal adjacency matrix. In particular, we show that, for such class of networks, the maximum achievable information rate is determined solely by the spectrum of the network adjacency matrix. Finally, numerical results seem to suggest that network non-normality could represent a valuable feature for enhancing the information transmission performance of a network. This corroborates recent works that have highlighted the beneficial role of matrix non-normality for the short-term memory storage in neuronal networks [15], [16] and in the controllability of large-scale networks [17], [18].
Notation: Given a matrix A ∈ ℂn×n, A⊤ and A* denote the transpose and Hermitian conjugate of A, respectively. tr(A) and det(A) stand for the trace and determinant of A ∈ ℂn×n, respectively. A ∈ ℂn×n is said to be Hurwitz stable if all the eigenvalues of A have strictly negative real part. A ∈ ℂn×n is said to be normal if AA* = A*A, otherwise A is said to be non-normal. We write A ≥ 0 (A > 0) to mean that the (Hermitian) matrix A ∈ ℂn×n is positive semidefinite (positive definite, resp.). We denote by 𝒢 = (𝒱, ℰ) the (directed) graph with vertex (or node) set 𝒱 = {1, 2, …, n} and edge set ℰ ⊆ 𝒱 × 𝒱. The (weighted) adjacency matrix A ∈ ℝn×n corresponding to the graph ℊ satisfies Aij ≠ 0 iff (j, i) ∈ ℰ, where Aij denotes the (i, j)-th entry of A. 𝒩 (µ, Σ) denotes the n-dimensional Gaussian distribution with mean µ ∈ ℝn and covariance Σ ∈ ℝn×n, Σ ≥ 0. 𝔼[·] stands for the expectation of a random variable. denotes the Hilbert space of p-dimensional square integrable functions in [t1, t2], t2 > t1, equipped with the inner product Symbol δ(t) stands for the Dirac delta function and 1(t) is the step function, i.e., 1(t) = 0 for t < 0 and 1(t) = 1 for t ≥ 0.
We inform the reader that the present paper only reports some preliminary results. In particular, due to space limitation, some of the original proofs (specifically, proofs of Theorem 1, Theorem 2, and Corollary 1) have been omitted and will appear in a forthcoming and more complete publication.
II. Modelling information transmission in dynamical networks
We consider a continuous-time linear time-invariant dynamical system of the form
| (1) |
| (2) |
where x(t) ∈ ℝn denotes the state vector, u(t) ∈ ℝm the input vector, and y(t) ∈ ℝp the output vector at time t ≥ 0. A ∈ ℝn×n, B ∈ ℝn×m, and C ∈ ℝp×n denote the state, input, and output matrix, respectively. Throughout the paper, we will consider stable systems, namely systems where A is (Hurwitz) stable.
We interpret the dynamics expressed by (1)-(2) as those of a network, whose weighted adjacency matrix A corresponds to a directed graph ℊ = (𝒱, ℰ). We structure B and C so as to single out two subsets of nodes 𝒦 ⊆ 𝒱 and 𝒯 ⊆ 𝒱, respectively:
where denotes the canonical vectors in ℝn and
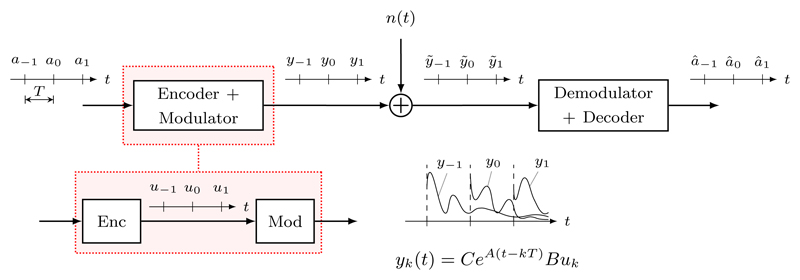
We model network information transmission by means of the digital communication protocol illustrated in the block diagram of Fig. 1. More precisely, we suppose that transmission occurs periodically every t = kT, T > 0, k ∈ ℤ. T represents the transmission or sampling time of the communication channel. The to-be-transmitted piece of information is represented by a symbol ak belonging to some alphabet 𝒜 of finite cardinality. This symbol is mapped, through a suitable encoding procedure, to a vector uk ∈ ℝm (the input codeword). This vector then acts as an impulsive input u(t) = ukδ(t) that transiently excites the linear dynamical system in (1)-(2). The subsequent evolution of the system in the time interval [kT, (k + 1)T] constitutes the modulation stage of the protocol. In digital communication theory, a modulator is a function mapping a discrete symbol to a continuous-time trajectory. In our case, the modulator maps the input impulse into the p-dimensional square-integrable impulse response
generated by the dynamical system (1)-(2). After this stage, the modulated signal is sent, via an additive white Gaussian noise (AWGN) channel, to the receiver. At the receiver side, the corrupted trajectory ỹk(t) = yk(t) + n(t), with n(t) ∼ 𝒩(0, σ2I), 𝔼[n(t)n⊤ (s)] = σ2Iδ(t − s), for all t, s ∈ ℝ, is first demodulated and then decoded in order to obtain an estimate âk of the transmitted symbol.
Fig. 1.
Block diagram representation of the digital communication protocol considered in this paper.
A crucial feature of our model relies on the fact that the memory of the system cannot be instantaneously erased at the end of every transmission.1 This implies that previous modulated waveforms interfere with the waveform of the currently transmitted symbol, as depicted in the bottom of Fig. 1. In digital communication jargon, this phenomenon is known as inter-symbol interference (ISI). More precisely, for a transmission occurring at time t = 0, the “interference term” in our model is the sum of contributions in the time window [0, T ] made by modulated waveforms left over from previous transmissions at times t = −kT, k ∈ ℤ, k > 1:
| (3) |
In the next section, we develop a metric for quantifying information transmission performance within the digital communication framework introduced above.
III. An information transmission metric
To measure the “efficiency” of information transmission over the previously described noisy digital communication channel, we turn to the notion of Shannon information rate, defined as
| (4) |
where 𝒞 denotes the Shannon capacity of the channel and T > 0 is the finite transmission time. We recall that Shannon capacity 𝒞 provides a tight upper bound on the number of bits per input symbol that can be sent reliably, i.e., with arbitrarily small decoding error probability, over the channel [19, Ch. 7]. Consequently, ℛ measures the amount of information that can be sent reliably over the channel within a fixed transmission time interval. With reference to the communication channel described in the previous section, we will exploit the following additional assumptions:
-
A1)
the available power at the sender just before the modulation stage is limited by P > 0, namely ‖uk‖2 ≤ P, k ∈ ℤ;
-
A2)
sufficiently many messages have been sent at the time of current transmission, such that the distribution of interference terms has reached an equilibrium;
-
A3)
the input codebook is the same at every transmission and input codewords corresponding to different transmissions are independent of each other;
-
A4)
the noise n(t) is independent of current and past input codewords.
Under these assumptions, we have the following result.
Theorem 1 (Shannon information rate): The Shannon information rate of the communication channel described in Sec. II under the input power constraint P > 0 is given by
| (5) |
where denotes the [0, T ]-observability Gramian of the pair (A, C) and denotes the discrete-time controllability Gramian of the pair (eAT, BΣ1/2).
From the expression of ℛ in (5), we note that the computation of the information rate boils down to solving a (generally non-convex) optimization problem over the space of positive semi-definite m × m matrices with trace less or equal than one. Further, it is worth observing that the numerator det(σ2I + 𝒪𝒲) can be thought of as a volumetric measure of the “energy” of the corrupted modulated signal ỹ(t) in [0, T ], whereas the denominator det (σ2I + 𝒪(𝒲 − BΣB⊤)) can be thought of as a volumetric measure of the “energy” of the overall channel noise in [0, T], consisting of the sum of the interference term i(t) and the background noise n(t).
IV. Preliminary results
In this section, we present a number of auxiliary results concerning the simplification and monotonicity of the information rate formula derived in the previous section.
The first result asserts that in the maximization problem in Eq. (5), the maximizer always saturates the input power constraint.
Lemma 1 (Optimal Σ has trace equal to P): Consider the information rate in (5). It holds
Proof: Let us define
We will show that α ∈ ℝ, α > 0. This implies that f(αΣ) is a monotonically increasing function of α > 0, so that the optimal Σ maximizing f(Σ) under the constraint tr Σ ≤ P must satisfy the latter constraint with equality. To this end, we have
where denotes the ordered eigenvalues of 𝒪1/2𝒲𝒪1/2 and 𝒪1/2(𝒲 − BΣB⊤)𝒪1/2, respectively. Taking the derivative of the previous expression w.r.t. α, we get
Since 𝒪1/2𝒲𝒪1/2 ≥ 𝒪1/2(𝒲 − BΣB⊤)𝒪1/2, then λi ≥ µi, i = 1, 2, …, n. This implies that
and this ends the proof.
Another interesting property of ℛ is described in the following lemma.
Lemma 2 (Scaling invariance of ℛ w.r.t. P and σ2): Consider the information rate in (5). For all α ∈ ℝ, α > 0, it holds
where we made explicit the dependence of ℛ on P and σ2.
Proof: First observe that if we replace Σ and σ2 by αΣ and ασ2, respectively, then the Gramian 𝒲 is replaced by α𝒲. This in turn implies that the value of
is not affected by this change of variables. If Σ⋆ is the input covariance maximizing f (Σ, σ2) under the constraint tr Σ ≤ P, it holds
| (6) |
On the other hand, let Σ⋆⋆ now denote the input covariance maximizing f (Σ, ασ2) under the constraint tr Σ ≤ αP. It holds
| (7) |
Eventually, a combination of (6) and (7) yields ℛ(αP, ασ2) = ℛ(P, σ2).
As a consequence of Lemmas 1 and 2, we have that ℛ can be equivalently written in a more simplified form as
| (8) |
where the input power constraint has been normalized to one and the symbol SNR ≔ P/σ2 denotes the signal-to-noise ratio of the communication channel.
We conclude this section with a monotonicity result on the structure of the input and output node subsets.
Proposition 1 (Monotonicity of ℛ w.r.t. 𝒦 and 𝒯): Let 𝒦1, 𝒦2 ⊆ 𝒱 be two input nodes subsets and 𝒯1, 𝒯2 ⊆ 𝒱 be two output nodes subsets. Suppose that the pair (A, C𝒯i), i = 1, 2, is observable, where C𝒯i denotes the output matrix corresponding to subset 𝒯i. If 𝒦1 ⊆ 𝒦2 and 𝒯1 ⊆ 𝒯2, then
where we made explicit the dependence of ℛ on the input subset 𝒦 and output subset 𝒯.
Proof: Let 𝒦 and 𝒯 be two input and output node subsets and let ℬ𝒦 and C𝒯 denote the corresponding input and output matrices. Let us define
where Under the assumption that the pair (A,C𝒯) is observable (which in turn implies that is non-singular), it is possible to rewrite f(Σ, 𝒦, 𝒯) as
| (9) |
Since 𝒯1 ⊆ 𝒯2 we first note that 𝒪𝒯1 ≤ 𝒪𝒯2. We have the following chain of implications
where In view of (9), the latter inequality in turn implies that
| (10) |
Next, let us define 𝒮i ≔ {Σ𝒦i : Σ ≥ 0, tr Σ = 1}, i = 1, 2. Since 𝒦1 ⊆ 𝒦2, we have 𝒮1 ⊆ 𝒮2. By combining the latter fact with inequality (10),
and this concludes the proof.
Remark 1: It is worth observing that the previous proposition in particular implies that ℛ(𝒦1, 𝒯1) ≤ ℛ (𝒱, 𝒱). This means then the maximum information rate is always attained by choosing all network nodes as input and output nodes.
V. Analysis of network information rate
In this section, we investigate how the connectivity structure of the network, encoded by matrix A, affects the information rate ℛ introduced in Sec. II. We start by analyzing the simplest possible case, i.e., the case of scalar A, and then we move to the case of normal A.
A. Scalar case
When n = 1, the simplified expression of ℛ in (8) reduces to
| (11) |
where B = C = 1 and A = −a, a ∈ ℝ, a > 0, in view of stability. In this case, ℛ is a monotonically decreasing function of the transmission time T. Hence, the optimal value of ℛ is attained for T → 0 and is equal to
| (12) |
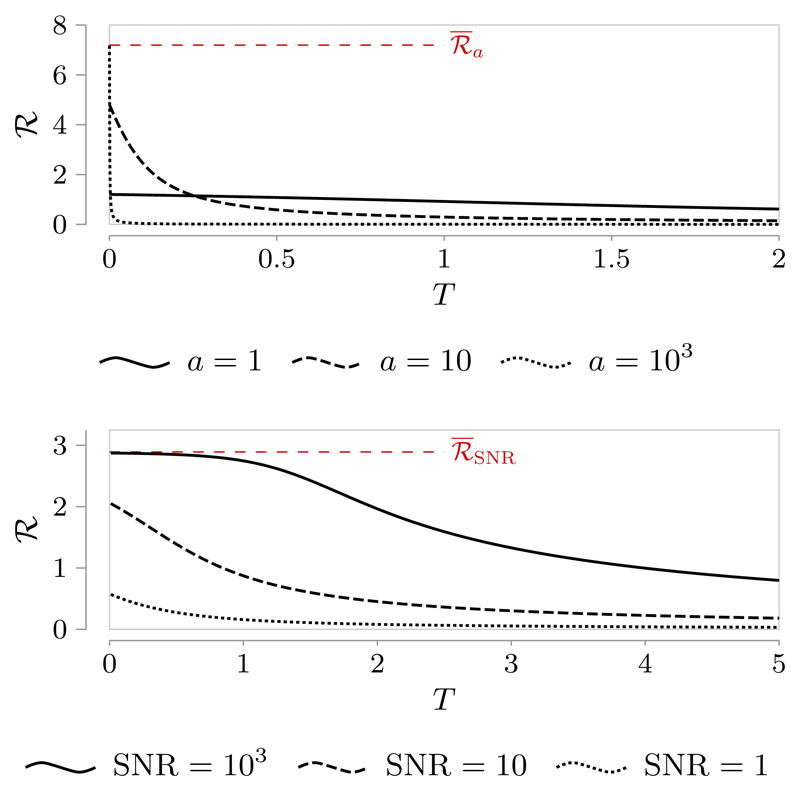
The latter quantity is a monotonically increasing function of a, so that its maximum value is attained for a → ∞ and is equal to (see also the top plot of Fig. 2). Intuitively, for small values of a and T the ISI term becomes large enough to be detrimental for the rate. Lastly, as SNR increases, ℛ in (11) increases as well until it saturates to the limit value (see also the bottom plot of Fig. 2). Again, this finite upper bound is due to the ISI term which penalizes the transmission performance even in presence of vanishing background noise.
Fig. 2.
Plots of ℛ against transmission time T in the scalar case (n = 1). Top plot: SNR = 10. Bottom plot: a = 2. The dashed red line denotes the limit values
B. Normal network case
We derive here an explicit expression for the information rate of normal networks. We suppose that the dynamical network is fully controllable (𝒦 = 𝒱) and fully observable (𝒯 = 𝒱). The next result asserts that the information rate of a n × n normal network can be decoupled in the sum of the information rates of n independent scalar channels whose behavior depends on the eigenvalues of A.
Theorem 2 (Information rate for normal networks): If 𝒦 = 𝒯 = 𝒱 and A ∈ ℝn×n is a normal and stable matrix with eigenvalues then
| (13) |
with SNRi ≔ Pi/σ2 and
| (14) |
From the above theorem we have the following interesting corollary.
Corollary 1 (Optimal rate for normal networks): If 𝒦 = 𝒯 = 𝒱 and A ∈ ℝn×n is a normal and stable matrix, then the maximum of ℛ is achieved for T → 0 and the optimal signal-to-noise ratio allocation is
which yields
| (15) |
It is worth pointing out that the expression in (15) coincides with the maximum information rate derived for the scalar case in (12), after replacing a with − tr A. Therefore, the same considerations made for the scalar case hold also for the normal case.
Remark 2: In light of Proposition 1 and Remark 1, the results in this subsection (Theorem 2 and Corollary 1) can be also interpreted as fundamental limitations for the information rate of normal networks regardless of the choice of 𝒦 and 𝒯. Specifically, (13) provides an upper bound to the achievable information rate of any normal network w.r.t. any choice of input and output node subsets 𝒦, 𝒯. Furthermore, the expression of ℛmax in (15) corresponds to the maximum information rate that can be attained by a network described by a normal matrix A for a given SNR level. Observe also that in the ideal scenario of infinite SNR, the optimal information rate reduces to
VI. Numerical examples
To illustrate the results outlined in the previous section, we consider the following n-dimensional Toeplitz line network  described by the adjacency matrix
| (16) |
with α, β, γ > 0 such that γ > 2β to ensure stability. The parameter α > 0 regulates the “anisotropy” of the network, so that it can be thought of as an index of network non-normality.
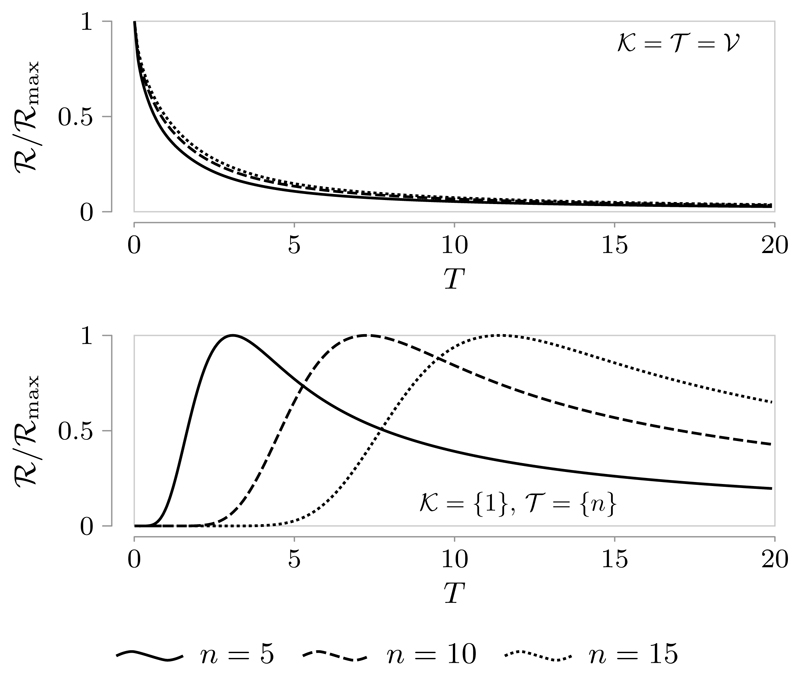
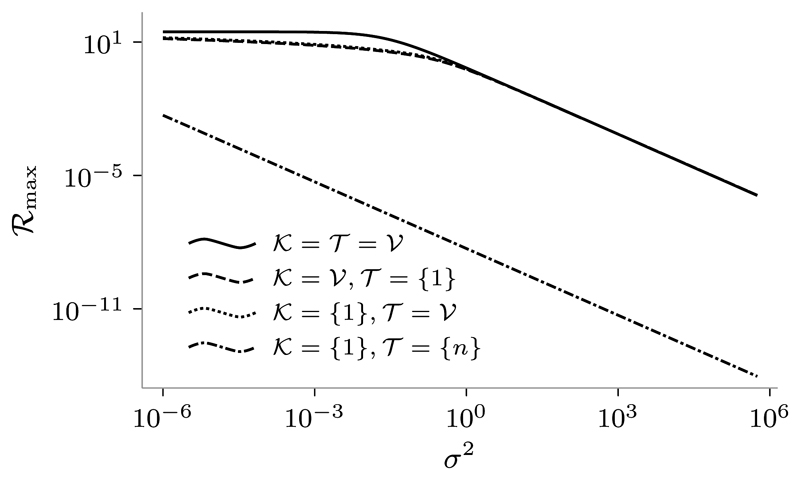
We first focus on the normal case, i.e., we set α = 1. In Figure 3 the “normalized” time behavior of ℛ for unit SNR and different values of n is illustrated. From this figure, it is worth noticing that in the fully observable and fully controllable case (𝒦 = 𝒯 = 𝒱) ℛ is a monotonically decreasing function of T, in agreement with the expression derived in Theorem 2 (top plot); whilst the monotonic behavior breaks down if the input and output nodes are selected to be the most distanced ones (𝒦 = {1}, 𝒯 = {n}), in that the information rate exhibits a peak for an optimal T different from zero (bottom plot). Further, observe that the latter optimal transmission time scales proportionally to n. Figure 4 displays the behavior of ℛmax = maxT≥0 ℛ against the noise variance σ2 for a unit input power constraint, n = 8 and four different choices of 𝒦 and 𝒯. From the plot, it can be noticed that the upper bound in Corollary 1 (obtained by choosing 𝒦 = 𝒯 = 𝒱) is quite tight in case 𝒦 = {1}, 𝒯 = 𝒱 and 𝒦 = 𝒱, 𝒯 = {1}, whereas it becomes rather uninformative in case of most distanced input and output nodes, i.e., 𝒦 = {1}, 𝒯 = {n}.
Fig. 3.
Normalized plots of ℛ against transmission time T for the line network in (16) with SNR = 1, α = 1, β = 1, and γ = 2.5. Top plot: 𝒦 = 𝒯 = 𝒱. Bottom plot: 𝒦 = {1}, 𝒦 = {n}. Notice that the curves obtained for 𝒦 = 𝒯 = 𝒱 coincides (up to a normalization factor) with the ones of the scalar case in Fig. 2, after replacing a with −tr A.
Fig. 4.
Logarithmic plot of ℛmax against σ2 for P = 1 and different choices of 𝒦 and 𝒯 for the line network in (16) with n = 8, α = 1, β = 1 and γ = 2.5. The curves obtained for 𝒦 = 𝒱, 𝒯 = {1} (dashed line) and 𝒦 = {1}, 𝒯 = 𝒱 (dotted line) are almost overlapping.
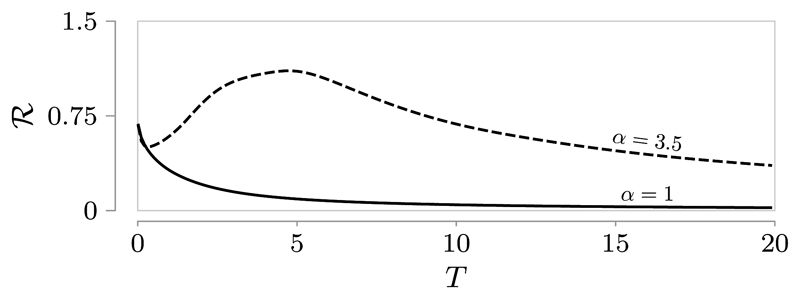
In Fig. 5 we compared the behavior of ℛ for a normal network (α = 1) and a non-normal one (α = 3.5) in the fully observable and fully controllable case. From the figure, two important observations can be made: (i) in the non-normal network case the optimal transmission time is different from zero, even though 𝒦 = 𝒯 = 𝒱; (ii) the value of ℛmax in the non-normal case is higher that the one obtained in the normal case, even though the two network matrices share the same spectrum. The latter fact in particular suggests that non-normality could represent a valuable feature for increasing the information transmission performance of a network.
Fig. 5.
Plot of ℛ against transmission time T for the line network in (16) with n = 10, SNR = 1, β = 1, γ = 2.5 and two different values of α.
VII. Concluding remarks and perspectives
In this work, we have proposed a new communication framework to describe the propagation of information in networks of interconnected linear dynamical systems. We measured information transmission performance by means of the Shannon information rate, and analyzed how the connectivity structure of the network influences this information metric. We proved that for a normal network, the information rate is entirely determined by the eigenvalues of the adjacency matrix (Theorem 2 and Corollary 1). We validated our theoretical results with a simple yet paradigmatic numerical example, which further suggested that network non-normality could substantially enhance the quality of information transmission. Further research is needed to better explore this conjecture. This could be done by specifically investigating how network diameter, recently shown to be related to the non-normality of the adjacency matrix [20], affects the Shannon information rate.
Footnotes
This phenomenon arises naturally in any physical network whose units retain some memory of their previous state, e.g. in a neuronal network [6].
Contributor Information
Giacomo Baggio, Department of Mechanical Engineering, University of California at Riverside, Riverside, CA, USA.
Virginia Rutten, Computational and Biological Learning Lab, Department of Engineering, University of Cambridge, Cambridge, UK and the Gatsby Computational Neuroscience Unit, University College London, London, UK.
Guillaume Hennequin, Computational and Biological Learning Lab, Department of Engineering, University of Cambridge, Cambridge, UK.
Sandro Zampieri, Dipartimento di Ingegneria dell’Informazione, Università di Padova, Padova, Italy.
References
- [1].Tkačik G, Walczak AM. Information transmission in genetic regulatory networks: a review. J Phys Condens Matter. 2011;23(15):153102. doi: 10.1088/0953-8984/23/15/153102. [DOI] [PubMed] [Google Scholar]
- [2].Guille A, Hacid H, Favre C, Zighed DA. Information diffusion in online social networks: A survey. ACM Sigmod Rec. 2013;42(2):17–28. [Google Scholar]
- [3].Avena-Koenigsberger A, Misic B, Sporns O. Communication dynamics in complex brain networks. Nat Rev Neurosci. 2018;19(1):17. doi: 10.1038/nrn.2017.149. [DOI] [PubMed] [Google Scholar]
- [4].Hennequin G, Vogels TP, Gerstner W. Optimal control of transient dynamics in balanced networks supports generation of complex movements. Neuron. 2014;82(6):1394–1406. doi: 10.1016/j.neuron.2014.04.045. [DOI] [PMC free article] [PubMed] [Google Scholar]
- [5].Churchland MM, Cunningham JP, Kaufman MT, Foster JD, Nuyujukian P, Ryu SI, Shenoy KV. Neural population dynamics during reaching. Nature. 2012;487(7405):51. doi: 10.1038/nature11129. [DOI] [PMC free article] [PubMed] [Google Scholar]
- [6].Vogels TP, Rajan K, Abbott LF. Neural network dynamics. Annu Rev Neurosci. 2005;28:357–376. doi: 10.1146/annurev.neuro.28.061604.135637. [DOI] [PubMed] [Google Scholar]
- [7].Beggs JM, Plenz D. Neuronal avalanches in neocortical circuits. J Neurosci. 2003;23(35):11167–11177. doi: 10.1523/JNEUROSCI.23-35-11167.2003. [DOI] [PMC free article] [PubMed] [Google Scholar]
- [8].Akam T, Kullmann DM. Oscillations and filtering networks support flexible routing of information. Neuron. 2010;67(2):308–320. doi: 10.1016/j.neuron.2010.06.019. [DOI] [PMC free article] [PubMed] [Google Scholar]
- [9].Shew WL, Yang H, Yu S, Roy R, Plenz D. Information capacity and transmission are maximized in balanced cortical networks with neuronal avalanches. J Neurosci. 2011;31(1):55–63. doi: 10.1523/JNEUROSCI.4637-10.2011. [DOI] [PMC free article] [PubMed] [Google Scholar]
- [10].Vogels TP, Abbott L. Gating multiple signals through detailed balance of excitation and inhibition in spiking networks. Nat Neurosci. 2009;12(4):483. doi: 10.1038/nn.2276. [DOI] [PMC free article] [PubMed] [Google Scholar]
- [11].Vogels TP, Abbott LF. Signal propagation and logic gating in networks of integrate-and-fire neurons. J Neurosci. 2005;25(46):10786–10795. doi: 10.1523/JNEUROSCI.3508-05.2005. [DOI] [PMC free article] [PubMed] [Google Scholar]
- [12].Rutten V, Hennequin G. Limits on fast, high-dimensional information processing in recurrent circuits. Computational and Systems Neuroscience (Cosyne); 2017. conference abstract. [Google Scholar]
- [13].Kirst C, Timme M, Battaglia D. Dynamic information routing in complex networks. Nat Commun. 2016;7 doi: 10.1038/ncomms11061. p. 11061. [DOI] [PMC free article] [PubMed] [Google Scholar]
- [14].Harush U, Barzel B. Dynamic patterns of information flow in complex networks. Nat Commun. 2017;8 doi: 10.1038/s41467-017-01916-3. p. 2181. [DOI] [PMC free article] [PubMed] [Google Scholar]
- [15].Ganguli S, Huh D, Sompolinsky H. Memory traces in dynamical systems. Proc Natl Acad Sci USA. 2008;105(48):18970–18975. doi: 10.1073/pnas.0804451105. [DOI] [PMC free article] [PubMed] [Google Scholar]
- [16].Lim S, Goldman MS. Noise tolerance of attractor and feedforward memory models. Neural Comput. 2012;24(2):332–390. doi: 10.1162/NECO_a_00234. [DOI] [PMC free article] [PubMed] [Google Scholar]
- [17].Pasqualetti F, Zampieri S, Bullo F. Controllability metrics, limitations and algorithms for complex networks. IEEE Trans Control Netw Syst. 2014;1(1):40–52. [Google Scholar]
- [18].Pasqualetti F, Zampieri S. On the controllability of isotropic and anisotropic networks. Proc 53rd IEEE Conf Decis Control (CDC); 2014. p. 612. [Google Scholar]
- [19].Cover TM, Thomas JA. Elements of information theory. 2nd ed. John Wiley & Sons; 2012. [Google Scholar]
- [20].Baggio G, Zampieri S. On the relation between non-normality and diameter in linear dynamical networks. Proc European Control Conf (ECC); 2018. (to appear) [Google Scholar]


