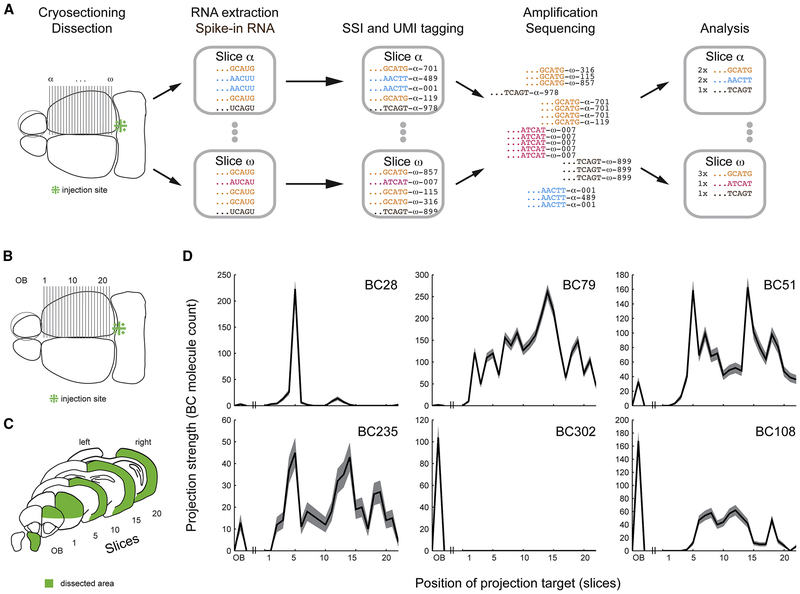
Figure 4:
MAPseq reveals large diversity of projections from LC. (a) Barcode mRNAs from target areas are sequenced as described (SSI = slice specific identifier, UMI = unique molecular identifier). (b,c) Barcodes from ipsilateral olfactory bulb and cortex show projection patterns (d) with single or multiple peaks in cortex and/or olfactory bulb. The shaded area indicates Poisson error bars given by the square root of barcode (BC) counts per slice.

