

SUMMARY
Infection of maize (Zea mays) plants with the smut fungus Ustilago maydis is characterized by excessive host tumour formation. U. maydis is able to produce indole‐3‐acetic acid (IAA) efficiently from tryptophan. To assess a possible connection to the induction of host tumours, we investigated the pathways leading to fungal IAA biosynthesis. Besides the previously identified iad1 gene, we identified a second indole‐3‐acetaldehyde dehydrogenase gene, iad2. Δiad1Δiad2 mutants were blocked in the conversion of both indole‐3‐acetaldehyde and tryptamine to IAA, although the reduction in IAA formation from tryptophan was not significantly different from Δiad1 mutants. To assess an influence of indole‐3‐pyruvic acid on IAA formation, we deleted the aromatic amino acid aminotransferase genes tam1 and tam2 in Δiad1Δiad2 mutants. This revealed a further reduction in IAA levels by five‐ and tenfold in mutant strains harbouring theΔtam1 andΔtam1Δtam2 deletions, respectively. This illustrates that indole‐3‐pyruvic acid serves as an efficient precursor for IAA formation in U. maydis. Interestingly, the rise in host IAA levels upon U. maydis infection was significantly reduced in tissue infected with Δiad1Δiad2Δtam1 orΔiad1Δiad2Δtam1Δtam2 mutants, whereas induction of tumours was not compromised. Together, these results indicate that fungal IAA production critically contributes to IAA levels in infected tissue, but this is apparently not important for triggering host tumour formation.
INTRODUCTION
The basidiomycete Ustilago maydis is a member of the smut fungi whose estimated 1200 species cause worldwide diseases in over 75 plant families of the angiosperms. U. maydis is a genetically well‐characterized model organism and its genome sequence has recently been published (Basse and Steinberg, 2004; Kämper et al., 2006). U. maydis differs from other smut fungi in its ability to incite tumours in all aerial parts of its host plants maize (Zea mays) and teosinte (Zea mays ssp. parviglumis). Under natural conditions tumours are frequently observed in reproductive organs and preferentially develop within kernels. At advanced stages of the infection they become filled with billions of sexual teliospores (Christensen, 1963; Kahmann et al., 2000; Kämper et al., 2006; Martínez‐Espinoza et al., 2002). The association of tumour development with plant cell enlargement and proliferation suggested an involvement of phytohormones (Banuett and Herskowitz, 1996; Callow and Ling, 1973; Doehlemann et al., 2007; Kahmann et al., 2000; Snetselaar and Mims, 1994). In particular, markedly elevated indole‐3‐acetic acid (IAA) levels in tumour tissue relative to non‐infected control tissue as well as the ability of U. maydis to efficiently convert exogenously added tryptophan (Trp) to IAA have pointed to a role of fungal IAA production in tumour induction (Basse et al., 1996; Moulton, 1942; Sosa‐Morales et al., 1997; Turian and Hamilton, 1960; Wolf, 1952).
In plants, several IAA biosynthesis pathways starting from Trp have been proposed, but only a few biosynthesis genes have been identified and characterized (Woodward and Bartel, 2005). The indole‐3‐pyruvic acid (IPA) pathway is initiated by the oxidative transamination of Trp to IPA and proceeds via indole‐3‐acetaldehyde (IAAld) to IAA through the activities of IPA decarboxylase and IAAld dehydrogenase, respectively (Fig. 1). In Arabidopsis (Arabidopsis thaliana) and tomato, IPA has been detected and in Lupinis albus and Medicago truncatula, IAAld dehydrogenase activities have been identified (Cooney and Nonhebel, 1989; Fedorova et al., 2005; Spaepen et al., 2007; Tam and Normanly, 1998). IAAld as the terminal intermediate of IAA biosynthesis may also arise from tryptamine (TAM) via the intermediate indole‐3‐acetaldoxime (IAOx) (Fig. 1; Zhao et al., 2001, 2002). In support of a pathway via TAM, members of the YUC gene family, which encode flavin monooxygenase‐like enzymes converting TAM to N‐hydroxyl tryptamine, play an important role in IAA formation (Cheng et al., 2006; Zhao et al., 2001). Alternatively, IAOx can be directly generated from Trp and thus bypass TAM formation. In Arabidopsis, two corresponding P450 monooxygenase activities have been identified, which are relevant for IAA biosynthesis (Hull et al., 2000; Mikkelsen et al., 2000; Zhao et al., 2002). Evidence exists that indole‐3‐acetonitrile (IAN) as well as IAAld may be intermediates in IAA biosynthesis from IAOx (Bak et al., 2001; Barlier et al., 2000 and references therein). Besides IAA formation via the precursors IAN or IAAld, Trp can be converted to IAA via indole‐3‐acetamide through the consecutive activities of Trp monooxygenase and indole‐3‐acetamide hydrolase, as reported for some plant‐associated bacteria (Fig. 1; Spaepen et al., 2007; Yamada et al., 1985). Such a pathway has also been suggested to exist in Arabidopsis based on the occurrence of indole‐3‐acetamide (IAM) and an IAM hydrolase activity encoded by the AMI1 gene (Pollmann et al., 2002, 2003). In addition to the IAM pathway, IAA formation via the IPA pathway has been described in a broad range of bacterial species, underlining the occurrence of IPA as an auxin source (Spaepen et al., 2007). In fungi, although a variety of intermediates in IAA biosynthesis have been proposed, corresponding biosynthesis genes have not yet been addressed except for the U. maydis iad1 gene (see below and Discussion).
Figure 1.
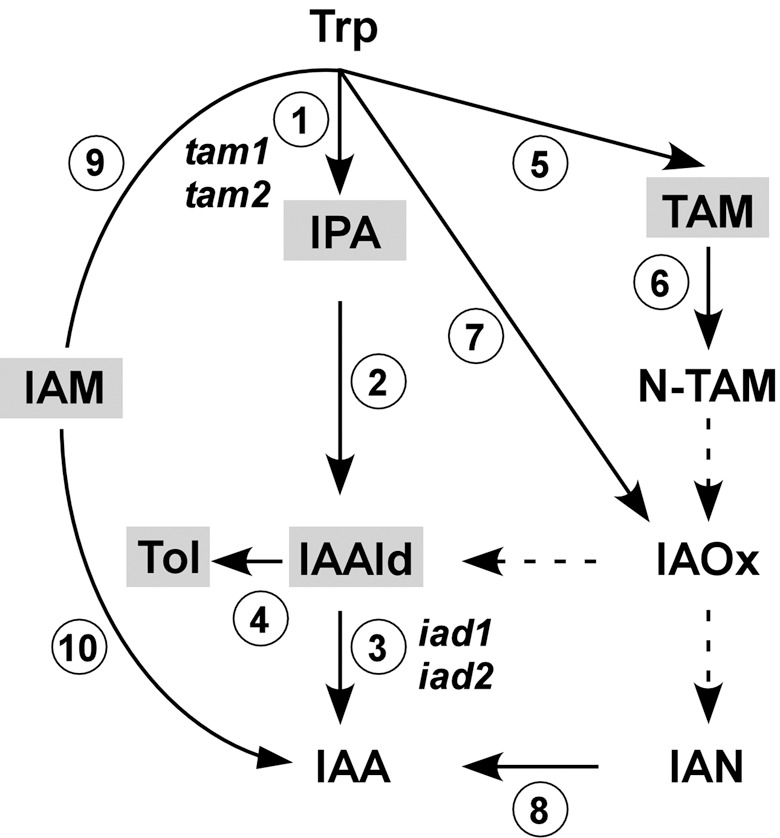
Trp‐dependent IAA biosynthesis. The scheme shows IAA pathways and key intermediates proposed for plants and microorganisms. Trp, tryptophan; IPA, indole‐3‐pyruvic acid; IAAld, indole‐3‐acetaldehyde; IAA, indole‐3‐acetic acid; Tol, indole‐3‐ethanol; TAM, tryptamine; N‐TAM, N‐hydroxyl tryptamine; IAOx, indole‐3‐acetaldoxime; IAN, indole‐3‐acetonitrile; IAM, indole‐3‐acetamide. Enzymes involved in these pathways are: Trp aminotransferase (1), IPA decarboxylase (2), IAAld dehydrogenase (3), IAAld reductase (4), Trp decarboxylase (5), flavin monooxygenase‐like enzymes (6), cytochrome P450 enzymes (7); nitrilase (8); Trp monooxygenase (9); IAM hydrolase (10). Possible intermediates or by‐products of IAA formation thus far reported for fungi are shaded grey (see Discussion). Enzymes for the conversion of intermediates connected by dashed arrows are elusive. U. maydis genes involved in IAA formation are indicated. Tol emerges as a by‐product from IAAld in the absence of IAAld dehydrogenase activity.
We have re‐investigated IAA biosynthesis from Trp in U. maydis to address a possible role in host tumour formation. The previously identified U. maydis iad1 gene encodes a NAD‐dependent IAAld dehydrogenase (Basse et al., 1996). U. maydis Δiad1 mutants are blocked in IAA formation from IAAld in glucose‐containing medium; however, IAA formation was partially regained in medium with arabinose as the carbon source. This led us to propose the existence of a second IAAld dehydrogenase, termed Iad2, which should be subject to glucose‐repression. Furthermore, the efficient conversion of TAM to IAA in glucose‐free medium suggested a participation of Iad2 (Basse et al., 1996). In addition, we have observed IPA accumulation from Trp in glucose‐containing medium (Basse et al., 1996), raising the question of whether IPA plays a role in IAA formation.
In this report, we describe for the first time the identification of fungal genes efficiently contributing to Trp‐dependent IAA biosynthesis. U. maydis mutants strongly affected in IAA biosynthesis were generated and analysed with regard to tumour induction and the ability to cause elevated IAA levels in infected host tissue. This allowed us to separate fungal IAA production from host tumour formation.
RESULTS
Identification of Iad2
In order to identify the second IAAld dehydrogenase gene iad2, we searched for potential aldehyde dehydrogenase (pad) genes displaying sequence similarity to iad1 and a carbon source‐dependent expression profile. The pad2 and pad3 genes (MIPS annotation nos um03523 and um10596), whose deduced amino acid sequences display 53 and 52% identity to Iad1, respectively, were retrieved by Southern blot hybridization with iad1 as probe and chromosomal DNA of Δiad1 mutants. However, pad2 and pad3, which encode the closest homologues of Iad1 among all 16 additional aldehyde dehydrogenases predicted by the MIPS annotation of the U. maydis genome, were not upregulated in complete medium (CM) in the presence of arabinose (CM/Ara) compared with glucose‐containing CM (CM/Glc; data not shown). A PCR approach with oligonucleotides deduced from regions conserved between Iad1 and fungal aldehyde dehydrogenases led to the identification of pad5 (see Experimental procedures). Northern blot analysis revealed that pad5 is expressed in CM/Ara as well as in CM without an additional carbon source, whereas transcripts were not detected in CM/Glc (Fig. 2), indicating that expression of this gene is subject to glucose repression. The predicted ORF of this gene, renamed iad2, which after completion of the genome sequence by the Broad Institute was annotated as um03402 by MIPS, encodes a protein of 482 amino acids, with a calculated molecular mass of 53.0 kDa and 36.9% sequence identity to Iad1. The Iad2 sequence also contains the highly conserved amino acid residues described to be involved in catalytic activity, and substrate and cofactor binding (Fig. 3; Yoshida et al., 1998). The absence of a predicted mitochondrial presequence points to a cytosolic localization.
Figure 2.
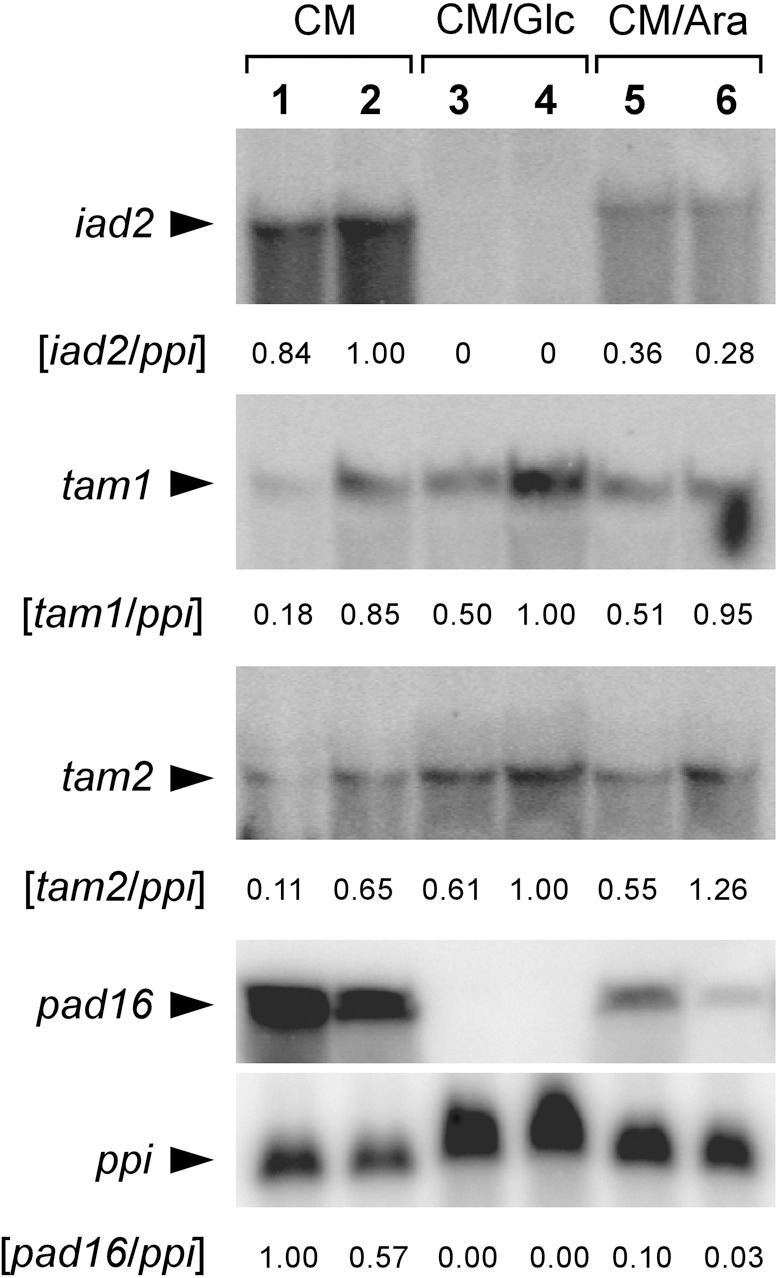
Carbon source‐dependent expression of iad2, tam1, tam2 and pad16. U. maydis strains FB1 (lanes 1, 3, 5) and FB2 (lanes 2, 4, 6) were cultivated in either CM without an additional carbon source (CM), CM/Glc or CM/Ara. For RNA‐blot analysis, total RNA (about 10 µg per lane for iad2, tam1 and tam2, and about 40 µg per lane for pad16) was loaded, and hybridized with the 32P‐labelled probes as indicated. Radioactive signals were quantified. Filters were additionally hybridized with the constitutively expressed ppi gene (shown for pad16) to calculate the ratios of gene‐specific to ppi signals.
Figure 3.

Sequence alignment of Iad2 with Iad1 and Pad2. Identical amino acids are boxed and shaded. Gaps have been inserted to increase the number of identities. Asterisks mark highly conserved amino acid residues described to be implicated in catalytic activity (E253), substrate binding (C288) and NAD binding (K180, G231, G236; numbers refer to Iad2). Dots mark amino acids shared between Iad1 and Iad2 and absent from all remaining predicted aldehyde dehydrogenase sequences of U. maydis (see Discussion).
To examine IAAld dehydrogenase activity of Iad2, the corresponding cDNA sequence was expressed as His‐tagged fusion in Escherichia coli under an arabinose‐inducible promoter. The iad1 gene, its closest homologue, pad2, and the pad16 gene (MIPS annotation no. um03665), which is upregulated in CM/Ara and most strongly expressed in CM without an additional carbon source compared with CM/Glc (Fig. 2), were included as controls. E. coli strains carrying the pBADiad1, pBADpad2, pBADiad2 and pBADpad16 expression constructs were denoted GR1, GR2, GR5, and GR16, respectively. Expression of His‐tagged proteins of the expected sizes was verified by immunoblot analysis (Fig. 4A), and IAAld dehydrogenase activity was examined in vitro (see Experimental procedures). As assessed from treatment of ethyl acetate‐extracted reaction products with the Salkowski reagent, which is indicative for IAA formation, positive reactions were confined to extracts from strains GR1 and GR5 grown under promoter‐inducing conditions (data not shown). Explicitly, reversed‐phase HPLC of reaction products and analysis of fractions with the Salkowski reagent confirmed IAAld dehydrogenase activity in strains GR1 and GR5. In contrast, strain GR2 was devoid of IAAld dehydrogenase activity (Fig. 4B,C). The small IAA peak seen in the GR2 profile (Fig. 4B) was also detected under non‐inducing conditions and thus was not a consequence of Pad2 expression (data not shown). In vitro analysis of the pH and co‐factor requirements of Iad2 revealed a pH optimum of 8 and a clear preference for NAD as co‐factor (Fig. 4D). In conclusion, Iad2 functions as NAD‐dependent IAAld dehydrogenase.
Figure 4.
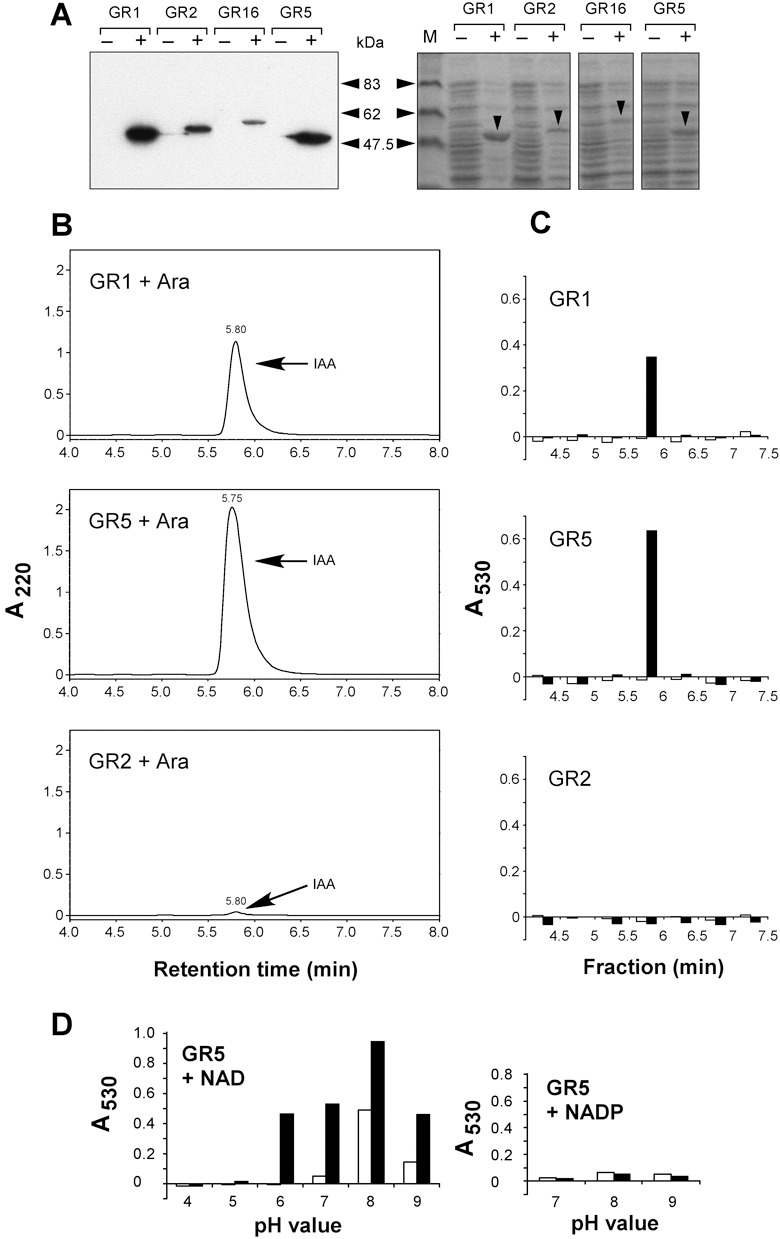
Demonstration of IAAld activity in vitro. (A) Immunoblot analysis of His‐tagged proteins expressed in E. coli strains GR1 (Iad1; 53.7 kDa), GR2 (Pad2; 56.2 kDa), GR16 (Pad16; 57.4 kDa) and GR5 (Iad2; 53.0 kDa) using an anti‐His antibody. Cultures were incubated under non‐inducing (–) or inducing conditions (+). Protein amounts corresponding to 40 µL of cell culture were loaded per lane. Size markers are indicated on the right. The right panel shows the Coomassie‐stained gel loaded with the same amounts of the same protein preparations. Arrowheads point to the Iad1, Pad2, Pad16 and Iad2 proteins expressed under inducing conditions. M: molecular mass standards. (B) HPLC analysis of in vitro reaction products. Identical volumes of enzyme extracts (corresponding to 0.7 mL of cell culture each and 100 µg protein for GR1, 200 µg for GR2 and 400 µg for GR5) prepared from E. coli strains GR1, 2 and 5 grown in parallel under inducing conditions (+Ara) were applied for the enzyme assay in the presence of IAAld (0.5 mm). Reaction products were separated by HPLC. The IAAld substrate (elutes 1 min earlier than IAA under the applied conditions) was removed from the samples via ethyl acetate extraction. Absorbance was monitored at 220 nm. Arrows denote peaks eluting like IAA. (C) Salkowski analysis of HPLC fractions. Fractions from HPLC runs of reaction products under non‐inducing conditions (open bars) and inducing conditions (closed bars) were collected for detection of IAA with the Salkowski reagent. Absorbance was measured at 530 nm. (D) Co‐factor and pH requirements of Iad2. The desalted extract from induced E. coli strain GR5 was incubated with IAAld (0.5 mm) in the presence of either NAD (1 mm) (left panel) or NADP (1 mm) (right panel). Reactions were allowed to proceed for 5 min (open bars) or 30 min (closed bars). Products were treated with the Salkowski reagent. Absorbance was measured at 530 nm.
Loss of IAAld dehydrogenase activity in Δiad1Δiad2 mutants
To determine the influence of iad2 on IAA formation and to rule out the existence of additional IAAld dehydrogenase activities, iad2 was deleted in wild‐type and Δiad1 mutant strains. The resulting strains GRN1 (FB1Δiad2), GRN3 (FB2Δiad2), GRN7 (FB1Δiad1Δiad2) and GRN8 (FB2Δiad1Δiad2) were compared with their parental strains for the ability to convert IAAld to IAA in CM/Ara. Extracts from cell‐free supernatants of wild‐type and Δiad2 mutant strains displayed similar Salkowski reactions (Fig. 5A), and the formation of similar IAA amounts was confirmed by HPLC analysis (Fig. 5B; data not shown). As expected from our previous investigation, Δiad1 mutants were markedly reduced in IAA formation from IAAld (Fig. 5A–C). Strikingly, however, extracts from Δiad1Δiad2 mutants were almost devoid of IAA as assessed from the weak Salkowski reaction and from HPLC analysis (Fig. 5A–C). Quantitative HPLC analysis documented that IAA levels were reduced > 50‐fold in Δiad1Δiad2 mutants relative to parental Δiad1 mutant strains in favour of tryptophol (Tol; indole‐3‐ethanol) formation (Fig. 5B,C). This indicates that Iad1 and Iad2 function as IAAld dehydrogenases in vivo and excludes the existence of redundant enzyme activities under the tested conditions.
Figure 5.
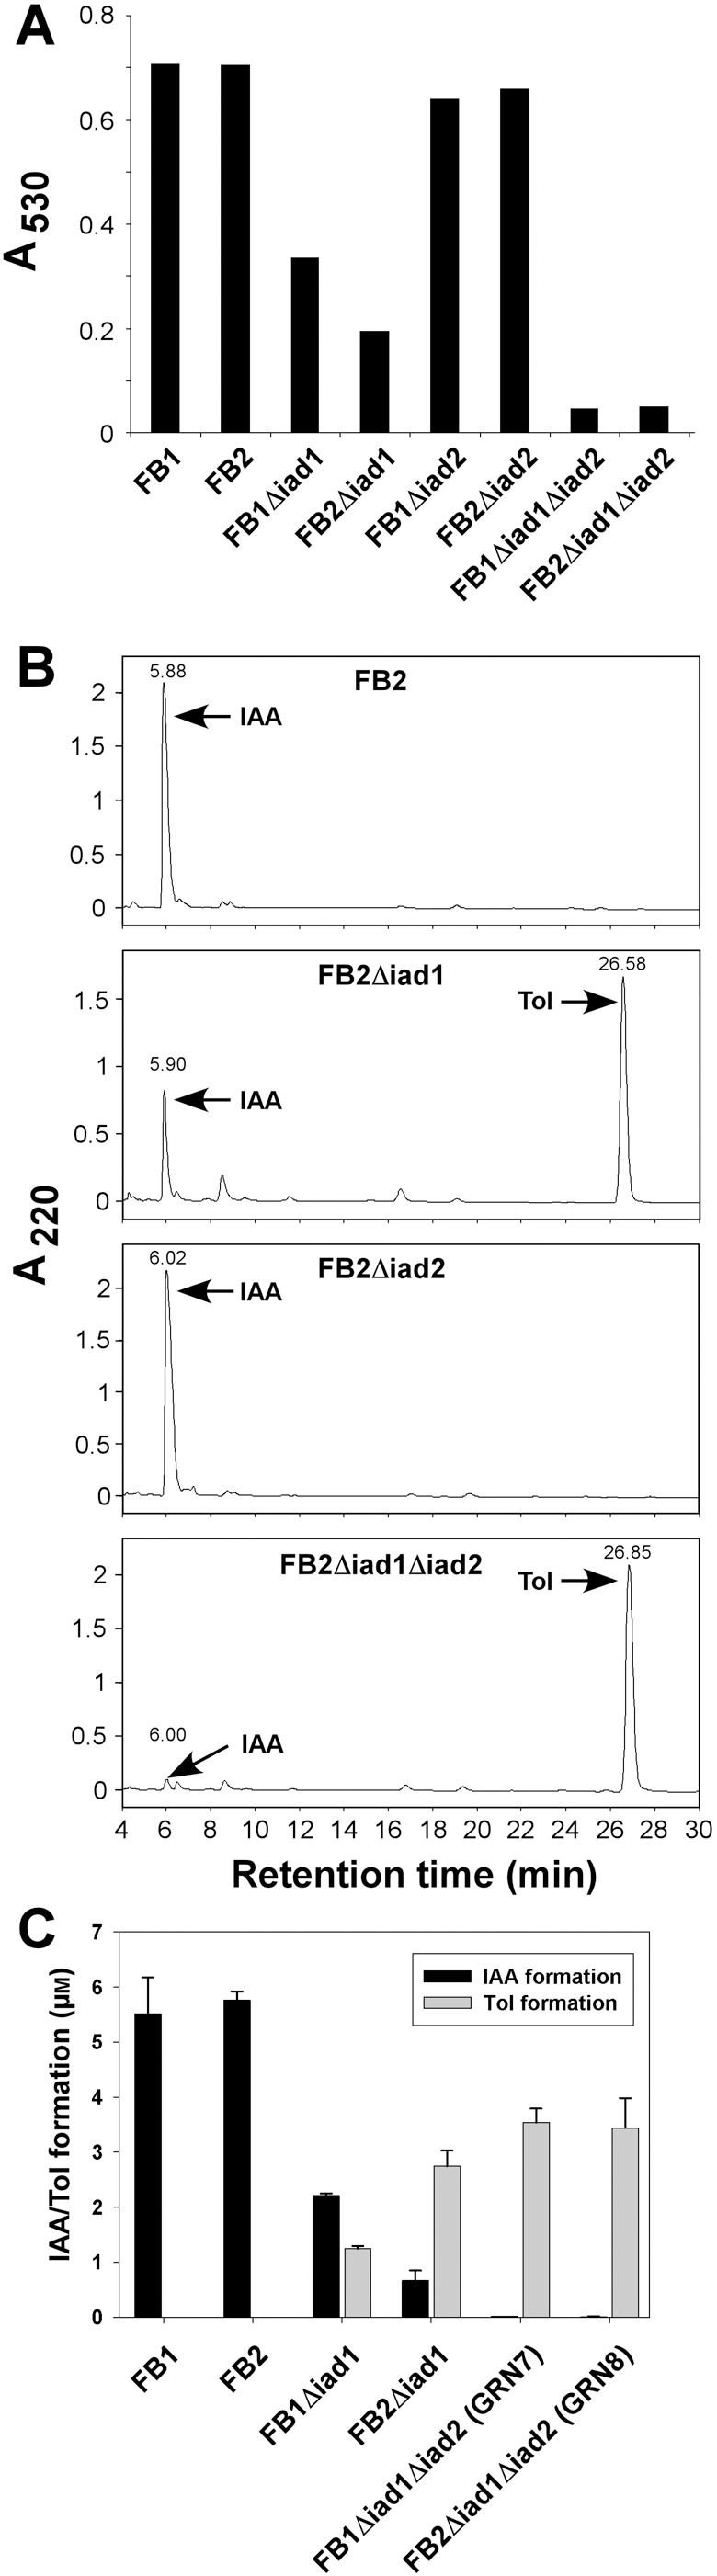
IAA and Tol production in Δ iad1/Δ iad2 mutant strains. (A) Strains FB1, FB2, FB1Δiad1, FB2Δiad1, FB1Δiad2 (GRN1), FB2Δiad2 (GRN3), FB1Δiad1Δiad2 (GRN7) and FB2Δiad1Δiad2 (GRN8) were incubated in the presence of 0.2 mm IAAld, and IAA formation was determined in culture supernatants (150 µL) by the Salkowski reagent. Absorbance was measured at 530 nm. (B) HPLC analysis of extracted culture supernatants from strains FB2, FB2Δiad1, GRN3 and GRN8 cultivated as described in A. Absorbance was monitored at 220 nm. Arrows denote peaks eluting like IAA and Tol, respectively. (C) Quantification of IAA and Tol formation. Extracted culture supernatants from strains FB1, FB2, FB1Δiad1, FB2Δiad1, GRN7 and GRN8 incubated in CM/Ara in the presence of 20 µm IAAld were subjected to HPLC analysis and peak areas were quantified for calculation of IAA and Tol concentrations. The mean (± SD) values were calculated from three replicates of a single strain.
Δiad1Δiad2 mutants are blocked in the conversion of tryptamine to IAA
Previous studies have revealed that exogenously added TAM is efficiently converted to IAA in U. maydis grown in CM/Ara (Basse et al., 1996). For this reason, we investigated whether both Iad1 and Iad2 are required for the conversion of TAM to IAA in vivo. To discriminate between their contributions, TAM feeding experiments were performed with wild‐type, Δiad1, Δiad2 andΔiad1Δiad2 mutant strains. Δiad2 mutants were not significantly affected in TAM to IAA conversion compared with wild‐type strains (Table 1). In agreement with a previous investigation (Basse et al., 1996), Δiad1 mutants were significantly reduced in IAA formation from TAM. Interestingly, however, conversion of TAM to IAA was almost eliminated in Δiad1Δiad2 mutants (Table 1), indicating that TAM is converted to IAA through IAAld dehydrogenase activities of Iad1 and Iad2.
Table 1.
Influence of the Δiad1/Δiad2 and Δnit1 deletions on the in vivo conversion of TAM or Trp to IAA.*
| Strain | TAM | Trp | ||
|---|---|---|---|---|
| IAA | ||||
| Mean ± SD (µm) | Mean ± SD (%) | Mean ± SD (µm) | Mean ± SD (%) | |
| FB1 | 1.58 ± 0.27 (6) | 100.0 ± 17.1 | 0.148 ± 0.025 (4) | 100.0 ± 16.9 |
| FB2 | 2.31 ± 0.60 (6) | 146.2 ± 38.0 | 0.140 ± 0.011 (4) | 94.6 ± 7.4 |
| FB1Δiad1 | 0.28 ± 0.06 (3) | 17.7 ± 3.8 | 0.050 ± 0.015 (4) | 33.8 ± 10.1 |
| FB2Δiad1 | 0.32 ± 0.10 (3) | 20.3 ± 6.3 | 0.039 ± 0.010 (4) | 26.4 ± 6.8 |
| FB1Δiad2 (GRN1) | 1.05 ± 0.32 (6) | 66.5 ± 20.3 | 0.130 ± 0.014 (4) | 87.8 ± 9.5 |
| FB2Δiad2 (GRN3) | 3.19 ± 0.31 (6) | 201.9 ± 19.6 | 0.130 ± 0.009 (4) | 87.8 ± 6.1 |
| FB1Δiad1Δiad2 (GRN7) | 0.04 ± 0.04 (6) | 2.5 ± 2.5 | 0.027 ± 0.010 (4) | 18.2 ± 6.8 |
| FB2Δiad1Δiad2 (GRN8) | 0.01 ± 0.02 (6) | 0.6 ± 1.3 | 0.033 ± 0.005 (4) | 22.3 ± 3.4 |
| GRN7Δnit1 (BH7) | 0.03 ± 0.00 (3) | 1.9 ± 0.0 | 0.042 ± 0.001 (4) | 28.4 ± 0.7 |
| GRN8Δnit1 (BH13) | 0.01 ± 0.02 (3) | 0.6 ± 1.2 | 0.035 ± 0.006 (4) | 23.6 ± 4.1 |
Strains were incubated in CM/Ara in the presence of 0.5 mm TAM or 5 mm Trp. Concentrations were calculated from peak areas resulting from HPLC analysis. The mean (± SD) values were calculated from three to six replicates (numbers in parentheses) of a single strain.
Conversion of Trp to IAA in Δiad1Δiad2 mutants
We next addressed whether Iad2 plays a role in IAA formation from Trp by comparing wild‐type, Δiad1, Δiad2 and Δiad1Δiad2 mutants cultivated in CM/Ara. In agreement with a previous investigation, Δiad1 strains exhibited an approximately threefold reduction in the conversion of Trp to IAA, whereas Δiad2 mutants displayed wild‐type‐like IAA levels (Table 1). IAA levels were not significantly lower in Δiad1Δiad2 relative to Δiad1 mutants (Table 1), suggesting that Iad1 is sufficient for the conversion of IAAld derived from exogenously added Trp.
Identification of the U. maydis nit1 gene and analysis of IAA formation in Δiad1Δiad2Δnit1 mutants
To address the existence of an IAAld dehydrogenase‐independent IAA pathway in U. maydis, we investigated the possibility of IAA formation via IAN. The U. maydis genome revealed three predicted nitrilase genes (MIPS annotation nos. um10444, um11973 and um05032). Interestingly, the amino acid sequence deduced from um10444 (nit1) is more similar to plant nitrilases than predicted nitrilase family proteins from fungi, with highest similarities to NIT1 and NIT2 from Arabidopsis (≥ 43% identity), which are involved in IAA formation (Normanly et al., 1997; Schmidt et al., 1996). nit1 was deleted in Δiad1Δiad2 mutant strains to assess a possible contribution to IAA formation. The resulting strains BH7 (FB1Δiad1Δiad2Δnit1) and BH13 (FB2Δiad1Δiad2Δnit1) were similarly affected in IAA formation from IAAld and TAM as the Δiad1Δiad2 double mutants (Table 1; data not shown). However, the residual IAA formation from Trp in Δiad1Δiad2 mutants was not diminished in the absence of nit1 both in CM/Ara and in CM/Glc medium (1, 2). Thus, Nit1 is not likely to function in a Trp to IAA pathway. To assess further the existence of IAA‐related nitrilase activity, we examined whether IAN could serve as substrate for IAA formation in U. maydis. As judged from HPLC analysis of culture supernatants of strains FB1 and FB2, detectable IAA was not formed from exogenously applied IAN (0.2 mm) in either CM/Glc or CM/Ara. At higher doses, IAN led to growth reduction, indicative for its uptake (data not shown).
Table 2.
Influence of the Δtam1/Δtam2 deletions on the in vivo conversion of Trp to IAA and IPA.
| Strain | CM/Glc(*), (*,†) | CM/Ara(†), (*,†) | ||||
|---|---|---|---|---|---|---|
| IAA | IPA | IAA | ||||
| Mean ± SD (µm) | Mean ± SD (%) | Mean ± SD (µm) | Mean ± SD (%) | Mean ± SD (µm) | Mean ± SD (%) | |
| FB1 | 3.08 ± 0.37 | 100.0 ± 12.1 | 844.1 ± 91.5 | 100.0 ± 10.8 | 0.220 ± 0.032 | 100.0 ± 14.5 |
| FB2 | 2.52 ± 0.42 | 81.9 ± 13.7 | 243.6 ± 56.1 | 28.9 ± 6.6 | 0.239 ± 0.016 | 108.6 ± 7.5 |
| FB1Δiad1Δiad2 (GRN7) | 2.15 ± 0.33 | 69.8 ± 11.1 | 228.9 ± 24.0 | 27.1 ± 2.8 | 0.071 ± 0.004 | 32.3 ± 1.6 |
| FB2Δiad1Δiad2 (GRN8) | 1.85 ± 0.19 | 60.2 ± 6.2 | 296.9 ± 56.8 | 35.2 ± 6.7 | 0.063 ± 0.008 | 28.5 ± 3.8 |
| GRN7Δtam1‡ | 0.31 ± 0.07 | 10.0 ± 2.1 | 41.6 ± 13.0 | 4.9 ± 1.5 | 0.027 ± 0.008 | 12.3 ± 3.6 |
| GRN8Δtam1‡ | 0.34 ± 0.07 | 11.2 ± 2.2 | 46.7 ± 15.3 | 5.5 ± 1.8 | 0.033 ± 0.006 | 14.9 ± 2.6 |
| GRN7Δtam1Δtam2‡ | 0.22 ± 0.02 | 7.1 ± 0.7 | 20.2 ± 2.6 | 2.4 ± 0.3 | 0.029 ± 0.006 | 13.0 ± 2.6 |
| GRN8Δtam1Δtam2‡ | 0.17 ± 0.03 | 5.4 ± 0.9 | 14.4 ± 6.1 | 1.7 ± 0.7 | 0.030 ± 0.006 | 13.5 ± 2.8 |
| GRN7Δnit1 (BH7) | 2.29 ± 0.22 | 74.5 ± 7.1 | 488.5 ± 40.0 | 57.9 ± 4.7 | – | – |
| GRN8Δnit1 (BH13) | 1.41 ± 0.29 | 45.9 ± 9.3 | 172.4 ± 33.6 | 20.4 ± 4.0 | – | – |
Strains were incubated in CM/Glc (starting cell density of 2 × 10⁷/mL) in the presence of 5 mm Trp .
Strains were incubated in CM/Ara in the presence of 5 mm Trp (†).
Concentrations were calculated from peak areas resulting from HPLC analysis. The mean (±SD) values were calculated from three replicates of a single strain (*,†).
Two independent strains were investigated and all values averaged (‡).
Transaminases are involved in IAA formation from Trp
Tryptophan is efficiently converted to IPA in U. maydis strains grown in CM/Glc (Basse et al., 1996), raising the interesting possibility that IPA represents an intermediate in IAA formation from Trp. Formation of IPA requires transaminase activity. The U. maydis genome contains two genes, termed tam1 and tam2 (MIPS annotation nos. um01804 and um03538; J. Schirawski, in press), encoding predicted aromatic amino acid aminotransferases, with 54% sequence identity to each other, and 25–28% identities to Aro8 and Aro9 of Saccharomyces cerevisiae, which function in aromatic amino acid deamination (Iraqui et al., 1998). To assess a contribution of IPA on IAA formation in Δiad1Δiad2 mutants,Δiad1Δiad2Δtam1 and Δiad1Δiad2Δtam1Δtam2 mutant strains were generated (see Experimental procedures). In glucose‐containing medium, Δiad1Δiad2 mutants were only slightly reduced in IAA formation from Trp relative to their wild‐type strains (Table 2). Interestingly, Δiad1Δiad2Δtam1 mutants exhibited greater than fivefold reduced IPA and IAA levels relative to Δiad1Δiad2 mutants, while Δiad1Δiad2Δtam1Δtam2 mutant strains revealed an additional reduction in the IPA and IAA levels, with IAA levels approximately tenfold reduced relative to Δiad1Δiad2 mutants (Table 2). The additional effect of the Δtam2 deletion was only apparent when cells were inoculated at a higher density (Table 2), otherwise Δtam1 and Δtam1Δtam2 mutants were similarly reduced (four‐ to fivefold) in IAA formation from Trp (data not shown). To verify IPA formation from Trp feeding, ethyl acetate‐extracted cell‐free supernatants were separated by HPLC under two different solvent conditions (see Experimental procedures) and peak fractions were analysed with the Salkowski reagent, which gives a red colour formation with both IAA and IPA (Glickmann and Dessaux, 1995). This revealed that the major peak co‐migrating with the IPA standard under acidic conditions shifted to the earlier retention time of IPA under neutral conditions and corresponding peak fractions stained Salkowski‐positive, thus corroborating efficient IPA production from Trp (see Supplementary Fig. S1). Together, these results indicate that IPA formation mediated by Tam1 strongly contributes to IAA formation in glucose‐containing medium and that Tam2 can support the activity of Tam1.
Next, we investigated whether Tam1 and Tam2 also contribute to IAA formation in medium with arabinose as the carbon source, in which the formation of IPA from Trp is not detected (Basse et al., 1996). Interestingly, Δiad1Δiad2Δtam1 mutants displayed approximately twofold reduced IAA levels relative to Δiad1Δiad2 mutants and seven‐ to eightfold reduced IAA levels relative to wild‐type strains, indicating that Tam1 also contributes to IAA formation under these conditions. By contrast, IAA levels were not further lowered in the absence of tam2 (Table 2). Owing to the absence of detectable IPA formation in CM/Ara, Northern blot analysis was performed to examine whether the tam1 and tam2 genes are regulated by the carbon source. This revealed that both genes were expressed in CM irrespective of the carbon source (Fig. 2).
Fungal IAA production and the induction of host tumours
The generated U. maydis mutants affected in IAA biosynthesis provided a suitable tool to address the question of whether fungal IAA production is important for tumour induction and the rise of IAA levels in infected host tissue previously reported by Turian and Hamilton (1960). Infection experiments were first performed with Δiad1Δiad2Δnit1 mutant strains to assess whether these gene deletions have an influence on host IAA levels. The compatible mixture of BH7/BH13 strains (Δiad1Δiad2Δnit1) was not affected in the ability to mate and develop dikaryotic hyphae under culture conditions (data not shown). Infection experiments with the host plant maize revealed that tumour formation in the various parts of infected plants was not altered compared with infection with wild‐type strains (Table 3).
Table 3.
Comparison of pathogenicity symptoms induced by wild‐type and IAA mutant strains.
| Inoculum | Inoculated plants (n) | Symptoms (percentage of inoculated plants)* | ||||
|---|---|---|---|---|---|---|
| chl | nod | leaf | stem | total | ||
| Series 1 (9 dpi)† | ||||||
| FB1 × FB2 | 105 | 89/85 | 7/7 | 25/24 | 25/24 | 57/54 |
| BH7 × BH13 | 107 | 86/80 | 3/3 | 31/29 | 17/16 | 51/48 |
| Series 2 (10 dpi)† | ||||||
| FB1 × FB2 | 58 | 56/97 | 3/5 | 18/31 | 24/41 | 45/78 |
| GRN7 × GRN8 | 66 | 64/97 | 3/5 | 25/38 | 21/32 | 49/74 |
| GRN7Δtam1 × GRN8Δtam1 (#1)‡ | 62 | 60/97 | 3/5 | 22/35 | 13/21 | 38/61 |
| GRN7Δtam1 × GRN8Δtam1 (#2)‡ | 54 | 54/100 | 3/6 | 18/33 | 16/30 | 37/69 |
| Series 3 (6 dpi)† | ||||||
| FB1 × FB2 | 36 | 35/97 | 0/0 | 9/25 | 22/61 | 31/86 |
| GRN7Δtam1 × GRN8Δtam1 | 27 | 26/96 | 0/0 | 10/37 | 14/52 | 24/89 |
| GRN7Δtam1Δtam2 × GRN8Δtam1Δtam2 (#1)‡ | 33 | 33/100 | 2/6 | 6/18 | 24/73 | 32/97 |
| GRN7Δtam1Δtam2 × GRN8Δtam1Δtam2 (#2)‡ | 29 | 29/100 | 1/3 | 3/10 | 22/76 | 26/90 |
Symptoms of infected plants: chl, chlorosis only; nod, number of plants with tumours exclusively on nodal shoots; leaf, number of plants with leaf tumours (excluding stem tumours); stem, number of plants with stem tumours .
Time point (days post inoculation, dpi) of plant inspection (†).
Independent combinations of mutant strains . Plants from Series 1 and 3 were used for IAA analysis (see Fig. 6).
A time‐course experiment was performed to determine IAA levels in response to infection with Δiad1Δiad2Δnit1 mutants and wild‐type strains relative to non‐infected plant tissue. For this purpose, a highly sensitive gas chromatography‐tandem mass spectrometry technique was applied (Müller et al., 2002). For determination of free IAA levels, extracts were spiked with a deuterium‐labelled internal standard (see Experimental procedures). Although problems with stability of deuterium‐labelled IAA standards under alkaline extraction conditions have been reported (Magnus et al., 1980), the applied procedure did not include alkaline hydrolysis, but was based on determination of physiologically active free IAA, and the accuracy of the applied method has been proven. This has shown that the quantities of deuterium‐labelled IAA standard recovered from extracts corresponded to the added quantities within limits of experimental error (Müller et al., 2002). In mock‐treated plants, IAA levels were between 40 and 50 pmol/g fresh weight within the first 24 h and then declined to values of c. 30 pmol/g. In contrast, in wild‐type‐infected plants, IAA levels rose from 50 to 200 pmol/g 4 days after inoculation and subsequently declined to levels that exceeded those in control tissue by 2.5‐ to threefold. The IAA profile of plants infected with Δiad1Δiad2Δnit1 mutants was very similar to that of wild‐type‐infected plants, with even slightly increased IAA levels (Fig. 6A). Hence, a contribution of Iad1, Iad2 and Nit1 to elevated host IAA levels can be excluded.
Figure 6.
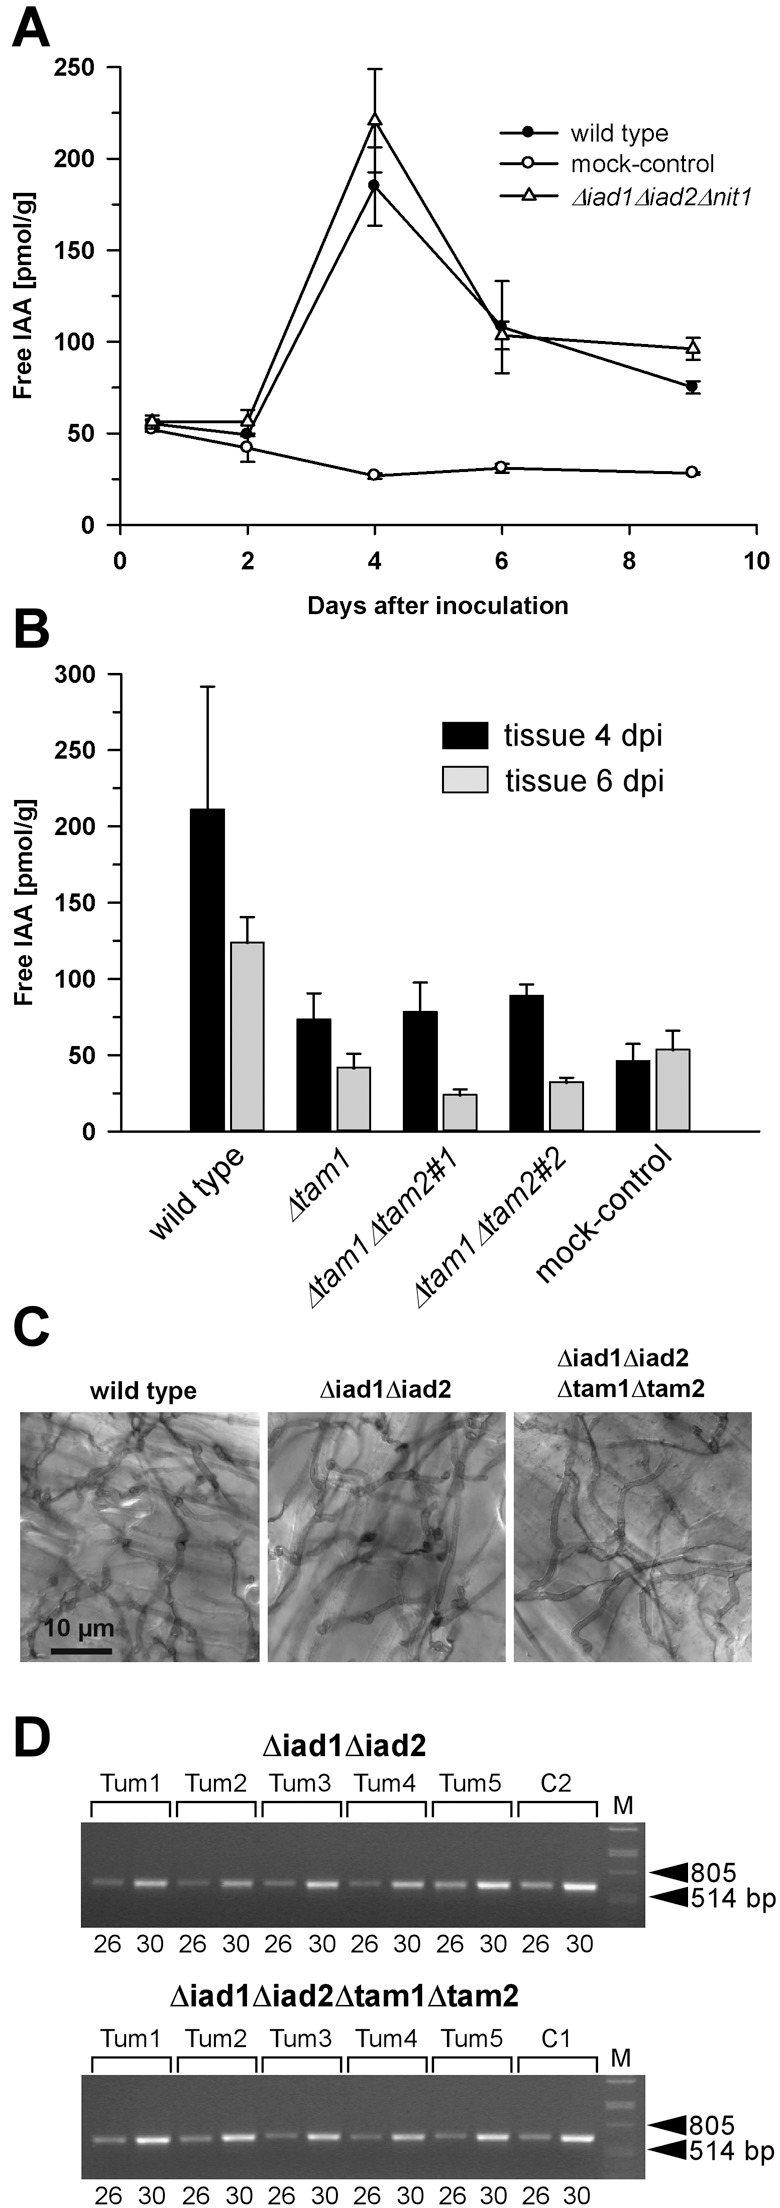
Determination of free IAA levels in maize tissue in response to U. maydis infection and analysis of proliferation of Δiad1Δiad2Δtam1Δtam2 mutants in planta. (A) Plants (6 days old) were inoculated with either combinations of FB1/FB2 strains (wild‐type; •), BH7/BH13 strains (Δiad1Δiad2Δnit1; Δ), or injected with water (mock‐control;  ). (B) Plants were inoculated with either combinations of FB1/FB2 strains (wild‐type), FB1Δiad1Δiad2Δtam1/FB2Δiad1Δiad2Δtam1 strains (Δtam1), two independent combinations of FB1Δiad1Δiad2Δtam1Δtam2/FB2Δiad1Δiad2Δtam1Δtam2 strains (Δtam1Δtam2), or injected with water (mock‐control). (A,B) Concentrations of IAA are calculated in pmol/g fresh weight. Average values and standard deviations of three data points are given. Leaf material was collected at the time points indicated. For the 12‐h and 48‐h time points, material was collected 0.5–3 cm above ground and 0.5–3 cm below the injection site, respectively. For the 4‐, 6‐ and 9‐day time points, chlorotic or early leaf tumour (4 days) and leaf tumour (6 and 9 days) tissue was collected between the ligule and > 1 cm below the injection site. All parts were exclusively from the third and fourth leaves. Non‐infected control material was isolated correspondingly. For each time point, ten or more tissue samples were collected. (C) Maize plants were inoculated with either mixtures of FB1/FB2 (wild‐type), FB1Δiad1Δiad2/FB2Δiad1Δiad2 (Δiad1Δiad2) or FB1Δiad1Δiad2Δtam1Δtam2/FB2Δiad1Δiad2Δtam1Δtam2 (Δiad1Δiad2Δtam1Δtam2) strains. Two days after inoculation samples from infected leaf blade tissue were stained with Chlorazol Black E. Note the ramification of hyphae throughout the epidermal layer. The bar (10 µm) refers to all panels. (D) Detection of FB1Δiad1Δiad2/FB2Δiad1Δiad2 (Δiad1Δiad2) and FB1Δiad1Δiad2Δtam1Δtam2/FB2Δiad1Δiad2Δtam1Δtam2 (Δiad1Δiad2Δtam1Δtam2) strain combinations in maize tumours. Chromosomal DNA (100 ng) isolated from each of five individual tumours (Tum1–5) 6 days after inoculation with either of these combinations was used as template for PCR to amplify a fungal‐specific DNA fragment (see Experimental procedures). C1, C2: DNA (100 ng) isolated from the respective strain combinations prior to plant infection was used as template. Twenty‐six and 30 cycles (numbers below the lanes) were performed. The expected size of the amplified fragment is 633 bp. All lanes are from the same gel. Phage lambda (M) DNA (500 ng) digested with PstI was used as size marker.
Next, plant infection experiments were performed with the Δiad1Δiad2Δtam1 and Δiad1Δiad2Δtam1Δtam2 mutant strains, which are severely reduced in IAA formation in both CM/Ara and CM/Glc. Compatible mixtures of these mutants were not affected in their ability to mate and develop dikaryotic hyphae (data not shown). Inspection of infected plants revealed that these mutants triggered disease symptoms comparable with wild‐type strains (Table 3). However, host tissue harvested 4 days after inoculation with compatible mixtures of either Δiad1Δiad2Δtam1 or Δiad1Δiad2Δtam1Δtam2 mutant strains contained significantly lower IAA amounts than comparable tissue of wild‐type‐infected plants (Fig. 6B). This difference persisted in tumour tissue harvested 6 days after inoculation. Here, IAA levels in tissue infected with mutant strains were slightly below the IAA levels in mock‐treated control tissue, whereas tissue from wild‐type‐infected plants showed a 2.5‐ to threefold increase (Fig. 6B). In conclusion, this implies that fungal IAA derived from IPA critically contributes to host IAA levels. However, fungal IAA production is apparently not important for induction of host tumours.
Furthermore, we assessed whether identified U. maydis genes involved in IAA formation contributed to fitness during plant infection. Infected leaf blade sections were collected 2, 4 and 6 days after inoculation with either wild‐type, Δiad1Δiad2 orΔiad1Δiad2Δtam1Δtam2 strain combinations for microscopic analysis. This showed extensive hyphal proliferation throughout epidermal cells and in underlying tissue already at the 2‐day time point for all strain combinations (Fig. 6C and data not shown). In addition, no apparent differences in hyphal ramification between these combinations were detected at later stages (data not shown). Fungal proliferation in individual tumours 6 days after inoculation with the Δiad1Δiad2 and theΔiad1Δiad2Δtam1Δtam2 strain combinations, respectively, was further assessed by PCR analysis. This revealed that the Δiad1Δiad2Δtam1Δtam2 strain combination was able to proliferate at the same rate as the parental Δiad1Δiad2 combination (Fig. 6D), indicating that the reduced IAA amounts in host tissue infected with the quadruple mutants were not the result of impaired fungal proliferation.
DISCUSSION
Recapitulation of IAA biosynthesis in U. maydis has revealed that indole‐3‐acetaldehyde dehydrogenase activities of Iad1 and Iad2 are central for the conversion of both IAAld and TAM to IAA and has emphasized a connection between IPA and IAA formation. The route of IAA formation from Trp depends strongly on the carbon source. While IAA formation via IPA predominates in glucose‐containing medium independently of Iad1 and Iad2, IAAld dehydrogenase‐mediated IAA formation proceeds in the absence of glucose. U. maydis mutants blocked in IPA formation and devoid of IAAld dehydrogenase activity were most severely affected in the conversion of Trp to IAA and gave insight into the contribution of fungal IAA formation to elevated IAA levels in infected host tissue and induction of host tumours.
Indole‐3‐acetaldehyde dehydrogenases in U. maydis
We have identified the iad2 gene encoding an IAAld dehydrogenase, responsible for the residual IAA formation from IAAld in Δiad1 mutants. However, the contributions of Iad1 and Iad2 to IAA formation are not equal and, in contrast to Δiad1 mutants, Δiad2 mutants are not significantly reduced in IAA formation from IAAld. The severe loss of IAAld dehydrogenase activity in ΔiadΔ1iad2 mutants suggests a concerted action of both enzymes and excludes redundant enzyme activities among the additional predicted aldehyde dehydrogenases in U. maydis. Of note, the ability to function as IAAld dehydrogenase does not correlate with sequence similarity to Iad1 as exemplified from the finding that Pad2, which exhibits the highest similarity to Iad1, lacks IAAld dehydrogenase activity. Conceivably, amino acids specific for Iad1 and Iad2 participate in substrate specificity. An alignment of the Iad1 and Iad2 sequences revealed C‐terminally localized amino acids exclusively shared between Iad1 and Iad2 and not found in any of the other predicted aldehyde dehydrogenase sequences in U. maydis (see Fig. 3; data not shown). Thus, it will be tempting to explore whether these residues in Iad1 and Iad2 play a role in substrate recognition.
IAA formation via a possible tryptamine pathway in U. maydis
The requirement for both Iad1 and Iad2 to convert TAM to IAA together with the significant contribution of Iad1 to IAA formation from Trp in CM/Ara provides evidence for a TAM pathway in U. maydis. However, it is presently unclear how TAM is converted to IAAld and whether IAOx is involved in IAA formation. HPLC analysis of cell‐free cultures from Trp as well as from TAM feeding experiments in CM/Ara did not reveal a compound eluting like IAOx (data not shown), leaving the possibility that IAOx is rapidly metabolized. Due to the prevalent role of Iad1 in IAA biosynthesis from TAM, the inability for TAM to IAA conversion in the presence of glucose cannot be attributed to the lack of Iad2 activity, but indicates that additional enzymes acting downstream of TAM must be under glucose repression. In Arabidopsis, the YUCCA enzyme is able to convert TAM to N‐hydroxyl‐TAM and members of the Arabidopsis YUC gene family play a key role in auxin biosynthesis and plant development (Cheng et al., 2006; Zhao et al., 2001). However, enzymes acting downstream of YUCCA remain elusive. In this respect, the U. maydis cell culture system based on precursor feeding could provide a means by which mutants blocked in TAM conversion can be identified and the responsible genes cloned.
The role of indole‐3‐pyruvic acid in IAA formation in U. maydis
In glucose‐containing medium, U. maydis efficiently produces IPA from Trp (Basse et al., 1996). We now implicate the tam1 and tam2 genes encoding potential aromatic amino acid aminotransferases in this pathway. The absence of tam1 strongly reduced IPA formation from Trp and caused a marked decrease in IAA levels, emphasizing that IPA serves as an efficient precursor for IAA formation from Trp in U. maydis. Levels of IPA and IAA could be further diminished in the absence of tam2, indicating that both Tam1 and Tam2 function as Trp aminotransferase. The restriction of detectable IPA formation to glucose‐containing medium was not reflected at the transcriptional level of tam1 and tam2, suggesting regulation at the post‐transcriptional level. Furthermore, the observation that tam1 also contributed to IAA formation from Trp in medium with arabinose as the carbon source implies low levels of IPA accumulation also under these conditions. In S. cerevisiae, Aro8 and Aro9 function in Trp deamination. Aro8 expression is subject to the general control of amino acid biosynthesis (Iraqui et al., 1998). While the catabolic enzyme Aro9 is mainly involved in Trp degradation, Aro8 aminotransferase is responsible for Phe and Tyr biosynthesis (Iraqui et al., 1998 and references therein). Future investigations need to show whether such distinct roles can also be ascribed to U. maydis tam1 and tam2 products.
In contrast to Δtam1 mutants, theΔiad1Δiad2 mutants were only weakly reduced in IAA formation from Trp in glucose‐containing medium. As IAAld dehydrogenase activity is central within the IPA pathway, this implies that a major portion of IPA is not metabolized to IAA via IAAld, but probably via non‐enzymatic degradation due to the unstable nature of IPA in aqueous solutions (Sheldrake, 1973).
The observation of residual IAA formation in Δiad1Δiad2Δtam1Δtam2 mutants points to additional intermediates besides IPA and IAAld in the conversion of Trp to IAA. However, we could not provide evidence for IAA formation from IAN in U. maydis and the predicted nitrilase Nit1 does not contribute to IAA formation. With respect to the bacterial IAM pathway known from plant pathogenic bacteria, the U. maydis genome annotated by MIPS contains no sequence with significant similarity to bacterial Trp 2‐monooxygenases. By contrast, the U. maydis genome revealed two predicted amidase genes (MIPS annotation nos. um10207 and um04505), whose deduced amino acid sequences show strong similarity (> 35% identity) to the highly conserved stretch of 118 amino acids of Agrobacterium tumefaciens IAM hydrolase (accession no. P25016), which includes the catalytic site residues (Kobayashi et al., 1997; Pollmann et al., 2003). Feeding experiments of U. maydis cultures with IAM revealed IAA formation, although a > 50‐fold elevated substrate concentration was required to yield similar IAA amounts as produced from 20 µm IAAld (C. W. Basse, unpublished data).
IAA formation in other fungal species
In contrast to the broad insight into IAA biosynthesis pathways in plants and bacteria (Spaepen et al., 2007), little is known about IAA biosynthesis in fungi. Possible intermediates reported thus far are IAAld, IPA, TAM and IAM (see Fig. 1), suggesting the occurrence of the IPA, TAM and IAM pathways, respectively, while consistent with our study, IAA formation via IAN has not been reported (Chung and Tzeng, 2004 and references therein). Pathways involving IAAld and IAM were reported for the phytopathogenic fungi Colletotrichum gloeosporioides f.sp. aeschynomene and Colletotrichum acutatum (Chung et al., 2003; Robinson et al., 1998). In C. gloeosporioides, feeding with IAM resulted in efficient IAA formation, while IAAld was mainly converted to Tol with minor IAA formation (Robinson et al., 1998). In both species, IAM accumulated as an intermediate from Trp feeding, although no or only low amounts of IPA were detected in culture filtrates. This indicates marked differences to U. maydis, in which efficient conversion of Trp to IPA and of IAAld to IAA occurs. The ability to synthesize IAA from Trp was also detected in Ustilago esculenta and U. scitaminea. Reminiscent of U. maydis, U. esculenta converted IAAld to IAA efficiently; however, IAM did not serve as a precursor compound (Chung and Tzeng, 2004). Increased amounts of IAA were also measured in galls of the aquatic grass Zizania latifolia in response to infection with U. esculenta (Chung and Tzeng, 2004) and in citrus flower petals infected with C. acutatum causing post‐bloom fruit drop (Lahey et al., 2004). While these studies demonstrate fungal IAA production from Trp and suggest underlying pathways, the responsible genes have not been identified and hence a possible influence of fungal IAA formation on the development of disease symptoms could not be addressed in these systems.
Role of fungal IAA in tumour formation
The generation of U. maydis mutants severely compromised in IAA formation allowed us to address a possible role of fungal IAA production in host tumour formation. Turian and Hamilton (1960) demonstrated 20‐ and fivefold higher IAA concentrations in tumour tissue prior to and during sporulation, respectively, compared with non‐infected maize stalk tissue. We now show that free IAA levels increase only transiently in leaves prior to sporulation. Their determination of an IAA concentration of 24 nm in non‐infected tissue is similar to the IAA concentration of 25–50 nm in non‐infected leaf tissue as reported here, with a culmination of free IAA amounts in infected leaf tissue at the 4‐day time point, which coincides with the onset of visible tumour formation. IAA is the major auxin in plants and has profound roles in the regulation of plant growth and development, including cell division, elongation and differentiation (Estelle, 1992; Friml, 2003; Kepinski and Leyser, 2003). Thus, IAA might also play a role in increased cell growth associated with tumour formation after U. maydis infection (Callow and Ling, 1973; Doehlemann et al, 2007; Snetselaar and Mims, 1994). Among the generated U. maydis mutant strains, those harbouring the Δtam1 deletion were most severely affected in IAA formation in culture. Surprisingly, none of the triple or quadruple mutants constructed was affected in triggering tumour formation on different organs of infected plants. However, in 6‐day‐old tumour tissue from plants infected with these mutant strains, IAA levels were no longer increased over those in non‐infected tissue (see Fig. 6B). This indicates that the fungal conversion of Trp to IPA critically contributes to IAA levels in U. maydis‐infected tissue, but this is not essential for host tumour formation. The finding that IAA levels are still increased about twofold when mock‐infected tissue and tissue infected with the Δiad1Δiad2Δtam1 mutants are compared at the 4‐day time point (see Fig. 6B) suggests that this increase results either from increased synthesis by the host (Kriechbaumer et al., 2006) or from mobilization of auxin from conjugates (Woodward and Bartel, 2005). The maize ZmNit2 gene has been proposed to participate in IAA formation in maize kernels (Park et al., 2003). Northern blot analysis of zmnit2 transcript levels in U. maydis‐infected leaf tissue from immediately to 6 days after inoculation indicated constitutive expression, thus providing no clue for induced IAA biosynthesis during tumour formation (B. Heinze and C. Basse, unpublished data). In support of a role of IAA in host tumour formation, DNA‐array analysis has revealed strong upregulation of the maize expansin genes EXPA4, EXPB3 and EXPB8 (NCBI accession nos. AY106266.1, BM381516 and AA072435) in 5‐day‐old tumour tissue (var. Early Golden Bantam) infected with strains FB1 and FB2 compared with mock‐infected tissue (M. Vranes and J. Kämper, unpublished data). Expansins induce cell expansion and their induced expression depends on polar auxin transport (Tanaka et al., 2006). Several reports have highlighted the ability of plant‐colonizing bacteria to modulate auxin signalling in plants and provided examples for interference of auxins with the host defence system (Spaepen et al., 2007). In U. maydis‐infected maize tissue, signs of a weak defence response, such as production of the antimicrobial compound DIMBOA, and PR‐1 gene expression have been observed (Basse, 2005). The U. maydis IAA mutant strains generated may now be exploited to assess an influence of fungal IAA on defence‐ as well as tumour‐related host gene expression.
EXPERIMENTAL PROCEDURES
Strains, growth conditions and chemicals
Escherichia coli K12 strain TOP10 (Invitrogen, Karlsruhe, Germany) was used as host for plasmid amplification. Ustilago maydis strains FB1 (a1b1), FB2 (a2b2), FB1Δiad1, FB2Δiad1 and 521 (a1b1) have been described previously (Banuett and Herskowitz, 1989; Basse et al., 1996; Kämper et al., 2006). The antibiotics carboxin (cbx), nourseothricin (nat) and phleomycin (ble) used for U. maydis selection were purchased from Riedel‐de Haën (Hannover, Germany), Werner BioAgents (Jena‐Cospeda, Germany) and Invivogen (Toulouse, France), respectively. U. maydis strains were grown at 28 °C in YEPSL medium [1% (w/v) yeast extract, 0.4% (w/v) peptone, 0.4% (w/v) sucrose] modified from Tsukuda et al. (1988) or complete medium (CM) (Holliday, 1974). Mating of compatible strains was performed on solid charcoal‐containing CM at room temperature for 48 h (Holliday, 1974). Infection of 6‐day‐old maize (Zea mays) plants (var. Early Golden Bantam; Olds Seed, Madison, WI) was performed as described (Basse, 2005). Sporidia were adjusted to cell densities of about 4 × 10⁷/mL prior to inoculation. HPLC solvents and water were from Mallinckrodt Baker (Griesheim, Germany). All other chemicals were of analytical grade and obtained from Sigma (Taufkirchen, Germany) or Roth (Karlsruhe, Germany).
DNA and RNA procedures
DNA and RNA procedures were performed as described (Basse et al., 2000). 32P‐labelled fragments for DNA and RNA gel blot analysis were generated using the NEBlot kit (New England Biolabs, Frankfurt am Main, Germany). Detection and quantification of radioactive signals was done using a STORM PhosphorImager and ImageQuant software (Molecular Dynamics, Sunnyvale, CA). For Southern blot analysis, genomic DNA from strain FB1Δiad1 was digested with PstI and probed with the 32P‐labelled AgeI/BstBI iad1 fragment (Basse et al., 1996). Southern hybridization was performed under non‐stringent conditions at 60 °C omitting stringent washing steps. For RNA gel blot analysis, probes for iad2 (positions 231–1446 of um03402), tam1 (28–1129 of um01804) and tam2 (289–1454 of um03538) were amplified from genomic DNA (strain FB1). The pad16 probe was isolated as NcoI/XhoI fragment from pBADpad16 (see below). The ppi probe has been described (Bohlmann, 1996). PCR‐based isolation of iad2 was performed with genomic FB1Δiad1 DNA and the degenerate oligonucleotides AD22 (5′‐GGAATTCAARAARGTBACNCTBGAR‐3′; IUPAC‐code; restriction site underlined) and AD44 (5′‐GGAAT TCTTRWADCCDCCRAANGG‐3′) deduced from the amino acid sequences KKVTLE (AD33) and PFGGY/FK (AD44), respectively, conserved among Iad1 and a number of fungal aldehyde dehydrogenase sequences (accession nos. A39410, P42041, P41751 and P40108). Southern blot analysis of cloned PCR fragments was performed to identify DNA fragments different from pad2 and pad3.
Constructs for expression in E. coli
For expression in pBAD102/D‐TOPO (Invitrogen) the entire ORFs of selected genes were amplified from genomic DNA of strain 521 (PfuUltra, Stratagene, Amsterdam, The Netherlands) using the following primer pairs: 5′‐CACCATGGCAACTCTCAACCTCGATCTG‐3′/5′‐GATAGGGGCAGGCTGGCTGAGGTTC‐3′ (iad1); 5′‐CACCAT GGACTCATCGCATGGTACAAC‐3′/5′‐CAGTTTGGGAAGCGGCCAATCG‐3′ (pad2); 5′‐CACCATGGCTGTTGGCGTTGCTTC‐3′/5′‐GGCTTTGGGGATCCAGAGTGCTTG‐3′ (iad2); 5′‐CACCATGGCTGAACCCGTCTGCACG‐3′/5′‐AGCGTCAAACACGACACCCTGC‐3′ (pad16). PCR products were cloned into the pBAD102/D‐TOPO vector. The thx region at the 5′ positions of the inserted ORFs was removed by deleting the smaller internal NcoI fragment. Final plasmids were denoted pBADiad1, pBADpad2, pBADiad2, and pBADpad16, respectively.
Deletion of iad2
A 3273‐bp genomic HindIII fragment comprising the complete iad2 ORF between positions 452 and 1900 was isolated from a cosmid library (Bölker et al., 1995) and cloned into pUC18 (Amersham‐Pharmacia Biotech, Freiburg, Germany) to yield plasmid pCIII. An internal PmlI fragment (positions 661–1930) was replaced with the nat resistance cassette isolated as NotI(blunt) fragment from plasmids pSLNat (Müller et al., 2003). The resulting plasmid pCIIInatVI was linearized at the AatII site prior to transformation into U. maydis strains FB1, FB2, FB1Δiad1 and FB2Δiad1. Demonstration of homologous integration was based on PCR using a primer pair within the deleted region and primer combinations spanning flanking regions between the resistance cassette and positions beyond the HindIII site on either side.
Deletion of nit1, tam1 and tam2
Δnit1, Δtam1 andΔtam2 deletion strains were generated applying the PCR‐based protocol (Kämper, 2004). Flanking sequences of c. 1 kb were amplified (Phusion™ High‐Fidelity PCR, New England Biolabs) from chromosomal DNA of U. maydis strains FB1 (Δtam1,Δnit1) and 521 (Δtam2). Primer combinations used were: 5′‐GGGTATTTGATCAGCTCTTGATCC‐3′/5′‐GTGGGCCATC TAGGCCTGTTGTTGCCGTGAGAGGTGC‐3′ (left flank of nit1) and 5′‐CACGGCCTGAGTGGCCGAAAGCGCCGAGCGTGACAAGG‐3′/5′‐GCTCAAAGTCTTCAGAGCGGAGCA‐3′ (right flank of nit1), 5′‐GCTCGTCTGGGGTACCATGCAAG‐3′/5′‐CACGGCCTGAGTGG CCTGGCGATGTGGCCGAGGACATC‐3′ (left flank of tam2) and 5′‐GTGGGCCATCTAGGCCGGCTCCAGATTCCTGCCTAG‐3′/5′‐CATGTCAACAGACCCAGCTGC‐3′ (right flank of tam2), 5′‐ATAATGGCCACGTGGGCCAGCCGCAAAGTCGAATAAGC‐3′/5′‐ATAATGG CCTGAGTGGCCGGTTTGACAGGGAGGATATTGG‐3′ (left flank of tam1) and 5′‐ATCTAGGCCATCTAGGCCTGAGCTCGCTTAAATGG‐3′/5′‐ATAATGGCCACGTGGGCCGATTCATACTCGCGGAACC‐3′ (right flank of tam1). PCR products were cleaved with SfiI (recognition sites underlined in primers) for ligation with the ble (Δtam2) or cbx (Δnit1, Δtam1) resistance cassettes isolated with SfiI from pMF1‐p and pMF1‐c, respectively (Brachmann et al., 2004). Ligation products were cloned into the pCR2.1, pCR4‐TOPO or pCR4Blunt‐TOPO vectors (Invitrogen), from which they were re‐amplified or isolated for subsequent transformation in U. maydis. Homologous integration of all constructs was analysed by PCR using a primer pair within the deleted region and primer combinations spanning flanking regions on either side, as described (Kämper, 2004). For additional Southern blot analysis of Δnit1, Δtam1 and Δtam2 deletion strains, genomic DNA was restricted with NdeI, BamHI and BssHII, respectively, and probed with either the left flank of the deletion construct (Δnit1) or the entire deletion constructs (Δtam1,Δtam2).
Growth conditions of E. coli and enzyme assays
E. coli strains harbouring pBAD102/D‐TOPO constructs were incubated in Luria–Bertani medium containing ampicillin (100 µg/mL) at 37 °C under shaking. Arabinose was added to a final concentration of 0.1% (w/v) to cultures at an A 600 of 0.5 and incubation was continued for 5 h (t 1) under the same conditions. Control incubations occurred in the absence of arabinose. Pellets from 50 mL of culture were harvested at t 1, resuspended in ice‐cold enzyme extraction buffer (50 mm Tris‐HCl, pH 7.5; 5 mm dithiothreitol, 0.2 mm EDTA, Complete Protease Inhibitor; Roche, Mannheim, Germany) and stored frozen at –80 °C. Cells were thawed and disrupted in a chilled (0 °C) French pressure cell (SLM‐Aminco Instruments, IL). Cell lysates were centrifuged (15 min, 10 000 g, 4 °C) and supernatants desalted on a PD‐10 column (Amersham‐Pharmacia Biotech) as described (Basse et al., 1996). Protein concentrations were determined according to the Bradford method using bovine serum albumin as standard. Protein preparations (50 µL corresponding to 0.7 mL of cell culture) were incubated in the presence of 0.5 mm IAAld in 200 µL 60 mm Tris‐HCl, pH 7.0, 100 mm KCl, 1 mm NAD+ for 30 min at 30 °C. Reaction mixtures were acidified with HCl, extracted with ethyl acetate, which removes IAAld, and analysed for IAA formation with the use of the Salkowski reagent or by reversed‐phase HPLC (gradient II) as described (Basse et al., 1996; see below).
HPLC analysis
HPLC analysis was performed on Beckman Coulter (Krefeld, Germany) System Gold 126/168 solvent/detector modules equipped with a C18 ultrasphere column (4.6 × 250 mm) connected to a precolumn (4.6 × 45 mm) (both 5 µm; Beckman Coulter). Solvent conditions were as described (Basse et al., 1996). Gradient I (based on 0.1% trifluoroacetic acid) was run to separate extracts from Trp feeding and gradient II (based on 20 mm ammonium acetate, pH 6.5) was run to separate extracts from IAAld and TAM feedings. The identity of IAA formation from Trp has previously been verified by mass spectroscopy (Basse et al., 1996). The strong shifts in the retention time values for IAA and IPA between gradients I and II (see supplementary Fig. S1) are due to the negative charge of the carboxyl group under neutral conditions. Peak areas were calculated using the 32 Karat Software tool (Beckman Coulter). Collected fractions were dried under vacuum for the detection of IAA or IPA with the Salkowski reagent. Water treated with the Salkowski reagent served as blank. Colorimetric reactions were measured with a SAFIRE microplate reader (TECAN, Grödig, Austria) at 530 nm.
Immunoblot analysis
Frozen E. coli cell pellets collected at t 1 (see above) were thawed and boiled in Laemmli buffer, and protein amounts (corresponding to 40 µL of cell culture) were applied to sodium dodecyl sulphate (SDS)‐PAGE (10%) for subsequent immunoblot analysis using an anti‐His (C‐term) antibody (1 : 5000 dilution of a 1.01 mg/mL solution; Invitrogen). A goat anti‐mouse IgG‐horseradish peroxidase conjugate (1 : 2500 diluted; Promega, Mannheim, Germany) was used as secondary antibody. The Broad Range prestained protein marker from New England Biolabs was used as size marker (10 µL per lane).
Feeding experiments
U. maydis was cultivated with either tryptophan (5 mm), IAAld (20 µm or 0.2 mm) or tryptamine (0.5 mm) in CM/Ara (1%, w/v) or CM/Glc (1%, w/v). Cultures started at cell densities of c. 2 × 10⁶/mL, if not otherwise indicated, and were incubated under shaking (200 r.p.m.) at 28 °C for 14 h. Cell‐free supernatants were analysed with the Salkowski reagent and by reversed‐phase HPLC (gradients I and II) as described (Basse et al., 1996). Strain FB1 cultivated in the respective CM medium in the absence of the supplemented precursor, and non‐inoculated medium containing the precursor served as blank values for product quantification from optical densities at 220 nm. Strains were inoculated in parallel for triplicate measurements.
Determination of IAA in plant tissue
Plant tissue (pooled from ten or more samples collected from different plants each) was harvested and immediately frozen in liquid nitrogen. For IAA determination, tissue was ground in liquid nitrogen and resuspended in methanol to a concentration of 0.25 g plant material (fresh weight)/mL. Three samples (replicates) of 1 mL each (0.25 g fresh plant material per sample) were removed, supplemented with 25 pmol [2H]2‐IAA (internal standard; Campro Scientific, Berlin, Germany) and incubated under shaking for 3 min at 50 °C. Incubation was continued for 10 min under shaking at 25 °C and without shaking for 1 h at 25 °C. Cell‐free supernatants were removed, the pellets were washed with 0.5 mL methanol and the combined supernatants were dried under vacuum for subsequent gas chromatography‐tandem mass spectrometry analysis as previously described (Müller et al., 2002). In brief, the dried residues were dissolved in 30 µL methanol, to which 200 µL diethyl ether was added, followed by ultrasonic treatment (Sonorex RK510S; Bandelin, Berlin, Germany). The particle‐free sample was then applied to a custom‐made microscale aminopropyl solid‐phase extraction‐cartridge. The cartridge was washed with 250 µL CHCl3:2‐propanol = 2:1 (v/v), and the hormone‐containing fraction thereafter eluted with 400 µL acidified diethyl ether (2% acetic acid, v/v). The eluates were taken to dryness, re‐dissolved in 20 µL methanol, and afterwards treated with 100 µL ethereal diazomethane and transferred to autosampler vials [Chromacol 05‐CTV(A) 116; Fisher Scientific, Schwerte, Germany]. Excessive diazomethane and remaining solvent were removed in a gentle stream of nitrogen, and the methylated samples were then taken up in 15 µL of chloroform. To analyse the contents of acidic phytohormones in the samples, an aliquot of 1 µL of each was injected into the GC‐MS system. All spectra were recorded on a Varian Saturn 2000 ion‐trap mass spectrometer connected to a Varian CP‐3800 gas chromatograph (Varian, Walnut Creek, CA), equipped with a ZB‐50 fused silica capillary column (Phenomenex, Torrance, CA). The mass spectrometer was used in CI‐MRM mode with methanol as the reactant gas and positive ion detection. The setting for endogenous IAA was chosen as follows: IAA m/z = 190 [M + H]+, 0.50 V. A second channel analysing the [2H]2‐IAA standard used an identical excitation amplitude for the following parent ion: [2H]2‐IAA m/z = 192 [M + H]+. The amount of endogenous compound was calculated from the signal ratio of the unlabelled over the stable isotope‐containing mass fragment observed in both analysing channels.
Detection of U. maydis in infected maize tissue
Infected leaf blade tissue was collected exclusively from the third and fourth leaves beneath the inoculation site. Staining with Chlorazol Black E (CBE) followed the method of Brundrett et al. (1996). Chromosomal DNA from infected maize tissue was isolated with the DNeasy plant kit (Qiagen, Hildesheim, Germany). Detection of fungal DNA in infected plant tissue was performed by PCR analysis using the combination of 5′‐GACCACTCTTGACGACACGGCTTACC‐3′/5′‐ GGCGTGAATGTAAGCGTGACATAAC‐3′ primers, which specifically bind within the nat resistance cassette. The absence of tam1 (um01804) in strain combinations carrying the Δtam1 deletion was ensured by using the combination of 5′‐TGAGAGCCTCTCGCTGAACCTCAAGC‐3′/5′‐GGATCTTGGAGAAGCTCTCGAAACG‐3′tam1‐specific primers.
Databases
Nucleotide sequences were compared using the NCBI database with BLAST, and accession numbers refer to this database if not otherwise indicated. Genomic sequences of U. maydis were retrieved from the Broad Institute (http://www.broad.mit.edu/annotation/fungi/ustilago_maydis/). Protein sequences and um numbers were retrieved from the MIPS (Munich Information Center for Protein Sequences) Ustilago maydis Database (MUMDB; http://mips.gsf.de/genre/proj/ustilago/). Predictions of mitochondrial targeting sequences were made with MITOPROT (http://www.expasy.ch).
NOTE ADDED IN PROOF
The citation J. Schirawski, unpublished data, has now been published: The tryptophan aminotransferase Tam1 catalyses the single biosynthetic step for tryptophan‐dependent pigment synthesis in Ustilago maydis. Zuther, K., Mayser, P., Hettwer, U., Wu, W., Spiteller, P., Kindler, B.L.J., Karlovsky, P., Basse, C.W. and Schirawski J. Molecular Microbiology Published article online: 26‐Feb‐2008 doi: 10.1111/j.1365-2958.2008.06144.x.
Supporting information
Supporting info item
ACKNOWLEDGEMENTS
We thank the Deutsche Forschungsgemeinschaft for financial support of B.H. (grant no. SFB 395). We are grateful to Professor Elmar Weiler and his technical assistant Petra Düchting, Ruhr‐University of Bochum, Germany, for their generous support in the determination of IAA levels in maize tissue and for providing the IAOx standard. We thank Stephan Stumpferl for the isolation of U. maydis pad2, pad3 and iad2 fragments, Kai Luh and Emine Kaya for their support in generating Δtam2 mutants, Katja Zuther for providing the Δtam1 deletion construct, and Kathrin Auffarth and Elmar Meyer for technical assistance. In addition, we would like to thank Dr Stephan Pollmann (Ruhr‐University of Bochum) for providing detailed information to the GC‐MS protocol for IAA analysis.
REFERENCES
- Bak, S. , Tax, F.E. , Feldmann, K.A. , Galbraith, D.W. and Feyereisen, R. (2001) CYP83B1, a cytochrome P450 at the metabolic branch point in auxin and indole glucosinolate biosynthesis in Arabidopsis. Plant Cell, 13, 101–111. [DOI] [PMC free article] [PubMed] [Google Scholar]
- Banuett, F. and Herskowitz, I. (1989) Different a alleles of Ustilago maydis are necessary for maintenance of filamentous growth but not for meiosis. Proc. Natl Acad. Sci. USA, 86, 5878–5882. [DOI] [PMC free article] [PubMed] [Google Scholar]
- Banuett, F. and Herskowitz, I. (1996) Discrete developmental stages during teliospore formation in the corn smut fungus, Ustilago maydis . Development, 122, 2965–2976. [DOI] [PubMed] [Google Scholar]
- Barlier, I. , Kowalczyk, M. , Marchant, A. , Ljung, K. , Bhalerao, R. , Bennett, M. , Sandberg, G. and Bellini, C. (2000) The SUR2 gene of Arabidopsis thaliana encodes the cytochrome P450 CYP83B1, a modulator of auxin homeostasis. Proc. Natl Acad. Sci. USA, 97, 14819–14824. [DOI] [PMC free article] [PubMed] [Google Scholar]
- Basse, C.W. (2005) Dissecting defense‐related and developmental transcriptional responses of maize during Ustilago maydis infection and subsequent tumor formation. Plant Physiol. 138, 1774–1784. [DOI] [PMC free article] [PubMed] [Google Scholar]
- Basse, C.W. and Steinberg, G. (2004) Pathogen profile: Ustilago maydis, model system for analysis of the molecular basis of fungal pathogenicity. Mol. Plant Pathol. 5, 83–92. [DOI] [PubMed] [Google Scholar]
- Basse, C.W. , Lottspeich, F. , Steglich, W. and Kahmann, R. (1996) Two potential indole‐3‐acetaldehyde dehydrogenases in the phytopathogenic fungus Ustilago maydis . Eur. J. Biochem. 242, 648–656. [DOI] [PubMed] [Google Scholar]
- Basse, C.W. , Stumpferl, S. and Kahmann, R. (2000) Characterization of a Ustilago maydis gene specifically induced during the biotrophic phase: evidence for negative as well as positive regulation. Mol. Cell. Biol. 20, 329–339. [DOI] [PMC free article] [PubMed] [Google Scholar]
- Bohlmann, R. (1996) Isolierung und Charakterisierung von filamentspezifisch exprimierten Genen aus Ustilago maydis. PhD thesis, LMU Munich. [Google Scholar]
- Bölker, M. , Böhnert, H.U. , Braun, K.‐H. , Görl, J. and Kahmann, R. (1995) Tagging pathogenicity genes in Ustilago maydis by restriction enzyme‐mediated integration (REMI). Mol. Gen. Genet. 248, 547–552. [DOI] [PubMed] [Google Scholar]
- Brachmann, A. , König, J. , Julius, C. and Feldbrügge, M. (2004) A reverse genetic approach for generating gene replacement mutants in Ustilago maydis . Mol. Genet. Genomics, 272, 216–226. [DOI] [PubMed] [Google Scholar]
- Brundrett, M. , Bougher, N. , Dell, B. , Grove, T. and Malajczuk, N. (1996) Working with Mycorrhizas in Forestry and Agriculture, Monograph 32. Canberra, Australia: Australian Centre for International Agricultural Research. [Google Scholar]
- Callow, J.A. and Ling, I.T. (1973) Histology of neoplasms and chlorotic lesions in maize seedlings following the injection of sporidia of Ustilago maydis (DC) Corda. Physiol. Plant Pathol. 3, 489–494. [Google Scholar]
- Cheng, Y. , Dai, X. and Zhao, Y. (2006) Auxin biosynthesis by the YUCCA flavin monooxygenases controls the formation of floral organs and vascular tissues in Arabidopsis . Genes Dev. 20, 1790–1799. [DOI] [PMC free article] [PubMed] [Google Scholar]
- Christensen, J.J. (1963) Corn smut caused by Ustilago maydis. St. Paul, MN: American Phytopathological Society. [Google Scholar]
- Chung, K.R. and Tzeng, D.D. (2004) Biosynthesis of indole‐3‐acetic acid by the gall‐inducing fungus Ustilago esculenta . J. Biol. Sci. 4, 744–750. [Google Scholar]
- Chung, K.R. , Shilts, T. , Erturk, U. , Timmer, L.W. and Ueng, P.P. (2003) Indole derivatives produced by the fungus Colletotrichum acutatum causing lime anthracnose and postbloom fruit drop of citrus. FEMS Microbiol. Lett. 226, 23–30. [DOI] [PubMed] [Google Scholar]
- Cooney, T.P. and Nonhebel, H.M. (1989) The measurement and mass spectral identification of indole‐3‐pyruvate from tomato shoots. Biochem. Biophys. Res. Commun. 162, 761–766. [DOI] [PubMed] [Google Scholar]
- Doehlemann, G. , Wahl, R. , Vranes, M. , De Vries, R.P. , Kämper, J. and Kahmann, R. (2007) Establishment of compatibility in the Ustilago maydis/maize pathosystem. J. Plant. Physiol. 165, 29–40. [DOI] [PubMed] [Google Scholar]
- Estelle, M. (1992) The plant hormone auxin: insight in sight. Bioessays, 14, 439–444. [DOI] [PubMed] [Google Scholar]
- Fedorova, E. , Redondo, F.J. , Koshiba, T. , Pueyo, J.J. , De Felipe, M.R. and Lucas, M.M. (2005) Aldehyde oxidase (AO) in the root nodules of Lupinus albus and Medicago truncatula: identification of AO in meristematic and infection zones. Mol. Plant–Microbe Interact. 18, 405–413. [DOI] [PubMed] [Google Scholar]
- Friml, J. (2003) Auxin transport‐shaping the plant. Curr. Opin. Plant Biol. 6, 7–12. [DOI] [PubMed] [Google Scholar]
- Glickmann, E. and Dessaux, Y. (1995) Critical examination of the specificity of the Salkowski reagent for indolic compounds produced by phytopathogenic bacteria. Appl. Environ. Microbiol. 61, 793–796. [DOI] [PMC free article] [PubMed] [Google Scholar]
- Holliday, R. (1974) Ustilago maydis In: Handbook of Genetics (King R.C., ed.), pp. 575–595. New York: Plenum Press. [Google Scholar]
- Hull, A.K. , Vij, R. and Celenza, J.L. (2000) Arabidopsis cytochrome P450 s that catalyze the first step of tryptophan‐dependent indole‐3‐acetic acid biosynthesis. Proc. Natl Acad. Sci. USA, 97, 2379–2384. [DOI] [PMC free article] [PubMed] [Google Scholar]
- Iraqui, I. , Vissers, S. , Cartiaux, M. and Urrestarazu, A. (1998) Characterisation of Saccharomyces cerevisiae ARO8 and ARO9 genes encoding aromatic aminotransferases I and II reveals a new aminotransferase subfamily. Mol. Gen. Genet. 257, 238–248. [DOI] [PubMed] [Google Scholar]
- Kahmann, R. , Steinberg, G. , Basse, C. , Feldbrügge and Kämper, J.M. (2000) Ustilago maydis, the causative agent of corn smut disease In: Fungal Pathology (Kronstad J.W., ed.), pp. 347–371. Dordrecht, The Netherlands: Kluwer. [Google Scholar]
- Kämper, J. (2004) A PCR‐based system for highly efficient generation of gene replacement mutants in Ustilago maydis . Mol. Genet. Genomics, 271, 103–110. [DOI] [PubMed] [Google Scholar]
- Kämper, J. , Kahmann, R. , Bölker, M. , Ma, L.J. , Brefort, T. , Saville, B.J. , Banuett, F. , Kronstad, J.W. , Gold, S.E. , Müller, O. , Kämper, J. , Kahmann, R. , Bölker, M. , Ma, L.J. , Brefort, T. , Saville, B.J. , Banuett, F. , Kronstad, J.W. , Gold, S.E. , Müller, O. , Perlin, M.H. , Wösten, H.A. , De Vries, R. , Ruiz‐Herrera, J. , Reynaga‐Peña, C.G. , Snetselaar, K. , McCann, M. , Pérez‐Martín, J. , Feldbrügge, M. , Basse, C.W. , Steinberg, G. , Ibeas, J.I. , Holloman, W. , Guzman, P. , Farman, M. , Stajich, J.E. , Sentandreu, R. , González‐Prieto, J.M. , Kennell, J.C. , Molina, L. , Schirawski, J. , Mendoza‐Mendoza, A. , Greilinger, D. , Münch, K. , Rössel, N. , Scherer, M. , Vranes, M. , Ladendorf, O. , Vincon, V. , Fuchs, U. , Sandrock, B. , Meng, S. , Ho, E.C. , Cahill, M.J. , Boyce, K.J. , Klose, J. , Klosterman, S.J. , Deelstra, H.J. , Ortiz‐Castellanos, L. , Li, W. , Sanchez‐Alonso, P. , Schreier, P.H. , Häuser‐Hahn, I. , Vaupel, M. , Koopmann, E. , Friedrich, G. , Voss, H. , Schlüter, T. , Margolis, J. , Platt, D. , Swimmer, C. , Gnirke, A. , Chen, F. , Vysotskaia, V. , Mannhaupt, G. , Güldener, U , Münsterkötter, M. , Haase, D. , Oesterheld, M. , Mewes, H.W. , Mauceli, E.W. , DeCaprio, D. , Wade, C.M. , Butler, J. , Young, S. , Jaffe, D.B. , Calvo, S. , Nusbaum, C. , Galagan, J. , Birren, B.W. (2006) Insights from the genome of the biotrophic fungal plant pathogen Ustilago maydis . Nature, 444, 97–101. [DOI] [PubMed] [Google Scholar]
- Kepinski, S. and Leyser, O. (2003) Plant development: an axis of auxin. Nature, 426, 132–135. [DOI] [PubMed] [Google Scholar]
- Kobayashi, M. , Fujiwara, Y. , Goda, M. , Komeda, H. and Shimizu, S. (1997) Identification of active sites in amidase: evolutionary relationship between amide bond‐and peptide bond‐cleaving enzymes. Proc. Natl Acad. Sci. USA, 94, 11986–11991. [DOI] [PMC free article] [PubMed] [Google Scholar]
- Kriechbaumer, V. , Park, W.J. , Gierl, A. and Glawischnig, E. (2006) Auxin biosynthesis in maize. Plant Biol. (Stuttg) 8, 334–339. [DOI] [PubMed] [Google Scholar]
- Lahey, K.A. , Yuan, R. , Burns, J.K. , Ueng, P.P. , Timmer, L.W. and Chung, K.‐R. (2004) Induction of phytohormones and differential gene expression in citrus flowers infected by the fungus Colletotrichum acutatum . Mol. Plant–Microbe Interact. 17, 1394–1401. [DOI] [PubMed] [Google Scholar]
- Magnus, V. , Bandurski, R.S. and Schulze, A. (1980) Synthesis of 4–7 and 2,4–7 deuterium‐labeled indole‐3‐acetic acid for use in mass spectrometric assays. Plant Physiol. 66, 775–781. [DOI] [PMC free article] [PubMed] [Google Scholar]
- Martínez‐Espinoza, A.D. , Garcia‐Pedrajas, M.D. and Gold, S.E. (2002) The Ustilaginales as plant pests and model systems. Fungal Genet. Biol. 35, 1–20. [DOI] [PubMed] [Google Scholar]
- Mikkelsen, M.D. , Hansen, C.H. , Wittstock, U. and Halkier, B.A. (2000) Cytochrome P450 CYP79B2 from Arabidopsis catalyzes the conversion of tryptophan to indole‐3‐acetaldoxime, a precursor of indole glucosinolates and indole‐3‐acetic acid. J. Biol. Chem. 275, 33712–33717. [DOI] [PubMed] [Google Scholar]
- Moulton, J.E. (1942) Extraction of auxin from maize, from smut tumors of maize and from Ustilago zeae . Botanical Gazzete, 103, 725–729. [Google Scholar]
- Müller, A. , Düchting, P. and Weiler, E.W. (2002) A multiplex GC‐MS/MS technique for the sensitive and quantitative single‐run analysis of acidic phytohormones and related compounds, and its application to Arabidopsis thaliana . Planta, 216, 44–56. [DOI] [PubMed] [Google Scholar]
- Müller, P. , Weinzierl, G. , Brachmann, A. , Feldbrügge, M. and Kahmann, R. (2003) Mating and pathogenic development of the smut fungus Ustilago maydis are regulated by one mitogen‐activated protein kinase cascade. Eukaryot. Cell, 2, 1187–1199. [DOI] [PMC free article] [PubMed] [Google Scholar]
- Normanly, J. , Grisafi, P. , Fink, G.R. and Bartel, B. (1997) Arabidopsis mutants resistant to the auxin effects of indole‐3‐acetonitrile are defective in the nitrilase encoded by the NIT1 gene. Plant Cell, 9, 1781–1790. [DOI] [PMC free article] [PubMed] [Google Scholar]
- Park, W.J. , Kriechbaumer, V. , Moller, A. , Piotrowski, M. , Meeley, R.B. , Gierl, A. and Glawischnig, E. (2003) The Nitrilase ZmNIT2 converts indole‐3‐acetonitrile to indole‐3‐acetic acid. Plant. Physiol. 133, 794–802. [DOI] [PMC free article] [PubMed] [Google Scholar]
- Pollmann, S. , Müller, A. , Piotrowski, M. and Weiler, E.W. (2002) Occurrence and formation of indole‐3‐acetamide in Arabidopsis thaliana . Planta, 216, 155–161. [DOI] [PubMed] [Google Scholar]
- Pollmann, S. , Neu, D. and Weiler, E.W. (2003) Molecular cloning and characterization of an amidase from Arabidopsis thaliana capable of converting indole‐3‐acetamide into the plant growth hormone, indole‐3‐acetic acid. Phytochemistry, 62, 293–300. [DOI] [PubMed] [Google Scholar]
- Robinson, M. , Riov, J. and Sharon, A. (1998) Indole‐3‐acetic acid biosynthesis in Colletotrichum gloeosporioides f. sp. aeschynomene . Appl. Environ. Microbiol. 64, 5030–5032. [DOI] [PMC free article] [PubMed] [Google Scholar]
- Schmidt, R.C. , Müller, A. , Hain, R. , Bartling, D. and Weiler, E.W. (1996) Transgenic tobacco plants expressing the Arabidopsis thaliana nitrilase II enzyme. Plant J. 9, 683–691. [DOI] [PubMed] [Google Scholar]
- Sheldrake, A.R. (1973) The production of hormones in higher plants. Biol. Rev. 48, 509–559. [Google Scholar]
- Snetselaar, K.M. and Mims, C.W. (1994) Light and electron microscopy of Ustilago maydis hyphae in maize. Mycol. Res. 98, 347–355. [Google Scholar]
- Sosa‐Morales, M.E. , Guevara‐Lara, F. , Martínez‐Juárez, V.M. and Paredes‐López, O. (1997) Production of indole‐3‐acetic acid by mutant strains of Ustilago maydis (maize smut/huitlacoche). Appl. Microbiol. Biotechnol. 48, 726–729. [Google Scholar]
- Spaepen, S. , Vanderleyden, J. and Remans, R. (2007) Indole‐3‐acetic acid in microbial and microorganism‐plant signaling. FEMS Microbiol. Rev. 31, 425–448. [DOI] [PubMed] [Google Scholar]
- Tam, Y.Y. and Normanly, J. (1998) Determination of indole‐3‐pyruvic acid levels in Arabidopsis thaliana by gas chromatography‐selected ion monitoring‐mass spectrometry. J. Chromatogr. A. 800, 101–108. [DOI] [PubMed] [Google Scholar]
- Tanaka, H. , Dhonukshe, P. , Brewer, P.B. and Friml, J. (2006) Spatiotemporal asymmetric auxin distribution: a means to coordinate plant development. Cell. Mol. Life Sci. 63, 2738–2754. [DOI] [PMC free article] [PubMed] [Google Scholar]
- Tsukuda, T. , Carleton, S. , Fotheringham, S. and Holloman, W.K. (1988) Isolation and characterization of an autonomously replicating sequence from Ustilago maydis . Mol. Cell. Biol. 8, 3703–3709. [DOI] [PMC free article] [PubMed] [Google Scholar]
- Turian, G. and Hamilton, R.H. (1960) Chemical detection of 3‐indolylacetic acid in Ustilago zeae tumors. Biochim. Biophys. Acta, 41, 148–150. [DOI] [PubMed] [Google Scholar]
- Wolf, F.T. (1952) The production of indole acetic acid by Ustilago zeae, and its possible significance in tumor formation. Proc. Natl Acad. Sci. USA, 38, 106–111. [DOI] [PMC free article] [PubMed] [Google Scholar]
- Woodward, A.W. and Bartel, B. (2005) Auxin: regulation, action, and interaction. Ann. Bot. (Lond.) 95, 707–735. [DOI] [PMC free article] [PubMed] [Google Scholar]
- Yamada, T. , Palm, C.J. , Brooks, B. and Kosuge, T. (1985) Nucleotide sequences of the Pseudomonas savastanoi indoleacetic acid genes show homology with Agrobacterium tumefaciens T‐DNA. Proc. Natl Acad. Sci. USA, 82, 6522–6526. [DOI] [PMC free article] [PubMed] [Google Scholar]
- Yoshida, A. , Rzhetsky, A. , Hsu, L.C. and Chang, C. (1998) Human aldehyde dehydrogenase gene family. Eur. J. Biochem. 251, 549–557. [DOI] [PubMed] [Google Scholar]
- Zhao, Y. , Christensen, S.K. , Fankhauser, C. , Cashman, J.R. , Cohen, J.D. , Weigel, D. and Chory, J. (2001) A role for flavin monooxygenase‐like enzymes in auxin biosynthesis. Science, 291, 306–309. [DOI] [PubMed] [Google Scholar]
- Zhao, Y. , Hull, A.K. , Gupta, N.R. , Goss, K.A. , Alonso, J. , Ecker, J.R. , Normanly, J. , Chory, J. and Celenza, J.L. (2002) Trp‐dependent auxin biosynthesis in Arabidopsis: involvement of cytochrome P450s CYP79B2 and CYP79B3. Genes Dev. 16, 3100–3112. [DOI] [PMC free article] [PubMed] [Google Scholar]
Associated Data
This section collects any data citations, data availability statements, or supplementary materials included in this article.
Supplementary Materials
Supporting info item