

SUMMARY
Barley net‐ and spot‐form of net blotch disease are caused by two formae of the hemibiotrophic fungus Pyrenophora teres (P. t. f. teres and P. t. f. maculata). In the present study, suppression subtractive hybridization (SSH) was used in combination with quantitative real‐time reverse transcriptase PCR to identify and profile the expression of defence response (DR) genes in the early stages of both barley–P. teres incompatible and compatible interactions. From a pool of 307 unique gene transcripts identified by SSH, 45 candidate DR genes were selected for temporal expression profiling in infected leaf epidermis. Differential expression profiles were observed for 28 of the selected candidates, which were grouped into clusters depending on their expression profiles within the first 48 h after inoculation. The expression profiles characteristic of each gene cluster were very similar in both barley–P. t. f. teres and barley–P. t. f. maculata interactions, indicating that resistance to both pathogens could be mediated by induction of the same group of DR genes. Chromosomal map locations for 21 DR genes were identified using four doubled‐haploid mapping populations. The mapped DR genes were distributed across all seven barley chromosomes, with at least one gene mapping to within 15 cM of another on chromosomes 1H, 2H, 5H and 7H. Additionally, some DR genes appeared to co‐localize with loci harbouring known resistance genes or quantitative trait loci for net blotch resistance on chromosomes 6H and 7H, as well as loci associated with resistance to other barley diseases. The DR genes are discussed with respect to their map locations and potential functional role in contributing to net blotch disease resistance.
INTRODUCTION
Barley net‐ (NFNB) and spot‐form (SFNB) of net blotch are two of the major diseases affecting barley crops around the world, with grain yield losses of up to 40% reported in severely affected regions (Khan, 1987). Relatively recent outbreaks of net blotch have been reported in all major barley‐growing areas of the world (Mathre, 1997), yet despite having such a devastating impact on grain yield and quality, surprisingly very little is known about the molecular processes, in particular the genes, that regulate a successful defence response between barley and the two pathogens responsible for the disease. The pathogens in question are two formae of the hemibiotrophic fungus Pyrenophora teres, with P. teres f. teres (Ptt) responsible for NFNB and P. teres f. maculata (Ptm) responsible for SFNB (Smedegård‐Petersen, 1971).
At present, the use of resistant barley cultivars is the most effective and economical method of controlling net blotch disease, and the identification of single dominant net blotch resistance (R) genes in barley using molecular markers (Graner et al., 1996; Manninen et al., 2000; Williams et al., 1999) has facilitated the development of resistant cultivars via marker‐assisted selection. Nevertheless, the mixed (sexual and asexual) reproductive system of P. teres (Serenius et al., 2005) constitutes a high evolutionary risk for resistance breeding (McDonald and Linde, 2002). Instances where the pathogen has overcome the effectiveness of R genes in cultivars have been reported (Platz et al., 2000), and therefore as a long‐term option for the control of this disease, alternative strategies need to be developed to account for the introduction or evolution of new virulent pathotypes.
Unlike R genes, which act as genes that encode for proteins involved in pathogen recognition (Dangl and Jones, 2001), defence response (DR) genes are defined as a group of genes that are induced downstream of the recognition event (Dixon and Harrison, 1990). DR genes often show altered expression in response to pathogen challenge and have previously been identified by differential screening methods such as differential display (Sánchez‐Torres and González‐Candelas, 2003), cDNA‐AFLP (Zhang et al., 2003), suppression subtractive hybridization (SSH) (Bittner‐Eddy et al., 2003) and microarray analysis (Zierold et al., 2005). The identified DR genes encode enzymes of secondary metabolism, proteins involved in cell‐wall modification, hydrolases and pathogenesis‐related (PR) proteins, and regulatory proteins controlling the expression of multiple downstream DR genes (Dixon and Harrison, 1990). In a number of pathosystems, the constitutive over‐expression of DR genes in transgenic dicotyledonous and monocotyledonous plants has led to an enhanced resistance level, supporting the hypothesis that the products of these genes are involved in the biosynthesis of defence compounds and/or participate in one or more signal transduction pathways leading to effective host defence (Christensen et al., 2004; Leckband and Lörz, 1998; Oldach et al., 2001). For example, transgenic barley plants carrying a stilbene synthase gene derived from Vitis vinifera L. showed increased resistance to the fungal pathogen Botrytis cinerea (Leckband and Lörz, 1998) and transgenic wheat plants in which a barley chitinase was over‐expressed showed increased resistance to two fungal pathogens, namely Erysiphe graminis f. sp. tritici and Puccinia recondita f. sp. tritici (Oldach et al., 2001).
Recent evidence suggests that DR genes may control the quantitative nature of disease resistance, and to date, several co‐localizations between DR gene markers and quantitative trait loci (QTL) for disease resistance have been reported in rice (Wang et al., 2001; Wisser et al., 2005), potato (Trognitz et al., 2002), and pepper (Pflieger et al., 2001). For NFNB, QTL for disease resistance have been reported on all chromosomes, with several groups identifying what appears to be a common QTL on chromosome 6H (Cakir et al., 2003; Friesen et al., 2006; Manninen et al., 2000). In contrast, SFNB resistance loci have been mapped to different chromosomes in every study thus far reported (2H in Ho et al., 1996; 7H in Williams et al., 1999; 4H in Friesen et al., 2006; and 5H in Manninen et al., 2006). It is possible that some of the known net blotch resistance QTL may correspond to DR genes and that molecular polymorphisms within these genes result in allelic diversity that may be related to the observed quantitative resistance levels. At present, none of the numerous QTL controlling resistance to both forms of net blotch have been described at the molecular level.
Utilizing a common barley genotype that contains R loci effective against Ptt and Ptm isolates, the method of SSH (Diatchenko et al., 1996) was used in the present study to isolate DR gene transcripts that are differentially expressed in the epidermis of barley–Ptt and barley–Ptm incompatible interactions. The aims were to (1) use quantitative real‐time reverse transcriptase (RT) PCR (Q‐PCR) to profile the expression of DR genes during the first 48 h after inoculation (hai) in both incompatible and compatible interactions, and (2) determine if the differentially expressed genes map to known net blotch R loci or QTL. The epidermis was specifically targeted to look for DR genes because it represents the first barrier encountered by the pathogen and is directly penetrated by it (Keon and Hargreaves, 1983). Previously, transcriptional changes involving DR genes have been shown to occur in the epidermis of barley leaves infected with other pathogens that have a direct mode of penetration, such as Blumeria graminis f. sp. hordei, the fungus responsible for powdery mildew (Zierold et al., 2005), and Rhynchosporium secalis, the scald‐causing fungus (Steiner‐Lange et al., 2003).
RESULTS
Differential screening and sequencing of SSH clones
Two cDNA libraries containing candidate DR genes that are differentially expressed in the barley–P. teres incompatible interaction were generated following SSH. The NFNB‐ and SFNB‐associated SSH libraries comprised 335 and 367 clones, respectively, with the average insert size being 222 bp. Macroarray analysis showed a low level of sensitivity resulting in the majority of arrayed clones, 242 NFNB (72%) and 302 SFNB (82%), showing weak or non‐existent hybridization signals when probed with unsubtracted tester and driver cDNAs (data not shown). The sequencing of 54 clones for which a hybridization signal was detected, including all those that showed differential signal intensities, revealed a high proportion of clones with homology to genes encoding either ribulose‐1,5‐bisphosphate carboxylase (RUBISCO), the photosystem II (PSII) protein D1 or a subtilisin‐chymotrypsin inhibitor 2 (CI2). These proteins are known to be abundant in nature and were not investigated further. The larger number of clones showing weak or no detectable hybridization signals were interpreted as being potentially of low abundance. The sequencing of these clones (241 NFNB and 199 SFNB) showed that 307 were representative of unique genes, 249 of which were represented by one copy in the library.
Functional annotation of SSH clones
The 307 unique expressed sequence tag (EST) sequences were used to annotate the function of their respective genes based on their alignment with known translated sequences using the BLASTx algorithm (Altschul et al., 1990) and the public nucleotide and amino acid sequence databases available at NCBI. According to putative function, each clone was distributed into one of ten functional categories (Fig. 1), including those related to secondary metabolism, cell maintenance and growth, stress and defence responses, gene expression, transport, signal transduction, protein degradation, and proteins of unknown function. From the 307 gene transcripts, 282 showed significant similarity to barley ESTs and therefore were assumed to be derived from the host and not the pathogens. The remaining 25 transcripts that did not show significant homology with barley ESTs were classified as ‘novel’ genes. They also did not share any similarities to sequences from 25 fungal genomes available from the Broad Institute, including that of Pyrenophora tritici repentis. The grouping of SSH clones into functional categories shows that a similar distribution pattern exists in both NFNB‐ and SFNB‐associated subtraction libraries (Fig. 1A,B).
Figure 1.
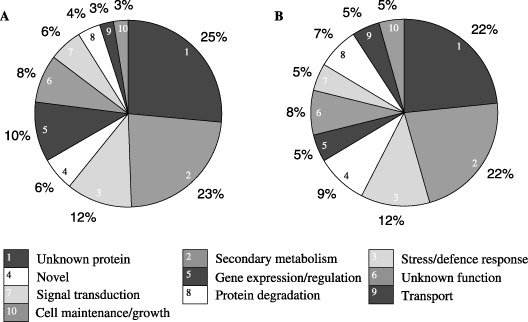
Distribution of SSH clones from the NFNB (A: 335 clones) and SFNB (B: 367 clones) subtraction libraries into functional groups based on their sequence alignments using BLASTx.
Expression profiling of SSH clones by Q‐PCR
One of the technical limitations of the present study was the difficulty associated with further analysing all of the clones identified by SSH. Therefore, a subset consisting of 45 candidate DR gene transcripts was selected for detailed expression profiling. Some genes were selected at random while others were chosen on the basis of their association with proteins putatively involved in general defence responses, signal transduction, carbohydrate metabolism and detoxification. Candidate DR gene expression profiles were monitored in both barley–Ptm and barley–Ptt incompatible and compatible interactions at six time points within 48 hai by Q‐PCR, using a 1.5‐fold cut‐off value to assign genes as being differentially expressed. The prefix HvPtr (for Hordeum vulgare P. teres resistance) was used to name the differentially expressed DR genes. The candidate genes were grouped into one of eight clusters depending on the kinetics of their expression in infected tissue relative to water‐inoculated (mock) controls (Fig. 2). The non‐replication of both Ptt and Ptm inoculation experiments necessitated a form of statistical analysis which treated these two inoculations as replicates. By including all six time points within a gene cluster in the same analysis, 12 degrees of freedom were generated within the residual variance estimate, which yielded secure t‐values in almost all cases. The statistical analysis of both incompatible and both compatible interactions within a cluster revealed that their respective expression profiles were very similar (broken lines, Fig. 2). The only point pairs that showed a relatively high level of disagreement were those of very low expression before 12 hai in gene cluster 6 (compatible and incompatible interactions), as well as at points 6 and 12 hai in gene clusters 3 and 5, respectively (compatible interaction only) (data not shown). Because of the overall high level of similarity, the means of each different interaction were used to generate consensus profiles (solid lines, Fig. 2). When individual expression profiles from each of the seven differential clusters were compared with those of gene cluster 8 (non‐differential), significant differences (P < 0.05) between either the incompatible or compatible interactions were identified at certain time points, which enabled these clusters (especially gene clusters 1–4 in which the fold change in expression was low) to be clearly distinguished from that of gene cluster 8.
Figure 2.
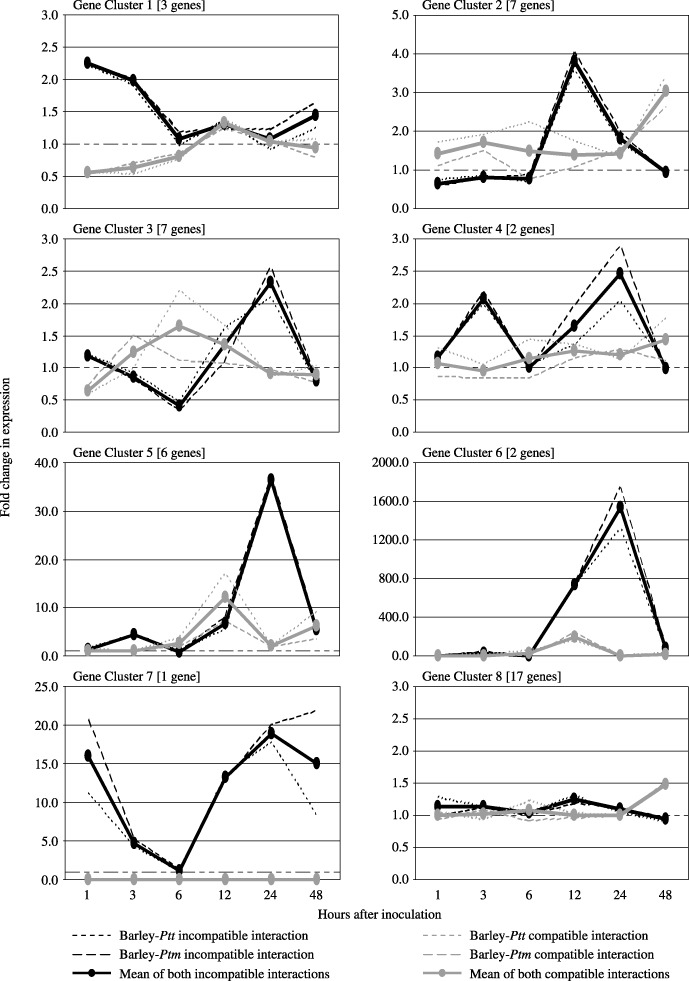
Grouping of 45 candidate DR genes into gene expression clusters based on their temporal expression profiles in the barley epidermis following infection with Ptm and Ptt. Broken lines represent mean expression profiles for genes in both barley–Ptm and barley–Ptt incompatible and compatible interactions. Solid lines represent consensus expression profiles generated from the means of both sets of incompatible and compatible interactions combined. The y‐axis indicates the fold change in expression for all genes in a given cluster relative to mock‐inoculated control plants.
The first cluster (cluster 1) contained three genes (HvPtr1 to HvPtr3) that were up‐regulated by a factor of 2 in the incompatible interaction very early after infection (1 and 3 hai). In the compatible interaction, the same genes were found to be down‐regulated by a factor of 2 at the corresponding time points. The combined expression profiles of seven genes (HvPtr4 to HvPtr10) made up cluster 2, which was characterized by a four‐fold induction in gene expression at 12 hai in the resistant response compared with both susceptible and control responses. A possible delayed induction of these genes was observed in the susceptible genotype at 48 hai. The expression profile of clones included in cluster 3 shows that this group of genes (HvPtr11 to HvPtr17) was induced later and stronger in the incompatible interaction. The genes appear to be initially down‐regulated from 1 to 6 hai, and then up‐regulated from 6 to 24 hai, where there is a 2.5‐fold increase in transcript levels relative to controls. In contrast, the compatible interaction shows an inverse mode of expression for this cluster. The mean expression profiles of two genes (HvPtr18 and HvPtr19) form cluster 4, which is highlighted by an early and late up‐regulation of these genes at 3 and 24 hai in the resistant genotype only. The same genes do not appear to be differentially expressed in the susceptible genotype. Clusters 5 and 6 have a similar expression profile with their representative genes (HvPtr20 to HvPtr27) being strongly up‐regulated at 24 hai in the incompatible interaction. The difference between the two clusters is in the level of up‐regulation observed at this time point, with cluster 5 genes being up‐regulated 40‐fold and cluster 6 genes 1500‐fold. The genes grouped into clusters 5 and 6 are also up‐regulated at 12 hai in both resistant and susceptible genotypes; however, in the resistant response the gene transcripts are further induced at 24 hai whereas in the susceptible response their expression returns to control levels. Cluster 7 was unique to one gene (HvPtr28), which appeared to be differentially expressed in the incompatible interaction only. The gene was up‐regulated 15‐fold in the resistant genotype within 1 hai before returning to control levels at 6 hai. It was then induced again and continued to be up‐regulated by approximately 15‐fold from 12 to 48 hai. Cluster 8 represented 17 genes that showed no differential expression and thus were considered as false positives. In total, 28 of 45 candidate DR genes were differentially expressed, indicating that a subtraction efficiency of 62% was achieved from the SSH. These 28 DR genes formed the group of genes to be analysed further by genetic mapping. Their putative functions based on homologies to genes encoding known proteins are summarized in Table 1. The 17 genes from cluster 8 that were not differentially expressed and their putative functions are listed in Supporting Information Table S1.
Table 1.
Summary of 28 DR gene clones differentially expressed in both barley–Ptt and barley–Ptm incompatible interactions.
| Clone | Size (bp) | GenBank accession no. | Protein similarity | Sequence origin | BLASTx | Gene cluster | Chromosomal position and marker type | |
|---|---|---|---|---|---|---|---|---|
| Accession no. of similar sequence | Similarity | |||||||
| Carbohydrate metabolism | ||||||||
| HvPtr6 | 203 | EY965255 | Sugar transporter | O. sativa | ABF94465 | 1e‐40 (73%, 115aa) | 2 | not mapped |
| HvPtr11 | 424 | EY965260 | Putative neutral/alkaline invertase | O. sativa | BAD33266 | 6e‐48 (94%, 97aa) | 3 | 6H, SSR |
| Detoxification | ||||||||
| HvPtr7 | 121 | EY965256 | Major facilitator superfamily protein | O. sativa | EAZ19564 | 8e‐08 (80%, 45aa) | 2 | 7H, RFLP |
| HvPtr8 | 393 | EY965257 | Putative sterol delta‐7 reductase | A. thaliana | BAD19845 | 8e‐60 (90%, 130aa) | 2 | 3H, CAPS |
| HvPtr12 | 290 | EY965261 | Mitochondrial aldehyde dehydrogenase | H. vulgare | BAB62757 | 4e‐10 (72%, 50aa) | 3 | 1H, RFLP |
| HvPtr15 | 249 | EY965264 | Aldehyde dehydrogenase | O. sativa | AAG43027 | 3e‐29 (95%, 82aa) | 3 | 5H, PCR |
| HvPtr17 | 278 | EY965266 | Putative cytochrome P450 | L. rigidum | AAK38091 | 8e‐45 (91%, 92aa) | 3 | 7H, PCR |
| HvPtr23 | 275 | EY965272 | MATE efflux protein family | O. sativa | BAC83974 | 6e‐07 (50%, 63aa) | 5 | not mapped |
| HvPtr27 | 176 | EY965276 | Putative flavin mono‐oxygenase | O. sativa | EAY93143 | 2e‐22 (82%, 58aa) | 6 | 7H, RFLP |
| Signal transduction | ||||||||
| HvPtr2 | 366 | EY965251 | Putative receptor‐like protein kinase | O. sativa | AAP68881 | 4e‐06 (69%, 42aa) | 1 | 5H, RFLP |
| HvPtr3 | 392 | EY965252 | 14‐3‐3‐like protein A | H. vulgare | P29305 | 2e‐52 (100%, 103aa) | 1 | 4H, CAPS |
| HvPtr5 | 452 | EY965254 | Putative receptor‐like protein kinase | O. sativa | CAH67715 | 1e‐41 (87%, 93aa) | 2 | 2H, RFLP |
| HvPtr9 | 319 | EY965258 | Putative B‐box‐type zinc finger protein | O. sativa | BAD46368 | 1e‐60 (77%, 148aa) | 2 | 5H, CAPS |
| HvPtr14 | 159 | EY965263 | Putative ser/thr protein kinase | O. sativa | BAC79157 | 4e‐17 (83%, 48aa) | 3 | 5H, CAPS |
| HvPtr18 | 156 | EY965267 | Leucine‐rich repeat protein family | O. sativa | AAV31268 | 4e‐36 (73%, 109aa) | 4 | 1H, CAPS |
| HvPtr19 | 152 | EY965268 | Casein kinase I‐like | O. sativa | BAB92346 | 2e‐20 (96%, 50aa) | 4 | 3H, SSR |
| Calcium signal perception | ||||||||
| HvPtr1 | 111 | EY965250 | Ser/thr protein kinase, NPH1‐1 | A. sativa | AAC05083 | 5e‐48 (89%, 104aa) | 1 | not mapped |
| HvPtr10 | 499 | EY965259 | Putative calcineurin B‐like protein | O. sativa | AAL31965 | 5e‐22 (90%, 53aa) | 2 | 5H, CAPS |
| HvPtr24 | 260 | EY965273 | Putative copine I | O. sativa | BAD35622 | 5e‐22 (93%, 49aa) | 5 | 7H, PCR |
| Stress or defence response | ||||||||
| HvPtr4 | 154 | EY965253 | Chitinase | O. sativa | BAA23809 | 4e‐64 (75%, 172aa) | 2 | 3H, RFLP |
| HvPtr25 | 106 | EY965274 | Putative proteinase inhibitor | T. aestivum | AAS49905 | 5e‐43 (100%, 90aa) | 5 | not mapped |
| HvPtr26 | 217 | EY965275 | Pathogenesis‐related protein 1 | H. vulgare | CAA79703 | 9e‐17 (100%, 39aa) | 6 | not mapped |
| Miscellaneous | ||||||||
| HvPtr13 | 237 | EY965262 | Alpha‐galactosidase | H. vulgare | CAA74160 | 1e‐36 (97%, 78aa) | 3 | not mapped |
| HvPtr16 | 166 | EY965265 | CBS domain containing protein | O. sativa | EAY93850 | 3e‐22 (90%, 55aa) | 3 | 2H, SSR |
| HvPtr20 | 176 | EY965269 | Putative threonine aldolase | O. sativa | EAY94851 | 1e‐19 (82%, 58aa) | 5 | 2H, CAPS |
| HvPtr21 | 333 | EY965270 | Glutamate dehydrogenase | O. sativa | BAE48298 | 5e‐28 (90%, 63aa) | 5 | 2H, RFLP |
| HvPtr22 | 180 | EY965271 | Putative ABA‐responsive protein | O. sativa | BAD25079 | 8e‐59 (76%, 139aa) | 5 | not mapped |
| HvPtr28 | 413 | EY965277 | Putative iron/ascorbate‐dependent oxidoreductase | O. sativa | EAZ36021 | 4e‐27 (59%, 99aa) | 7 | 6H, CAPS |
Note: protein similarities for clones in bold type were derived from the best barley EST match. aa, amino acids.
Mapping of DR genes and their association with known net blotch resistance loci
Of the 28 DR genes identified by expression profiling, 14 could be mapped by direct PCR or by converting them into cleaved amplified polymorphic sequence (CAPS) markers. Those not able to be mapped in this way, i.e. no simple sequence repeats (SSRs) or single nucleotide polymorphisms (SNPs) identified between mapping parents, were subsequently examined for their utility as restriction fragment length polymorphism (RFLP) probes. RFLPs were detected in at least one set of mapping parents for seven candidate genes. All of the DR gene probes used for RFLP analysis detected single loci with variable copy number (data not shown). In total, 21 of the 28 candidates were able to be mapped. Corresponding chromosomal locations for each clone are illustrated in Fig. 3 and marker types are summarized in Table 1.
Figure 3.
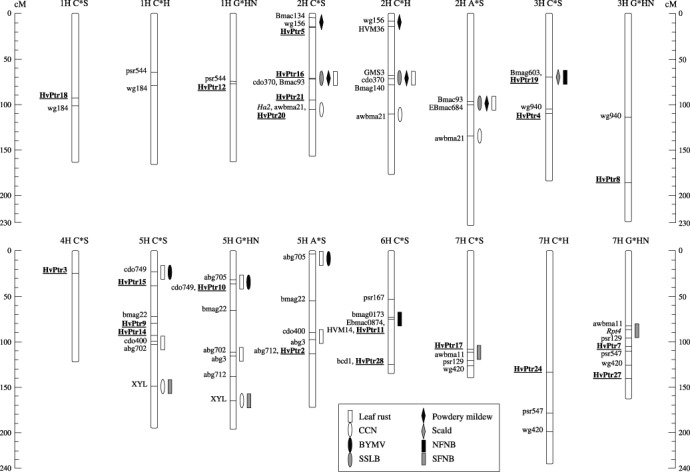
Chromosomal locations of 21 DR genes in relation to known R gene loci and QTL contributing to resistance against NFNB, SFNB and other barley diseases. The DR genes were mapped in either C*S, G*HN, C*H or A*S doubled haploid mapping populations (Willsmore et al., 2006) and are shown in bold and underlined. Reference markers for comparative analysis are also shown. Map positions of known R gene loci and QTL for disease resistance (bars) were inferred from published data.
Two HvPtr DR genes, HvPtr12 and HvPtr18, were mapped onto chromosome 1 in the G*HN and C*S populations, respectively. The resulting loci displayed comparable positions between maps as indicated by common markers linked via the C*H map. On chromosome 2H, four genes, HvPtr5, HvPtr16, HvPtr20 and HvPtr21, were mapped in the C*S population. HvPtr5 and HvPtr16, HvPtr16 and HvPtr21, and HvPtr21 and HvPtr20 are separated by distances of 53.7, 25.1 and 10.7 cM, respectively. Three genes, HvPtr4, HvPtr8 and HvPtr19, were mapped onto chromosome 3H in the G*HN and C*S populations. HvPtr19 and HvPtr4 are 38.3 cM apart, while the distance between HvPtr4 and HvPtr8 is probably even greater as shown by their positions in relation to the common marker WG940. Interestingly, HvPtr19, which encodes a putative casein kinase, appears to be located in the same region as the Pt. a gene, which confers resistance to NFNB (Graner et al., 1996). Only one DR gene, HvPtr3, was mapped onto chromosome 4H. The chromosome to which the highest number of HvPtr genes mapped was 5H. It comprised five genes, HvPtr2, HvPtr9, HvPtr10, HvPtr14 and HvPtr15. HvPtr9, HvPtr14 and HvPtr15 were mapped in the C*S population, whereas HvPtr2 and HvPtr10 were mapped in the A*S and G*HN populations, respectively. Due to their close proximity to common markers, HvPtr10 and HvPtr15 appear to have comparable map positions. Likewise, HvPtr9 and HvPtr14, separated by 14.4 cM, are also located close to one another. It seems that the corresponding sets of genes are not tightly linked as the distance between HvPtr9 and HvPtr15 on the C*S map is 41.2 cM. It is possible that HvPtr2 also shares a similar map position to HvPtr14. On chromosome 6H, two genes, HvPtr11 and HvPtr28, were mapped in the C*S population, along with SSR markers HVM14, EBmac0874 and Bmag0173, which in previous studies have been shown to be linked to QTL for NFNB resistance (Cakir et al., 2003; Friesen et al., 2006; Manninen et al., 2000, 2006). In the C*S population, HvPtr11, which encodes a putative invertase, mapped to the same position as HVM14 and Ebmac0874, with Bmag0173 situated 2.7 cM away. HvPtr28 mapped to a location 51.6 cM away from HvPtr11. Four genes, HvPtr7, HvPtr17, HvPtr24 and HvPtr27, were mapped onto chromosome 7H in the C*H, G*HN and C*S mapping populations. HvPtr7 and HvPtr17, which share homology with genes encoding a major facilitator superfamily (MFS) protein and a cytochrome P450 monooxygenase, respectively, appear to flank the Rpt4 gene, which confers resistance to SFNB (Williams et al., 1999). HvPtr7 is 18.6 cM away from Rpt4, whereas HvPtr17 is likely to be much closer as indicated by its close proximity to the marker AWBMA11, which is only 4.7 cM away from Rpt4 on the G*HN map. HvPtr24, which shares similarity to a copine‐encoding gene, may also be situated near Rpt4. In contrast, HvPtr27 does not map near this locus. It is located 53.1 cM away from Rpt4 and 34.5 cM away from HvPtr7.
Co‐localization of DR genes with loci conferring resistance to other barley diseases
In addition to the co‐localization of HvPtr genes with known net blotch resistance loci, some of them also mapped closely to genetic loci associated with resistance to a variety of other diseases affecting barley (Fig. 3). HvPtr5, which shares homology with a gene encoding a receptor‐like protein kinase, mapped to within a few centi‐Morgans of chromosome 2H markers linked to QTL for resistance to powdery mildew (HVM36: von Korff et al., 2005; Bmac134: Řepkováet al., 2006). HvPtr20, which shares sequence homology with a threonine aldolase‐encoding gene, appears to be closely linked to the cereal cyst nematode (CCN) resistance gene, Ha2 (Kretschmer et al., 1997). Furthermore, additional markers associated with QTL for resistance to septoria speckled leaf blotch (SSLB) (GMS3, Bmag140: Yun et al., 2005) as well as powdery mildew and leaf rust (Ebmac684, GMS3: von Korff et al., 2005) resistance are located on chromosome 2H near HvPtr16, whose gene transcript encodes a putative cystathionine‐β‐synthase (CBS) domain‐containing protein. On chromosome 3H, HvPtr19 is also linked closely to the Rh gene, which confers resistance to scald (Graner and Tekauz, 1996). The Pt. a and Rh genes were shown to be genetically linked in repulsion phase at less than 0.2 cM in the cross Igri*Franka (Graner et al., 1996). HvPtr10 and HvPtr15, which share homology with genes encoding a calcineurin b‐like (CBL) protein and aldehyde dehydrogenase, respectively, have comparable map positions on chromosome 5H with markers for the barley yellow mosaic virus (BYMV) R gene, ym3 (abg705: Saeki et al., 1999), and the leaf rust R gene, Rph2 (cdo749: Borovkova et al., 1997). HvPtr14 appeared to map near a marker linked closely to another gene conferring resistance to leaf rust, Rph9 (abg3: Borovkova et al., 1998).
DISCUSSION
The SSH method was used to identify genes that are differentially expressed in the incompatible interaction between barley and two P. teres isolates that induce NFNB or SFNB disease symptoms. The cloning of SSH transcripts yielded two EST libraries corresponding to inoculations of barley epidermis with either the Ptm or the Ptt isolate. It was anticipated that differentially expressed transcripts would be identified by looking at differences in the signal intensity of arrayed clones when probed with unsubtracted tester or driver cDNAs; however, limitations in sensitivity made this differential screening procedure inefficient. Grenier et al. (2002) also encountered a similar lack of sensitivity when using macroarrays to analyse the differential expression of SSH‐derived transcripts. Thus, although it was not possible to determine if all SSH clones were differentially expressed by macroarray analysis, the method was still useful in selecting clones for further analysis because abundant transcripts encoding RUBISCO, PSII protein D1 and CI2 could be discarded.
Although the SSH procedure enabled the isolation of 307 individual candidate DR gene transcripts, one technical limitation was that it was not possible to generate expression profiles for them all. From the 45 candidates selected for detailed expression profiling, 28 were found to be differentially expressed in both barley–Ptt and barley–Ptm incompatible interactions. Although this equates to a subtraction efficiency of 62%, the true figure is likely to be lower considering that results from the macroarray analysis, which revealed 28 and 18% of clones from the NFNB and SFNB libraries, respectively, to be non‐differential or of little importance, were not factored into the calculation. Due to the highly abundant nature of their corresponding proteins (e.g. RUBISCO), these clones are likely to have escaped subtraction. It would appear then that SSH was not entirely comprehensive in this study—a finding commonly encountered with this method (e.g. Birch et al., 1999; Grenier et al., 2002).
Expression profiles of barley defence responses to Ptm and Ptt overlap
It was notable that the transcript levels of the 28 differentially expressed genes analysed by Q‐PCR followed the same profiles over the 48‐h time‐course, irrespective of whether Ptt or Ptm was used for inoculation. In addition, it is evident that the entire repertoire of differentially expressed genes in the barley–P. teres incompatible interaction was not isolated from one subtraction alone as clones isolated from one of the net blotch incompatible interactions were also differentially expressed but not identified in the other. Although the expression data presented for both barley–Ptt and barley–Ptm interactions were based on one inoculation experiment, the fact that their individual expression profiles are so similar indicates that the observed expression patterns accurately reflect the way DR genes are differentially regulated following infection by either pathogen. Maximum induction of gene clusters ranged from approximately two‐ to 1532‐fold over the mock‐inoculated controls. Although a change of 1532‐fold may seem extreme, a similar high level of DR gene induction was recently reported (Adhikari et al., 2007).
The similarities that exist between the two sets of expression profiles imply that the barley–Ptt and barley–Ptm incompatible interaction involves coordinated expression of the same group of DR genes, even though the R genes thought to be responsible for specifically recognizing each pathogen are likely to be different. Resistance to NFNB and SFNB has been shown to be inherited independently (Ho et al., 1996) with R loci effective against both causal pathogens being different (Graner et al., 1996; Williams et al., 1999), even in the same genetic background (Manninen et al., 2006). The Ethiopian two‐rowed barley line CI 9819, for example, has been shown to carry at least two independent genes for net blotch resistance: Rpt5 effective against NFNB isolates, and Rpt6 effective against SFNB isolates, on chromosomes 6H and 5H, respectively (Manninen et al., 2006). Based on expression profile similarities of the DR genes investigated, we propose that although different R genes appear to be involved in Ptm and Ptt recognition, resistance to both pathogens is controlled by an overlapping or even identical defence response that is triggered downstream of the recognition event.
Unlike other studies in which expression profiles of pathogen‐induced genes during incompatible and compatible interactions have been shown to be qualitatively similar but quantitatively different (Tao et al., 2003; Zierold et al., 2005), this was not the case here. Although a quantitative difference was observed in all clusters, expression profiles between barley–P. teres incompatible and compatible interactions were not qualitatively similar. The incompatible interaction was generally characterized by genes that were up‐regulated while induction of the same genes was suppressed or they were down‐regulated in the compatible interaction. Also, the compatible interaction did not appear to be associated with a quantitative increase in DR gene induction at later time points as has been reported by other groups (Boyd et al., 1994; Tao et al., 2003). The observed differences could reflect variations that exist in the way defence responses are activated against pathogens that have necrotrophic versus biotrophic stages of infection. Indeed, quantitative but not qualitative differences in DR gene expression were also observed in wheat cultivars that were resistant and susceptible to septoria tritici blotch caused by another hemibiotrophic fungal pathogen, Mycosphaerella graminicola (Adhikari et al., 2007).
DR genes involved in carbohydrate metabolism
Two DR genes, HvPtr6 and HvPtr11, encode proteins putatively associated with carbohydrate metabolism. HvPtr6 encodes a sugar transporter, and several studies have shown that sugar transporter genes are induced in plants following pathogen attack (Williams et al., 2000; Zierold et al., 2005). Correlations have also been made between increased sugar levels and DR gene induction (Herbers et al., 2000). HvPtr11 encodes a putative invertase. Invertases catalyse the cleavage of sucrose to glucose and fructose, and invertase gene induction has previously been observed in plants challenged by fungal pathogens (Fotopoulos et al., 2003). The fact that photosynthesis and photosynthetic gene expression has been shown to be repressed in plants following pathogen attack (Berger et al., 2004; Herbers et al., 2000) suggests that plant cells around the site of infection may be reliant on alternative sources of carbohydrates to satisfy the increased metabolic demand on infected leaf tissue. Therefore, induction of these two genes could serve to replenish and maintain sufficient sugar levels in such tissue.
DR genes representing possible signal transduction components
Eight DR genes encode putative signal transduction components, including a 14‐3‐3 protein, several protein kinases, a leucine‐rich repeat (LRR) protein and a B‐box‐type zinc finger protein. Interestingly, among this group of DR genes are all three cluster 1 members, and their early induction in the barley–P. teres incompatible interaction suggests that they could be amongst the first group of genes that are involved in triggering the resistance‐associated defence response immediately downstream of pathogen recognition. 14‐3‐3 proteins have previously been shown to regulate the activities of a number of proteins potentially involved in disease resistance, including H+‐ATPases and several classes of protein kinases (Roberts, 2003), and the 14‐3‐3 protein‐encoding gene transcript isolated in this study was also induced in barley leaves inoculated with the pathogens responsible for powdery mildew (Brandt et al., 1992) and scald (K. Oldach, personal communication). Protein kinases are known to play an important role in activating plant defence responses following pathogen recognition (Romeis, 2001). Two kinase‐encoding clones share homology with receptor‐like kinases (RLKs) and several R genes have been shown to encode RLKs (Song et al., 1995; Sun et al., 2004). A casein kinase was also found to be up‐regulated during the rice–Magnaporthe grisea (Rao et al., 2002) and olive–Spilocaea oleagina (Benitez et al., 2005) interactions. LRR proteins function in a number of signal transduction pathways and play an important role in mediating protein–protein interactions (Kobe and Deisenhofer, 1994). The LRR domain is a structural feature of four of the eight major classes of plant R proteins (Chisholm et al., 2006), and genes encoding other proteins with LRR domains have also been found to be induced in plants following pathogen infection (Hipskind et al., 1996; Jung et al., 2004).
DR genes involved in calcium signal perception
Three DR genes, HvPtr1, HvPtr10 and HvPtr24, encode proteins putatively involved in Ca2+ signal perception. Ca2+signalling is known to initiate cellular responses to a diverse range of developmental cues and environmental challenges, and increases in cytosolic Ca2+levels have previously been reported in plants following pathogen attack (Olivain et al., 2003). HvPtr1 shares homology with a gene encoding a protein kinase, NPH1/PHOT1, that encodes one of the major photoreceptors of the signal transduction pathway for phototropism (Briggs and Christie, 2002). The finding that Arabidopsis PHOT1 is also involved in the downstream activation of Ca2+‐permeable channels (Baum et al., 1999) suggests that a similar protein in barley may be involved in regulating the flow of Ca2+in plant cells following pathogen attack. The fact that HvPtr1 was up‐regulated within 3 hai in the net blotch resistant genotype suggests that early recognition of specific Ca2+signatures may be necessary to establish an effective defence response against P. teres. The differential expression of HvPtr10 and HvPtr24, which encode proteins known to bind Ca2+, at later time points, supports the involvement of Ca2+in regulating the defence response. CBL proteins contain multiple Ca2+ binding domains and one CBL gene family member has been shown to play a crucial role in transducing and coordinating Ca2+‐mediated plant signalling and adaptation responses during cold, drought and salt stresses (Albrecht et al., 2003). Similarly, the copines are a group of Ca2+‐dependent, membrane‐binding proteins, with structural domains that suggest they may be involved in defining Ca2+signalling specificity and mediating protein–protein interactions (Creutz et al., 1998).
DR genes involved in detoxification mechanisms
Six DR genes identified in this study may be involved in regulating plant cell detoxification mechanisms. P. teres reportedly produces at least three phytotoxins that incite many of the symptoms associated with net blotch disease (Weiergang et al., 2002). In addition, accumulation of toxic reactive oxygen species has been reported in barley cultivars infected with Ptt (Able, 2003). Therefore, it is possible that successful activation of a plant detoxification system may play a major role in determining the outcome of the interaction between plant and fungus. Among this group of genes is HvPtr23, which encodes a putative multidrug and toxin efflux (MATE) protein. In addition, the putative major facilitator superfamily protein encoded by HvPtr7 is also a MATE family member. In plants, three MATE family members have previously been implicated in defence responses (Diener et al., 2001; Nawrath et al., 2002; Simmons et al., 2003), including EDS5, which is an important component of salicylic acid‐dependent R gene‐mediated signalling in Arabidopsis (Nawrath et al., 2002). The NorM gene from Vibrio parahaemolyticus is the only biochemically characterized MATE family member to date and is responsible for pumping antimicrobial agents out of bacterial cells in exchange for sodium (Morita et al., 2000). It is possible that HvPtr23 or HvPtr7 may function in similar ways by exporting P. teres toxins out of plant cells in exchange for essential nutrients. Two more DR genes potentially associated with detoxification mechanisms, HvPtr12 and HvPtr15, encode putative aldehyde dehydrogenases (ALDHs). These enzymes catalyse the oxidation of various toxic aldehydes to carboxylic acids (Perozich et al., 1999). Aldehydes accumulate as a result of lipid peroxidation caused by oxidative stress and increasing ALDH activity may represent one defence strategy that plants can use to prevent cell death caused by oxidative stress, thereby combating hemibiotrophic pathogens such as P. teres that rely on dead tissue in order to survive during the latter stages of their infection cycle. The potential involvement of plant ALDHs as components of defence responses to biotic stress is highlighted by studies which have shown that ALDH gene transcripts accumulate differentially in plants responding to various abiotic stress treatments (Kirch et al., 2001; Ozturk et al., 2002). In one report, over‐expression of an ALDH gene in Arabidopsis resulted in transgenic plants displaying improved tolerance to oxidative stress (Sunkar et al., 2003).
DR genes involved in general defence responses
Three DR genes encode putative defence components, of which two are PR proteins. HvPtr26 shares homology with a gene encoding a PR‐1 protein that was also expressed earlier and more strongly in powdery mildew resistant compared with susceptible barley lines infected with B. graminis (Peterhänsel et al., 1997; Schultheiss et al., 2003). Schultheiss et al. (2003) reported that transgenic barley lines over‐expressing PR‐1 limited penetration of B. graminis on the host, so it is possible that elevated levels of PR‐1, especially in the epidermal cell layer, may also play a role in arresting P. teres development. HvPtr4 is similar to a chitinase‐encoding gene. Chitinases belong to the PR‐3 family of PR proteins and chitinase protein activity and transcript levels have been shown to increase in a number of plant–pathogen interactions (Wang et al., 2005). Like PR‐1, transgenic plants producing elevated levels of chitinase have also displayed improved resistance to fungal pathogens (Melchers and Stuiver, 2000). The only gene with a unique expression profile, HvPtr28, encodes an iron/ascorbate‐dependent oxidoreductase. This putative redox enzyme may be involved in ethylene biosynthesis as its deduced amino acid sequence is also similar to that of an ethylene‐forming enzyme. The possible involvement of ethylene in conferring resistance to P. teres is interesting as this plant hormone has been widely implicated in the activation of plant defence responses (Wang et al., 2002). In addition, the nearest barley homologue to HvPtr28 was found to encode a putative redox enzyme, HCP1, that interacts with the Brome mosaic virus coat protein (Okinaka et al., 2003), which could suggest that a similar interaction may occur between the HvPtr28 gene product and P. teres‐derived elicitors to inhibit infection.
Mapping of DR genes in the barley genome
The observations made from the genetic mapping of HvPtr genes corroborate those of recent studies in which certain DR genes have been shown to co‐localize with QTL or R loci associated with resistance to a wide range of diseases or insect manifestations in pepper (Pflieger et al., 2001), potato (Trognitz et al., 2002), rice (Liu et al., 2004; Wang et al., 2001; Wisser et al., 2005), wheat (Faris et al., 1999) and barley (Marcel et al., 2007). The genetic mapping also showed that ten of the 21 mapped HvPtr genes mapped to within 15 cM of at least one other HvPtr gene, indicating that some DR genes associated with the barley–P. teres interaction may be closely linked. Comparable map positions for at least two different DR genes were observed on chromosomes 1H, 2H, 5H and 7H—with the 7H group of genes located in the region of the Rpt4 locus. Again, this observation is in accordance with those reported in the aforementioned studies. There was no correlation between individual genes grouped to a particular expression cluster and their map location in relation to other members of the same cluster. A number of the HvPtr genes also co‐localize with regions conferring resistance to a number of other barley diseases, including scald, CCN, powdery mildew, BYMV, leaf rust and SSLB. The possible co‐localization of HvPtr genes with genetic loci known to confer resistance to several barley diseases indicates that individual chromosomes may harbour defined genetic regions that confer quantitative or qualitative resistance to multiple pathogens. Recently, Wisser et al. (2005) reported that a number of chromosomal segments in rice appear to be associated with broad‐spectrum quantitative disease resistance.
The generation of the SSH libraries and the subsequent expression profiling and mapping of DR genes involved in both barley–Ptt and barley–Ptm incompatible interactions has laid the foundation to investigate the barley–net blotch pathosystem in more detail. The production of transgenic lines that over‐express/silence the identified DR genes, in particular, will facilitate experimentation to evaluate any link between their induction and map locations in relation to quantitative disease resistance against the barley net blotch and other fungal pathogens.
EXPERIMENTAL PROCEDURES
Plant material, fungal inoculation and sampling
Barley cultivars CI9214 and B87/14 were grown at 17 °C under fluorescent light in a controlled‐environment chamber. It has been reported that CI9214 carries the SFNB resistance gene Rpt4 (Williams et al., 1999) and is resistant to most Ptm and some Ptt isolates (Tekauz, 1990; Williams et al., 1999). Plants at the seedling stage were inoculated with a spore suspension of South Australian Ptm isolate 43/96 and Ptt isolate 19/98 (kindly provided by Hugh Wallwork, SARDI). CI9214 was resistant and B87/14 was susceptible to both isolates. Inoculum was prepared to a concentration of 1 × 10⁴ conidia/mL in 0.01% Tween‐20 and applied at a rate of approximately 0.8 mL per plant. Mock‐inoculated plants were treated using the same conditions, but with a water solution containing only 0.01% Tween‐20. After inoculation, all plants were kept at 19 °C in the dark for 24 h at 100% relative humidity and then under a 12‐h light regime with alternating temperatures of 24 and 19 °C in the light and dark, respectively. The abaxial side of the epidermis from infected and control leaves was peeled at 1, 3, 6, 12, 24, and 48 hai and immediately frozen in liquid nitrogen. To reduce the impact of biological variation, ten epidermal samples per time point were pooled. Some plants from each cultivar were kept in the controlled‐environment chamber for 14 days as controls to confirm the efficiency of the inoculation.
Suppression subtractive hybridization (SSH)
Total RNA was isolated from frozen epidermal tissue harvested at 24 hai using Tri Reagent (Molecular Research Centre, Cincinnati, OH) following the manufacturer's instructions. The Super SMART PCR cDNA synthesis kit (BD Biosciences Clontech, Palo Alto, CA) was then used to generate tester and driver double‐stranded cDNA from approximately 0.5 µg total epidermal RNA according to the manufacturer's protocol. Two populations of tester and driver cDNA were generated—one each for the NFNB‐ and SFNB‐associated SSH. In both subtractions, cDNA derived from infected CI9214 (resistant) and B87/14 (susceptible) epidermis at 24 hai was the source of tester and driver cDNA, respectively. Following cDNA synthesis, SSH was performed using the Clontech PCR‐select cDNA subtraction kit (BD) as per the manufacturer's instructions.
Cloning and differential screening using macroarrays
Products of the second PCR from both NFNB‐ and SFNB‐associated subtractions were directly inserted into the pCR®2.1‐TOPO® plasmid vector (Invitrogen, Carlsbad, CA) and transformed into chemically competent Escherichia coli strain DH5α cells. Positive colonies were picked and grown in 96‐well microtitre plates in 200 µL Luria‐Bertani (LB) medium containing ampicillin (100 mg/L). The cDNA inserts were then amplified by colony PCR using a PTC‐100 thermocycler (MJ Research, Waltham, MA) and M13 forward and reverse primers to check for the presence and size of individual inserts. The final reaction volume of 25 µL comprised a mixture containing 1× reaction buffer, 1.5 mm MgCl2, 0.2 mm dNTPs, 0.15 µm of each primer, 0.5 U of Taq DNA polymerase, and 1 µL of bacterial culture. The PCR was effected using the following cycling conditions: 1 min at 95 °C, 40 s at 94 °C, 35 s at 57 °C, 1 min at 72 °C, then 35 cycles of 40 s at 94 °C, 35 s at 52 °C and 1 min at 72 °C, and a final extension step of 10 min at 72 °C. All PCR products were electrophoresed on a 1.2% agarose gel, stained with ethidium bromide, then visualized under UV light.
For differential screening, SSH clones were arrayed in duplicate onto Hybond‐N+nylon membranes (Amersham Biosciences, Little Chalfont, UK) as described in Clontech's PCR‐select differential screening kit protocol. Two identical membranes were prepared for each SSH library. They were hybridized with [α‐32P] dCTP‐labelled probes generated from unsubtracted and subtracted cDNAs, then washed as described also in the aforementioned protocol. Washed membranes were placed in cassettes containing phosphor imaging plates (BAS‐MP 2040S; Fujifilm, Minato, Tokyo, Japan) at room temperature for 24 h. The imaging plates were scanned using a STORM 860 phosphorimager (GE Healthcare) and the resulting hybridization signals were inspected visually.
DNA sequencing and sequence analysis
Cycle sequencing reactions were prepared using the Big Dye Terminator Version 3.1 labelling kit (PE Applied Biosystems, Foster City, CA) according to the manufacturer's protocol but using one‐eighth of the recommended reaction mix. DNA sequencing was performed on an ABI 3700 DNA Sequencer (PE Applied Biosystems) and DNA sequences were edited using Vector NTI software (Invitrogen) to remove sequencing ambiguities and vector sequences. The edited sequences were used to query the public nucleotide and amino acid sequence databases at the National Centre for Biotechnology Information (NCBI; http://www.ncbi.nlm.nih.gov). Sequence comparisons were carried out using the basic local alignment search tool (BLAST) algorithms, BLASTn and BLASTx (Altschul et al., 1990). Similarity to a known sequence was considered as significant if the obtained BLAST score had an E‐value of less than 1 × 10⁻⁵. For clones that had insufficient coding information from the insert sequence alone to predict functions using BLASTx, the amino acid sequence encoded by the best barley EST match was queried against the non‐redundant GenBank protein database to determine putative function. Clones that did not show significant similarities to barley ESTs were queried against a database of genomic sequences from 25 fungi available from the Broad Institute (http://www.broad.mit.edu).
Q‐PCR and data analysis
To prepare cDNA template for Q‐PCR, RNA preparations from epidermal peels harvested 1, 3, 6, 12, 24 and 48 hai were treated with RNase‐free DNase I (Ambion, Austin, TX) to remove residual DNA before first‐strand synthesis. cDNA was synthesised from 0.5 µg of total epidermal RNA using SuperScript III reverse transcriptase (Invitrogen) according to the manufacturer's instructions. PCR primers were designed specifically to the nucleic acid sequence of each respective SSH clone using the Primer 3 program (http://frodo.wi.mit.edu/cgi‐bin/primer3/primer3_www.cgi). Q‐PCR was performed in an RG 3000 Rotor‐Gene Real Time Thermal Cycler (Corbett Research, Sydney, Australia). The final reaction volume of 12 µL comprised a mixture containing 1× QuantiTect SYBR Green PCR reagent (Qiagen, Valencia, CA), 0.4 µm of each forward and reverse gene‐specific primer, and 1 µL of a 1:10 dilution of transcribed single‐stranded cDNA. The PCR was effected using the following cycling conditions: 15 min at 95 °C, followed by 35 cycles of 20 s at 95 °C, 30 s at 55 °C and 30 s at 72 °C, and 15 s at the optimal data acquisition temperature for each gene‐specific product (approximately 2 °C below the T m of the specific PCR product), which was initially determined by heating the reaction products from 70 to 99 °C and analysing the resulting melt curve. All Q‐PCR reactions were carried out in duplicate and melt curve analysis was performed at the end of each run to confirm that there was no signal from non‐specific binding products. No template controls were included in each run to test for possible contamination of assay reagents. All gene‐specific primers used for Q‐PCR are listed in Supporting Information Table S2.
The Rotor‐Gene 6 software (Corbett Research) was used to establish a standard curve that was generated from the PCR of serial ten‐fold dilutions (107–102 copies/µL) of a purified 122‐bp amplicon derived from the cDNA of a barley cyclophilin gene (Burton et al., 2004). The standard curve was formed by plotting copy number (expressed in logarithmic form) versus values of threshold cycle (C T) and gene‐specific transcript quantities were automatically calculated by the supporting software by factoring in the C T value for each target transcript into the equation of the line of best fit. A fixed fluorescence threshold of 0.1 was used to determine all C T values. The standard curve derived from the cyclophilin gene transcript was imported into subsequent Q‐PCR runs to determine quantities of target gene transcripts. In addition, one cDNA template was used across all Q‐PCR experiments to account for differences in PCR efficiency between runs. To normalize for differences in the amount of RNA present in each sample prior to cDNA synthesis, the geometric averaging of eight internal reference gene transcripts (Supporting Information Table S2) by the geNorm program (Vandesompele et al., 2002) was used to generate normalization factors. These were derived from the average expression stability of the three most stably expressed transcripts as determined by geNorm (Supporting Information Fig. S1). The fold changes of differentially expressed genes were calculated by dividing the normalized expression data of the inoculated samples by the data of the corresponding time points obtained for the mock inoculations. Differentially expressed genes were grouped into clusters based on similar expression profiles by visual inspection.
Mapping of candidate DR genes by direct PCR, CAPS and RFLP
Four previously described doubled‐haploid (DH) mapping populations with existing genetic maps were used in this study: Clipper × Sahara (C*S), Galleon × Haruna nijo (G*HN), Chebec × Harrington (C*H) and Alexis × Sloop (A*S) (Willsmore et al., 2006). To verify the suitability of using these populations for mapping, screens were initially performed to identify polymorphisms between the parents. For SSR and CAPS marker development, ESTs corresponding to candidate DR genes were queried against the nucleotide database of the barley gene index available from The Institute for Genomic Research (TIGR) website (http://compbio.dfci.harvard.edu/tgi/cgi‐bin/tgi/gimain.pl?gudb=barley). Unique barley gene indices were then queried against the rice genome database from the NCBI website to identify exon/intron boundaries for genes of interest. Genomic regions spanning introns were amplified by PCR in 25‐µL reactions as described for the colony PCR but with the following cycling conditions: 90 s at 95 °C, then 35 cycles of 30 s at 94 °C, 30 s at 62 °C and 60–150 s at 72 °C depending on the expected size of the amplicon, followed by a final extension step of 10 min at 72 °C. Products were sequenced and SNPs/SSRs were identified by visual inspection of the aligned parental sequences. To amplify the detected SSRs, primers flanking the repetitive motif were designed and used in PCR. PCR products were resolved by polyacrylamide gel electrophoresis and visualized by staining with ethidium bromide. The SNP2CAPS program (Thiel et al., 2004) was used to develop CAPS markers from the sequence alignments. For RFLP mapping, Southern hybridization of parental DNA was carried out according to standard protocols (Sambrook et al., 1989) using 10 µg of digested DNA per lane and the restriction enzymes BamHI, DraI, EcoRI, EcoRV, HindIII and XbaI (5 U/µg). Southern filters for the mapping populations were kindly provided by Margaret Pallotta (Australian Centre for Plant Functional Genomics). For two gene markers, polymorphisms were detected after the initial PCR in the form of indels. The Map Manager QTX (version QTXb20; Manly et al., 2001) program was used to map DR gene markers onto the maps.
Supporting information
Fig. S1 Chart indicating the average expression stability (M) value of reference genes at each step during stepwise exclusion of the least stable reference gene, according to geNorm analysis (Vandesompele et al., 2002). Starting from the least stable gene at the left, the genes are ranked according to increasing expression stability, ending with the two most stable genes at the right.
Table S1 Summary of 17 candidate DR gene clones showing no differential expression in barley–Ptt and barley–Ptm incompatible compared with compatible interactions
Table S2 Gene‐specific primers, expected PCR product sizes and optimal acquisition temperatures for expression profiling of DR genes by Q‐PCR
Please note: Blackwell Publishing are not responsible for the content or functionality of any supporting materials supplied by the authors. Any queries (other than missing material) should be directed to the corresponding author for the article.
Supporting info item
Supporting info item
Supporting info item
ACKNOWLEDGEMENTS
We would like to thank the Grains Research and Development Council (GRDC), the South Australian Grains Industry Trust (SAGIT) and the Molecular Plant Breeding Cooperative Research Centre (MPBCRC) for funding this work. We would also like to thank Margaret Pallotta from the Australian Centre for Plant Functional Genomics (ACPFG) for provision of Southern filters and helpful suggestions with the genetic mapping, Chris Dyson from SARDI for statistical analysis of the expression data, and Kerrie Olson from SARDI for evaluating the mapping data.
REFERENCES
- Able, A.J. (2003) Role of reactive oxygen species in the response of barley to necrotrophic pathogens. Protoplasma, 221, 137–143. [DOI] [PubMed] [Google Scholar]
- Adhikari, T.B. , Balaji, B. , Breeden, J. and Goodwin, S.B. (2007) Resistance of wheat to Mycosphaerella graminicola involves early and late peaks of gene expression. Physiol. Mol. Plant Pathol. doi: 10.1016/j.pmpp.2007.10.004. [DOI] [Google Scholar]
- Albrecht, V. , Weinl, S. , Blazevic, D. , D’Angelo, C. , Batistic, O. , Kolukisaoglu, Ü. , Bock, R. , Schulz, B. , Harter, K. and Kudla, J. (2003) The calcium sensor CBL1 integrates plant responses to abiotic stresses. Plant J. 36, 457–470. [DOI] [PubMed] [Google Scholar]
- Altschul, S.F. , Gish, W. , Miller, W. , Myers, E.W. and Lipman, D.J. (1990) Basic local alignment search tool. J. Mol. Biol. 215, 403–410. [DOI] [PubMed] [Google Scholar]
- Baum, G. , Long, J.C. , Jenkins, G.I. and Trewavas, A.J. (1999) Stimulation of the blue light phototropic receptor NPH1 causes a transient increase in cytosolic Ca2+ . Proc. Natl Acad. Sci. USA, 96, 13554–13559. [DOI] [PMC free article] [PubMed] [Google Scholar]
- Benitez, Y. , Botella, M.A. , Trapero, A. , Alsalimiya, M. , Caballero, J.L. , Dorado, G. and Munoz‐Blanco, J. (2005) Molecular analysis of the interaction between Olea europaea and the biotrophic fungus Spilocaea oleagina . Mol. Plant Pathol. 6, 425–438. [DOI] [PubMed] [Google Scholar]
- Berger, S. , Papadopoulos, M. , Schreiber, U. , Kaiser, W. and Roitsch, T. (2004) Complex regulation of gene expression, photosynthesis and sugar levels by pathogen infection in tomato. Physiol. Plant. 122, 419–428. [Google Scholar]
- Birch, P.R.J. , Avrova, A.O. , Duncan, J.M. , Lyon, G.D. and Toth, R.L. (1999) Isolation of potato genes that are induced during an early stage of the hypersensitive response to Phytophthora infestans . Mol. Plant–Microbe Interact. 12, 356–361. [Google Scholar]
- Bittner‐Eddy, P.D. , Allen, R.L. , Rehmany, A.P. , Birch, P. and Beynon, J.L. (2003) Use of suppression subtractive hybridization to identify downy mildew genes expressed during infection of Arabidopsis thaliana . Mol. Plant Pathol. 4, 501–507. [DOI] [PubMed] [Google Scholar]
- Borovkova, I.G. , Jin, Y. , Steffenson, B.J. , Kilian, A. , Blake, T.K. and Kleinhofs, A. (1997) Identification and mapping of a leaf rust resistance gene in barley line Q21861. Genome, 40, 236–241. [DOI] [PubMed] [Google Scholar]
- Borovkova, I.G. , Jin, Y. and Steffenson, B.J. (1998) Chromosomal location and genetic relationship of leaf rust resistance genes rph9 and rph12 in barley. Phytopathology, 88, 76–80. [DOI] [PubMed] [Google Scholar]
- Boyd, L.A. , Smith, P.H. , Green, R.M. and Brown, J.K.M. (1994) The relationship between the expression of defense‐related genes and mildew development in barley. Mol. Plant–Microbe Interact. 7, 401–410. [Google Scholar]
- Brandt, J. , Thordal‐Christensen, H. , Vad, K. , Gregersen, P.L. and Collinge, D.B. (1992) A pathogen‐induced gene of barley encodes a protein showing high similarity to a protein kinase regulator. Plant J. 2, 815–820. [PubMed] [Google Scholar]
- Briggs, W.R. and Christie, J.M. (2002) Phototropin 1 and phototropin 2: two versatile plant blue‐light receptors. Trends Plant Sci. 7, 204–210. [DOI] [PubMed] [Google Scholar]
- Burton, R.A. , Shirley, N.J. , King, B.J. , Harvey, A.J. and Fincher, G.B. (2004) The CesA gene family of barley. Quantitative analysis of transcripts reveals two groups of co‐expressed genes. Plant Physiol. 134, 224–236. [DOI] [PMC free article] [PubMed] [Google Scholar]
- Cakir, M. , Gupta, S. , Platz, G.J. , Ablett, G.A. , Loughman, R. , Emebiri, L.C. , Poulsen, D. , Li, C.D. , Lance, R.C.M. , Galwey, N.W. , Jones, M.G.K. and Appels, R. (2003) Mapping and validation of the genes for resistance to Pyrenophora teres f. teres in barley (Hordeum vulgare L.). Aust. J. Agr. Res. 54, 1369–1377. [Google Scholar]
- Chisholm, S.T. , Coaker, G. , Day, B. and Staskawicz, B.J. (2006) Host–microbe interactions: shaping the evolution of the plant immune response. Cell, 124, 803–814. [DOI] [PubMed] [Google Scholar]
- Christensen, A.B. , Thordal‐Christensen, H. , Zimmermann, G. , Gjetting, T. , Lyngkjaer, M.F. , Dudler, R. and Schweizer, P. (2004) The germinlike protein GLP4 exhibits superoxide dismutase activity and is an important component of quantitative resistance in wheat and barley. Mol. Plant–Microbe Interact. 17, 109–117. [DOI] [PubMed] [Google Scholar]
- Creutz, C.E. , Tomsig, J.L. , Snyder, S.L. , Gautier, M.‐C. , Skouri, F. , Beisson, J. and Cohen, J. (1998) The copines, a novel class of C2 domain‐containing, calcium‐dependent, phospholipid‐binding proteins conserved from Paramecium to humans. J. Biol. Chem. 273, 1393–1402. [DOI] [PubMed] [Google Scholar]
- Dangl, J.L. and Jones, J.D.G. (2001) Plant pathogens and integrated defence responses to infection. Nature, 411, 826–833. [DOI] [PubMed] [Google Scholar]
- Diatchenko, L. , Lau, Y‐F.C. , Campbell, A.P. , Chenchik, A. , Moqadam, F. , Huang, B. , Lukyanov, S. , Lukyanov, K. , Gurskaya, N. , Sverdlov, E.D. and Siebert, P.D. (1996) Suppression subtractive hybridization: a method for generating differentially regulated or tissue‐specific cDNA probes and libraries. Proc. Natl Acad. Sci. USA, 93, 6025–6030. [DOI] [PMC free article] [PubMed] [Google Scholar]
- Diener, A.C. , Gaxiola, R.A. and Fink, G.R. (2001) Arabidopsis ALF5, a multidrug efflux transporter gene family member, confers resistance to toxins. Plant Cell, 13, 1625–1637. [DOI] [PMC free article] [PubMed] [Google Scholar]
- Dixon, R.A. and Harrison, M.J. (1990) Activation, structure and organization of genes involved in microbial defense in plants. Adv. Genet. 28, 165–234. [DOI] [PubMed] [Google Scholar]
- Faris, J.D. , Li, W.L. , Liu, D.J. , Chen, P.D. and Gill, B.S. (1999) Candidate gene analysis of quantitative disease resistance in wheat. Theor. Appl. Genet. 98, 219–225. [Google Scholar]
- Fotopoulos, V. , Gilbert, M.J. , Pittman, J.K. , Marvier, A.C. , Buchanan, A.J. , Sauer, N. , Hall, J.L. and Williams, L.E. (2003) The monosaccharide transporter gene, AtSTP4, and the cell‐wall invertase, Atβfruct1, are induced in arabidopsis during infection with the fungal biotroph Erysiphe cichoracearum . Plant Physiol. 132, 821–829. [DOI] [PMC free article] [PubMed] [Google Scholar]
- Friesen, T.L. , Faris, J.D. , Lai, Z. and Steffenson, B.J. (2006) Identification and chromosomal location of major genes for resistance to Pyrenophora teres in a doubled‐haploid barley population. Genome, 49, 855–859. [DOI] [PubMed] [Google Scholar]
- Graner, A. and Tekauz, A. (1996) RFLP mapping in barley of a dominant gene conferring resistance to scald (Rhynchosporium secalis ). Theor. Appl. Genet. 93, 421–425. [DOI] [PubMed] [Google Scholar]
- Graner, A. , Foroughi‐Wehr, B. and Tekauz, A. (1996) RFLP mapping of a gene in barley conferring resistance to net blotch (Pyrenophora teres ). Euphytica, 91, 229–234. [Google Scholar]
- Grenier, E. , Blok, V.C. , Jones, J.T. , Fouville, D. and Mugniéry, D. (2002) Identification of gene expression differences between Globodera pallida and G. ‘mexicana’by suppression subtractive hybridization. Mol. Plant Pathol. 3, 217–226. [DOI] [PubMed] [Google Scholar]
- Herbers, K. , Takahata, Y. , Melzer, M. , Mock, H‐P. , Hajirezaei, M. and Sonnewald, U. (2000) Regulation of carbohydrate partitioning during the interaction of potato virus Y with tobacco. Mol. Plant Pathol. 1, 51–59. [DOI] [PubMed] [Google Scholar]
- Hipskind, J.D. , Nicholson, R.L. and Goldsbrough, P.B. (1996) Isolation of a cDNA encoding a novel leucine‐rich repeat motif from Sorghum bicolor inoculated with fungi. Mol. Plant–Microbe Interact. 9, 819–825. [DOI] [PubMed] [Google Scholar]
- Ho, K.M. , Tekauz, A. , Choo, T.M. and Martin, R.A. (1996) Genetic studies on net blotch resistance in a barley cross. Can. J. Plant Sci. 76, 715–719. [Google Scholar]
- Jung, E.H. , Jung, H.W. , Lee, S.C. , Han, S.W. , Heu, S. and Hwang, B.K. (2004) Identification of a novel pathogen‐induced gene encoding a leucine‐rich repeat protein expressed in phloem cells of Capsicum annuum . Biochim. Biophys. Acta, 1676, 211–222. [DOI] [PubMed] [Google Scholar]
- Keon, J.P.R. and Hargreaves, J.A. (1983) A cytological study of the net blotch disease caused by Pyrenophora teres. Physiol . Plant Pathol. 22, 321–329. [Google Scholar]
- Khan, T.N. (1987) Relationship between net blotch (Drechslera teres) and losses in grain yield of barley in Western Australia. Aust. J. Agr. Res. 38, 671–679. [Google Scholar]
- Kirch, H.‐H. , Nair, A. and Bartels, D. (2001) Novel ABA‐ and dehydration‐inducible aldehyde dehydrogenase genes isolated from the resurrection plant Craterostigma plantagineum and Arabidopsis thaliana . Plant J. 28, 555–567. [DOI] [PubMed] [Google Scholar]
- Kobe, B. and Deisenhofer, J. (1994) The leucine‐rich repeat: a versatile binding motif. Trends Biochem. Sci. 19, 415–421. [DOI] [PubMed] [Google Scholar]
- Von Korff, M. , Wang, H. , Léon, J. and Pillen, K. (2005) AB‐QTL analysis in spring barley. I. Detection of resistance genes against powdery mildew, leaf rust and scald introgressed from wild barley. Theor. Appl. Genet. 111, 583–590. [DOI] [PubMed] [Google Scholar]
- Kretschmer, J.M. , Chalmers, K.J. , Manning, S. , Karakousis, A. , Barr, A.R. , Islam, A.K.M.R. , Logue, S.J. , Choe, Y.W. , Barker, S.J. , Lance, R.C.M. and Langridge, P. (1997) RFLP mapping of the Ha2 cereal cyst nematode resistance gene in barley. Theor. Appl. Genet. 94, 1060–1064. [Google Scholar]
- Leckband, G. and Lörz, H. (1998) Transformation and expression of a stilbene synthase gene of Vitis vinifera L. in barley and wheat for increased fungal resistance. Theor. Appl. Genet. 96, 1004–1012. [Google Scholar]
- Liu, B. , Zhang, S. , Zhu, X. , Yang, Q. , Wu, S. , Mei, M. , Mauleon, R. , Leach, J. , Mew, T. and Leung, H. (2004) Candidate defense genes as predictors of quantitative blast resistance in rice. Mol. Plant–Microbe Interact. 17, 1146–1152. [DOI] [PubMed] [Google Scholar]
- Manly, K.F. , Cudmore, R.H. Jr. and Meer, J.M. (2001) Map manager QTX, cross‐platform software for genetic mapping. Mamm. Genome, 12, 930–932. [DOI] [PubMed] [Google Scholar]
- Manninen, O. , Kalendar, R. , Robinson, J. and Schulman, A.H. (2000) Application of BARE‐1 retrotransposon markers to the mapping of a major resistance gene for net blotch in barley. Mol. Gen. Genet. 264, 325–334. [DOI] [PubMed] [Google Scholar]
- Manninen, O.M. , Jalli, M. , Kalendar, R. , Schulman, A. , Afanasenko, O. and Robinson, J. (2006) Mapping of major spot‐type and net‐type net‐blotch resistance genes in the Ethiopian barley line CI 9819. Genome, 49, 1564–1571. [DOI] [PubMed] [Google Scholar]
- Marcel, T.C. , Varshney, R.K. , Barbieri, M. , Jafary, H. , De Kock, M.J.D. , Graner, A. and Niks, R.E. (2007) A high‐density consensus map of barley to compare the distribution of QTLs for partial resistance to Puccinia hordei and of defence gene homologues. Theor. Appl. Genet. 114, 487–500. [DOI] [PubMed] [Google Scholar]
- Mathre, D.E. (1997) Compendium of Barley Diseases, 2nd edn. St. Paul, MN: American Phytopathological Society Publishing. [Google Scholar]
- McDonald, B.A. and Linde, C. (2002) Pathogen population genetics, evolutionary potential, and durable resistance. Annu. Rev. Phytopathol. 40, 349–379. [DOI] [PubMed] [Google Scholar]
- Melchers, L.S. and Stuiver, M.H. (2000) Novel genes for disease‐resistance breeding. Curr. Opin. Plant Biol. 3, 147–152. [DOI] [PubMed] [Google Scholar]
- Morita, Y. , Kataoka, A. , Shiota, S. , Mizushima, T. and Tsuchiya, T. (2000) NorM of Vibrio parahaemolyticus is an Na+‐driven multidrug efflux pump. J. Bacteriol. 182, 6694–6697. [DOI] [PMC free article] [PubMed] [Google Scholar]
- Nawrath, C. , Heck, S. , Parinthawong, N. and Métraux, J.‐P. (2002) EDS5, an essential component of salicylic acid‐dependent signaling for disease resistance in Arabidopsis, is a member of the MATE transporter family. Plant Cell, 14, 275–286. [DOI] [PMC free article] [PubMed] [Google Scholar]
- Okinaka, Y. , Mise, K. , Okuno, T. and Furusawa, I. (2003) Characterization of a novel barley protein, HCP1, that interacts with the Brome mosaic virus coat protein. Mol. Plant–Microbe Interact. 16, 352–359. [DOI] [PubMed] [Google Scholar]
- Oldach, K.H. , Becker, D. and Lörz, H. (2001) Heterologous expression of genes mediating enhanced fungal resistance in transgenic wheat. Mol. Plant–Microbe Interact. 14, 832–838. [DOI] [PubMed] [Google Scholar]
- Olivain, C. , Trouvelot, S. , Binet, M‐N. , Cordier, C. , Pugin, A. and Alabouvette, C. (2003) Colonization of flax roots and early physiological responses of flax cells inoculated with pathogenic and nonpathogenic strains of Fusarium oxysporum . Appl. Environ. Microbiol. 69, 5453–5462. [DOI] [PMC free article] [PubMed] [Google Scholar]
- Ozturk, Z.N. , Talame, V. , Deyholos, M. , Michalowski, C.B. , Galbraith, D.W. , Gozukirmizi, N. , Tuberosa, R. and Bohnert, H.J. (2002) Monitoring large‐scale changes in transcript abundance in drought‐ and salt‐stressed barley. Plant Mol. Biol. 48, 551–573. [DOI] [PubMed] [Google Scholar]
- Perozich, J. , Nicholas, H. , Wang, B.‐C. , Lindahl, R. and Hempel, J. (1999) Relationships within the aldehyde dehydrogenase extended family. Prot. Sci. 8, 137–146. [DOI] [PMC free article] [PubMed] [Google Scholar]
- Peterhänsel, C. , Freialdenhoven, A. , Kurth, J. , Kolsch, R. and Schulze‐Lefert, P. (1997) Interaction analyses of genes required for resistance responses to powdery mildew in barley reveal distinct pathways leading to leaf cell death. Plant Cell, 9, 1397–1409. [DOI] [PMC free article] [PubMed] [Google Scholar]
- Pflieger, S. , Palloix, A. , Caranta, C. , Blattes, A. and Lefebvre, V. (2001) Defense response genes co‐localize with quantitative disease resistance loci in pepper. Theor. Appl. Genet. 103, 920–929. [Google Scholar]
- Platz, G. , Bell, K.L. , Rees, R.G. and Galea, V.J. (2000) Pathotype variation of the Australian net blotch populations. In: Proceedings of the 8th International Barley Genetics Symposium (Logue Susan, ed.), Vol. 2, 182–183. Glen Osmond, South Australia: Department of Plant Science, Waite Campus, Adelaide University. [Google Scholar]
- Rao, Z.M. , Dong, H.T. , Zhuang, J.Y. , Chai, R.Y. , Fan, Y.Y. , Li, D.B. and Zheng, K.L. (2002) Analyses of gene expression profiles during host‐Magnaporthe grisea interactions in a pair of near isogenic lines of rice. Yi Chuan Xue Bao, 29, 887–893. [PubMed] [Google Scholar]
- Řepková, J. , Dreiseitl, A. , Lízal, P. , Kyjovská, Z. , Teturová, K. , Psotková, R. and Jahoor, A. (2006) Identification of resistance genes against powdery mildew in four accessions of Hordeum vulgare ssp. spontaneum . Euphytica, 151, 23–30. [Google Scholar]
- Roberts, M.R. (2003) 14‐3‐3 proteins find new partners in plant cell signalling. Trends Plant Sci. 8, 218–223. [DOI] [PubMed] [Google Scholar]
- Romeis, T. (2001) Protein kinases in the plant defence response. Curr. Opin. Plant Biol. 4, 407–414. [DOI] [PubMed] [Google Scholar]
- Saeki, K. , Miyazaki, C. , Hirota, N. , Saito, A. and Ito, K. (1999) RFLP mapping of BaYMV resistance gene rym3 in barley (Hordeum vulgare ). Theor. Appl. Genet. 99, 727–732. [DOI] [PubMed] [Google Scholar]
- Sambrook, J. , Fritsch, E.F. and Maniatis, T. (1989) Molecular Cloning: a Laboratory Manual, 2nd edn. Cold Spring Harbor, NY: Cold Spring Harbor Laboratory Press. [Google Scholar]
- Sánchez‐Torres, P. and González‐Candelas, L. (2003) Isolation and characterization of genes differentially expressed during the interaction between apple fruit and Penicillium expansum . Mol. Plant Pathol. 4, 447–457. [DOI] [PubMed] [Google Scholar]
- Schultheiss, H. , Dechert, C. , Király, L. , Fodor, J. , Michel, K. , Kogel, K.‐H. and Hückelhoven, R. (2003) Functional assessment of the pathogenesis‐related protein PR‐1b in barley. Plant Sci. 165, 1275–1280. [Google Scholar]
- Serenius, M. , Mironenko, N. and Manninen, O. (2005) Genetic variation, occurrence of mating types and different forms of Pyrenophora teres causing net blotch of barley in Finland. Mycol. Res. 109, 809–817. [DOI] [PubMed] [Google Scholar]
- Simmons, C.R. , Fridlender, M. , Navarro, P.A. and Yalpani, N. (2003) A maize defense‐inducible gene is a major facilitator superfamily member related to bacterial multidrug resistance efflux antiporters. Plant Mol. Biol. 52, 433–446. [DOI] [PubMed] [Google Scholar]
- Smedegård‐Petersen, V. (1971) Pyrenophora teres f. maculata f. nov. and Pyrenophora teres f. teres on barley in Denmark. In: Yearbook of the Royal Veterinary and Agricultural University (Copenhagen), pp. 124–144. [Google Scholar]
- Song, W.‐Y. , Wang, G.‐L. , Chen, L.‐L. , Kim, H.‐S. , Pi, L.‐Y. , Holsten, T. , Gardner, J. , Wang, B. , Zhai, W.‐X. , Zhu, L.‐H. , Fauquet, C. and Ronald, P. (1995) A receptor kinase‐like protein encoded by the rice disease resistance gene Xa21 . Science, 270, 1804–1806. [DOI] [PubMed] [Google Scholar]
- Steiner‐Lange, S. , Fischer, A. , Boettcher, A. , Rouhara, I. , Liedgens, H. , Schmelzer, E. and Knogge, W. (2003) Differential defense reactions in leaf tissues of barley in response to infection by Rhynchosporium secalis and to treatment with a fungal avirulence gene product. Mol. Plant–Microbe Interact. 16, 893–902. [DOI] [PubMed] [Google Scholar]
- Sun, X. , Cao, Y. , Yang, Z. , Xu, C. , Li, X. , Wang, S. and Zhang, Q. (2004) Xa26, a gene conferring resistance to Xanthomonas oryzae pv. oryzae in rice, encodes an LRR receptor kinase‐like protein. Plant J. 37, 517–527. [DOI] [PubMed] [Google Scholar]
- Sunkar, R. , Bartels, D. and Kirch, H.‐H. (2003) Overexpression of a stress‐inducible aldehyde dehydrogenase gene from Arabidopsis thaliana in transgenic plants improves stress tolerance. Plant J. 35, 452–464. [DOI] [PubMed] [Google Scholar]
- Tao, Y. , Xie, Z. , Chen, W. , Glazebrook, J. , Chang, H‐S. , Han, B. , Zhu, T. , Zou, G. and Katagiri, F. (2003) Quantitative nature of Arabidopsis responses during compatible and incompatible interactions with the bacterial pathogen Pseudomonas syringae . Plant Cell, 15, 317–330. [DOI] [PMC free article] [PubMed] [Google Scholar]
- Tekauz, A. (1990) Characterisation and distribution of pathogenic variation in Pyrenophors teres f. teres and P. teres f. maculata from Western Canada. Can. J. Plant Pathol. 12, 141–148. [Google Scholar]
- Thiel, T. , Kota, R. , Grosse, I. , Stein, N. and Graner, A. (2004) SNP2CAPS: a SNP and INDEL analysis tool for CAPS marker development. Nucleic Acids Res. 32, e5. [DOI] [PMC free article] [PubMed] [Google Scholar]
- Trognitz, F. , Manosalva, P. , Gysin, R. , Nino‐Liu, D. , Simon, R. , Del Rosario Herrera, M. , Trognitz, B. , Ghislain, M. and Nelson, R. (2002) Plant defense genes associated with quantitative resistance to potato late blight in Solanum phureja × dihaploid S. tuberosum hybrids. Mol. Plant–Microbe Interact. 15, 587–597. [DOI] [PubMed] [Google Scholar]
- Vandesompele, J. , De Preter, K. , Pattyn, F. , Poppe, B. , Van Roy, N. , De Paepe, A. and Speleman, F. (2002) Accurate normalization of real‐time quantitative RT‐PCR data by geometric averaging of multiple internal control genes. Genome Biol. 3, 1–11. [DOI] [PMC free article] [PubMed] [Google Scholar]
- Wang, K.L.‐C. , Li, H. and Ecker, J.R. (2002) Ethylene biosynthesis and signaling networks. Plant Cell, 14: S131–S151. [DOI] [PMC free article] [PubMed] [Google Scholar]
- Wang, X. , El Hadrami, A. , Adam, L.R. and Daayf, F. (2005) Genes encoding pathogenesis‐related proteins PR‐2, PR‐3 and PR‐9, are differentially regulated in potato leaves inoculated with isolates from US‐1 and US‐8 genotypes of Phytophthora infestans (Mont.) de Bary. Physiol. Mol. Plant Pathol. 67, 49–56. [Google Scholar]
- Wang, Z. , Taramino, G. , Yang, D. , Liu, G. , Tingey, S.V. , Miao, G.‐H. and Wang, G.‐L. (2001) Rice ESTs with disease‐resistance gene‐ or defense‐response gene‐like sequences mapped to regions containing major resistance genes or QTLs. Mol. Genet. Genom. 265, 302–310. [DOI] [PubMed] [Google Scholar]
- Weiergang, I. , Lyngs Jørgensen, H.J. , Møller, I.M. , Friis, P. and Smedegaard‐Petersen, V. (2002) Correlation between sensitivity of barley to Pyrenophora teres toxins and susceptibility to the fungus. Physiol. Mol. Plant Pathol. 60, 121–129. [Google Scholar]
- Williams, K.J. , Lichon, A. , Gianquitto, P. , Kretschmer, J.M. , Karakousis, A. , Manning, S. , Langridge, P. and Wallwork, H. (1999) Identification and mapping of a gene conferring resistance to the spot form of net blotch (Pyrenophora teres f. maculata) in barley. Theor. Appl. Genet. 99, 323–327. [Google Scholar]
- Williams, L.E. , Lemoine, R. and Sauer, N. (2000) Sugar transporters in higher plants—a diversity of roles and complex regulation. Trends Plant Sci. 5, 283–290. [DOI] [PubMed] [Google Scholar]
- Willsmore, K.L. , Eckerman, P. , Varshney, R.K. , Graner, A. , Langridge, P. , Pallotta, M. , Cheong, J. and Williams, K.J. (2006) New eSSR and gSSR markers added to Australian barley maps. Aust. J. Agr. Res. 57, 953–959. [Google Scholar]
- Wisser, R.J. , Sun, Q. , Hulbert, S.H. , Kresovich, S. and Nelson, R.J. (2005) Identification and characterization of regions of the rice genome associated with broad‐spectrum, quantitative disease resistance. Genetics, 169, 2277–2293. [DOI] [PMC free article] [PubMed] [Google Scholar]
- Yun, S.J. , Gyenis, L. , Hayes, P.M. , Matus, I. , Smith, K.P. , Steffenson, B.J. and Muehlbauer, G.J. (2005) Quantitative trait loci for multiple disease resistance in wild barley. Crop Sci. 45, 2563–2572. [Google Scholar]
- Zhang, L. , Meakin, H. and Dickinson, M. (2003) Isolation of genes expressed during compatible interactions between leaf rust (Puccinia triticina) and wheat using cDNA‐AFLP. Mol. Plant Pathol. 4, 469–477. [DOI] [PubMed] [Google Scholar]
- Zierold, U. , Scholz, U. and Schweizer, P. (2005) Transcriptome analysis of mlo‐mediated resistance in the epidermis of barley. Mol. Plant Pathol. 6, 139–151. [DOI] [PubMed] [Google Scholar]
Associated Data
This section collects any data citations, data availability statements, or supplementary materials included in this article.
Supplementary Materials
Fig. S1 Chart indicating the average expression stability (M) value of reference genes at each step during stepwise exclusion of the least stable reference gene, according to geNorm analysis (Vandesompele et al., 2002). Starting from the least stable gene at the left, the genes are ranked according to increasing expression stability, ending with the two most stable genes at the right.
Table S1 Summary of 17 candidate DR gene clones showing no differential expression in barley–Ptt and barley–Ptm incompatible compared with compatible interactions
Table S2 Gene‐specific primers, expected PCR product sizes and optimal acquisition temperatures for expression profiling of DR genes by Q‐PCR
Please note: Blackwell Publishing are not responsible for the content or functionality of any supporting materials supplied by the authors. Any queries (other than missing material) should be directed to the corresponding author for the article.
Supporting info item
Supporting info item
Supporting info item