

Abstract
Background
Reference antifungal susceptibility testing of echinocandins against Aspergillus spp. relies on the determination of the minimal effective concentration, which is difficult to perform, time-consuming and subjective. We developed and evaluated in a multicentre study an agar-based screening method for echinocandin susceptibility testing of Aspergillus spp.
Methods
Forty WT isolates [10 Aspergillus fumigatus species complex (SC), 10 Aspergillus flavus SC, 10 Aspergillus terreus SC and 10 Aspergillus niger SC] and 4 non-WT A. fumigatus isolates with or without known fks alterations were used. The optimal test conditions and stability over time were evaluated in preliminary studies monitoring colony growth. Twenty-microlitre aliquots of 1–2 McFarland inocula in 0.1% Tween 20 aqueous solution were added to each well and plates were incubated for 24/48 h at 35 ± 2°C. Subsequently, all isolates were tested blindly at three centres using four-well screening plates, containing anidulafungin, caspofungin, micafungin or no antifungal in each of the four wells, respectively.
Results
WT isolates produced fluffy colonies on drug-free agar wells only. The non-WT isolates produced fluffy colonies on echinocandin-containing and control agar wells. Using the echinocandin concentrations of 0.25 mg/L anidulafungin, 1 mg/L caspofungin and 0.125 mg/L micafungin, and the compact (non-fluffy) versus fluffy colony morphology endpoint, all centres successfully discriminated non-WT and WT strains even after 24 h. Among the three echinocandins, anidulafungin produced the clearest endpoints.
Conclusions
The four-well plate agar method is suitable for echinocandin susceptibility screening of Aspergillus spp. and can be used to detect echinocandin non-WT isolates.
Introduction
Resistance in Aspergillus is emerging worldwide, prompting the need for real-time antifungal susceptibility testing of clinical isolates in laboratory routine.1 Echinocandins target the fungal cell wall by inhibiting the synthesis of β-(1,3)-d-glucan and exhibit fungistatic activity against Aspergillus spp. According to international clinical aspergillosis guidelines, caspofungin or micafungin monotherapy is indicated in patients with invasive aspergillosis who are refractory or intolerant to other approved therapies, whereas the use of echinocandins in combination with other antifungal agents may be considered particularly when azole-resistance is suspected.2,3 The increased use of echinocandins in these clinical settings may increase the likelihood of acquired resistance.
The first echinocandin-resistant Aspergillus fumigatus isolate was reported in 2008 from a patient failing itraconazole and caspofungin treatment and was linked to up-regulated target enzyme production.4 The second clinical A. fumigatus isolate was recently recovered from a chronic pulmonary aspergillosis patient who failed azole and polyene therapy and subsequently failed micafungin treatment and this time was linked to a target gene alteration.5 Notably, reduced susceptibility to echinocandins may be under-diagnosed as the breakthrough isolates are often not recovered and the gold standard method for echinocandin susceptibility testing of Aspergillus suffers from technical difficulties, making it inconvenient and not easily incorporated into daily laboratory practice.
Broth microdilution (BMD) techniques, standardized by CLSI and EUCAST, are universally accepted as reference procedures for antifungal susceptibility testing of filamentous fungi.6,7 Owing to their mode of action, echinocandins do not induce complete inhibition and consequently significant trailing growth most often prohibits a visual endpoint determination. Therefore, the recommended endpoint for determining echinocandin activity against moulds is the minimal effective concentration (MEC), defined as an altered multibranched rosette morphology. However, its reading is labour intensive, subjective and requires expertise. Furthermore, suboptimal reproducibility is a problem, as variation has been noted in published ranges of echinocandin MECs for Aspergillus spp.,8–10 which may hamper the ability to correctly identify non-WT isolates.4
The performance of the four-well agar screening method for the detection of azole-resistant A. fumigatus isolates has been recently validated, showing excellent results.11 We hypothesized that drug dilutions in agar might improve stability of the drugs, enhance growth and increase reproducibility of echinocandin susceptibility testing of Aspergillus spp. In this multicentre study, an agar-based screening method for echinocandin susceptibility testing of Aspergillus spp. was developed and its performance was evaluated.
Materials and methods
Study design
Initial agar drug concentration optimization and endpoint definition studies were performed in Centre 1 using 40 echinocandin WT and 4 non-WT Aspergillus isolates. Subsequently, all previously tested Aspergillus spp. isolates and in-house-prepared four-well plates were sent blinded to Centres 2 and 3 for the evaluation of the agar-based screening method in a three-laboratory multicentre setting.
Aspergillus isolates
A total of 40 WT clinical isolates of Aspergillus spp. (assessed with the EUCAST E.Def 9.3 reference method),12 including 10 A. fumigatus species complex (SC), 10 Aspergillus flavus SC, 10 Aspergillus terreus SC and 10 Aspergillus niger SC, and 4 non-WT A. fumigatus isolates possessing elevated MEC values with (DPL1035,13 DPLMD240535) or without (DPLDS55985, DPLDS32458) known fks alterations were included. Species identification of WT strains was carried out using standard microbiological techniques. The isolates were stored in normal sterile saline with 10% glycerol at −70°C until the study was performed.
Antifungal drugs and medium
Laboratory-grade standard powders of anidulafungin (Pfizer, Inc., Groton, CT, USA), caspofungin acetate (Merck & Co., Inc., Whitehouse, NJ, USA) and micafungin (Astellas Pharma, Inc., Tokyo, Japan) were dissolved in sterile DMSO (Chem-Lab NV, Zedelgem, Belgium) and stock solutions of 10 mg/mL were stored in aliquots at −70°C. The medium used throughout was RPMI 1640 (with l-glutamine, without bicarbonate) (AppliChem, Darmstadt, Germany) buffered to pH 7.0 with 0.165 M MOPS (AppliChem) and supplemented with 2% glucose (AppliChem).
BMD method
For the reference BMD method procedure, performed as outlined in the EUCAST E.Def 9.3 document,12 each isolate was revived by subculturing it twice on Sabouraud dextrose agar plates with gentamicin and chloramphenicol (SGC2; bioMérieux) at 30°C for 5–7 days to ensure purity, viability and adequate sporulation. Conidial suspensions were prepared in sterile water with 0.1% Tween 20 and 2-fold serial drug concentrations ranging from 0.001 to 1 mg/L anidulafungin and micafungin and from 0.004 to 4 mg/L caspofungin (for the non-WT A. fumigatus isolates, 0.125–16 mg/L of all three echinocandins) were used. The plates were incubated for 48 h and the MEC was defined as the lowest drug concentration at which short, stubby and highly branched hyphal clusters were observed compared with the growth control well of the panel using an inverted microscope. The reference strains Candida krusei ATCC 6258 and Candida parapsilosis ATCC 22019 were used as quality controls (QCs).
Agar screening method
Optimization of test conditions
Initially, the colony morphology of Aspergillus spp. isolates on 50 mL of standard medium with 15 g/L agar (Oxoid Ltd, Basingstoke, UK) (RPMI agar) containing increasing concentrations [2-fold drug concentrations (0.002–4 mg/L)] of each echinocandin was tested in square sterile plastic Petri dishes (10 × 10 cm). Colony morphology was evaluated qualitatively (fluffy, aerial mycelia around the colony comparable to the drug-free growth versus aberrant compact non-fluffy appearance on agars with high echinocandin concentration) and quantitatively (diameter of colony). Subsequently, in order to find the optimal concentration that best discriminated WT from non-WT isolates, 30 μL aliquots of 1–2 McFarland inocula in sterile water with 0.1% Tween 20 of all isolates were inoculated in agar plates containing increasing concentrations of each of the echinocandins and the colony morphology of each isolate was recorded macroscopically at each concentration after 24 and 48 h of incubation at 35 ± 2°C. The second-lowest concentration that consistently prevented fluffy colony growth of WT isolates across the tested species yet allowed fluffy growth of the four non-WT A. fumigatus isolates was regarded as the optimal test concentration for each echinocandin.
Four-well square agar plates were then prepared by filling each well with 0.5 mL of RPMI agar containing either no antifungal or one of the three echinocandins at a previously found selective concentration. Each well was then inoculated with different volumes (10, 20 or 30 μL) and techniques (spotted in the centre without or after complete absorption) of Aspergillus inoculum. The formation of compact non-fluffy versus fluffy (similar to the drug-free control) colonies was recorded for each well after 24 and 48 h of incubation at 35 ± 2°C.
Reproducibility
Inter-experimental variation was evaluated by testing three isolates of each species on three different days. Experiments were independently performed under the same conditions with individually prepared inocula.
Shelf-life study
The stability of four-well plates was assessed monthly with QC isolates C. krusei ATCC 6258, C. parapsilosis ATCC 22019 and A. fumigatus NIH4215 ATCC MYA-3626 for up to 6 months. The echinocandin-containing agar plates were stored at 4°C sealed in plastic bags and inoculated with 20 μL of a 0.5 McFarland suspension of Candida spp. (in order to approximate the number of conidia inside the wells of the EUCAST broth reference microdilution method, ∼104 cfu) and 20 μL of a 1–2 McFarland suspension of A. fumigatus and the colony morphology was observed over time in order to detect macroscopic differences.
Multicentre assessment of agar screening method
After determining the optimal conditions for the agar screening method, all isolates were tested blindly in three centres following the optimized protocol. Briefly, an inoculum was prepared by collecting conidia from 5- to 7-day-old cultures with a moist sterile swab, diluting in sterile water with 0.1% Tween 20 and adjusting to a turbidity equivalent to that of a 1–2 McFarland standard. Then, 20 μL of the inoculum suspension was applied to each well of the four-well screening agar plates containing either each of the echinocandins in the selective concentration or no antifungal. When the inoculum was fully absorbed, plates were incubated at 35 ± 2°C for 2 days. The formation of fluffy colonies like those in the drug-free control was recorded for each isolate and well by two independent readers after 24 and 48 h.
Results
EUCAST susceptibility pattern
The median (range) MECs for all isolates and centres were 0.015 mg/L (0.001–0.125 mg/L) anidulafungin, 0.25 mg/L (0.06–1 mg/L) caspofungin and 0.03 mg/L (0.002–0.125 mg/L) micafungin for the 40 WT Aspergillus isolates, while MECs >16 mg/L (2 to >16 mg/L) of all three echinocandins were found for the non-WT strains (DPLMD24053 had an MEC of 2–4 mg/L) (Table S1, available as Supplementary data at JAC Online). The MIC values of all echinocandins for the QC strains C. krusei ATCC 6258 and C. parapsilosis ATCC 22019 were within the reference ranges.
Optimal test conditions
The appearance of A. fumigatus SC WT colonies on drug-free agar after 24 and 48 h was fluffy, whereas when A. fumigatus SC grew on caspofungin-containing agar the colonies developed a compact appearance as shown in Figure 1. The appearance of non-WT A. fumigatus was fluffy on both caspofungin and drug-free agar. The same findings were observed in the four-well plate for the other two echinocandins against A. fumigatus SC (Figure 2) and the other Aspergillus spp. (Figure 3). The WT isolates produced fluffy colonies (similar to the ones in drug-free agar) at low concentrations, but as the concentration increased the morphology changed to colonies with small (diameter ≤8 cm) or irregular halos around the colonies (Figure 4) at intermediate concentrations to a compact appearance at higher concentrations for all three echinocandins (Table 1). The same colony morphology with fluffy appearance was observed for all four non-WT isolates even at the highest concentration of each echinocandin (Table 1). All WT isolates for all four species had the compact appearance at ≥0.125 mg/L anidulafungin, ≥0.5 mg/L caspofungin and ≥0.06 mg/L micafungin (Table 1). In order to account for potential variation in drug dilutions, the drug concentrations selected as optimal for further evaluation of the agar screening method were one 2-fold dilution higher, namely 0.25 mg/L anidulafungin, 1 mg/L caspofungin and 0.125 mg/L micafungin.
Figure 1.

Colony morphology of an A. fumigatus non-WT strain and an A. fumigatus SC WT strain on caspofungin-containing (2 mg/L) and drug-free agar after 24 and 48 h of incubation. Note the fluffy versus compact appearance. This figure appears in colour in the online version of JAC and in black and white in the print version of JAC.
Figure 2.

Colony morphology of selected echinocandin WT A. fumigatus SC and non-WT A. fumigatus isolates on agar containing increasing effective concentrations (mg/L) of each echinocandin and drug-free agar (GC) in four-well plates after 24 and 48 h of incubation at 35 ± 2°C. This figure appears in colour in the online version of JAC and in black and white in the print version of JAC.
Figure 3.

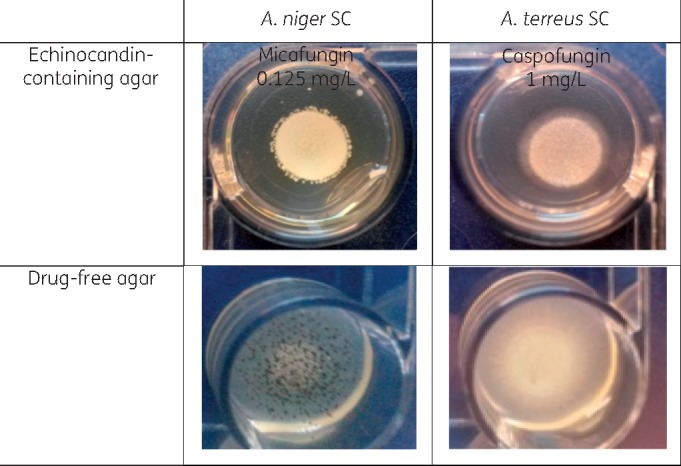
Agar-based screening method for three Aspergillus spp. in four-well plates containing increasing concentrations (mg/L) of echinocandins and drug-free agar (GC) after incubation at 35 ± 2°C for 24 h. This figure appears in colour in the online version of JAC and in black and white in the print version of JAC.
Figure 4.
Production of an irregular (top left photograph) or a small (colony diameter ≤8 mm) (top right photograph) halo around A. niger SC and A. terreus SC WT isolates after incubation at 35 ± 2°C for 48 h. The morphology of colonies is clearly different from strains grown on drug-free agar with and without conidiogenesis (colony diameter ≥15 mm) (bottom photographs). This figure appears in colour in the online version of JAC and in black and white in the print version of JAC.
Table 1.
Determination of optimal concentration of each echinocandin (bold font) based on colony morphology on drug-containing and drug-free agars of Aspergillus spp. isolates after incubation at 35 ± 2°C for 24 h
| Antifungal drug | Species (number of isolates) | Number of isolates with fluffy colony morphology similar to that on drug-free agar at each of the following concentrations (mg/L): |
|||||||||||
|---|---|---|---|---|---|---|---|---|---|---|---|---|---|
| 0.002 | 0.004 | 0.008 | 0.015 | 0.03 | 0.06 | 0.125 | 0.25 | 0.5 | 1 | 2 | 4 | ||
| Caspofungin | A. fumigatus SC WT (n = 10) | 10 | 10 | 0 (10a) | 0 (10a) | 0 (3a) | 0 | 0 | 0 (4a) | 0 (6a) | |||
| A. fumigatus non-WT (n = 4) | 4 | 4 | 4 | 4 | 4 | 4 | 4 | 4 | 4 | ||||
| A. flavus SC (n = 10) | 10 | 10 | 0 (10b) | 0 (10a) | 0 (10a) | 0 | 0 | 0 | 0 | ||||
| A. terreus SC (n = 10) | 10 | 10 | 9 | 0 (9a) | 0 (9a) | 0 (9a) | 0 | 0 | 0 | ||||
| A. niger SC (n = 10) | 10 | 10 | 0 (4b) | 0 (1b) | 0 (1b) | 0 (1b) | 0 | 0 | 0 | ||||
| Anidulafungin | A. fumigatus SC WT (n = 10) | 10 | 7 | 4 (3b) | 4 (3b) | 4 (3b) | 0 (3b) | 0 | 0 | 0 | 0 | ||
| A. fumigatus non-WT (n = 4) | 4 | 4 | 4 | 4 | 4 | 4 | 4 | 4 | 4 | 4 | |||
| A. flavus SC (n = 10) | 10 | 10 | 10 | 10 | 3 (7b) | 0 (3b) | 0 | 0 | 0 | 0 | |||
| A. terreus SC (n = 10) | 10 | 10 | 7 | 3 | 0 (3b) | 0 | 0 | 0 | 0 | 0 | |||
| A. niger SC (n = 10) | 10 | 10 | 3 | 0 (1b) | 0 (1b) | 0 | 0 | 0 | 0 | 0 | |||
| Micafungin | A. fumigatus SC WT (n = 10) | 10 | 0 (6a) | 0 (2b) | 0 (2a) | 0 (2a) | 0 | 0 | 0 | 0 | 0 | ||
| A. fumigatus non-WT (n = 4) | 4 | 4 | 4 | 4 | 4 | 4 | 4 | 4 | 4 | 4 | |||
| A. flavus SC (n = 10) | 10 | 10 | 10 | 3 (3a) | 0 (6b) | 0 | 0 | 0 | 0 | 0 | |||
| A. terreus SC (n = 10) | 10 | 7 (3a) | 3 (7a) | 3 (3a) | 0 (3a) | 0 | 0 | 0 | 0 | 0 | |||
| A. niger SC (n = 10) | 10 | 10 | 0 (1b) | 0 (1b) | 0 (1b) | 0 | 0 | 0 | 0 | 0 | |||
The second-lowest concentration that consistently prevented fluffy colony growth of WT isolates across the tested species, yet allowed fluffy growth of the four non-WT A. fumigatus isolates, was regarded as the optimal test concentration.
Small halo around the colonies (colony diameter ≤8 cm).
Irregular halo around the colonies.
The colony morphology was not different between 24 and 48 h of incubation, with fluffy appearance being more pronounced at 48 h. However, because small (colony diameter ≤8 mm) or irregular halos were more frequently observed at 48 h, making the interpretation more difficult, the preferred incubation time was 24 h unless insufficient growth (no fluffy colony morphology) was observed in the drug-free well (Figures 1 and 2). The optimal inoculum volume and technique was 20 μL, with complete absorption onto the agar’s surface before incubation (Figure S1).
Reproducibility and shelf life
Variation between experiments due to differences in the colony morphology of Aspergillus isolates tested was not observed (100% agreement). The four-well plates were stable for up to 6 months, with the same colony morphology of the three QC strains (Figure S2).
Multicentre evaluation
All participating laboratories successfully identified non-WT isolates as such by the production of fluffy colonies in echinocandin-containing agar wells after 24 h of incubation (100% sensitivity). Additionally, all laboratories correctly recognized WT isolates as such, due to a clear difference in colony morphology compared with the drug-free control (100% specificity). However, some WT strains failed to produce strictly compact colonies in drug-containing agars after 24 h in each centre, indicating some inter-centre variation. Instead, they produced small (colony diameter ≤8 versus ≥11 mm for the drug-free control) or irregular halos around the colonies (Figure 4). This was observed for 0/40 isolates at Centre 1, 6/40 at Centre 2 and 10/40 at Centre 3. In particular for Centre 2, these colonies were observed with four A. terreus SC isolates in the caspofungin well (one isolate also produced such colonies in the micafungin well) and two A. niger SC isolates in the micafungin well. In Centre 3, such colonies were observed with five A. terreus SC isolates and three A. niger SC isolates in the caspofungin well and one A. flavus SC isolate and one A. niger SC isolate in the micafungin well. No such colonies were observed with anidulafungin for any isolates in all three centres. Similar findings were found after 48 h. There were more isolates (including A. fumigatus SC isolates) showing small or irregular halos with a colony diameter ≤14 mm. However, this appearance was distinct from the fluffy appearance with colony diameter ≥15 mm of all isolates in drug-free wells and of the non-WT isolates in drug-containing wells. However, a 48 h endpoint may be better for some non-WT isolates that grow slower (Figure 5).
Figure 5.

Colony morphology of three A. fumigatus non-WT isolates after 24 and 48 h of incubation in the four-well agar screening plates containing 1 mg/L caspofungin (CAS), 0.25 mg/L anidulafungin (ANI) and 0.125 mg/L micafungin (MIC) and no drug (GC). This figure appears in colour in the online version of JAC and in black and white in the print version of JAC.
Discussion
In the present study an accurate, rapid and simple agar-based screening method for echinocandin susceptibility testing of Aspergillus spp. was developed and validated. Optimization studies indicated that the best test conditions were inoculation of 20 μL of ΜcFarland 1–2 Aspergillus conidia suspension onto the centre of agar wells containing 1 mg/L for caspofungin, 0.125 mg/L for micafungin and 0.25 mg/L for anidulafungin. Typical fluffy colony morphology on drug-containing agar indicated non-WT isolates. Plates were stable for at least 6 months and high inter-observer and inter-centre agreement was found. Although all non-WT isolates produced fluffy colonies reproducibly, some variation in colony morphology of WT isolates was observed. However, these were all clearly different from that in the drug-free control.
The wide use of echinocandins against invasive fungal infections (as prophylaxis, empirical and target treatment), including invasive aspergillosis (as salvage or combination therapy), raises concerns that resistant isolates may emerge. This is particularly concerning due to the recent azole resistance in A. fumigatus that has emerged worldwide. The first cases of echinocandin-resistant A. fumigatus clinical isolates from patients failing echinocandin treatment have been reported, necessitating increased awareness and preparedness for this phenomenon.4,5 The prevalence of echinocandin resistance in Aspergillus is unknown given that pathogens from breakthrough infections in patients treated with echinocandins are usually not isolated. In addition, among pathogens that have been recovered, non-WT isolates with MECs above the epidemiological cut-off values were found.4,5,14–19 Furthermore, recent studies have highlighted the emergence of Aspergillus cryptic species isolated from clinical samples that show reduced susceptibility to caspofungin and are often found along with A. fumigatus in mixed infections with poor outcome.20–22
Thus, echinocandin susceptibility testing of clinically relevant Aspergillus isolates seems vital. Nevertheless, the reference BMD methods are technically demanding and as a result they are often not broadly applicable in routine laboratory practice. MEC determination with BMD methods is associated with inter- and intra-centre variation usually within three or more 2-fold dilutions, as shown in Table S1. At present, alternative commercially prepared test formats are available, but they have not yet been approved for mould testing and breakpoints are lacking. Disc-based susceptibility testing is convenient, but the data for echinocandins against Aspergillus spp. are contradictory and the choice of medium appears pivotal.23–26 Studies assessing the performance of a commercialized gradient diffusion technique, Etest, for susceptibility testing of echinocandins against Aspergillus spp. have shown controversial results, ranging from poor agreement, particularly for caspofungin, which produces on-scale MECs, to excellent agreement for the other two echinocandins, which usually result in low off-scale MECs.9,27 Studies have showed that the Etest may be suitable only for highly susceptible or highly resistant isolates, but not for isolates with mid-range MECs,27 or for some A. fumigatus, but not for all Aspergillus spp.28,29 Etest readings provided better agreement with reference methods after 24 than 48 h because of elevated MICs after 48 h.29,30 Furthermore, echinocandin Etest MIC reading might be troublesome due to heavy growth of micro- and macro-colonies within the apparent ellipse.31 Of note, in a recent multicentre study the significant heterogeneity in the respective modal MICs (wide modal ranges) precluded the establishment of Etest epidemiological cut-off values for species of Aspergillus and caspofungin.32
Colorimetric assays have also been used for echinocandin susceptibility testing of Aspergillus spp. Although in a head-to-head comparison of the Sensititre YeastOne® broth-based MIC panel versus the CLSI BMD method the level of agreement was low (<88%), detection of two echinocandin non-WT A. fumigatus isolates after 24 h of incubation using the colorimetric assay was demonstrated.33 In-house colorimetric assays that are amenable to optimization (XTT and MTT) and assess metabolic activity of Aspergillus spp. after exposure to echinocandins have also been applied with promising results.34,35 A challenge in setting optimal test conditions for these assays will be the different growth and metabolic rates among different Aspergillus spp. and strains. Even when these conditions are determined in single-centre studies, the performance evaluation of these assays in multicentre studies including non-WT strains is of paramount importance to ensure reproducibility and universal application.
Although less is currently known regarding echinocandin resistance in filamentous fungi, in vitro reduced susceptibility of A. fumigatus to echinocandins can develop via fks-dependent and fks-independent mechanisms.13,36,37 A resistance-associated point mutation in the hot-spot 1 region of fks1, conferring a F675S amino acid substitution, was recently found in an A. fumigatus isolate recovered from a patient on micafungin therapy for chronic pulmonary aspergillosis.5 The mutant strain yielded a β-(1,3)-glucan synthase enzyme with reduced sensitivity to echinocandin drugs resulting in elevated MECs and echinocandin clinical failure. In addition, an fks-independent resistance mechanism was reported in a patient infected with a multi-azole-resistant A. fumigatus isolate who failed itraconazole and caspofungin therapy.4 The isolate overexpressed the fks gene and displayed reduced susceptibility in the Etest and a mouse model, but not in the BMD method, questioning the ability of broth dilution methods to detect echinocandin-resistant strains.4 Several attempts to recover this resistant strain over time failed, indicating loss of the resistance mechanism or a mixed population of susceptible and mutant cells that were outcompeted because of lower fitness (M. C. Arendrup, unpublished data). An agar screening method could help in detecting transient resistance and mixed populations since it could be applied directly on clinical isolates recovered from primary cultures.
In summary, an accurate and easy-to-use agar-based screening method discriminating echinocandin WT and non-WT Aspergillus isolates after 24 h of incubation with high inter-experimental and inter-centre reproducibility was developed. Given the difficulties of echinocandin susceptibility testing against Aspergillus spp. with reference BMD methods, particularly in non-expert routine diagnostic laboratories, the implementation of the four-well screening plate will allow the fast and reliable detection of Aspergillus isolates with reduced susceptibility to echinocandins for further investigation. The new method is cheaper (∼€3/plate) than most commercial tests and the reference BMD methods. The new method will enable assessment of the prevalence of echinocandin resistance among Aspergillus spp. and possibly other filamentous fungi. However, more non-WT isolates, particularly of non-A. fumigatus species, with differential susceptibility to each echinocandin should be tested to evaluate the performance of the current method in detecting non-WT isolates of different Aspergillus species. Therefore, isolates with non-WT appearance should be verified with BMD reference methods. Finally, it can be combined with the newly reported azole-screening assay previously developed for detecting azole-resistant A. fumigatus isolates. Since the use of itraconazole- and voriconazole-containing agar wells detected all resistant isolates with different CYP51A mutations, the next generation of four-well plates could contain itraconazole, voriconazole, an echinocandin and the drug-free well in order to detect simultaneously azole-resistant and echinocandin non-WT A. fumigatus strains. Anidulafungin produced the clearest endpoint (and thus could be used as a marker for echinocandin-resistant A. fumigatus), although performance for all three echinocandins was perfect with the current WT and non-WT isolate collection. Such a screening test will be easy to implement and will guide the choice of adequate antifungal therapy, reducing significant delays in initiating appropriate treatment.
Funding
This study was supported by unrestricted grants from Astellas and MSD.
The Perlin Echinocandin Resistance Reference Lab is supported by a grant from Astellas and D. S. P. is supported by NIH grant AI109025.
Transparency declarations
None to declare.
Supplementary Material
References
- 1. Bernal-Martínez L, Alastruey-Izquierdo A, Cuenca-Estrella M.. Diagnostics and susceptibility testing in Aspergillus. Future Microbiol 2016; 11: 315–28. [DOI] [PubMed] [Google Scholar]
- 2. Ullmann AJ, Aguado JM, Arikan-Akdagli S. et al. Diagnosis and management of Aspergillus diseases: executive summary of the 2017 ESCMID-ECMM-ERS guideline. Clin Microbiol Infect 2018; 24: e1–38. [DOI] [PubMed] [Google Scholar]
- 3. Patterson TF, Thompson GR, Denning DW. et al. Practice guidelines for the diagnosis and management of aspergillosis: 2016 update by the Infectious Diseases Society of America. Clin Infect Dis 2016; 63: e1–60. [DOI] [PMC free article] [PubMed] [Google Scholar]
- 4. Arendrup MC, Perkhofer S, Howard SJ. et al. Establishing in vitro-in vivo correlations for Aspergillus fumigatus: the challenge of azoles versus echinocandins. Antimicrob Agents Chemother 2008; 52: 3504–11. [DOI] [PMC free article] [PubMed] [Google Scholar]
- 5. Jiménez-Ortigosa C, Moore C, Denning DW. et al. Emergence of echinocandin resistance due to a point mutation in the fks1 gene of Aspergillus fumigatus in a patient with chronic pulmonary aspergillosis. Antimicrob Agents Chemother 2017; 61: e01277–17. [DOI] [PMC free article] [PubMed] [Google Scholar]
- 6.Clinical and Laboratory Standards Institute. Reference Method for Broth Dilution Antifungal Susceptibility Testing of Filamentous Fungi—Third Edition: M38. CLSI, Wayne, PA, USA, 2017. [Google Scholar]
- 7. Arendrup MC, Meletiadis J, Mouton JW. et al. EUCAST Definitive Document E.Def 9.3.1: Method for the Determination of Broth Dilution Minimum Inhibitory Concentrations of Antifungal Agents for Conidia Forming Moulds 2017. www.eucast.org.
- 8. Espinel-Ingroff A, Fothergill A, Fuller J. et al. Wild-type MIC distributions and epidemiological cutoff values for caspofungin and Aspergillus spp. for the CLSI broth microdilution method (M38-A2 document). Antimicrob Agents Chemother 2011; 55: 2855–9. [DOI] [PMC free article] [PubMed] [Google Scholar]
- 9. Fuller J, Schofield A, Jiwa S. et al. Caspofungin Etest endpoint for Aspergillus isolates shows poor agreement with the reference minimum effective concentration. J Clin Microbiol 2010; 48: 479–82. [DOI] [PMC free article] [PubMed] [Google Scholar]
- 10. Pfaller MA, Boyken L, Hollis RJ. et al. In vitro susceptibility of clinical isolates of Aspergillus spp. to anidulafungin, caspofungin, and micafungin: a head-to-head comparison using the CLSI M38-A2 broth microdilution method. J Clin Microbiol 2009; 47: 3323–5. [DOI] [PMC free article] [PubMed] [Google Scholar]
- 11. Arendrup MC, Verweij PE, Mouton JW. et al. Multicentre validation of 4-well azole agar plates as a screening method for detection of clinically relevant azole-resistant Aspergillus fumigatus. J Antimicrob Chemother 2017; 72: 3325–33. [DOI] [PubMed] [Google Scholar]
- 12. Arendrup MC, Guinea J, Cuenca-Estrella M. et al. EUCAST Definitive Document E.Def 9.3: Method for the Determination of Broth Dilution Minimum Inhibitory Concentrations of Antifungal Agents for Conidia Forming Moulds 2015. http://www.eucast.org/fileadmin/src/media/PDFs/EUCAST_files/AFST/Files/EUCAST_E_Def_9_3_Mould_testing_definitive.pdf.
- 13. Rocha EMF, Garcia-Effron G, Park S. et al. A Ser678Pro substitution in Fks1p confers resistance to echinocandin drugs in Aspergillus fumigatus. Antimicrob Agents Chemother 2007; 51: 4174–6. [DOI] [PMC free article] [PubMed] [Google Scholar]
- 14. Pang K-A, Godet C, Fekkar A. et al. Breakthrough invasive mould infections in patients treated with caspofungin. J Infect 2012; 64: 424–9. [DOI] [PubMed] [Google Scholar]
- 15. Lockhart SR, Zimbeck AJ, Baddley JW. et al. In vitro echinocandin susceptibility of Aspergillus isolates from patients enrolled in the Transplant-Associated Infection Surveillance Network. Antimicrob Agents Chemother 2011; 55: 3944–6. [DOI] [PMC free article] [PubMed] [Google Scholar]
- 16. Arendrup MC, Garcia-Effron G, Buzina W. et al. Breakthrough Aspergillus fumigatus and Candida albicans double infection during caspofungin treatment: laboratory characteristics and implication for susceptibility testing. Antimicrob Agents Chemother 2009; 53: 1185–93. [DOI] [PMC free article] [PubMed] [Google Scholar]
- 17. Eschertzhuber S, Velik-Salchner C, Hoermann C. et al. Caspofungin-resistant Aspergillus flavus after heart transplantation and mechanical circulatory support: a case report. Transpl Infect Dis 2008; 10: 190–2. [DOI] [PubMed] [Google Scholar]
- 18. Madureira A, Bergeron A, Lacroix C. et al. Breakthrough invasive aspergillosis in allogeneic haematopoietic stem cell transplant recipients treated with caspofungin. Int J Antimicrob Agents 2007; 30: 551–4. [DOI] [PubMed] [Google Scholar]
- 19. Balajee SA, Lindsley MD, Iqbal N. et al. Nonsporulating clinical isolate identified as Petromyces alliaceus (anamorph Aspergillus alliaceus) by morphological and sequence-based methods. J Clin Microbiol 2007; 45: 2701–3. [DOI] [PMC free article] [PubMed] [Google Scholar]
- 20. Alastruey-Izquierdo A, Alcazar-Fuoli L, Cuenca-Estrella M.. Antifungal susceptibility profile of cryptic species of Aspergillus. Mycopathologia 2014; 178: 427–33. [DOI] [PubMed] [Google Scholar]
- 21. Montenegro G, Sánchez Puch S, Jewtuchowicz VM. et al. Phenotypic and genotypic characterization of Aspergillus lentulus and Aspergillus fumigatus isolates in a patient with probable invasive aspergillosis. J Med Microbiol 2009; 58: 391–5. [DOI] [PubMed] [Google Scholar]
- 22. Alhambra A, Catalán M, Moragues MD. et al. Isolation of Aspergillus lentulus in Spain from a critically ill patient with chronic obstructive pulmonary disease. Rev Iberoam Micol 2008; 25: 246–9. [DOI] [PubMed] [Google Scholar]
- 23. Martos AI, Martín-Mazuelos E, Romero A. et al. Evaluation of disk diffusion method compared to broth microdilution for antifungal susceptibility testing of 3 echinocandins against Aspergillus spp. Diagn Microbiol Infect Dis 2012; 73: 53–6. [DOI] [PubMed] [Google Scholar]
- 24. Maida CM, Milici ME, Trovato L. et al. Evaluation of the disk diffusion method compared to the microdilution method in susceptibility testing of anidulafungin against filamentous fungi. J Clin Microbiol 2008; 46: 4071–4. [DOI] [PMC free article] [PubMed] [Google Scholar]
- 25. Espinel-Ingroff A, Arthington-Skaggs B, Iqbal N. et al. Multicenter evaluation of a new disk agar diffusion method for susceptibility testing of filamentous fungi with voriconazole, posaconazole, itraconazole, amphotericin B, and caspofungin. J Clin Microbiol 2007; 45: 1811–20. [DOI] [PMC free article] [PubMed] [Google Scholar]
- 26. Arikan S, Yurdakul P, Hascelik G.. Comparison of two methods and three end points in determination of in vitro activity of micafungin against Aspergillus spp. Antimicrob Agents Chemother 2003; 47: 2640–3. [DOI] [PMC free article] [PubMed] [Google Scholar]
- 27. Lamoth F, Alexander BD.. Comparing Etest and broth microdilution for antifungal susceptibility testing of the most-relevant pathogenic molds. J Clin Microbiol 2015; 53: 3176–81. [DOI] [PMC free article] [PubMed] [Google Scholar]
- 28. Espinel-Ingroff A. Evaluation of broth microdilution testing parameters and agar diffusion Etest procedure for testing susceptibilities of Aspergillus spp. to caspofungin acetate (MK-0991). J Clin Microbiol 2003; 41: 403–9. [DOI] [PMC free article] [PubMed] [Google Scholar]
- 29. Martos AI, Romero A, González MT. et al. Evaluation of the Etest method for susceptibility testing of Aspergillus spp. and Fusarium spp. to three echinocandins. Med Mycol 2010; 48: 858–61. [DOI] [PubMed] [Google Scholar]
- 30. Meletiadis J, Mouton JW, Meis J. et al. Comparison of the Etest and the sensititre colorimetric methods with the NCCLS proposed standard for antifungal susceptibility testing of Aspergillus species. J Clin Microbiol 2002; 40: 2876–85. [DOI] [PMC free article] [PubMed] [Google Scholar]
- 31. Lass-Flörl C, Perkhofer S, Mayr A.. In vitro susceptibility testing in fungi: a global perspective on a variety of methods. Mycoses 2010; 53: 1–11. [DOI] [PubMed] [Google Scholar]
- 32. Espinel-Ingroff A, Arendrup M, Canton E. et al. Multicenter study of method-dependent epidemiological cutoff values for detection of resistance in Candida spp. and Aspergillus spp. to amphotericin B and echinocandins for the Etest agar diffusion method. Antimicrob Agents Chemother 2017; 61: e01792–16. [DOI] [PMC free article] [PubMed] [Google Scholar]
- 33. Siopi M, Pournaras S, Meletiadis J.. Comparative evaluation of Sensititre YeastOne and CLSI M38-A2 reference method for antifungal susceptibility testing of Aspergillus spp. against echinocandins. J Clin Microbiol 2017; 55: 1714–9. [DOI] [PMC free article] [PubMed] [Google Scholar]
- 34. Hawser SP, Jessup C, Vitullo J. et al. Utility of 2,3-bis(2-methoxy-4-nitro-5-sulfophenyl)-5-[(phenyl-amino)carbonyl]-2H-tetrazolium hydroxide (XTT) and minimum effective concentration assays in the determination of antifungal susceptibility of Aspergillus fumigatus to the lipopeptide class of compounds. J Clin Microbiol 2001; 39: 2738–41. [DOI] [PMC free article] [PubMed] [Google Scholar]
- 35. Te Dorsthorst DT, Groot Zwaaftink RB, Rijs AJ. et al. A colorimetric and spectrophotometric method for in vitro susceptibility testing of Aspergillus species against caspofungin. Med Mycol 2007; 45: 351–5. [DOI] [PubMed] [Google Scholar]
- 36. Sharma C, Chowdhary A.. Molecular bases of antifungal resistance in filamentous fungi. Int J Antimicrob Agents 2017; 50: 607–16. [DOI] [PubMed] [Google Scholar]
- 37. Gardiner RE, Souteropoulos P, Park S. et al. Characterization of Aspergillus fumigatus mutants with reduced susceptibility to caspofungin. Med Mycol 2005; 43: S299–305. [DOI] [PubMed] [Google Scholar]
Associated Data
This section collects any data citations, data availability statements, or supplementary materials included in this article.