

SUMMARY
Barley (Hordeum vulgare L.) leaf stripe is caused by the seed‐borne fungus Pyrenophora graminea. We investigated microscopically and molecularly the reaction of barley embryos to leaf stripe inoculation. In the resistant genotype NIL3876‐Rdg2a, fungal growth ceased at the scutellar node of the embryo, while in the susceptible near‐isogenic line (NIL) Mirco‐rdg2a fungal growth continued past the scutellar node and into the embryo. Pathogen‐challenged embryos of resistant and susceptible NILs showed different levels of UV autofluorescence and toluidine blue staining, indicating differential accumulation of phenolic compounds. Suppression subtractive hybridization and cDNA amplified fragment‐length polymorphism (AFLP) analyses of embryos identified P. graminea‐induced and P. graminea‐repressed barley genes. In addition, cDNA‐AFLP analysis identified six pathogenicity‐associated fungal genes expressed during barley infection but at low to undetectable levels during growth on artificial media. Microarrays representing the entire set of differentially expressed cDNA‐AFLP fragments and 100 barley homologues of previously described defence‐related genes were used to study gene expression changes at 7 and 14 days after inoculation in the resistant and susceptible NILs. A total of 171 significantly modulated barley genes were identified and assigned to four groups based on timing and genotype dependence of expression. Analysis of the changes in gene expression during the barley resistance response to leaf stripe suggests that the Rdg2a‐mediated response includes cell‐wall reinforcement, signal transduction, generation of reactive oxygen species, cell protection, jasmonate signalling and expression of plant effector genes. The identification of genes showing leaf stripe inoculation or resistance‐dependent expression sets the stage for further dissection of the resistance response of barley embryo cells to leaf stripe.
INTRODUCTION
Seeds are potentially a rich source of food for plant pathogens, and are particularly prone to attack during development and germination. In addition, transmission of a disease through the seed provides a direct route to infect the next generation. Accordingly, seeds are important sites of plant defence. Pathogen‐free seeds express genes otherwise known to be associated with pathogen infection in other tissues, which presumably contribute to pre‐formed or primed systems for defending the seed against pathogen attack. A transcriptome analysis of pathogen‐free barley embryos 12–37 days after flowering identified at particular developmental stages expression of pathogenesis‐related (PR) genes encoding enzymes from the shikimate pathway involved in the production of phytoalexins, and genes providing protection against reactive oxygen species (ROS) produced during pathogen defence (Nielsen et al., 2006). During the early stages of barley seed germination, proteins with antifungal activity are released from embryos and surrounding grain tissues (Leah et al., 1991; Swegle et al., 1992). Embryos of germinating grain were also found to express the H2O2‐generating germin‐like oxalate oxidase (Caliskan and Cuming, 1998) and a gene for lipoxigenase 1 known to be involved in the methyl‐jasmonate defence pathway (Rouster et al., 1998).
Changes in gene expression have been observed in maize embryos as a result of inoculation with Fusarium verticillioides (synonym, F. moniliforme). mRNAs encoding a proteinase inhibitor were found to accumulate in germinating maize embryos upon fungal infection (Cordero et al., 1994) and transcripts for a calcium‐dependent protein kinase and the Prm class of PR proteins were shown by in situ mRNA hybridization to accumulate in scutellum epithelial cells of maize embryos in response to fungal infection and elicitor treatment (Murillo et al., 2001). Proteome profiling identified 47 proteins in maize embryos showing altered steady‐state levels in response to challenge with F. verticillioides (Campo et al., 2004). The 36 up‐regulated proteins and 11 down‐regulated proteins included proteins involved in protection from oxidative stress, protein synthesis and stabilization, sugar metabolism and defence. These represent factors that potentially contribute to induced defences in the seed.
Leaf stripe, caused by the seed‐transmitted fungus Pyrenophora graminea, is a serious disease of barley which typically causes the most severe problems when low temperatures are experienced during sowing or when organic farming methods are used (Porta‐Puglia et al., 1986). The fungal mycelia survive in seeds between the parenchymatic cells of the pericarp. During germination, the growing mycelia penetrate the coleorhiza and, in susceptible genotypes, colonize the plant systemically starting from the root tip. Infection spreads into the young leaves, where it causes longitudinal dark brown stripes that form between the leaf veins. Spores produced on the infected leaves of susceptible plants during flowering spread to infect nearby heads. No secondary cycles are present in this disease. In incompatible interactions controlled by major resistance genes, the hyphae degenerate in the basal part of the coleorhiza (Platenkamp, 1976) and no stripe symptoms appear on the leaves of young or old plants (Bulgarelli et al., 2004). The fungus produces a host‐specific glycosyl compound (Pg toxin) which, when infiltrated into barley leaves of susceptible or resistant genotypes, induces the formation of lesions resembling those produced by infection with the pathogen (Haegi and Porta‐Puglia, 1995). Both polygenic partial resistance (Arru et al., 2002, 2003; Pecchioni et al., 1996) and strong monogenic race‐specific resistance (Giese et al., 1993) have been identified and mapped. The major resistance gene Rdg2a located distal on the short arm of chromosome 1 (7HS) (Tacconi et al., 2001) has been mapped to fine genetic resolution (Bulgarelli et al., 2004). Rdg2a confers complete resistance (immunity) to at least three Italian isolates of the pathogen, including the most virulent Italian isolate (Dg2). In young barley roots of resistant and susceptible genotypes differing for Rdg2a alleles, a number of PR genes were found to have altered expression in response to leaf stripe inoculation, encoding thaumatin‐like proteins, peroxidase, thionin and β‐(1,3)‐glucanases (Valèet al., 1994, 1998).
Despite the importance of seed‐borne diseases to agriculture and plant defence in general, relatively little research has been done on resistance responses to seed‐borne diseases. To date, no detailed gene expression analyses of barley tissues infected with P. graminea have been performed. In the present study we seek to gain insights into the relationships between the pathogen P. graminea and its host barley by conducting a detailed transcript analysis of embryos from resistant and susceptible (Rdg2a and rdg2a) near‐isogenic barley lines challenged with this pathogen. We complement this analysis with a cytological characterization of the infection process to identify specific tissues and developmental stages critical for host resistance. The results reveal gene classes and molecular mechanisms that may contribute to resistance of barley to this pathogen and perhaps to seed‐borne pathogens in general.
RESULTS
Microscopic analysis of barley embryo responses to leaf stripe colonization
For the microscopic analysis, we used the Dg2‐GUS isolate of P. graminea expressing β‐glucuronidase from a transgene (Aragona and Porta‐Puglia, 1999) to allow the progression of fungal infection to be followed by GUS staining. Seeds of the susceptible barley cv Mirco‐rdg2a and its near‐isogenic resistant BC line NIL3876‐Rdg2a were inoculated with Dg2‐GUS and embryo sections taken at 7, 11, 14, 18, 20, 24 and 27 days after inoculation. Embryos taken at 7, 14 and 18 dai are shown in Fig. 1. By 7 dai the leaf stripe pathogen was detected in GUS‐stained embryo sections examined under bright‐field microscopy, but only in the distal part of the provascular tissue of some embryos (upper right side of Fig. 1A). At 14 dai, the pathogen had only colonized a small part of the provascular tissue in the resistant NIL3876‐Rdg2a (Fig. 1G), while in the susceptible line Mirco‐rdg2a hyphal growth was more extensive and had begun to appear in the scutellum (Fig. 1J). Closer inspection confirmed the presence of blue‐stained hyphae growing intercellularly (Fig. 1V). In susceptible inoculated embryos, no necrosis (browning) was observed in host cells in regions where intercellular hyphae were present, indicating that the pathogen does not induce cell death in its host at this early stage of infection during compatible interactions. In NIL3876‐Rdg2a the fungus was still confined to the embryo‐distal side of the scutellum at 18 dai (Fig. 1M), and by 20, 24 and 27 dai colonization had progressed no further (data not shown). In contrast, Mirco‐rdg2a showed diffuse colonization of the scutellum at 18 dai (Fig. 1P) and dense colonization of the shoot apex beginning from 20 dai (data not shown). These results indicate that Rdg2a‐triggered resistance expressed at the base of the young shoot (at the scutellar node) and at the basal region of provascular tissue is responsible for preventing progression of fungal growth in to the growing shoot.
Figure 1.
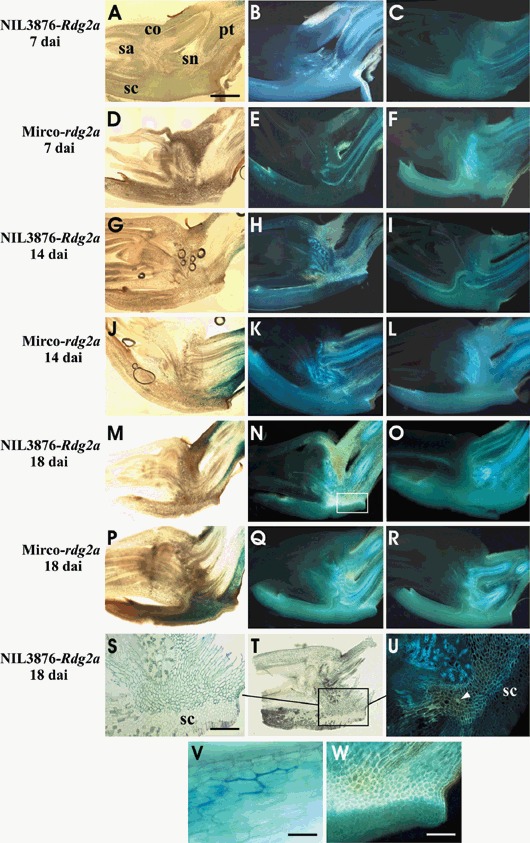
Barley embryo sections indicating P. graminea growth and defence reactions. The transgenic P. graminea Dg2‐GUS isolate containing the β‐glucuronidase transgene was used, allowing detection of fungal colonization by (blue) GUS staining. A, D, G, J, M and P are bright‐field views of GUS‐stained sections from NIL3876‐Rdg2a and from Mirco‐rdg2a at the time points of inoculation indicated. A close‐up view of the Mirco‐rdg2a embryo at 14 dai (V) shows blue GUS staining of fungal mycelium. The same sections were also observed by UV epifluorescence microscopy (B, E, H, K, N, and Q) for NIL3876‐Rdg2a and for Mirco‐rdg2a at the time points of inoculation indicated. C, F, I, L, O and R show epifluorescence views of sections of non‐inoculated control embryos of NIL3876‐Rdg2a and Mirco‐rdg2a harvested at the same time points as the inoculated samples. S and T show high‐ and low‐magnification views of an inoculated NIL3876‐Rdg2a embryo treated with Toluidine Blue O, which stains phenolic compounds blue‐green. U is the same view as in S except observed under UV light, illustrating co‐localization of pathogen‐induced UV autofluorescence with Toluidine Blue O staining. W is a magnified view of the boxed area in N, illustrating cell‐wall localization of autofluorescence. Scale bars represent 1 mm (A), 300 µm (S), 50 µm (V) and 200 µm (W). Arrowhead indicates a cell showing whole‐cell autofluorescence. co = coleoptile; pt = provascular tissue; sa = shoot apex; sc = scutellum; sn = scutellar node.
Autofluorescence in inoculated embryos at 7, 14 and 18 dai was observed mainly at the junction of the scutellum and the scutellar node, both in resistant NIL3876‐Rdg2a (Fig. 1B,H,N, respectively) and in susceptible Mirco‐rdg2a (Fig. 1E, K,Q, respectively), while the corresponding non‐inoculated controls essentially lacked this specific autofluorescence (Fig. 1C,F,I,L,O,R). Although by 7 dai few hyphae were detected in embryo sections by GUS staining (Fig. 1A), at this same time‐point NIL3876‐Rdg2a embryos reacted with autofluorescence (Fig. 1B), indicating that even a small amount of colonization could trigger a defence reaction in the resistant genotype. Autofluorescence at the junction of the scutellum and scutellar node occurred principally in the cell walls (Fig. 1W). Autofluorescence observed at other time points (20, 24 and 27 dai) was also restricted to the cell walls (data not shown). Whole‐cell autofluorescence, which is indicative of hypersensitive cell death (Görg et al., 1993; Hückelhoven et al., 1999), was observed only occasionally (i.e. arrowhead in Fig. 1U) in these embryo regions in response to the pathogen. Hence, resistance triggered by the Rdg2a resistance did not appear to involve a hypersensitive response (HR).
To compare the levels of autofluorescence in resistant and susceptible barley genotypes, we examined 48 embryos from each genotype at 14 and 18 dai (Fig. 2). Embryos were grouped in to three classes: (1) autofluorescence absent; (2) autofluorescence moderate and restricted to small parts of the provascular tissue and/or to the junction between the scutellar node and scutellum (i.e. Fig. 1Q); and (3) autofluorescence high throughout the scutellar node and frequently also in the basal part of the coleoptile (i.e. Fig. 1N). The results, summarized in Fig. 2, revealed a large proportion of NIL3876‐Rdg2a embryos with high autofluorescence levels (7.6 and 13.3 embryos at 14 and 18 dai, respectively), and only a few Mirco‐rdg2a embryos with high autofluorescence levels (one and three embryos at 14 and 18 dai, respectively). Hence, the degree of pathogen‐induced autofluorescence was positively correlated with host genotype resistance status.
Figure 2.
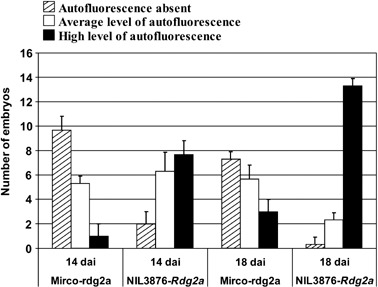
Quantification of UV autofluorescence of resistant and susceptible embryos inoculated with P. graminea isolate Dg2. Embryos of Mirco‐rdg2a and NIL3876‐Rdg2a were observed by epifluorescence microscopy at 14 and 18 dai and assigned to categories according to their level of autofluorescence. Shown are mean and SD obtained from three biological replicates comprising 16 embryos each per genotype and time point.
Pathogen‐induced cell‐wall UV autofluorescence indicates changes in cell‐wall composition, which can include accumulation of phenolic compounds (von Röpenhack et al., 1998). To investigate the nature of the fluorescent substances, embryo sections were treated with Toluidine Blue O, which stains phenolic compounds blue/green. Under bright‐field illumination, staining was visible at 18 dai in cell walls (Fig. 1T,S) in the same places where pathogen‐induced UV autofluorescence appeared (Fig. 1U), while no staining was observed in the adjacent non‐autofluorescing tissues. This result suggests that the pathogen‐induced UV autofluorescence derives from accumulated phenolic compounds.
Suppression subtractive hybridization and cDNA‐AFLP
Based on the results of the microscopic analysis, we reasoned that most of the gene expression changes crucial for resistance should take place in the embryo between 7 and 14 dai. At this last time point the pathogen had colonized the scutellar node region and part of the scutellum of the embryo in the susceptible Mirco‐rdg2a genotype (Fig. 1J) while defence reactions had restricted pathogen growth to the provascular tissue in the resistant NIL3876‐Rdg2a line (Fig. 1G). Therefore, to identify genes potentially contributing to resistance, a subtracted cDNA library was made by suppression subtractive hybridization (SSH) from embryos of the barley leaf stripe‐resistant line NIL3876‐Rdg2a at 7 and 14 dai, subtracting with mRNA from non‐inoculated control NIL3876‐Rdg2a embryos harvested at the corresponding time points. A total of 1800 randomly selected cDNA clones from the subtracted library were subjected to two rounds of reverse‐Northern analysis, providing evidence for greater expression in inoculated tissues for only 12 of the cDNA clones. Subsequent Northern analysis of the 12 clones indicated that only five of them were expressed at higher levels in inoculated tissues than non‐inoculated tissues (Fig. 3). These five genes are predicted to encode two enzymes from the sulfur reductive assimilation pathway (ATP sulfurilase and ferredoxin‐sulfite reductase), glutathione‐S‐transferase (GST), a cytochrome P450 and the H2O2‐generating enzyme oxalate oxidase. Their sequences, putative functions and BLAST search results are reported in supplementary Table S1.
Figure 3.
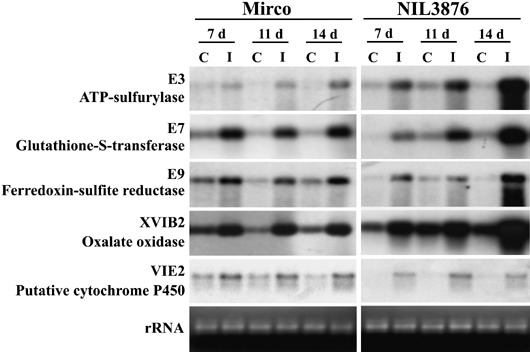
Northern blot analysis of genes induced in barley embryos by P. graminea inoculation. The genes used as probes had been identified by SSH and were those subsequently confirmed by Northern analysis to be induced. Blots contain mRNAs from inoculated (I) or non‐inoculated control (C) embryos of susceptible Mirco‐rdg2a or resistant NIL3876‐Rdg2a, harvested after 7, 11 or 14 days. Ethidium bromide‐stained gel images (bottom panels) show RNA loading.
Because SSH yielded so few differentially expressed genes, cDNA amplified fragment‐length polymorphism (AFLP) analysis was also utilized. This technique was used to examine genes expressed in Mirco‐rdg2a and NIL3876‐Rdg2a at 7, 11 and 14 dai. Selective amplification with 32 primer combinations revealed an average of 100–120 bands per primer combination, allowing detection of approximately 3500 cDNA fragments per RNA sample. Genes were identified which appeared to be induced in Mirco‐rdg2a and constitutive in NIL3876‐Rdg2a (Fig. 4A), induced in both resistant and susceptible genotypes (Fig. 4B), induced in the resistant genotype only (Fig. 4C), induced in the susceptible genotype only (Fig. 4D) and down‐regulated in the resistant genotype (Fig. 4E). For comparison, cDNA‐AFLP was also performed in parallel on RNA extracted from fungal mycelium grown on potato dextrose agar (PDA) to identify potentially fungal‐derived fragments, such as the fragment indicated in Fig. 4F. About 700 fragments showed differences in intensity between genotype/treatments. These were isolated from the gels, re‐amplified using non‐labelled primers identical to those employed for selective AFLP, subjected to direct sequencing in one direction and the sequences used to search the GenBank (nr) and EST (dbEST) databases with the BLASTN and BLASTX algorithms (Altschul et al., 1997). Of the 610 sequences obtained, 543 matched entries in the TIGR barley gene index database and 18 were found to be of fungal origin. Of the remaining 49 sequences, 26 showed significant homology with wheat, rice or Arabidopsis sequences while 23 showed no significant homology to any plant or fungal sequence in the databases. Of the 23 that showed no homology to any known plant or fungal sequences, four were later verified by the microarray analysis to be significantly up‐ or down‐regulated by inoculation in the resistant genotype only, indicating that at least these four sequences were unlikely to originate from contamination of the cDNA with plant genomic DNA and may represent novel pathogen‐induced barley genes.
Figure 4.
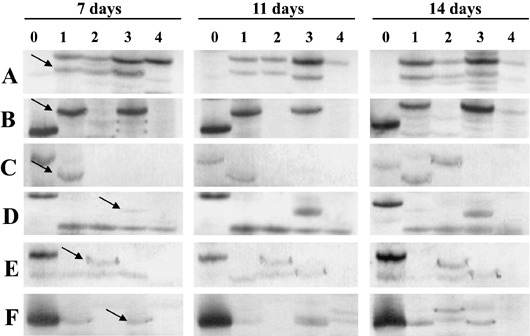
cDNA‐AFLP profiles illustrating expression patterns influenced by barley inoculation with P. graminea. Samples were collected from fungal mycelium grown on PDA (0) or from embryos at different time‐points after inoculation (7, 11 and 14 days), from NIL3876‐Rdg2a inoculated (1) or non inoculated (2) with leaf stripe or from Mirco‐rdg2a inoculated (3) or non‐inoculated (4) with leaf stripe. The six primer combinations (A, B, C, D, E and F) provide examples of different expression patterns as explained in the text. Arrows indicate cDNA‐AFLP bands eluted from the gels.
Micro‐array analysis
We made a 35–40 mer oligo‐array chip containing 2240 unique probes derived from 595 genes identified by cDNA‐AFLP as being putatively differentially regulated between treatments (15 of the 610 identified sequences were not suitable for probe design), in addition to barley homologues of 100 genes reported in the literature to have possible or demonstrated roles in pathogen defence in wheat, rice, sorghum and barley (e.g. genes encoding PR proteins, protein kinases, transcription factors, proteins involved in cell‐wall modifications, ROS‐generating enzymes and enzymes involved in cell detoxification/protection). Differentially expressed genes identified by SSH were not included in the chip as, by this time, these had been tested by Northern analysis.
Microarrays were probed with RNAs harvested from Mirco‐rdg2a or NIL3876‐Rdg2a embryos 7 or 14 days after inoculation with the leaf stripe isolate Dg2, or from embryos cultured for the same periods of time in the absence of the pathogen. Of the 695 genes represented on the microarray, 186 were identified as being significantly induced or repressed by inoculation for at least one of the four genotype/time point combinations, including 143 genes first identified through cDNA‐AFLP. Of the latter group, 11 genes were known from sequence database searches to be fungus‐derived (Fig. 7; supplementary Table S1), while four sequences had shown no homology to any wheat, rice or Arabidopsis sequence in the databases (supplementary Table S1). Hence, the microarray identified 171 pathogen‐responsive plant genes. Only 24% (143 out of 595) of the cDNA‐AFLP identified sequences were confirmed by the microarray analysis to be differentially regulated.
Figure 7.
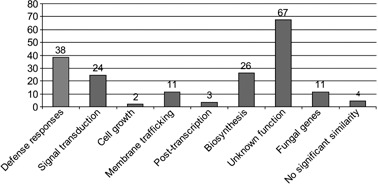
Functional characterization of significantly modulated genes. Genes showing significant (P < 0.05) induction/repression on microarrays based on three biological replicates and a ratio of at least 1.3 relative to untreated controls were assigned to functional classes based on homology (e value > 10e‐6) to characterized sequences in the GenBank (nr) and EST (dbEST) databases.
The numbers of genes induced or repressed for the various combinations of genotypes and time points are shown in Fig. 5. The greatest numbers of induced and repressed genes were observed at 14 dai, when NIL3876‐Rdg2a also showed more than twice as many induced/repressed genes as Mirco‐rdg2a. Because pathogen colonization was effectively halted in NIL3876‐Rdg2a by 14 dai (Fig. 1A), it is possible that some of the genes induced/repressed in NIL3876‐Rdg2a but not Mirco‐rdg2a between 7 and 14 dai may contribute to the resistance.
Figure 5.
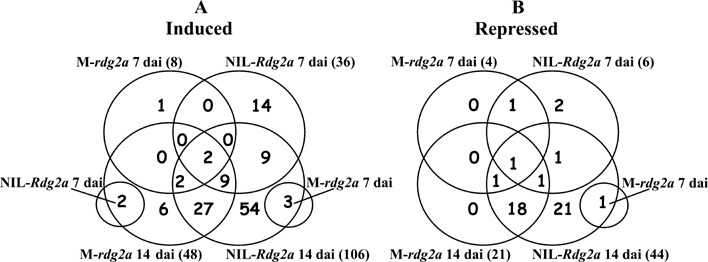
Venn diagrams showing numbers of barley genes shown by the microarray analysis to be significantly induced (A) or repressed (B) in barley embryos after inoculation with P. graminea for various combinations of genotypes and time‐points. The genotypes are Mirco‐rdg2a (M‐rdg2a) and NIL3876‐Rdg2a (NIL‐Rdg2a), and the time points are 7 and 14 dai. For each individual genotype/time‐point combination, the total number of induced/repressed genes is shown in parentheses.
Coordinated regulation and functional categorization
The 171 significantly regulated host genes were classified into four groups according to their relative expression levels in the two genotypes and at the two time points (Fig. 6) using the k‐means clustering algorithm (Kaufman and Rousseeuw, 1990; Slonim, 2002). The magnitudes of the expression level changes and functional annotations of the genes assigned to each of the clusters are provided in supplementary Table S2. Genes expressed differently in the resistant and susceptible genotypes (clusters 3 and 4) may include ones that contribute to the Rdg2a‐triggered resistance. Cluster 3 includes 30 genes that are expressed mostly at a higher level in NIL3876‐Rdg2a than Mirco‐rdg2a at 7 dai, and includes genes encoding a considerable number of proteins implicated to have roles in defence (e.g. encoding thaumatin‐like proteins, thionins and PR1a), cell‐wall reinforcement (peroxidase) and signal transduction (zinc finger protein). Cluster 4, comprising genes induced only in NIL3876‐Rdg2a, is the largest cluster (58 genes), and contains genes for proteins implicated to have roles related to stress responses (superoxide dismutase, catalase and cyclopropane fatty acid synthase), signalling (protein kinases, transcription factors, calmodulin and NB‐ARC genes) and biosynthesis of cell walls (syntaxin, callose synthase genes).
Figure 6.
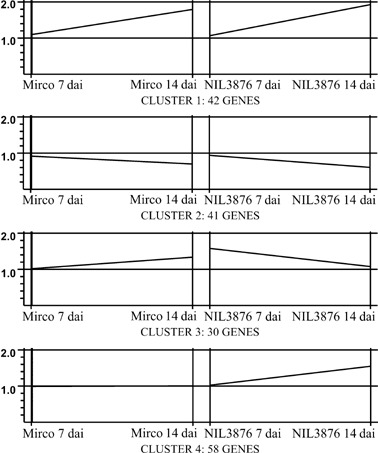
Cluster analysis. The 171 genes significantly regulated (> 1.3‐fold induced relative to untreated controls; P < 0.05) in barley embryos were classified into four different expression profiles. The x‐axes show the genotypes and the infection time‐points. The y‐axes show the normalized signal intensity ratios (global mean fold change) between infected and control samples.
The significantly modulated genes were also arranged into nine groups based on their putative functions (Fig. 7; supplementary Table S1). The largest group contained all the genes that could not be ascribed any function. The second largest group (38 genes) contained all the defence‐related genes.
Gene expression analysis by qRT PCR and RT PCR
Table 1 indicates genes selected as having a putative role in defence of barley embryos against the leaf stripe pathogen, based both on differential expression observed in this study and on homology to proteins implicated or shown in the literature to have roles in defence. Twenty‐five genes with representatives from each of the four defence‐related functional categories of Table 1 were chosen for analysis by quantitative real‐time PCR (qRT PCR). This was done both to test the validity of the microarray data interpretation and to characterize further the regulation of these genes during embryo responses to leaf stripe. Transcripts were quantified at 7 and 14 dai in the resistant and susceptible near‐isogenic lines (NILs) under control and inoculated conditions using a biological replicate independent from those used for microarray analysis. Four genes did not show differential expression and were eliminated from the list of the significantly regulated genes, whereas up‐regulation in response to leaf stripe infection was confirmed for the remaining 21 genes (Table 1). For six genes (CTC3:2, TGC45:1, AY177665, CAA7, AY246906 and CAT2), significant up‐regulation was detected by qRT‐PCR but not by microarray analysis, probably reflecting the higher sensitivity of qRT‐PCR for low‐abundance transcripts. The partial differences in the outcomes of the two techniques were expected. For example, qRT‐PCR and microarrays had previously been found to give similar results for only 55% (Czechowski et al., 2004) to 70–80% (Salzman et al., 2005; Svensson et al., 2006) of genes.
Table 1.
Expression ratios for selected barley genes significantly up‐regulated by P. graminea inoculation in barley embryos and having putative functions relating to defence.
| Clone | Expression ratios* | Homologue accession no. | Putative function | Cluster | |||||||
|---|---|---|---|---|---|---|---|---|---|---|---|
| Mirco | NIL3876 | ||||||||||
| 7 dai | 14 dai | 7 dai | 14 dai | ||||||||
| µa | qP | µa | qP | µa | qP | µa | qP | ||||
| Oxidative stress and cell protection pathways | |||||||||||
| TGA61:1 | ns | np | 1.30 | np | ns | np | 1.87 | np | AF250935 | Germin F | 1 |
| Y14203 | 1.49 | 1.78 | 2.47 | 2.12 | ns | 0.97 | 3.94 | 3.59 | Y14203 | Oxalate oxidase | 1 |
| CK210220 | ns | np | ns | np | ns | np | 1.36 | np | CK210220 | Catalase isozyme 2 | 4 |
| TGG15 | ns | np | ns | np | ns | np | 1.39 | np | U20778 | Catalase | 4 |
| CTC3:2 | ns | 0.58 | ns | 2.44 | 0.60 | 2.35 | 2.05 | 20.46 | Y17386 | In2.1 protein | 4 |
| CCA5 | ns | np | 2.17 | np | 1.73 | np | 2.00 | np | AB207242 | Glutathione‐S‐transferase | 1 |
| AJ238745 | ns | np | 1.39 | np | ns | np | 2.00 | np | AJ238745 | Glutathione peroxidase‐like | 1 |
| TAA17 | ns | 1.77 | 1.95 | 4.01 | ns | 1.49 | 1.91 | 3.94 | AF321869 | Cytochrome P450 | 1 |
| BF260610 | ns | np | ns | np | ns | np | 1.68 | np | BF260610 | Cu/Zn superoxide dismutase | 4 |
| AJ006358 | ns | np | 1.39 | np | 1.32 | np | 1.95 | np | AJ006358 | Ascorbate peroxidase | 1 |
| TTA10 | ns | 1.16 | ns | 0.87 | ns | 1.54 | 1.31 | 5.21 | ABA97030 | Cyclopropane fatty acid synthase | 4 |
| TGC45:1 | ns | 2.79 | 1.34 | 2.06 | ns | 1.40 | ns | 2.27 | CAD59574 | PDR‐like ABC transporter | 3 |
| TAA28 | ns | 1.56 | ns | 1.48 | ns | 1.16 | 1.40 | 3.03 | AAL79756 | Organic solute transporter | 4 |
| TTC12 | 1.48 | 2.47 | ns | 1.48 | ns | 1.17 | 2.00 | 3.68 | BAD73111 | NIC2 protein | 1 |
| Cell‐wall‐related genes and secondary metabolic pathways | |||||||||||
| CTC26:1 | ns | 1.80 | 1.36 | 4.04 | ns | 1.24 | 1.48 | 4.58 | BAD46391 | Cellulose synthase‐like protein | 1 |
| AY177665 | ns | 1.55 | ns | 1.25 | ns | 2.95 | 1.34 | 2.77 | AY177665 | Callose synthase‐like protein | 4 |
| CGT19 | ns | 0.78 | 1.37 | 2.06 | 1.32 | 1.86 | 1.36 | 2.92 | ABA96590 | Dirigent‐like protein | 1 |
| M73234 | ns | 0.84 | ns | 1.55 | 1.32 | 3.36 | ns | 1.12 | M73234 | Peroxidase BP1 (Prx5) | 3 |
| Z49145 | ns | 1.95 | ns | 1.87 | ns | 1.74 | 1.43 | 2.91 | Z49145 | Phenylalanine ammonia‐lyase | 4 |
| AY228552 | 1.32 | 1.73 | 1.31 | 2.91 | ns | 0.73 | 1.46 | 3.25 | AY228552 | Agmatine coumaroyltransferase | 1 |
| CAA7 | ns | 1.59 | ns | 2.52 | ns | 2.17 | 1.41 | 5.70 | BAD35400 | 2′‐hydroxyisoflavone reductase | 4 |
| AY246906 | ns | 0.57 | ns | 1.77 | ns | 2.51 | 1.32 | 2.35 | AY246906 | Ror2 syntaxin | 4 |
| CGG37 | 1.32 | 2.14 | ns | 1.69 | ns | 0.74 | 1.64 | 2.50 | BAD05209 | Clathrin coat assembly protein σ2 | 1 |
| Ubiquitination and jasmonate pathways | |||||||||||
| CCA11:2 | ns | 0.53 | ns | 1.67 | ns | 0.73 | 1.34 | 2.19 | NP_568264 | Ubiquitin‐protein ligase | 4 |
| L35931 | ns | 1.70 | ns | 1.87 | ns | 1.10 | 1.38 | 2.50 | L35931 | Lipoxygenase 1 (LoxA) gene | 4 |
| CAT2 | ns | 1.20 | 1.41 | 11.35 | ns | 2.14 | 1.39 | 2.99 | AAY26524 | 12‐oxo‐phytodienoic acid reduct. | 1 |
| Signal transduction | |||||||||||
| AY541586 | ns | 1.55 | ns | 1.71 | 1.32 | 2.69 | 1.42 | 2.26 | AY541586 | WRKY38 TF | 4 |
| BF264537 | ns | 0.92 | ns | 1.97 | ns | 1.12 | 1.83 | 2.56 | BF264537 | Calmodulin protein | 4 |
| AY465427 | ns | np | ns | np | ns | np | 1.48 | np | AY465427 | C3H2C3 RING‐finger protein | 4 |
| CAA23 | ns | np | ns | np | ns | np | 1.59 | np | AAR06369 | Calmodulin‐binding TF | 4 |
Expression ratios determined from the ratios of the expression level of a particular gene in inoculated tissues to the expression level of that gene in control (non‐inoculated) tissues. Microarray (µa) fold‐numbers for each gene indicate global mean fold‐inductions (relative to untreated controls) from all slides (three replications) in each genotype × time condition. Fold‐inductions for qRT PCR data (qP) indicate average 2ΔΔCt(ΔΔCT inoculated/ΔΔCT control) based on two to three replicates. cDNA templates for qRT PCR reactions were made from the same RNA samples used to generate the microarray cDNA probes. dai = days after inoculation, ns = microarray results not significantly differentially expressed, np = qRT PCR were not performed.
Eighteen cDNA‐AFLP‐derived sequences of likely fungal origin based on BLAST searches at NCBI and Cogeme (supplementary Table S1) were investigated by RT‐PCR. PCR primers were first tested for their ability to amplify from fungal (P. graminea isolate Dg2) and plant (Mirco‐rdg2a and NIL3876‐Rdg2a) genomic DNA templates. Primer pairs for eight of the genes could not be used because they failed to amplify any product or because they gave rise to multiple products. Primer pairs for the remaining ten genes amplified single products from the fungal DNA only, and were used for RT‐PCR on the fungus alone (control) and on embryos of Mirco‐rdg2a and NIL3876‐Rdg2a, at 7, 11 and 14 dai. The fungal gene CAT1 was expressed in both PDA‐ and plant‐grown fungus (Fig. 8) and was used for normalization, such that template used in all other RT‐PCRs contained equal amounts of CAT1 transcript (see Experimental procedures). The data were then interpreted with the condition that the CAT1 gene encoding ubiquitin was expressed at the same level in PDA‐grown fungus and fungus from all inoculated embryos, and that each RT‐PCR reaction therefore contained an equal amount of fungal RNA. The genes CAC37, CAA10 and CGG10 (supplementary Table S1) were expressed at roughly equal levels in PDA‐ and plant‐grown fungus (data not shown). One gene (TGG10:2) was expressed at higher levels in inoculated tissues than in fungus grown on PDA (Fig. 8). The remaining five fungal genes showed detectable expression only in the fungus from inoculated embryos, and expression of these genes did not appear to be influenced by host plant resistance genotype (Fig. 8).
Figure 8.
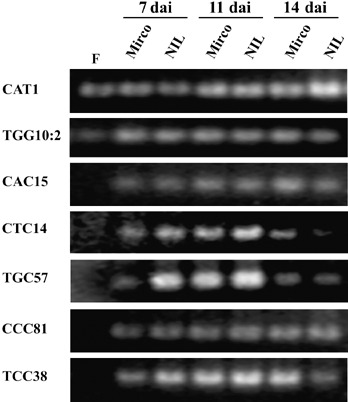
RT‐PCR expression analysis of fungal genes. mRNA was extracted from P. graminea Dg2 fungus that was grown on PDA medium (F) and from Mirco‐rdg2a and NIL3876‐Rdg2a barley embryos inoculated with Dg2 and collected at 7, 11 and 14 dai. The fungal gene CAT1 (ubiquitin) was used to adjust input template amounts so that templates used for each TGG10:2, CAC15, CTC14, TGC57, CCC81 and TCC38 RT‐PCR reaction contained equal amounts of CAT1 transcript (see Experimental procedures).
The function of most of the analysed fungal genes could be inferred by homology (supplementary Table S1). The four genes expressed at similar levels in PDA‐ and plant‐grown fungus showed homology with ubiquitin (CAT1 and CAA10) and with components of the vesicular transport machinery (CAC37 and CGG10). Genes expressed specifically during plant infection encode a xylanase (TGC57) and different dehydrogenases (mannitol, TCC38, or lactic, CTC14). One gene (TGG10:2) shares similarity to an Alternaria brassicicola sequence identified from a cDNA library made from a nitrogen‐starved culture. No putative functions could be ascribed to CAC15 and CCC81 expressed only during infection.
DISCUSSION
Microscopically visible host responses accompanying P. graminea growth arrest in the incompatible interaction
In this study we showed that the resistance of NIL3876‐Rdg2a conferred by the Rdg2a gene arrests P. graminea fungal growth at the scutellar node and basal region of provascular tissue of the barley embryo (Fig. 1B,H,N) and, by comparing pathogen colonization in resistant and susceptible near‐isogenic backgrounds, it was evident that this arrest was already effective by 14 dai. Therefore, defence responses driven by Rdg2a at the base of the young shoot are responsible for the resistance. The resistance was found to be temporally, spatially and genetically associated with UV autofluorescence and Toluidine Blue O staining in the host cells (1, 2), suggesting that the resistance involves accumulation of phenolic compounds. UV autofluorescence indicating the presence of phenolic compounds has been observed in pathogen‐challenged tissues throughout the cell wall (Mitsuda et al., 2005) and in appositions (papilla) deposited on the cell wall opposite challenge sites during expression of barley powdery mildew mlo resistance (von Röpenhack et al., 1998). Accumulation of phenolics has been observed in several plant pathogen interactions and different defence roles have been attributed to this class of chemical compounds, including reinforcement of cell walls by formation of phenolic polymers such as lignin (Nicholson and Hammerschmidt, 1992), and antimicrobial activity, as demonstrated for several phenolic compounds in rice (Padmavati et al., 1997) and for the phenolic polyamine conjugate p‐coumaroyl‐hydroxyagmatine in barley (von Röpenhack et al., 1998).
Whole‐cell accumulation of phenolic compounds (and autofluorescence) indicative of whole‐cell suicide, termed HR, is characteristic of many resistances conditioned by single dominant resistance genes in barley and other plants (Görg et al., 1993; Hückelhoven et al.,1999; Prats et al., 2005). Autofluorescence appearing during Rdg2a resistance was essentially confined to the cell walls (Fig. 1W) and was only occasionally observed throughout a whole cell (i.e. arrowhead in Fig. 1U), suggesting that the Rdg2a resistance does not involve HR. However, this conclusion must be treated with some caution, as the reliability of UV autofluorescence as a marker for HR in embryos is not known. Our attempts to test independently for HR using trypan blue staining was not successful. This stain normally also stains fungal structures, but no such staining of hyphae within the embryo slices was observed, even with vacuum infiltration, indicating that the stain did not penetrate the embryo tissues (not shown). As previously described (Platenkamp, 1976), P. graminea hyphae grow intercellularly (Fig. 1V) and degrade host cell walls to derive nutrients. Hydrolytic enzymes that may be used for this purpose include polygalacturonase, cellulase and pectin‐methylesterase (Hammouda, 1988), and also β‐1,4‐xylanase as indicated by the expression data obtained in the current study (TGC 57 in Fig. 8). However, our analysis revealed essentially no host cell death in susceptible embryos inoculated with P. graminea, indicating that the fungus does not induce cell death as part of its infection process at this early stage. Because the embryo is a small structure critical for plant reproduction, one could imagine that a resistance‐associated HR in the embryo, or a cell death in the embryo induced by the fungus during a compatible interaction, might be detrimental for long‐term survival of both the host and the pathogen.
Rdg2a controls expression of several defence processes
A strategy combining SSH, cDNA‐AFLP and microarray analysis of barley NILs resulted in the identification of five (SSH) and 171 (cDNA‐AFLP and microarray) host genes whose expression in barley embryos is up‐ or down‐regulated by leaf stripe inoculation. Early time‐points of inoculation (from 7 to 14 dai) were selected for this analysis as by these times, defence responses had already deployed in the resistant line NIL3876‐Rdg2a (Fig. 1B,H) and halted fungal colonization (Fig. 1G). Failure of the microarrays to confirm regulation of many of the genes identified by cDNA‐AFLP (only 24% of the cDNA‐AFLP sequences were confirmed as differentially expressed in the microarray analysis) was probably mainly due to the lower sensitivity of the microarray compared with the PCR‐based cDNA‐AFLP technique. For example, in another study such a limitation resulted in the failure of a microarray to confirm 35% of glucose‐regulated yeast genes identified by cDNA‐AFLP (Reijans et al., 2003). In part, the difference in outcomes of the two techniques may also derive from amplification artefacts in the cDNA‐AFLP.
In the microarray experiments, differences in expression were declared using a 1.3‐fold response cutoff and a further filter for significance to retain genes passing the 1.3‐fold response cutoff at P < 0.05, as indicated in the Experimental procedures. This low cutoff value was chosen because a number of defence‐related genes are already expressed in pathogen‐free germinating barley seeds and it is possible that pathogen infection increases expression of these genes only subtly. In addition, transcriptional responses may have been occurring in only a small portion of the tissue, as visible responses to the fungus were limited to only parts of the embryo (Fig. 1). These two factors could explain the low number of differentially expressed genes identified by SSH and the low fold‐change observed for several genes in the microarray and qRT PCR analyses. While the 1.3‐fold response cutoff may have resulted in some false positives, we reasoned that it was more important at this early phase of the investigation to employ a liberal cutoff to avoid overlooking genuinely regulated genes. Twenty‐one of 25 tested genes chosen for validation by qRT PCR were shown by qRT PCR to be genuinely differentially expressed, confirming the validity of our approach.
Microarray analysis identified 23 genes that were significantly pathogen‐induced in NIL3876‐Rdg2a but not in Mirco‐rdg2a at 7 dai (members of cluster 3 in supplementary Table S2; Fig. 5), plus an additional 54 genes that were induced in NIL3876‐Rdg2a but not in Mirco‐rdg2a by 14 dai (Fig. 5). Therefore, Rdg2a‐triggered processes influence the expression of about 77 (59%) of the 129 pathogen up‐regulated genes. Lack of induction of any one of these genes in the susceptible NIL may be due to lack of induction of a specific defence signalling pathway in the first place, and/or an indirect result of greater fungal growth and suppression of defence signalling by fungal‐derived effector molecules. Similarly, the 24 genes repressed only in the resistant NIL3876‐Rdg2a line either by 7 dai or 14 dai (Fig. 5; members of cluster 2 in supplementary Table S2) may also contribute to resistance. Among them we identified genes (xylose isomerase and arabinoxylan arabinofuranohydrolase, AXAH) whose products are involved in the hydrolysis of the complex heteroxylan polysaccharides of the primary cell wall. An extremely high level of AXAH transcript was observed in growing barley coleoptiles and at an early stage of grain development (Farrokhi et al., 2006). Down‐regulation of AXAH (and possibly also of xylose isomerase) during leaf stripe inoculation might alter the composition of the cell walls and make them more resistant to breakdown by the fungus.
Genes that are up‐ or down‐regulated by inoculation only in the resistant NIL3876‐Rdg2a are of particular interest because one or a combination of these genes may contribute to Rdg2a‐mediated leaf stripe resistance. Among the genes that were pathogen‐induced only in the resistant NIL3876‐Rdg2a line were ten genes for signalling factors such as protein kinases, calmodulin and transcription factors (Table 1 and clusters 3 and 4 in supplementary Table S2). Potentially, these could be involved in Rdg2a resistance signalling. Data based mainly on qRT PCR assays demonstrated P. graminea induction of the WRKY38 transcription factor gene, particularly at the earlier (7 dai) time point, and induction of the calmodulin protein gene (at 14 dai) in the resistant NIL3876‐Rdg2a line (Table 1). Rice and Arabidopsis homologues of barley WRKY38 affect levels of disease resistance against bacterial and fungal pathogens (Liu et al., 2006; Xu et al., 2006). Furthermore, Hv‐WRKY38 differs by only one amino acid from a gene called Hv‐WRKY1, a repressor of basal defence mechanisms and immune responses determined by some specific resistance genes to the obligate biotroph powdery mildew fungal pathogen Blumeria graminis (Shen et al., 2007). Additionally, at least some members of the WRKY gene family are known to regulate PR gene expression positively (Ulker and Somssich, 2004). Clearly, members of the WRKY family of transcription factors can play important roles in disease resistance, and the expression pattern of WRKY38 observed in this study raises the possibility that this WRKY member may contribute to Rdg2a‐specified P. graminea resistance in barley.
Microscopic observations indicated that cell‐wall modifications take place during the Rdg2a resistance response. Potentially, these and other undetected changes in the cell wall of inoculated tissues could constitute physical or chemical barriers to infection. Some genes found to be induced by P. graminea were consistent with activation of cell‐wall‐modifying processes. Induction of callose synthase and peroxidase genes was observed in NIL3876‐Rdg2a only (Table 1). Callose forms a major component of papillae deposited on the inner face of the cell wall in response to pathogen challenge (Schulze‐Lefert, 2004) and peroxidases are involved in lignification and cross‐linking of phenolics, proteins and carbohydrates (Moerschbacher, 1992). We also observed the induction of the Ror2 gene in NIL3876‐Rdg2a (Table 1). Ror2 (named PEN1 in Arabidopsis) helps prevent fungal penetration of the plant cell wall in certain forms of resistance to powdery mildew, and encodes a member of the syntaxin family of proteins normally involved in exocytotic vesicle trafficking (Assaad et al., 2004; Collins et al., 2003). It would be interesting to see if Ror2 also contributes to resistance to a non‐appressoria‐forming pathogen such as P. graminea and whether P. graminea triggers aggregation of ROR2 protein beneath challenge sites, as observed with powdery mildew (Bhat et al., 2005).
Also potentially related to cell‐wall reinforcement is the production of ROS. In the present study, genes encoding H2O2‐generating enzymes (germin F and oxalate oxidase) were found to be induced in both resistant and susceptible barley genotypes but at a higher level in the resistant NIL (Table 1). Northern analysis of uninoculated tissues also revealed a higher basal level of transcription of the oxalate oxidase gene in NIL3876‐Rdg2a than in Mirco‐rdg2a. This correlates with the observation that NIL3876‐Rdg2a embryos under control and inoculated conditions uniformly stain reddish‐brown upon histochemical staining of H2O2 with DAB (3,3′‐diaminobenzidine) (data not shown). Germin F and oxalate oxidase are both located in the cell wall (Cona et al., 2006; Zhou et al., 1998) and can contribute to a local generation of H2O2 for both cross‐linking of cell‐wall components and for defence signalling. Coincident with a possible higher production of H2O2 in NIL3876‐Rdg2a is also the higher expression level in NIL3876‐Rdg2a of some genes involved in ROS detoxification/protection such as ATP‐sulfurilase (Fig. 3), a GST‐like protein (In2.1), superoxide dismutase, ascorbate peroxidase and cyclopropane fatty acid synthase (Table 1). This last enzyme uses S‐adenosylmethionine to generate a methylene bridge across the double bonds in unsaturated fatty acids, contributing to the protection of membranes and other cellular components from damage by ROS (Anthony et al., 2005). Perhaps connected with a requirement for ROS detoxification is the higher induction in NIL3876‐Rdg2a of genes coding for an organic solute transporter and NIC2, a member of the multidrug and toxic compound extrusion (MATE) gene family (Table 1). These transporters can shuttle toxic compound out of the cell or transport glutathione‐S‐conjugates into the vacuole (Jasinski et al., 2003; Sanchez‐Fernandez et al., 2001). In barley embryos they may function in the export or vacuole‐sequestration of toxic secondary plant metabolites (such as compounds derived from oxidative stress) and/or pathogen toxins. One such toxin may be the host‐specific glycosyl toxin (Pg toxin) produced by leaf stripe fungus in infected barley tissues (Haegi and Porta‐Puglia, 1995).
In NIL3876‐Rdg2a we observed induction of genes encoding proteins involved in jasmonate (JA) synthesis, including lipoxigenase and 12‐oxo‐phytodienoic acid reductase (the latter was also induced in the susceptible NIL) (Table 1). Treatment with methyl jasmonate has been shown to increase expression of genes for phenylalanine ammonia lyase and peroxidase in barley leaves (Cona et al., 2006) and of an oxalate oxidase gene in barley roots (Hurkman and Tanaka, 1996). The first two genes were found to be induced only in NIL3876‐Rdg2a embryos in response to leaf stripe (Table 1), while a higher basal level of transcription of the oxalate oxidase gene was observed in NIL3876‐Rdg2a than in Mirco‐rdg2a (Fig. 3). The JA‐responsive genes in barley also include genes for thionins and lipoxygenase (Reinbothe et al., 1997; Rouster et al., 1997), which were found in our study to be induced only in NIL3876‐Rdg2a. Expression of the thionin gene only in the Rdg2a donor genotype, but not in a barley line susceptible to leaf stripe, had been demonstrated previously (Valèet al., 1994). JA‐mediated responses also involve the action of components of the ubiquitin/proteasome pathway of protein degradation and we observed in NIL3876‐Rdg2a induction of a ubiquitin protein ligase (Table 1). These data appear to indicate that Rdg2a resistance to P. graminea involves production of JA and triggering of JA‐dependent defence pathways involving production of ROS, thionins and expression of lipoxygenase. Triggering of JA‐related defences would be consistent with the fact that P. graminea is a nectrotroph for at least the latter part of its lifecycle (P. graminea growth in embryos is biotrophic and only becomes nectrotrophic at later stages of the infection cycle), and that JA‐dependent resistance tends to be triggered by, and is effective against, necrotrophic pathogens, at least in Arabidopsis (Hammond‐Kosack and Parker, 2003).
In conclusion, by using a genomics approach, we identified a wide variety of genes differentially expressed during the resistance response to leaf stripe. Further functional characterization of these genes will assist in determining molecular mechanisms and cellular processes involved in barley resistance to leaf stripe and perhaps defence pathways deployed by barley embryos in general.
Fungal genes expressed during infection
Fungal genes which were expressed specifically during plant colonization and not during growth on PDA media (Fig. 8) may be involved in pathogenicity. While demonstration of a role of individual genes in virulence determination would ultimately require targeted gene or transcript (silencing) disruption followed by virulence assays, we can presently speculate about the roles of some of these genes. The TGG10:2 P. graminea gene expressed at higher levels during infection is homologous to an Alternaria brassicicola sequence (GenBank accession number DN477023) derived from a cDNA library made from a nitrogen‐starved culture. It is tempting to speculate that fungi may experience nitrogen starvation conditions during growth on the host plant, and that such a gene may be required for growth under these conditions. Lactate (CTC14) and mannitol (TCC38) dehydrogenases are involved in general ‘metabolism’, as are many fungal genes classified as ‘pathogenicity genes’ (Baldwin et al., 2006). Perhaps up‐regulation of such genes during infection reflects differences in nutritional status between plant tissues and specific artificial growth media used (e.g. PDA). TGC57 encodes a xylanase. Xylanases are cell‐wall‐degrading enzymes that catalyse the initial breakdown of xylan by hydrolysing β‐1,4 bonds in the polymer; as xylans represent a large proportion of the hemicellulosic fraction of cereal cell‐wall matrices, these degrading enzymes are expected to be important offensive components of cereal pathogens (Beliën et al., 2006). Several cereal pathogens, including Septoria nodorum, Stagonospora nodorum and Claviceps purpurea, produce xylanases only during colonization of their host, supporting a role for microbial xylanases in pathogenicity. However, targeted disruption of individual xylanases from several pathogens has not revealed any dramatic effects on pathogenicity. These results probbaly reflect a genetic redundancy between the multiple xylanases present in microorganisms (Beliën et al., 2006; Idnurm and Howlett, 2001). P. graminea growth in embryos is biotrophic. Enzymatic functions may loosen the structure of the host cell walls enough to assist intercellular mycelium growth but not enough to cause host cell death. No putative function can be assigned to the genes CAC15 and CCC81 identified by cDNA‐AFLP. Further investigations will be required to investigate the possible roles of these and other genes in pathogenicity of P. graminea in barley.
EXPERIMENTAL PROCEDURES
Plant material, pathogen isolates and inoculation
Studies were performed with the leaf stripe susceptible barley cv. Mirco‐rdg2a and the corresponding resistant near‐isogenic line 3876 (NIL3876‐Rdg2a) containing the resistant allele of the gene Rdg2a conferring complete resistance to the isolate Dg2 of the pathogen. NIL3876‐Rdg2a was generated by crossing the resistant cv. Thibaut and the susceptible cv. Mirco, backcrossing six times to the susceptible parent, followed by two selfing generations, as described in Tacconi et al. (2001). NIL3876 was confirmed to be Rdg2a homozygous both by inoculation on progeny and by scoring with Rdg2a‐linked co‐dominant markers. The Dg2 isolate of leaf stripe (P. graminea) is the most virulent isolate in a previously described collection of monoconidial isolates (Gatti et al., 1992). For the microscopic analysis, infections were carried out with Dg2 genetically transformed with the β‐glucuronidase (GUS) gene (isolate Dg2‐GUS; Aragona and Porta‐Puglia, 1999). The expression of GUS was used to follow the colonization of the pathogen inside germinating barley seeds. The wild‐type and transformed P. graminea isolates were also grown on PDA (Liofilchem, Italy), in Petri dishes at 20 °C for 10 days in the dark. Seeds were surface‐sterilized in 70% ethanol for 30 s and then in 5% sodium hypochlorite for 20 min prior to inoculation using the ‘sandwich’ technique (Pecchioni et al., 1996). Uninoculated control seeds were germinated on sterile moist filter paper under the same environmental conditions in the absence of the fungus.
Microscopic analysis
For microscopic observations, barley seeds were inoculated with the Dg2‐GUS isolate and the embryos excised from the seeds at 7, 11, 14, 18, 20, 24, 27 dai. Embryo sections were taken by hand with a razor blade, mounted in water and examined with an Olympus BX51 microscope equipped with an epifluorescence filter (335‐ to 380‐nm excitation, > 420‐nm barrier filter). Images were recorded using an Olympus DP50 microscope digital camera system. Sections were then immersed in sodium hypochlorite (4% active chlorine) for 10 min, rinsed with water and stained for β‐glucuronidase activity as previously described (Aragona and Porta‐Puglia, 1999). After staining, sections were mounted in glycerine solution (15%, v/v, in water) and observed with bright‐field illumination. Phenolic compounds were stained by treating sections for 2 min with 0.05% (w/v) Toluidine Blue O in 0.1 m phosphate buffer at pH 7.2. Toluidine blue stains phenolic compounds green or bluish green (O’Brien et al., 1964). For the initial microscopic examination, in each of three repeat experiments at least four embryos were taken per genotype/treatment/timepoint, and at least four sections per embryo were examined. For autofluorescence quantification, three biological replicates of 16 embryos each, per genotype per timepoint, were used.
Identification of differentially expressed sequences by SSH and cDNA‐AFLP
For SSH analysis, poly(A)+‐enriched RNAs were isolated from frozen embryos as previously described (Baldi et al., 1999). mRNA was isolated from the leaf stripe‐resistant line NIL3876‐Rdg2a germinated under control or inoculation conditions for 7 and 14 days. cDNA synthesis and subtraction was performed with the PCR‐select cDNA subtraction kit (Clontech, Palo Alto, CA), as recommended by the manufacturer. A cDNA pool prepared from barley embryos inoculated for 7 and 14 days was used as ‘tester’ sample and that prepared from the corresponding control was used as ‘driver’ for the forward subtraction. Fragments remaining after subtraction were cloned into the T/A cloning vectors pGEM‐T and pGEM‐T Easy (Promega, Madison, WI) using blue‐white selection on LB agar plates containing Ampicillin/X‐gal/IPTG to identify insert containing colonies. A total of 1800 colonies were individually picked to 150‐µL volumes of ‘Freezing Broth’ (Sambrook et al., 1989) containing 100 µg/mL ampicillin dispensed in to a 96‐well culture plate. After incubation overnight at 37 °C, plates were stored at –80 °C. At the same time, clone inserts were individually amplified by colony‐PCR, separated on high‐density 1% agarose gels and blotted on to Nylon membranes (Millipore Immobilion, Millipore, Bedford, MA) using 0.4 n NaOH as transfer solution. Approximately 100 ng of 32P‐dCTP‐labelled cDNA representing each of the forward subtracted probe and the reverse subtracted probe was hybridized separately to the filters. Hybridization signal for individual insert fragments was quantified using a Typhoon 9210 phosphorimager (GE Healthcare, Chalfont St. Giles, UK) with a range of screen exposure times.
For cDNA‐AFLP‐TP analysis, mRNAs were isolated using an RNeasy Midi Kit and Oligotex mRNA Midi Kit (Qiagen, MD) from embryos of NIL3876‐Rdg2a and Mirco‐rdg2a grown under control or inoculation conditions for 7, 11 and 14 days. For each genotype/treatment/timepoint 150 embryos were used. These RNA samples were also those used to produce microarray probes. For cDNA‐AFLP, mRNA was also obtained from fungal mycelium grown on PDA under the same conditions as those used to inoculate seeds. Synthesis of double‐stranded cDNA and cDNA‐AFLP procedures were essentially as previously described (Polverari et al., 2003). A total of 32 selective amplifications were carried out with fluorescently labelled BstYI primers containing one extra selective nucleotide per primer. Scanning of the gel bands, excision of bands showing clear variation in intensity, re‐amplification and purification of PCR products were as described (Polverari et al., 2003).
Sequencing was carried out using the BigDye sequencing kit (Applied Biosystems, Foster City, CA) and an ABI PRISM 3130 Genetic Analyzer (Applied Biosystems), with an M13 universal primer (SSH clones) or the selective cDNA‐AFLP primer (cDNA‐AFLP fragments). Sequence homology searches against GenBank (nr) and EST (dbEST) databases were carried out using the BLASTN and BLASTX algorithms (Altschul et al., 1997) at the NCBI and TIGR sites and the Cogeme site (fungal sequences only).
Preparation of microarrays
Genes considered for representation on microarrays included those containing the 610 sequenced cDNA‐AFLP fragments showing genotype/treatment differences in band intensity, in addition to barley homologues of 100 genes reported in the literature to have possible or demonstrated roles in pathogen defence in wheat, rice, sorghum and barley. The barley Unigene set (at http://www.ncbi.nlm.nih.gov/UniGene/UGOrg.cgi?TAXID=4513) was used to identify extended transcript sequences upon which to design probes and to ensure probe specificity. Probes were designed using the Combimatrix Automated Probe‐Design Suite of programs (CombiMatrix Corp., WA) and were selected without secondary structure and with homogeneous melting temperature. For expressed sequence tags (ESTs) that did not cluster with the Unigene set, probes were designed on themselves with the Probe‐Design Suite. Only 695 of the 710 considered sequences were used for probe generation due to degeneracies, duplications and the presence of highly repetitive motifs in some of the sequences. For most of the 695 selected sequences, 3–4 probes were designed to different regions, and for the remaining sequences, 1–2 probes could be designed. A total of 2240 35–40 mer probes were synthesized onto each sector of a CustomArray 4 × 2000 microarray slide (CombiMatrix Corp., WA). In addition, negative control probes from viruses and bacteria (CombiMatrix Corp.), and the beta‐tubulin housekeeping gene (TC61079, TiGR Database) were included on the array.
Microarray probe labelling, hybridization and scanning
Hybridization probes were made from 24 mRNA preparations, representing three biological replicates each of Mirco‐rdg2a or NIL3876‐Rdg2a embryos, inoculated with the leaf stripe isolate Dg2 or left uninoculated, and harvested at 7 or 14 dai. Probes were made using the Amino Allyl MessageAmp™ II aRNA Amplification Kit (Ambion, USA). Three hundred nanograms of each poly(A) RNA sample was converted to cDNA using T7 oligo(dT) primers and amplification by in vitro transcription to synthesize amino allyl‐modified aRNA. The aRNA (10 µg per probe) was labelled with Cy‐5 dye and Cy5‐aRNA (2 µg per probe) and fragmented to lengths of 50–200 bases. The fragmented Cy5‐aRNA was mixed with hybridization buffer (6× SSPE, 0.05% Tween‐20, 20 mm EDTA, 25% deionized formamide, 0.1 mg/mL sheared salmon sperm DNA and 0.04% SDS) and hybridized to the Combimatrix 4 × 2000 Chip at 45 °C for 16 h. After hybridization, stringent washes were performed according to the manufacturer's instructions and the slides immediately coated with imaging solution prior to scanning using a ScanArray 4000XL scanner (Perkin‐Elmer, USA). Cy5 channel, PMT and laser power settings were kept constant for all hybridizations.
Microarray data extraction and analysis
Microarray data were extracted using Microarray Imager software (CombiMatrix Corp.). The background signal value for each probing of an array was defined as the median fluorescence intensity of all the negative control genes. This value was subtracted from the median fluorescence intensity of each other spot in order to obtain genuine hybridization signal intensities for the latter. Spots showing ‘low’ intensity values (< 1% of maximal intensity), dust particles and areas on the arrays showing irregular shapes or high background were excluded from the analysis. To avoid making conclusions on artefactual signals, only probes showing a signal intensity of at least 500 fluorescence units (Galbraith, 2003) for all biological replicates were considered for further analysis. Intra‐chip data normalization was performed using probes for the tubulin housekeeping gene, and inter‐chip data normalization was performed using the entire chip hybridization signal. Genes induced or suppressed by inoculation were identified using a paired Student's t‐test on the ratios inoculated/control samples. The raw P values were adjusted by the Bonferroni correction, which controls the family‐wise error rate (FWER). We considered as being significantly differentially expressed the genes with a Bonferroni P value of < 5% as described in Lurin et al. (2004) and a minimum signal difference of 1.3‐fold.
Expression profiles of differentially expressed genes were grouped by k‐means clustering using the GeneSpring program (Agilent Technologies, Redwood City, CA). The number of clusters was set to 4 and the minimal correlation coefficient (Pearson) was set to 0.7.
Gene expression analysis
For Northern blot analysis using SSH‐derived cDNA probes, poly‐A+‐enriched RNA was extracted from barley embryos of Mirco‐rdg2a and NIL3876‐Rdg2a at 7, 11 and 14 days after inoculation with P. graminea or from non‐inoculated control embryos collected at the same time points. Two micrograms of each mRNA sample was separated by electrophoresis in 1% agarose gels containing formaldehyde and blotted onto positively charged nylon membranes (Sigma, St Louis, MO) using 20× SSC transfer solution (Sambrook et al., 1989). Preparation of 32P‐dCTP labelled probes, pre‐hybridization, hybridization and washing conditions were performed using standard procedures (Sambrook et al., 1989). Autoradiography was performed using BioMax MS film (Kodak, New York).
qRT PCRs of plant genes were performed using mRNA samples obtained from a biological replicate independent of the three biological replicates used to make the microarray hybridization probes. First‐strand cDNA was prepared from 1 µg of mRNA using M‐MLV reverse transcriptase (Invitrogen, Carlsbad, CA), and quantified with a Qubit fluorometer (Invitrogen). qRT PCR was performed using duplicate or triplicate 25‐µL reactions in a real‐time PCR thermal cycler (7300 Real Time PCR System, Applied Biosystems). PCRs contained 1 ng of cDNA, 12.5 µL of Sybr Green qPCR Master Mix (Applied Biosystems) and forward and reverse primers (final concentration 0.2 µm each). The cycling conditions comprised 2 min at 50 °C and 10 min at 95 °C, followed by 40 cycles of 95 °C for 15 s and 60 °C for 60 s. Melting curve analysis was performed after PCR to evaluate the presence of non‐specifc PCR products and/or primer dimers. Primer pairs used for the analysis were designed using the software Vector NTI Suite 9 (InforMax, Invitrogen). If possible, full‐length cDNA sequences of genes were identified from the database and the 3′ used to design gene‐specific primers, but otherwise primers were designed directly on the cloned fragments (primers sequences, accession numbers used for primer design and annotation are provided in supplementary Table S3). The qRT PCR data were plotted as ΔRn fluorescence signal versus cycle number. The SDS 7300 absolute quantification software (Applied Biosystems) calculates the ΔRn using the equation  where
where  is the fluorescence signal of the product at any given time and
  is the fluorescence signal of the baseline emission during cycles 6–13. An arbitrary threshold was set at midpoint of the log ΔRn versus cycle number at which the ΔRn crosses the threshold (Ct). The Ct was used to calculate the fold changes (FC) in each infected sample with respect to the expression level detected in the corresponding sample under control conditions at same time point (baseline) with the following formula:
 |
(1) |
Normalization was carried out with the β‐actin constitutively expressed gene. Standard variation in all samples was lower than 10%.
To test expression of putative fungal genes, primer pairs were designed directly from the sequences of the cloned fragments. To verify origin, the primer pairs were first used to amplify from fungal and plant genomic DNA of Mirco‐rdg2a and NIL3876‐Rdg2a. mRNAs isolated from Mirco‐rdg2a and NIL3876‐Rdg2a embryos at 7, 11 and 14 dai were used for the analysis. For the control, a bulk of mRNAs obtained from mycelium grown on PDA only at the same stage and conditions of the three inoculation time points was used. Expression of the fungal CAT1 (ubiquitin) gene was used in an attempt to make the amount of fungal input RNA in all the RT‐PCR reactions the same (assuming equal CAT1 expression in PDA‐ and plant‐ grown fungus). RT‐PCRs were performed with 1 ng of PDA‐grown fungus mRNA template, while the amounts of inoculated embryo mRNA template were adjusted until the CAT1 amplification intensity appeared almost identical to that obtained from the PDA‐grown fungus (obtained using 40–100 ng of inoculated embryo mRNA). At this stage, the amount of CAT1 amplification from inoculated embryos collected at 11 and 14 dai was still a little greater than for the PDA and 7 dai samples (Fig. 8, CAT1). Therefore, the CAT1 products were quantified by densitometric scanning and the 11‐ and 14‐dai mRNA template amounts reduced further to achieve more accurate normalization in amplifications of the other gene fragments. First‐strand cDNA was made in 50‐µL volumes containing SuperScript II (Invitrogen, Carlsbad, CA), the manufacturer's pre‐mix, 0.2 µL Taq Gold (Applera Corp., Norwalk), 0.3 µm each primer (sequences provided in supplementary Table S3) and specific quantities of mRNA template. Thirty‐five cycles of amplification were carried out and amplification products were observed on 2% agarose gels.
Supporting information
Table S1 Functional classifications of differentially expressed barley genes.
Table S2 Cluster analysis results.
Table S3 Sequences of the primers utilized for qRT‐PCR analysis of the barley embryo induced genes and for the RT‐PCR of the fungal genes.
Please note: Blackwell Publishing are not responsible for the content or functionality of any supplementary materials supplied by the authors. Any queries (other than missing material) should be directed to the corresponding author for the article.
Supporting info item
Supporting info item
Supporting info item
ACKNOWLEDGEMENTS
This work was supported by the Italian national project ‘Proteine e geni per la protezione delle piante’ (‘PROTEO‐STRESS’) and ‘Nuove tecnologie molecolari per l’analisi del genoma di organismi di interesse agrario’ (‘AGRO‐NANOTECH’) funded by MiPAF. We thank A. Aprile, C. Campoli, L. Bernardo and C. Biselli for assistance in the Bioinformatic and Real Time PCR work. N.C.C. was supported by the ARC, GRDC and the South Australian government.
REFERENCES
- Altschul, S.F. , Madden, T.L. , Schäffer, A.A. , Zhang, J. , Zhang, Z. , Miller, W. and Lipmann, D.J. (1997) Gapped BLAST and PSI‐BLAST: a new generation of protein database search programs. Nucleic Acids Res. 25, 3389–3402. [DOI] [PMC free article] [PubMed] [Google Scholar]
- Anthony, J.R. , Warczak, K.L. and Donohue, T.J. (2005) A transcriptional response to singlet oxygen, a toxic byproduct of photosynthesis. Proc. Natl Acad. Sci. USA, 102, 6502–6507. [DOI] [PMC free article] [PubMed] [Google Scholar]
- Aragona, M. and Porta‐Puglia, A. (1999) Identification of resistance to leaf stripe using a Pyrenophora graminea transformant expressing β‐glucuronidase. Eur. J. Plant Pathol. 105, 831–834. [Google Scholar]
- Arru, L. , Francia, E. and Pecchioni, N. (2003) Isolate‐specific QTLs of resistance to leaf stripe (Pyrenophora graminea) in the Steptoe × Morex spring barley cross. Theor. Appl. Genet. 106, 668–675. [DOI] [PubMed] [Google Scholar]
- Arru, L. , Nicks, R.E. , Lindhout, P. , Valè, G. , Francia, E. and Pecchioni, N. (2002) Genomic regions determining resistance to leaf stripe (Pyrenophora graminea) in barley. Genome, 45, 460–466. [DOI] [PubMed] [Google Scholar]
- Assaad, F.R. , Qiu, J.L. , Youngs, H. , Ehrhardt, D. , Zimmerly, L. , Kalde, M. , Wanner, G. , Peck, S.C. , Edwards, H. , Ramonell, K. , Somerville, C. and Thordal‐Christensen, H. (2004) The PEN1 syntaxin defines a novel cellular compartment upon fungal attack and is required for the timely assembly of papillae. Mol. Biol. Cell, 15, 5118–5129. [DOI] [PMC free article] [PubMed] [Google Scholar]
- Baldi, P. , Grossi, M. , Pecchioni, N. , Valè, G. and Cattivelli, L. (1999) High expression level of a gene coding for a chloroplastic amino acid selective channel protein is correlated to cold acclimation in cereals. Plant Mol. Biol. 41, 233–243. [DOI] [PubMed] [Google Scholar]
- Baldwin, T. K. , Winnenburg, R. , Urban, M. , Rawlings, C. , Koehler, J. and Hammond‐Kosack, K. E. (2006) The pathogen–host interactions database (PHI‐base) provides insights into generic and novel themes of pathogenicity. Mol. Plant–Microbe Interact. 19, 1451–1462. [DOI] [PubMed] [Google Scholar]
- Beliën, T. , Van Campenhout, S. , Robben, J. and Volckaert, G. (2006) Microbial endoxylanases: effective weapons to breach the plant cell‐wall barrier or, rather, triggers of plant defense systems? Mol. Plant–Microbe Interact. 19, 1072–1081. [DOI] [PubMed] [Google Scholar]
- Bhat, R.A. , Miklis, M. , Schmelzer, E. , Schulze‐Lefert, P. and Panstruga, R. (2005) Recruitment and interaction dynamics of plant penetration resistance components in a plasma membrane microdomain. Proc. Natl Acad. Sci. USA, 102, 3135–3140. [DOI] [PMC free article] [PubMed] [Google Scholar]
- Bulgarelli, D. , Collins, N.C. , Tacconi, G. , Dall’Aglio, E. , Brueggeman, R. , Kleinhofs, A. , Stanca, A.M. and Valè, G. (2004) High‐resolution genetic mapping of the leaf stripe resistance gene Rdg2a in barley. Theor. Appl. Genet. 108, 1401–1408. [DOI] [PubMed] [Google Scholar]
- Caliskan, M. and Cuming, A.C. (1998) Spatial specificity of H2O2‐generating oxalate oxidase gene expression during wheat embryo germination. Plant J. 15, 165–171. [DOI] [PubMed] [Google Scholar]
- Campo, S. , Carrascal, M. , Coca, M. , Abiàn, J. and San Segundo, B. (2004) The defense response of germinating maize embryos against fungal infection: a proteomic approach. Proteomics, 4, 383–396. [DOI] [PubMed] [Google Scholar]
- Collins, N.C. , Thordal‐Christensen, H. , Lipka, V. , Bau, S. , Kombrink, E. , Qiu, J.L. , Hückelhoven, R. , Stein, M. , Freialdenhoven, A. , Somerville, C. and Schulze‐Lefert, P. (2003) SNARE‐protein‐mediated disease resistance at the plant cell wall. Nature, 425, 973–977. [DOI] [PubMed] [Google Scholar]
- Cona, A. , Rea, G. , Angelini, R. , Federico, R. and Tavladoraki, P. (2006) Functions of amine oxidases in plant development and defence. Trends Plant Sci. 11, 80–88. [DOI] [PubMed] [Google Scholar]
- Cordero, M.J. , Raventòs, D. and San Segundo, B. (1994) Expression of a maize proteinase inhibitor gene is induced in response to wounding and fungal infection: systemic wound‐response of a monocot gene. Plant J. 6, 141–150. [DOI] [PubMed] [Google Scholar]
- Czechowski, T. , Bari, R.P. , Stitt, M. , Scheible, W.‐R. and Udvardi, M.K. (2004) Real‐time RT‐PCR profiling of over 1400 Arabidopsis transcription factors: unprecedented sensitivity reveals novel root‐and shoot‐specific genes. Plant J. 38, 366–379. [DOI] [PubMed] [Google Scholar]
- Farrokhi, N. , Burton, R.A. , Brownfield, L. , Hrmova, M. , Wilson, S.H. , Bacic, A. and Fincher, G.B. (2006) Plant cell wall biosynthesis: genetic, biochemical and functional genomics approaches to the identification of key genes. Plant Biotech. J. 4, 145–167. [DOI] [PubMed] [Google Scholar]
- Galbraith, D.W. (2003) Global analysis of cell type‐specific gene expression. Comp. Funct. Genomics, 4, 208–215. [DOI] [PMC free article] [PubMed] [Google Scholar]
- Gatti, A. , Rizza, F. , Delogu, G. , Terzi, V. , Porta‐Puglia, A. and Vannacci, G. (1992) Physiological and biochemical variability in a population of Drechslera graminea . J. Genet. Breed. 46, 179–186. [Google Scholar]
- Giese, H. , Holm‐Jensen, A.G. , Jensen, H.P. and Jensen, J. (1993) Localization of the Laevigatum powdery mildew resistance gene to barley chromosome 2 by the use of RFLP markers. Theor. Appl. Genet. 85, 897–900. [DOI] [PubMed] [Google Scholar]
- Görg, R. , Hollricher, K. and Schulze‐Lefert, P. (1993) Functional analysis and RFLP‐mediated mapping of the Mlg resistance locus in barley. Plant J. 3, 857–866. [Google Scholar]
- Haegi, A. and Porta‐Puglia, A. (1995) Purification and partial characterization of a toxic compound produced by Pyrenophora graminea . Physiol. Mol. Plant Pathol. 46, 429–444. [Google Scholar]
- Hammond‐Kosack, K. and Parker, J.E. (2003) Deciphering plant–pathogen communication: fresh perspectives for molecular resistance breeding. Curr. Opin. Biotech. 14, 177–193. [DOI] [PubMed] [Google Scholar]
- Hammouda, A.M. (1988) Variability of Drechslera graminea, the causal fungus of leaf stripe of barley. Acta Phytopathol. Entomol. Hung. 23, 73–80. [Google Scholar]
- Hückelhoven, R. , Fodor, J. , Preis, C. and Kogel, K.‐H. (1999) Hypersensitive cell death and papilla formation in barley attacked by the powdery mildew fungus are associated with hydrogen peroxide but not with salicylic acid accumulation. Plant Physiol. 119, 1251–1260. [DOI] [PMC free article] [PubMed] [Google Scholar]
- Hurkman, W.J. and Tanaka, C.K. (1996) Effect of salt stress on germin gene expression in barley roots. Plant Physiol. 110, 971–977. [DOI] [PMC free article] [PubMed] [Google Scholar]
- Idnurm, A. and Howlett, B.J. (2001) Pathogenicity genes of phytopathogenic fungi. Mol. Plant Pathol. 2, 241–255. [DOI] [PubMed] [Google Scholar]
- Jasinski, M. , Ducos, E. , Martinoia, E. and Boutry, M. (2003) The ATPbinding cassette transporters: structure, function, and gene family comparison between rice and Arabidopsis . Plant Physiol. 131, 1169–1177. [DOI] [PMC free article] [PubMed] [Google Scholar]
- Kaufman, L. and Rousseeuw, P.J. (1990) Finding Groups in Data. An Introduction to Cluster Analysis. New York: John Wiley & Sons. [Google Scholar]
- Leah, R. , Tommerup, H. , Svendsen, I. and Mundy, J. (1991) Biochemical and molecular characterization of three barley seed proteins with antifungal properties. J. Biol. Chem. 266, 1564–1573. [PubMed] [Google Scholar]
- Liu, X. , Bai, X. , Wang, X. and Chu, C. (2006) OsWRKY71, a rice transcription factor, is involved in rice defense response. J. Plant Physiol. doi: 10.1016/j.jplph.2006.07.006. [DOI] [PubMed] [Google Scholar]
- Lurin, C. , Andrés, C. , Aubourg, S. , Bellaoui, M. , Bitton, F. , Bruyère, C. , Caboche, M. , Debast, C. , Gualberto, J. , Hoffman, B. , Lecharny, A. , Le Ret, M. , Martin‐Magniette, M.‐L. , Mireau, H. , Peeters, N. , Renou, J.‐P. , Szurek, B. , Taconnat, L. and Small, I. (2004) Genome wide analysis of Arabidopsis pentatricopeptide repeat prteins reveals their essential role in organelle biogenesis. Plant Cell, 16, 2089–2103. [DOI] [PMC free article] [PubMed] [Google Scholar]
- Mitsuda, N. , Seki, M. , Shinozaki, K. and Ohme‐Takagi, M. (2005) The NAC transcription factors NST1 and NST2 of Arabidopsis regulate secondary cell wall thickening and are required for anther dehiscence. Plant Cell, 17, 2993–3006. [DOI] [PMC free article] [PubMed] [Google Scholar]
- Moerschbacher, B.M. (1992) Plant peroxidases: involvement in response to pathogens In: Plant Peroxidases 1980–1990. Topics and Detailed Literature on Molecular, Biochemical, and Physiological Aspects (Penel C., Gaspar T. and Greppin H. eds), pp. 91–99. Geneva: University of Geneva. [Google Scholar]
- Murillo, I. , Jaeck, E. , Cordero, J. and San Segundo, B. (2001) Transcriptional activation of a maize calcium‐dependent protein kinase gene in response to fungal elicitors and infection. Plant Mol. Biol. 45, 145–158. [DOI] [PubMed] [Google Scholar]
- Nicholson, R.L. and Hammerschmidt, R. (1992) Phenolic compounds and their role in disease resistance. Annu. Rev. Phytopathol. 30, 369–389. [Google Scholar]
- Nielsen, M.E. , Lok, F. and Nielsen, H.B. (2006) Distinct developmental defense activations in barley embryos identified by transcriptome profiling. Plant Mol. Biol. 61, 589–601. [DOI] [PubMed] [Google Scholar]
- O’Brien, T.P. , Feder, N. , McCully, M.E. (1964) Polychromatic staining of plant cell walls by toluidine blue O. Protoplasma, 59, 367–373. [Google Scholar]
- Padmavati, M. , Sakthivel, N. , Thara, K.V. and Reddy, A.R. (1997) Differential sensitivity of rice pathogens to growth inhibition by flavonoids. Phytochemistry, 46, 499–502. [Google Scholar]
- Pecchioni, N. , Faccioli, P. , Toubia‐Rahme, H. , Valè, G. and Terzi, V. (1996) Quantitative resistance to barley leaf stripe (Pyrenophora graminea) is dominated by one major locus. Theor. Appl. Genet. 93, 97–101. [DOI] [PubMed] [Google Scholar]
- Platenkamp, R. (1976) Investigations on the infections pathway of Drechslera graminea in germinating barley. Royal Veterinary and Agricultural University, Yearbook, 49–64. [Google Scholar]
- Polverari, A. , Molesini, B. , Pezzotti, M. , Buonaurio, R. , Marte, M. and Delledonne, M. (2003) Nitric oxide‐mediated transcriptional changes in Arabidopsis thaliana . Mol. Plant–Microbe Interact. 16, 1094–1105. [DOI] [PubMed] [Google Scholar]
- Porta‐Puglia, A. , Delogu, G. and Vannacci, G. (1986) Pyrenophora graminea on winter barley seed: effect on disease incidence and yield losses. J. Phytopathol. 117, 26–33. [Google Scholar]
- Prats, E. , Mur, L.A. , Sanderson, R. and Carver, T.L.W. (2005) Nitric oxide contributes both to papilla‐based resistance and the hypersensitive response in barley attacked by Blumeria graminis f.sp. hordei . Mol. Plant Pathol. 6, 65–78. [DOI] [PubMed] [Google Scholar]
- Reijans, M. , Lascaris, R. , Oude Groeneger, A. , Wittenberg, A. , Wesselink, E. , Van Oeveren, J. , De Wit, E. , Boorsma, A. , Voetdijk, B. , Van Der Spek, H. , Alan Grivell, L. and Simons, G. (2003) Quantitative comparison of cDNA‐AFLP, microarrays, and GeneChip expression data in Saccharomyces cerevisiae . Genomics, 82, 606–618. [DOI] [PubMed] [Google Scholar]
- Reinbothe, C. , Parthier, B. and Reinbothe, S. (1997) Temporal pattern of jasmonate‐induced alterations in gene expression of barley leaves. Planta, 201, 281–287. [DOI] [PubMed] [Google Scholar]
- Von Röpenhack, E. , Parr, A. and Schulze‐Lefert, P. (1998) Structural analyses and dynamics of soluble and cell wall‐bound phenolics in a broad spectrum resistance to the powdery mildew fungus in barley. J. Biol. Chem. 273, 9013–9022. [DOI] [PubMed] [Google Scholar]
- Rouster, J. , Leah, R. , Mundy, J. and Cameron‐Mills, V. (1997) Identification of a methyl jasmonate‐responsive region in the promoter of a lipoxygenase 1 gene expressed in barley grain. Plant J. 11, 513–523. [DOI] [PubMed] [Google Scholar]
- Rouster, J. , Van Mechelen, J. and Cameron‐Mills, V. (1998) The untranslated leader sequence of the barley lipoxigenase 1 (Lox1) gene confers embryo‐specific expression. Plant J. 15, 435–440. [DOI] [PubMed] [Google Scholar]
- Salzman, R.A. , Brady, J.A. , Finlayson, S.A. , Buchanan, C.D. , Summer, E.J. , Sun, F. , Klein, R.R. , Pratt, L.H. , Cordonnier‐Pratt, M.‐M. and Mullet, J.E. (2005) Transcriptional profiling of Sorghum induced by methyl‐jasmonate, salicylic acid, and aminocyclopropane carboxylic acid reveals cooperative regulation and novel gene responses. Plant Physiol. 138, 352–368. [DOI] [PMC free article] [PubMed] [Google Scholar]
- Sambrook, J. , Fritsch, E.F. and Maniatis, T. (1989) Molecular Cloning: a Laboratory Manual, 2nd edn. New York: Cold Spring Harbor Laboratory Press. [Google Scholar]
- Sanchez‐Fernandez, R. , Davies, T.G. , Coleman, J.O. and Rea, P.A. (2001) The Arabidopsis thaliana ABC protein superfamily: a complete inventory. J. Biol. Chem. 276, 30231–30244. [DOI] [PubMed] [Google Scholar]
- Schulze‐Lefert, P. (2004) Knocking on the heaven's wall: pathogenesis of and resistance to biotrophic fungi at the cell wall. Curr. Opin. Plant Biol. 7, 377–383. [DOI] [PubMed] [Google Scholar]
- Shen, Q.‐H. , Saijo, Y. , Mauch, S. , Biskup, C. , Bieri, S. , Keller, B. , Seki, H. , Ulker, B. , Somssich, I.E. and Schulze‐Lefert, P. (2007) Nuclear activity of MLA immune receptors links isolate‐specific and basal disease‐resistance responses. Science, 315, 1098–1103. [DOI] [PubMed] [Google Scholar]
- Slonim, D.K. (2002) From patterns to pathways: gene expression data analysis comes of age. Nat. Genet. 32 (Suppl), 502–508. [DOI] [PubMed] [Google Scholar]
- Svensson, J.T. , Crosatti, C. , Campoli, C. , Bassi, R. , Stanca, A.M. , Close, T.J. and Cattivelli, L. (2006) Transcriptome analysis of cold acclimation in barley Albina and Xantha mutants. Plant Physiol. 141, 257–270. [DOI] [PMC free article] [PubMed] [Google Scholar]
- Swegle, M. , Kramer, K.J. and Muthukrishnan, S. (1992) Properties of barley seed chitinases and release of embryo‐associated isoforms durino early stages of imbibition. Plant Physiol. 99, 1009–1014. [DOI] [PMC free article] [PubMed] [Google Scholar]
- Tacconi, G. , Cattivelli, L. , Faccini, N. , Pecchioni, N. , Stanca, A.M. and Valè, G. (2001) Identification and mapping of a new leaf stripe resistance gene in barley (Hordeum vulgare L.). Theor. Appl. Genet. 102, 1286–1291. [Google Scholar]
- Ulker, B. and Somssich, I.E. (2004) WRKY transcription factors: from DNA binding towards biological function. Curr. Opin. Plant Biol. 7, 491–498. [DOI] [PubMed] [Google Scholar]
- Valè G., Aragona, M. , Torrigiani, E. , Cattivelli, L. , Montigiani, M. and Porta‐Puglia, A. (1998) Characterization of a hypovirulent insertional mutant of Pyrenophora graminea and analysis of the barley defence response after inoculation. Plant Pathol. 47, 657–664. [Google Scholar]
- Valè, G. , Torrigiani, E. , Gatti, A. , Delogu, G. , Porta‐Puglia, A. , Vannacci, G. and Cattivelli, L. (1994) Activation of genes in barley roots in response to infection by two Drechslera graminea isolates. Physiol. Mol. Plant Pathol. 44, 207–215. [Google Scholar]
- Xu, X. , Chen, C. , Fan, B. and Chen, Z. (2006) Physical and functional interactions between pathogen‐induced Arabidopsis WRKY18, WRKY40, and WRKY60 transcription factors. Plant Cell, 18, 1310–1326. [DOI] [PMC free article] [PubMed] [Google Scholar]
- Zhou, F. , Zhang, Z. , Gregersen, P.L. , Mikkelsen, J.D. , De Neergaard, E. , Collinge, D.B. and Thordal‐Christensen, H. (1998) Molecular characterization of the oxalate oxidase involved in the response of barley to powdery mildew fungus. Plant Physiol. 117, 33–41. [DOI] [PMC free article] [PubMed] [Google Scholar]
Associated Data
This section collects any data citations, data availability statements, or supplementary materials included in this article.
Supplementary Materials
Table S1 Functional classifications of differentially expressed barley genes.
Table S2 Cluster analysis results.
Table S3 Sequences of the primers utilized for qRT‐PCR analysis of the barley embryo induced genes and for the RT‐PCR of the fungal genes.
Please note: Blackwell Publishing are not responsible for the content or functionality of any supplementary materials supplied by the authors. Any queries (other than missing material) should be directed to the corresponding author for the article.
Supporting info item
Supporting info item
Supporting info item