

Abstract
Background
When sufficient maternal breast milk is not available, alternative forms of enteral nutrition for preterm or low birth weight (LBW) infants are donor breast milk or artificial formula. Donor breast milk may retain some of the non‐nutritive benefits of maternal breast milk for preterm or LBW infants. However, feeding with artificial formula may ensure more consistent delivery of greater amounts of nutrients. Uncertainty exists about the balance of risks and benefits of feeding formula versus donor breast milk for preterm or LBW infants.
Objectives
To determine the effect of feeding with formula compared with donor breast milk on growth and development in preterm or low birth weight (LBW) infants.
Search methods
We used the Cochrane Neonatal search strategy, including electronic searches of the Cochrane Central Register of Controlled Trials (CENTRAL; 2019, Issue 5), Ovid MEDLINE, Embase, and the Cumulative Index to Nursing and Allied Health Literature (3 May 2019), as well as conference proceedings, previous reviews, and clinical trials.
Selection criteria
Randomised or quasi‐randomised controlled trials (RCTs) comparing feeding with formula versus donor breast milk in preterm or LBW infants.
Data collection and analysis
Two review authors assessed trial eligibility and risk of bias and extracted data independently. We analysed treatment effects as described in the individual trials and reported risk ratios (RRs) and risk differences (RDs) for dichotomous data, and mean differences (MDs) for continuous data, with respective 95% confidence intervals (CIs). We used a fixed‐effect model in meta‐analyses and explored potential causes of heterogeneity in subgroup analyses. We assessed the certainty of evidence for the main comparison at the outcome level using GRADE methods.
Main results
Twelve trials with a total of 1879 infants fulfilled the inclusion criteria. Four trials compared standard term formula versus donor breast milk and eight compared nutrient‐enriched preterm formula versus donor breast milk. Only the five most recent trials used nutrient‐fortified donor breast milk. The trials contain various weaknesses in methodological quality, specifically concerns about allocation concealment in four trials and lack of blinding in most of the trials. Most of the included trials were funded by companies that made the study formula.
Formula‐fed infants had higher in‐hospital rates of weight gain (mean difference (MD) 2.51, 95% confidence interval (CI) 1.93 to 3.08 g/kg/day), linear growth (MD 1.21, 95% CI 0.77 to 1.65 mm/week) and head growth (MD 0.85, 95% CI 0.47 to 1.23 mm/week). These meta‐analyses contained high levels of heterogeneity. We did not find evidence of an effect on long‐term growth or neurodevelopment. Formula feeding increased the risk of necrotising enterocolitis (typical risk ratio (RR) 1.87, 95% CI 1.23 to 2.85; risk difference (RD) 0.03, 95% CI 0.01 to 0.05; number needed to treat for an additional harmful outcome (NNTH) 33, 95% CI 20 to 100; 9 studies, 1675 infants).
The GRADE certainty of evidence was moderate for rates of weight gain, linear growth, and head growth (downgraded for high levels of heterogeneity) and was moderate for neurodevelopmental disability, all‐cause mortality, and necrotising enterocolitis (downgraded for imprecision).
Authors' conclusions
In preterm and LBW infants, moderate‐certainty evidence indicates that feeding with formula compared with donor breast milk, either as a supplement to maternal expressed breast milk or as a sole diet, results in higher rates of weight gain, linear growth, and head growth and a higher risk of developing necrotising enterocolitis. The trial data do not show an effect on all‐cause mortality, or on long‐term growth or neurodevelopment.
Plain language summary
Formula versus donor breast milk for feeding preterm or low birth weight infants
Review question
When a mother's own breast milk is not available, does feeding preterm or low birth weight infants with formula rather than donor breast milk affect digestion, growth and the risk of severe bowel problems?
Background
Preterm infants often find artificial formula more difficult to digest than human milk, and concerns exist that formula could increase the risk of severe bowel problems. If preterm infants are fed with donor breast milk (when a mother's own breast milk is insufficient or unavailable), rather than an artificial formula, this might reduce the risk of these problems. Donor breast milk, however, is more expensive than many formulas, and may not contain sufficient amounts of key nutrients to ensure optimal growth for preterm or low birth weight infants. Given these concerns, we have reviewed all of the available evidence from clinical trials that compared formula versus donor breast milk for feeding preterm or low birth weight infants.
Study characteristics
We found 12 completed trials (involving 1871 infants). Most trials, particularly those trials conducted more recently, used reliable methods. Evidence is up to date as of 3 May 2019.
Key results
The combined analysis of data from these trials shows that feeding with formula increases rates of growth during the hospital stay, but is associated with a higher risk of developing the severe gut disorder called 'necrotising enterocolitis'. There is no evidence of an effect on survival or longer‐term growth and development.
Conclusions
The currently available evidence suggests that feeding preterm infants with artificial formula (rather than donor breast milk when mother's own breast milk is not available) is associated with faster rates of growth, but with a near‐doubling of the risk of developing necrotising enterocolitis. Further, larger trials could provide stronger and more precise evidence to help clinicians and families make informed choices about this issue. Currently, four such trials (involving more than 1100 infants) are ongoing internationally, and we plan to include the data from these trials in this review when these become available.
Summary of findings
Summary of findings for the main comparison. Formula versus donor breast milk for feeding preterm or low birth weight infants.
| Formula (term or preterm) compared to donor breast milk (unfortified or fortified) for feeding preterm or low birth weight infants | ||||||
| Patient or population: preterm or low birth weight infants Setting: neonatal unit Intervention: formula (term or preterm) Comparison: donor breast milk (unfortified of fortified) | ||||||
| Outcomes | Anticipated absolute effects* (95% CI) | Relative effect (95% CI) | № of participants (studies) | Certainty of the evidence (GRADE) | Comments | |
| Risk with donated breast milk (unfortified or fortified) | Risk with formula (term or preterm) | |||||
| Weight gain (g/kg/day) | ‐ | MD 2.51 higher (1.93 higher to 3.08 higher) | ‐ | 1028 (9 studies) | Moderatea | I² = 90% |
| Linear growth (crown‐heel length mm/week) | ‐ | MD 1.21 higher (0.77 higher to 1.65 higher) | ‐ | 820 (8 studies) | Moderatea | I² = 68% |
| Head growth (mm/week) | ‐ | MD 0.85 higher (0.47 higher to 1.23 higher) | ‐ | 894 (8 studies) | Moderatea | I² = 74% |
| Neurodevelopmental disability | Study population | RR 1.21 (0.62 to 2.35) | 400 (2 studies) | Moderateb | ||
| 73 per 1000 | 88 per 1000 (45 to 171) |
|||||
| All‐cause mortality | Study population | RR 1.1 (0.8 to 1.5) | 1527 (7 studies) | Moderateb | ||
| 86 per 1000 | 94 per 1000 (69 to 128) | |||||
| Necrotising enterocolitis | Study population | RR 1.87 (1.23 to 2.85) | 1675 (9 studies) | Moderateb | ||
| 36 per 1000 | 67 per 1000 (44 to 102) | |||||
| *The risk in the intervention group (and its 95% confidence interval) is based on the assumed risk in the comparison group and the relative effect of the intervention (and its 95% CI). | ||||||
| aDowngraded one level for heterogeneity. bDowngraded one level for imprecision. | ||||||
| CI: confidence interval; MD: mean difference; RR: risk ratio | ||||||
Background
Maternal breast milk is the recommended form of enteral nutrition for preterm or low birth weight (LBW) infants (AAP 2012). Breast milk contains non‐nutrient factors including immunoglobulins and lactoferrin that may promote intestinal adaptation and maturation, improve enteral feed tolerance, and protect against infective and inflammatory disorders (Agostoni 2010; Arslanoglu 2013).
When sufficient maternal breast milk is not available, the two common alternatives available for feeding preterm or LBW infants are artificial formula and donor breast milk (donated by other lactating women). These may be given either as the sole form of enteral feeding or as a supplement to maternal breast milk (Klingenberg 2012).
Description of the condition
Providing appropriate nutrition for preterm or LBW infants is a critical component of neonatal care. Early enteral nutrition strategies may have a substantial impact on clinically important outcomes, such as necrotising enterocolitis and invasive infection. These infectious and inflammatory complications may increase the risk of mortality and other morbidities and adversely affect long‐term growth and neurodevelopmental outcomes.
Description of the intervention
A variety of artificial formulas (usually adapted from cow's milk) are available. These vary in energy, protein and mineral content but can, broadly, be considered as:
standard 'term' formula, designed for term infants based on the composition of mature breast milk; the typical energy content is approximately between 67 kCal/100 mL to 70 kCal/100 mL;
nutrient‐enriched 'preterm' formula, designed to provide nutrient intakes to match intrauterine accretion rates (Tsang 1993); these are energy‐enriched (typically up to approximately 80 kCal/100 mL) and variably protein‐ and mineral‐enriched (Fewtrell 1999).
The comparison arm for the intervention is donor breast milk. Expressed breast milk from donor mothers, usually mothers who have delivered at term, generally has a lower content of energy and protein than term formula milk (Gross 1980; Gross 1981). The macronutrient content of donor breast milk is not compromised substantially by modern pasteurisation methods but levels of immunoactive components might be reduced (Peila 2016; Castro 2019). Donor human milk also varies with regard to fat, energy and protein content, depending upon the stage of lactation at which it is collected. Milk expressed from the donor's lactating breast usually has a higher energy and protein content than that collected from the contralateral breast ('drip' breast milk) (Lucas 1978).
How the intervention might work
There is concern that the nutritional requirements of preterm or LBW infants, who are born with relatively impoverished nutrient reserves and are subject to additional metabolic stresses compared with term infants, may not be fully met by enteral feeding with donor breast milk (Hay 1994; Schanler 1995). These deficiencies may have adverse consequences for growth and development. However, a major putative benefit of donor breast milk is that the delivery of immunoprotective and growth factors to the immature gut mucosa may prevent serious adverse outcomes, including necrotising enterocolitis and invasive infection (Lucas 1990; Beeby 1992).
Why it is important to do this review
Given the potential for the type of enteral nutrition to affect important outcomes for preterm or LBW infants, and since uncertainty exists about the balance between the putative benefits and harms, an attempt to detect, appraise and synthesise evidence from randomised controlled trials (RCTs) is merited.
Objectives
To determine the effect of feeding with formula compared with donor breast milk on growth and development in preterm or low birth weight (LBW) infants.
Methods
Criteria for considering studies for this review
Types of studies
Controlled trials using random or quasi‐random participant allocation.
Types of participants
Preterm (< 37 weeks' gestation at birth) or LBW (< 2500 g) infants.
Types of interventions
Enteral feeding (orally or via gastric or transpyloric feeing tubes) with formula versus donor breast milk. The allocated milk feed may have been a supplement to maternal breast milk or have formed the entire enteral intake (sole diet).
Trials in which parenteral (intravenous) nutritional support was available during the period of advancement of enteral feeds were acceptable provided that the groups received similar treatment other than the type of milk feed.
Types of outcome measures
Primary outcomes
Growth
Short‐term growth: time to regain birth weight and subsequent rates of weight gain, linear growth, head growth or skinfold thickness growth, up to six months post‐term.
Long‐term growth: weight, height or head circumference (and/or proportion of infants who remain below the 10th percentile for the index population's distribution), assessed at intervals from six months post‐term.
Neurodevelopment
Death or severe neurodevelopmental disability, defined as any one, or combination of the following: non‐ambulant cerebral palsy, developmental delay (developmental quotient < 70), auditory and visual impairment. We planned to analyse each component individually as well as part of the composite outcome.
Neurodevelopmental scores in children aged at least 12 months, measured using validated assessment tools.
Cognitive and educational outcomes in children aged more than five years old.
Secondary outcomes
All‐cause mortality, during the neonatal period and prior to hospital discharge.
-
Necrotising enterocolitis, confirmed at surgery or autopsy or diagnosed by at least two of the following clinical features.
Abdominal radiograph showing pneumatosis intestinalis or gas in the portal venous system or free air in the abdomen.
Abdominal distension with abdominal radiograph with gaseous distension or frothy appearance of bowel lumen (or both).
Blood in stool.
Lethargy, hypotonia or apnoea (or combination of these).
Days after birth to establish full enteral feeding (independently of parenteral nutrition).
Feeding intolerance, defined as a requirement to cease enteral feeds and commence parenteral nutrition.
Incidence of invasive infection, as determined by culture of bacteria or fungus from blood, cerebrospinal fluid, urine or from a normally sterile body space.
Search methods for identification of studies
We used the standard search strategy of Cochrane Neonatal (neonatal.cochrane.org).
Electronic searches
We searched the Cochrane Central Register of Controlled Trials (CENTRAL; 2019, Issue 5), Ovid MEDLINE (1946 to 3 May 2019), OVID Embase (1974 to 3 May 2019), OVID Maternity & Infant Care Database (1971 to 3 May 2019), and the Cumulative Index to Nursing and Allied Health Literature (1982 to 3 May 2019) using a combination of text words and MeSH terms described in Appendix 1. We limited the search outputs with the relevant search filters for clinical trials as recommended in the Cochrane Handbook for Systematic Reviews of Interventions (Higgins 2011). We did not apply any language restrictions.
We searched ClinicalTrials.gov and the World Health Organization's International Trials Registry and Platform (www.who.int/ictrp/en/), for completed or ongoing trials.
Searching other resources
We examined reference lists in previous reviews and included studies. We searched the proceedings of the annual meetings of the Pediatric Academic Societies (1993 to 2019), the European Society for Paediatric Research (1995 to 2019), the Royal College of Paediatrics and Child Health (2000 to 2019), and the Perinatal Society of Australia and New Zealand (2000 to 2019). Trials reported only as abstracts were eligible if sufficient information was available from the report, or from contact with the authors, to fulfil the inclusion criteria.
Data collection and analysis
We used the standard methods of Cochrane Neonatal.
Selection of studies
We screened the title and abstract of all studies identified by the above search strategy and two review authors (NDE, WM) independently assessed the full articles for all potentially relevant trials. We excluded those studies that did not meet all of the inclusion criteria and we stated the reason for exclusion. We discussed any disagreements until consensus was achieved. We illustrated the screening and selection outcomes in a flowchart (PRISMA 2009).
Data extraction and management
Two review authors (NDE, WM) extracted data independently using a data collection form to aid extraction of information on design, methodology, participants, interventions, outcomes and treatment effects from each included study. We discussed any disagreements until we reached a consensus. If data from the trial reports were insufficient, we contacted the trialists for further information.
Assessment of risk of bias in included studies
Two review authors (NDE, WM) independently assessed the risk of bias (low, high, or unclear) of all included trials using the Cochrane 'Risk of bias' tool for the following domains (Higgins 2011).
Sequence generation (selection bias).
Allocation concealment (selection bias).
Blinding of participants and personnel (performance bias).
Blinding of outcome assessment (detection bias).
Incomplete outcome data (attrition bias).
Selective reporting (reporting bias).
Any other bias.
We resolved any disagreements by discussion or by including a third review author (MQ). See Appendix 2 for a detailed description of risk of bias for each domain.
Measures of treatment effect
We calculated risk ratios (RRs) and risk differences (RDs) for dichotomous data and mean differences (MDs) for continuous data, with respective 95% confidence intervals (CIs). When it was deemed appropriate to combine two or more study arms, we obtained the treatment effects from the combined data using the methods described in the Cochrane Handbook for Systematic Reviews of Interventions (Higgins 2011). We determined the number needed to treat for an additional beneficial outcome (NNTB) or additional harmful outcome (NNTH) for a statistically significant difference in the RD.
Unit of analysis issues
The unit of analysis was the participating infant in individually randomised trials and the neonatal unit (or subunit) for cluster‐RCTs. For cluster‐RCTs, we planned to undertake analyses at the level of the individual while accounting for the clustering in the data using the methods recommended in the Cochrane Handbook for Systematic Reviews of Interventions (Higgins 2011)
Dealing with missing data
Where data were missing, and could not be derived as described, we approached the analysis of missing data as follows.
We contacted the original study investigators to request the missing data.
Where possible, we imputed missing standard deviations (SDs) using the coefficient of variation or calculated the SD from other statistics including standard errors, CIs, t values and P values.
If we assumed the data to be missing at random, we analysed the data without imputing any missing values.
If we could not make this assumption, then we planned to impute the missing outcomes with replacement values, assuming all to have a poor outcome. We planned sensitivity analyses to assess any changes in the direction or magnitude of effect resulting from data imputation.
Assessment of heterogeneity
Two review authors (NDE, WM) assessed clinical heterogeneity, with a meta‐analysis conducted only when both agreed that study participants, interventions and outcomes were sufficiently similar.
We examined the treatment effects of individual trials and heterogeneity between trial results by inspecting the forest plots. We calculated the I² statistic for each analysis to quantify inconsistency across studies and described the percentage of variability in effect estimates that may be due to heterogeneity rather than to sampling error. If we detected moderate or high heterogeneity (I² > 50%), we would explore the possible causes (for example, differences in study design, participants, interventions or completeness of outcome assessments).
Assessment of reporting biases
If more than 10 trials were included in a meta‐analysis, we planned to examine a funnel plot for asymmetry.
Data synthesis
We used fixed‐effect models for meta‐analysis (as per Cochrane Neonatal recommendations). Where moderate or high heterogeneity existed, we planned to examine the potential causes in subgroup and sensitivity analyses.
Certainty of evidence
We assessed the certainty of evidence for the main comparisons at the outcomes level using the GRADE approach to assess the certainty of evidence for the following outcomes: growth, neurodevelopmental disability, all‐cause mortality, and necrotising enterocolitis (Schünemann 2013; see Appendix 3).
Two review authors (NDE, WM) independently assessed the certainty of the evidence for each of these outcomes. We considered evidence from RCTs as high certainty but downgraded one level for serious (or two levels for very serious) limitations based upon the following: design (risk of bias), consistency across studies, directness of the evidence, precision of estimates and presence of publication bias. We used the Guideline Development Tool to create a 'Summary of findings' table to report the certainty of the evidence (GRADEpro GDT 2015).
Subgroup analysis and investigation of heterogeneity
We planned the following subgroup analyses of trials to compare:
formula versus donor breast milk given as (i) a sole diet or (ii) a supplement to maternal expressed breast milk;
formula versus donor breast milk that is (i) unfortified or (ii) nutrient‐fortified (defined as supplementation with more than one of the following components: protein, fat, carbohydrate or minerals).
Results
Description of studies
Results of the search
See: Figure 1.
1.
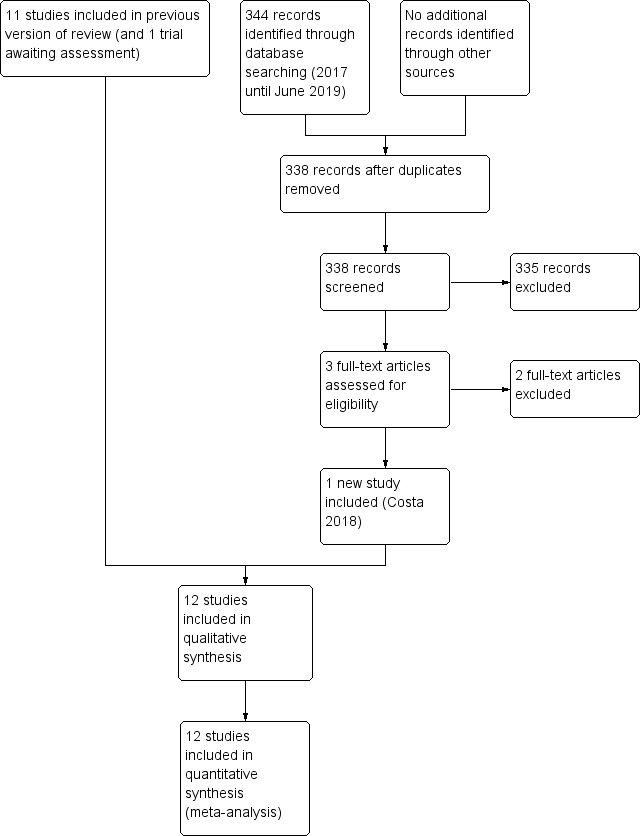
Study flow diagram: 2019 review update.
We included one new trial (12 trials in total) (Costa 2018). We excluded two new full‐text reports (Brandstetter 2018; Castellano 2019) (14 reports in total).
One report is awaiting assessment (Perez 2015).
We identified four ongoing trials (See: Characteristics of ongoing studies).
Included studies
Twelve trials fulfilled the review eligibility criteria (Raiha 1976; Davies 1977; Schultz 1980; Gross 1983; Tyson 1983; Lucas 1984a; Lucas 1984b; Schanler 2005; Cristofalo 2013; Corpeleijn 2016; O'Connor 2016; Costa 2018).
All trials were undertaken in neonatal units in Europe and North America. Seven of the trials were conducted more than 30 years ago (Raiha 1976; Davies 1977; Schultz 1980; Gross 1983; Tyson 1983; Lucas 1984a; Lucas 1984b). Five trials have been undertaken since the year 2000 (Schanler 2005; Cristofalo 2013; Corpeleijn 2016; O'Connor 2016; Costa 2018). For further details see Characteristics of included studies.
Participants
A total of 1879 infants took part in the included trials. Most participants were clinically stable infants of gestational age at birth < 32 weeks' or birth weight < 1800 g. Most trials excluded infants who were small for gestational age at birth and infants with congenital anomalies or gastrointestinal or neurological problems.
Interventions
The trials varied according to type of formula (term or preterm), and whether the intervention was a sole diet or a supplement to mother's own milk.
Four trials compared feeding with term formula versus unfortified donor breast milk (Raiha 1976; Davies 1977; Schultz 1980; Gross 1983). In all of these trials, term formula or donor breast milk was the sole diet.
Eight trials compared feeding with preterm formula versus donor breast milk, either as the sole diet (Tyson 1983; Lucas 1984a; Cristofalo 2013), or as a supplement to maternal breast milk (Lucas 1984b; Schanler 2005; Corpeleijn 2016; O'Connor 2016; Costa 2018).
The trials varied according to type of donor breast milk, and whether donor breast milk feeds were nutrient‐fortified or not.
Five trials used donor breast milk collected from mothers who had delivered an infant at term (Raiha 1976; Davies 1977; Schultz 1980; Lucas 1984a; Lucas 1984b). Two of these trials used 'drip' breast milk (Lucas 1984a; Lucas 1984b). One trial used preterm donor breast milk (Schanler 2005), one trial used both term and preterm donor milk (Gross 1983), and five trials did not specify the type of donor breast milk (Tyson 1983; Cristofalo 2013; Corpeleijn 2016; O'Connor 2016; Costa 2018).
In all trials except Tyson 1983, the donor breast milk was pasteurised.
Four trials used donor breast milk with multinutrient fortifier added empirically or as indicated (Schanler 2005; Cristofalo 2013; Corpeleijn 2016; O'Connor 2016). Cristofalo 2013 used human milk‐based fortifier, and the other trials used cow's milk‐based fortifier.
In general, feeds were allocated for several weeks, or until participating infants reached a specified body weight (generally > 2 kg). One trial used the allocated feed for only the first 10 days after birth (or earlier if the infant was transferred from the recruiting centre). Infants then received preterm formula if own mother's milk was insufficient (Corpeleijn 2016).
Outcomes
The most commonly reported outcomes were growth parameters during the study period or until hospital discharge. Most reports gave information on adverse outcomes, including feeding intolerance and the incidence of necrotising enterocolitis. Four trials reported growth or neurodevelopmental outcomes assessed during and after infancy following hospital discharge (Gross 1983; Lucas 1984a; Lucas 1984b; O'Connor 2016).
Excluded studies
We excluded 14 studies following full‐text review (Narayanan 1982; Svenningsen 1982; Jarvenpaa 1983; Cooper 1984; Putet 1984; O'Connor 2003; Sullivan 2010; Hair 2014; Colaizy 2015; Marseglia 2015; Perrella 2015; Tewari 2018; Brandstetter 2018; Castellano 2019). The reasons for exclusion are described in the table Characteristics of excluded studies.
Studies awaiting classification
One report is awaiting translation and assessment (Perez 2015).
Ongoing studies
We identified four ongoing trials (see: Characteristics of ongoing studies).
Risk of bias in included studies
Quality assessments are detailed in the table Characteristics of included studies and are illustrated in Figure 2.
2.
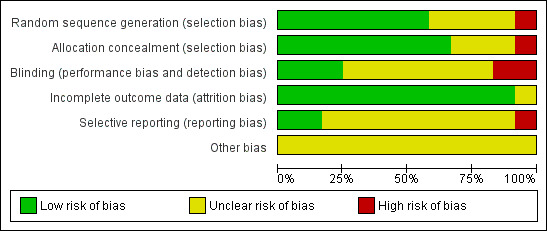
Risk of bias graph: review authors' judgements about each risk of bias item presented as percentages across all included studies.
Allocation
Six trials reported adequate allocation concealment methods (sealed, numbered envelopes; central randomisation in blocks) and we assessed these trials as being at low risk of bias (Lucas 1984a; Lucas 1984b; Tyson 1983; Corpeleijn 2016; O'Connor 2016; Costa 2018). The other trials did not report methods of allocation concealment. One quasi‐RCT randomly allocated participants to one of the four formula arms, and allocated every fifth infant to the donor breast milk arm (Raiha 1976); we assessed this trial as being at high risk of selection bias.
Blinding
Four trials blinded the staff or caregivers to the treatments and we assessed them as being at low risk of bias (Schanler 2005; Cristofalo 2013; Corpeleijn 2016; O'Connor 2016). Three trials did not mask the staff and we assessed them as being at high risk of bias (Tyson 1983; Lucas 1984a; Lucas 1984b). The other trial reports did not state whether staff were masked.
Most of the trials did not specify whether the outcome assessors were masked to the feeding arms (unclear risk of bias). In four trials staff were masked to the post‐hospital discharge outcomes and we assessed them as being at low risk of bias (Lucas 1984a; Lucas 1984b; Corpeleijn 2016; O'Connor 2016).
Incomplete outcome data
Most trials reported complete follow‐up for the in‐hospital outcomes assessment and we assessed them as being at low risk of attrition bias. In three trials, infants who developed complications (5% to 10% of the total enrolled) were withdrawn from the study and therefore the in‐hospital growth data for these infants were not presented (Raiha 1976; Gross 1983; Tyson 1983). In the trials that reported data for long‐term outcomes, more than 80% of participants were assessed (low risk of bias) (Gross 1983; Lucas 1984a; Lucas 1984b; O'Connor 2016).
Selective reporting
We assessed Corpeleijn 2016 as being at high risk of reporting bias. Corpeleijn 2016 did not report protocol‐specified outcome data for short‐term growth rate, bone density, Bayley Scores of Infant Development III (at 2 years of age), and growth rate at two years of age. Most of the other trials were at unclear risk of bias as protocols were not available for assessment.
Effects of interventions
See: Table 1
Primary outcomes
Growth
Time to regain birth weight
Meta‐analysis of data from Raiha 1976, Gross 1983 and Costa 2018 showed that the formula‐fed group regained birth weight more quickly (mean difference (MD) ‐3.08 days, 95% confidence interval (CI) ‐4.38 to ‐1.77; I² = 37%; 3 trials, 236 participants; Analysis 1.1).
1.1. Analysis.
Comparison 1 Formula (term or preterm) versus donated breast milk (DBM) (unfortified or fortified), Outcome 1 Time to regain birth weight (days from birth).
Schultz 1980 did not detect a statistically significant difference, but standard deviations (SDs) were not reported and we could not include the data in the meta‐analysis.
Lucas 1984a reported the median time to regain birth weight as lower in the formula‐fed infants (10 versus 16 days). Lucas 1984b did not find a statistically significant difference (13 versus 15 days). SDs were not reported and we could not include the data in the meta‐analysis.
The other trials did not report time to regain birth weight.
Rate of weight gain
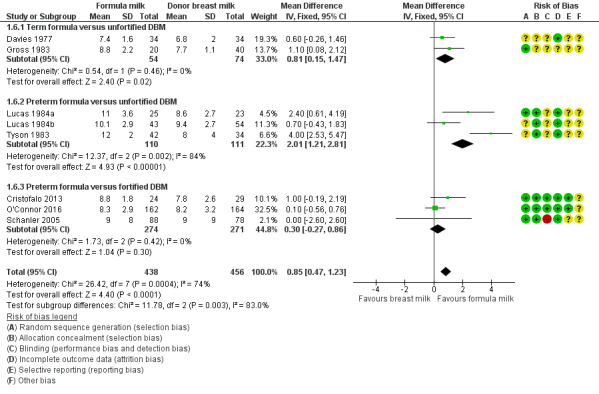
Formula‐fed infants had a higher rate of weight gain but with high heterogeneity in the estimate of this effect (MD 2.51, 95% CI 1.93 to 3.08 g/kg/day; I² = 90%; 9 trials, 1028 participants; moderate‐certainty evidence; Table 1; Analysis 1.2). Significant subgroup differences existed with the largest effect size for the comparison of preterm formula with unfortified donor breast milk (MD 4.16, 95% CI 3.04 to 5.28 g/kg/day) (Figure 3).
1.2. Analysis.
Comparison 1 Formula (term or preterm) versus donated breast milk (DBM) (unfortified or fortified), Outcome 2 Weight gain (g/kg/day).
3.
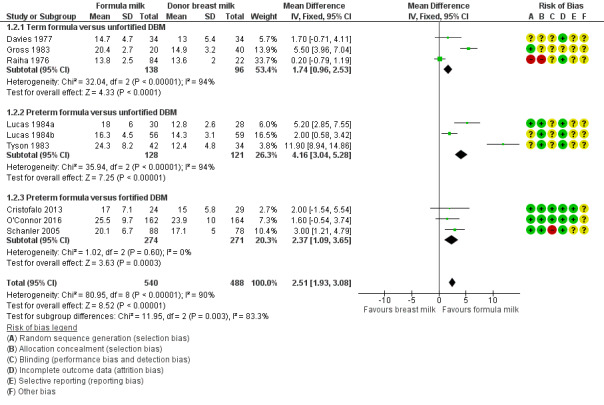
Forest plot of comparison: 1 Formula (term or preterm) versus donor breast milk, outcome: 1.2 Weight gain (g/kg/day).
Schultz 1980 and Corpeleijn 2016 did not report rate of weight gain.
Costa 2018 did not detect a between‐group difference in average weight at 15 days after birth or at 36 weeks' post‐menstrual age.
Linear growth
Formula‐fed infants had a higher rate of increase in crown‐heel length but with high heterogeneity in the estimate of this effect (MD 1.21, 95% CI 0.77 to 1.65 mm/week; I² = 68%; 8 trials, 820 participants; moderate‐certainty evidence; Table 1; Analysis 1.3; Analysis 1.4; Analysis 1.5). Significant subgroup differences existed with the largest effect size for the comparison of preterm formula with unfortified donor breast milk (MD 2.01, 95% CI 1.21 to 2.81 mm/week) (Figure 4).
1.3. Analysis.
Comparison 1 Formula (term or preterm) versus donated breast milk (DBM) (unfortified or fortified), Outcome 3 Linear growth (crown‐heel length mm/week).
1.4. Analysis.
Comparison 1 Formula (term or preterm) versus donated breast milk (DBM) (unfortified or fortified), Outcome 4 Linear growth (crown‐rump length mm/week).
1.5. Analysis.
Comparison 1 Formula (term or preterm) versus donated breast milk (DBM) (unfortified or fortified), Outcome 5 Linear growth (femoral length mm/week).
4.
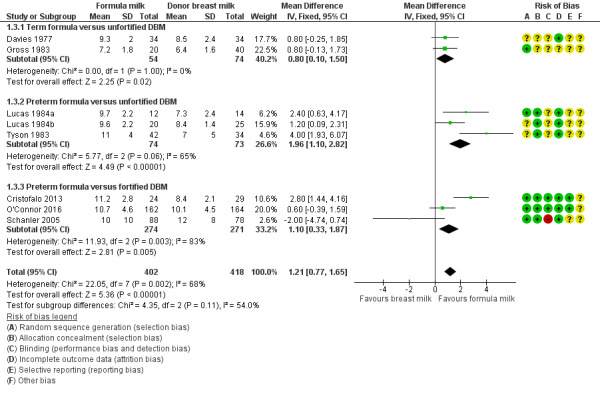
Forest plot of comparison: 1 Formula (term or preterm) versus DBM (unfortified of fortified), outcome: 1.3 Linear growth (crown‐heel length mm/week).
Raiha 1976 reported higher rates of increase in crown‐rump (MD 0.59, 95% CI 0.08 to 1.10 mm/week) and femoral length (MD 0.34, 95% CI 0.13 to 0.55 mm/week) in the formula‐fed group.
Schultz 1980 and Corpeleijn 2016 did not report rate of linear growth.
Costa 2018 did not detect a between‐group difference in average length at 15 days after birth or at 36 weeks' post‐menstrual age.
Head growth
Formula‐fed infants had a higher rate of increase in occipitofrontal head circumference but with high heterogeneity in the estimate of this effect (MD 0.85, 95% CI 0.47 to 1.23 mm/week; I² = 74%; 8 trials, 894 participants; moderate‐certainty evidence; Table 1; Analysis 1.6). Significant subgroup differences existed with the largest effect size for the comparison of preterm formula with unfortified donor breast milk (MD 4.16, 95% CI 3.04 to 5.28 g/kg/day) (Figure 5).
1.6. Analysis.
Comparison 1 Formula (term or preterm) versus donated breast milk (DBM) (unfortified or fortified), Outcome 6 Head growth (mm/week).
5.
Forest plot of comparison: 1 Formula (term or preterm) versus DBM (unfortified of fortified), outcome: 1.6 Head growth (mm/week).
Raiha 1976, Schultz 1980 and Corpeleijn 2016 did not report rate of head growth.
Costa 2018 did not detect a between‐group difference in average head circumference at 15 days after birth or at 36 weeks' post‐menstrual age.
Long‐term growth
Post‐hospital discharge growth was reported by Lucas 1984a and Lucas 1984b. Neither individual study, nor meta‐analyses of data from both studies, showed differences in the weight, length or head circumference at nine months, 18 months or 7.5 to eight years post‐term; Analysis 1.7; Analysis 1.8; Analysis 1.9; Analysis 1.10; Analysis 1.11; Analysis 1.12; Analysis 1.13; Analysis 1.14; Analysis 1.15.
1.7. Analysis.
Comparison 1 Formula (term or preterm) versus donated breast milk (DBM) (unfortified or fortified), Outcome 7 Weight (kg) at 9 months post‐term.
1.8. Analysis.
Comparison 1 Formula (term or preterm) versus donated breast milk (DBM) (unfortified or fortified), Outcome 8 Length (cm) at 9 months post‐term.
1.9. Analysis.
Comparison 1 Formula (term or preterm) versus donated breast milk (DBM) (unfortified or fortified), Outcome 9 Head circumference (cm) at 9 months post‐term.
1.10. Analysis.
Comparison 1 Formula (term or preterm) versus donated breast milk (DBM) (unfortified or fortified), Outcome 10 Weight (kg) at 18 months post‐term.
1.11. Analysis.
Comparison 1 Formula (term or preterm) versus donated breast milk (DBM) (unfortified or fortified), Outcome 11 Length (cm) at 18 months post‐term.
1.12. Analysis.
Comparison 1 Formula (term or preterm) versus donated breast milk (DBM) (unfortified or fortified), Outcome 12 Head circumference (cm) at 18 months post‐term.
1.13. Analysis.
Comparison 1 Formula (term or preterm) versus donated breast milk (DBM) (unfortified or fortified), Outcome 13 Weight (kg) at 7.5 to 8 years of age.
1.14. Analysis.
Comparison 1 Formula (term or preterm) versus donated breast milk (DBM) (unfortified or fortified), Outcome 14 Length (cm) at 7.5 to 8 years of age.
1.15. Analysis.
Comparison 1 Formula (term or preterm) versus donated breast milk (DBM) (unfortified or fortified), Outcome 15 Head circumference (cm) at 7.5 to 8 years of age.
Neurodevelopment
Death or severe neurodevelopmental disability
These composite data are not yet available from the trials that assessed neurodevelopmental outcomes.
Neurodevelopmental scores
Four trials have reported neurodevelopmental outcomes or assessment scores in children aged at least 12 months, measured using validated assessment tools (Gross 1983; Lucas 1984a; Lucas 1984b; O'Connor 2016):
Gross 1983 stated that there was "no difference" in Bayley Mental or Psychomotor Developmental Indices at 15 months post‐term (numerical data not available).
Lucas 1984a and Lucas 1984b, or a meta‐analysis of data from both, did not show differences in Bayley Psychomotor and Mental Development Indices at 18 months' corrected age.
Mental Development Index: MD 1.24, 95% CI ‐2.62 to 5.09 (Analysis 1.16).
Psychomotor Development Index: MD ‐0.32, 95% CI ‐3.48 to 2.79 (Analysis 1.17).
1.16. Analysis.
Comparison 1 Formula (term or preterm) versus donated breast milk (DBM) (unfortified or fortified), Outcome 16 Bayley Mental Development Index at 18 months.
1.17. Analysis.
Comparison 1 Formula (term or preterm) versus donated breast milk (DBM) (unfortified or fortified), Outcome 17 Bayley Psychomotor Development Index at 18 months.
"Severe neurodevelopmental disability" (Amiel‐Tison 1986 classification) was assessed in children aged 18 months post‐term in two trials. Neither Lucas 1984a nor Lucas 1984b, or a meta‐analysis of data from both trials, showed a difference: typical RR 1.21 (95% CI 0.62 to 2.35; I² = 17%; 2 trials, 400 participants); RD ‐0.02 (95% CI ‐0.04 to 0.17); moderate‐certainty evidence; Table 1; Analysis 1.18).
1.18. Analysis.
Comparison 1 Formula (term or preterm) versus donated breast milk (DBM) (unfortified or fortified), Outcome 18 Neurodevelopmental disability at 18 months.
O'Connor 2016 did not show any differences in the mean scores on Bayley Scales of Infant and Toddler Development, Third Edition (Bayley‐III) assessments at 18 to 22 months' corrected age.
Cognitive: MD 1.60, 95% CI ‐2.71 to 5.91 (Analysis 1.19).
Language: MD 3.00, 95% CI ‐2.01 to 8.01 (Analysis 1.19).
Motor: MD 2.20, 95% CI ‐2.07 to 6.47 (Analysis 1.19).
1.19. Analysis.
Comparison 1 Formula (term or preterm) versus donated breast milk (DBM) (unfortified or fortified), Outcome 19 Bayley‐III.
There were not any differences in the proportion of children with Bayley‐III scores < 70 in O'Connor 2016.
Cognitive: RR 0.82, 95% CI 0.40 to 1.68 (Analysis 1.20); RD ‐0.02, 95% CI ‐0.08 to 0.05.
Language: RR 0.78, 95% CI 0.47 to 1.30 (Analysis 1.20); RD ‐0.04 (95% CI ‐0.13 to 0.04).
Motor: RR 0.73, 95% CI 0.37 to 1.44 (Analysis 1.20); RD ‐0.03 (95% CI ‐0.10 to 0.04).
1.20. Analysis.
Comparison 1 Formula (term or preterm) versus donated breast milk (DBM) (unfortified or fortified), Outcome 20 Bayley‐III score < 70.
There were not any differences in the proportion of children diagnosed with cerebral palsy, or hearing or visual impairment in O'Connor 2016.
Cerebral palsy: RR 0.51, 95% CI 0.21 to 1.23 (Analysis 1.21); RD ‐0.05 (95% CI ‐0.10 to 0.01).
Hearing impairment: RR 1.02, 95% CI 0.30 to 3.45 (Analysis 1.22); RD 0.00 (95% CI ‐0.04 to 0.04).
Visual impairment: RR (not estimable ‐ no events; Analysis 1.23); RD 0.00 (95% CI ‐0.01 to 0.01).
1.21. Analysis.
Comparison 1 Formula (term or preterm) versus donated breast milk (DBM) (unfortified or fortified), Outcome 21 Cerebral palsy.
1.22. Analysis.
Comparison 1 Formula (term or preterm) versus donated breast milk (DBM) (unfortified or fortified), Outcome 22 Hearing impairment.
1.23. Analysis.
Comparison 1 Formula (term or preterm) versus donated breast milk (DBM) (unfortified or fortified), Outcome 23 Visual impairment.
Cognitive and educational outcomes in children aged more than five years old
Lucas 1984a and Lucas 1984b assessed cognitive outcomes (verbal and performance intelligence quotient) in about 20% of participants at ages eight and 16 years. Numerical data were not reported for the individual trials but rather were combined with data from another trial undertaken by the same investigators that compared feeding preterm infants with nutrient‐enriched versus standard formula (Isaacs 2009).
O'Connor 2016 has not yet reported any cognitive and educational outcomes in children aged more than five years old.
Secondary outcomes
All‐cause mortality
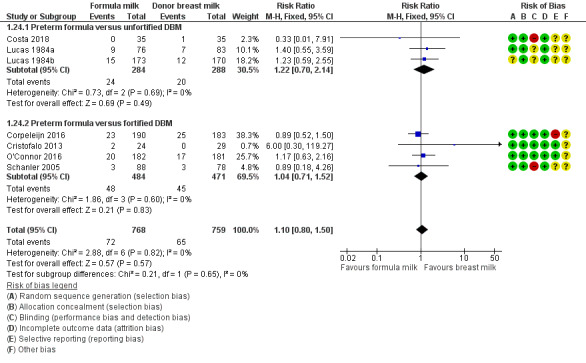
Data were available from seven trials. Two trials reported mortality until nine months post‐term (Lucas 1984a; Lucas 1984b). The other trials reported mortality until hospital discharge (Schanler 2005; Cristofalo 2013; Corpeleijn 2016; O'Connor 2016; Costa 2018). None showed a difference between the groups. Since it is likely that most infant mortality in this population occurred before hospital discharge, we combined the data from the trials in a meta‐analysis: RR 1.10, 95% CI 0.80 to 1.50; I² = 0%; 7 trials, 1527 participants; moderate‐certainty evidence; Table 1; Analysis 1.24). There were not any significant subgroup differences (Figure 6).
1.24. Analysis.
Comparison 1 Formula (term or preterm) versus donated breast milk (DBM) (unfortified or fortified), Outcome 24 All‐cause mortality.
6.
Forest plot of comparison: 1 Formula (term or preterm) versus DBM (unfortified of fortified), outcome: 1.24 All‐cause mortality.
Necrotising enterocolitis
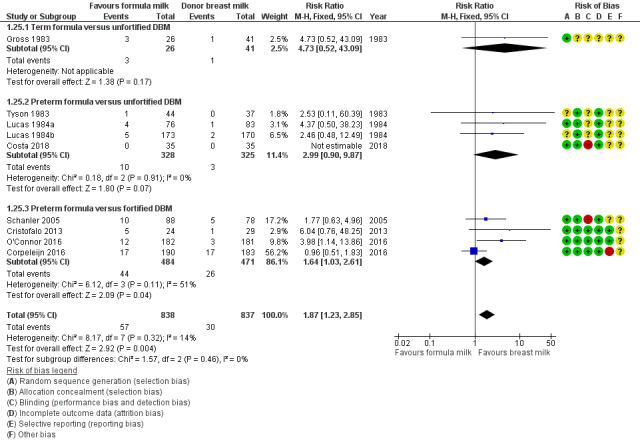
Meta‐analysis of data available from nine trials showed a higher risk of necrotising enterocolitis in the formula‐fed group: RR 1.87, 95% CI 1.23 to 2.85; I² = 14%; 9 trials, 1675 participants; RD 0.03, 95% CI 0.01 to 0.05; number needed to treat for an additional harmful outcome (NNTH) 33 (95% CI 20 to 100); moderate‐certainty evidence; Table 1; Analysis 1.25). There were not any significant subgroup differences (Figure 7).
1.25. Analysis.
Comparison 1 Formula (term or preterm) versus donated breast milk (DBM) (unfortified or fortified), Outcome 25 Necrotising enterocolitis.
7.
Forest plot of comparison: 1 Formula (term or preterm) versus DBM (unfortified of fortified), outcome: 1.25 Necrotising enterocolitis.
Days after birth to establish full enteral feeding
This was reported by three trials. A meta‐analysis of data from Cristofalo 2013 and Costa 2018 did not show a difference (MD 0.33, 95% CI ‐2.57 to 3.23 days; Analysis 1.26). There were not any significant subgroup differences.
1.26. Analysis.
Comparison 1 Formula (term or preterm) versus donated breast milk (DBM) (unfortified or fortified), Outcome 26 Days after birth to establish full enteral feeding.
Corpeleijn 2016 reported no difference in median time to full feeds independent of parenteral nutrition (12 versus 11 days) but did not provide sufficient data for inclusion in a meta‐analysis.
Feeding intolerance
Meta‐analysis of data from Gross 1983 and Tyson 1983 showed a higher incidence of feeding intolerance in the formula‐fed group (RR 4.92, 95% CI 1.17 to 20.70; RD 0.10, 95% CI 0.01 to 0.19; NNTH 10, 95% CI 5 to 100; Analysis 1.27).
1.27. Analysis.
Comparison 1 Formula (term or preterm) versus donated breast milk (DBM) (unfortified or fortified), Outcome 27 Feeding intolerance or diarrhoea.
Lucas 1984a reported that significantly more infants in the formula‐fed group failed to tolerate full enteral feeds by two weeks after birth (25/76 versus 9/83 in the donor breast milk group) and by three weeks after birth (13/76 versus 4/83).
Incidence of invasive infection
Meta‐analysis of data available from five trials did not show a difference in invasive infection (RR 0.94, 95% CI 0.79 to 1.12; I² = 37%; 5 trials, 1025 infants; Analysis 1.28). There were not any significant subgroup differences.
1.28. Analysis.
Comparison 1 Formula (term or preterm) versus donated breast milk (DBM) (unfortified or fortified), Outcome 28 Invasive infection.
Subgroup analysis: formula versus donor breast milk as (i) sole diet or (ii) supplement to maternal expressed breast milk
Seven trials compared feeding with formula versus donor breast milk as a sole diet (Raiha 1976; Davies 1977; Schultz 1980; Gross 1983; Tyson 1983; Lucas 1984a; Cristofalo 2013).
Five trials compared feeding with formula versus donor breast milk as a supplement to maternal expressed breast milk (Lucas 1984b; Schanler 2005; Corpeleijn 2016; O'Connor 2016; Costa 2018).
Growth
Meta‐analyses did not show subgroup differences for rate of weight gain (Analysis 2.1), or increase in crown‐heel length (Analysis 2.2).
2.1. Analysis.
Comparison 2 Subgroup analysis: formula versus donated breast milk (DBM) given as (i) sole diet or (ii) a supplement to maternal expressed breast milk, Outcome 1 Weight gain (g/kg/day).
2.2. Analysis.
Comparison 2 Subgroup analysis: formula versus donated breast milk (DBM) given as (i) sole diet or (ii) a supplement to maternal expressed breast milk, Outcome 2 Linear growth (crown‐heel length mm/week).
Subgroup comparisons showed significant differences for head growth.
Sole diet: MD 1.36, 95% CI 0.85 to 1.88 mm/week.
Supplement: MD 0.24, 95% CI ‐0.32 to 0.80 mm/week.
Test for subgroup differences: Chi² = 8.37, df = 1 (P = 0.004), I² = 88.1% (Analysis 2.3).
2.3. Analysis.
Comparison 2 Subgroup analysis: formula versus donated breast milk (DBM) given as (i) sole diet or (ii) a supplement to maternal expressed breast milk, Outcome 3 Head growth (mm/week).
Meta‐analyses of data from Lucas 1984a (sole diet) and Lucas 1984b (supplemental) did not show any subgroup differences for long‐term growth (Analysis 2.4; Analysis 2.5; Analysis 2.6; Analysis 2.7; Analysis 2.8; Analysis 2.9; Analysis 2.10; Analysis 2.11; Analysis 2.12).
2.4. Analysis.
Comparison 2 Subgroup analysis: formula versus donated breast milk (DBM) given as (i) sole diet or (ii) a supplement to maternal expressed breast milk, Outcome 4 Weight (kg) at 9 months post‐term.
2.5. Analysis.
Comparison 2 Subgroup analysis: formula versus donated breast milk (DBM) given as (i) sole diet or (ii) a supplement to maternal expressed breast milk, Outcome 5 Length (cm) at 9 months post‐term.
2.6. Analysis.
Comparison 2 Subgroup analysis: formula versus donated breast milk (DBM) given as (i) sole diet or (ii) a supplement to maternal expressed breast milk, Outcome 6 Head circumference (cm) at 9 months post‐term.
2.7. Analysis.
Comparison 2 Subgroup analysis: formula versus donated breast milk (DBM) given as (i) sole diet or (ii) a supplement to maternal expressed breast milk, Outcome 7 Weight (kg) at 18 months post‐term.
2.8. Analysis.
Comparison 2 Subgroup analysis: formula versus donated breast milk (DBM) given as (i) sole diet or (ii) a supplement to maternal expressed breast milk, Outcome 8 Length (cm) at 18 months post‐term.
2.9. Analysis.
Comparison 2 Subgroup analysis: formula versus donated breast milk (DBM) given as (i) sole diet or (ii) a supplement to maternal expressed breast milk, Outcome 9 Head circumference (cm) at 18 months post‐term.
2.10. Analysis.
Comparison 2 Subgroup analysis: formula versus donated breast milk (DBM) given as (i) sole diet or (ii) a supplement to maternal expressed breast milk, Outcome 10 Weight (kg) at 7.5 to 8 years of age.
2.11. Analysis.
Comparison 2 Subgroup analysis: formula versus donated breast milk (DBM) given as (i) sole diet or (ii) a supplement to maternal expressed breast milk, Outcome 11 Length (cm) at 7.5 to 8 years of age.
2.12. Analysis.
Comparison 2 Subgroup analysis: formula versus donated breast milk (DBM) given as (i) sole diet or (ii) a supplement to maternal expressed breast milk, Outcome 12 Head circumference (cm) at 7.5 to 8 years of age.
Neurodevelopment
Meta‐analyses of data from Lucas 1984a (sole diet) and Lucas 1984b (supplemental) did not show any subgroup differences for neurodevelopmental outcomes (Analysis 2.13; Analysis 2.14; Analysis 2.15).
2.13. Analysis.
Comparison 2 Subgroup analysis: formula versus donated breast milk (DBM) given as (i) sole diet or (ii) a supplement to maternal expressed breast milk, Outcome 13 Bayley Mental Development Index at 18 months.
2.14. Analysis.
Comparison 2 Subgroup analysis: formula versus donated breast milk (DBM) given as (i) sole diet or (ii) a supplement to maternal expressed breast milk, Outcome 14 Bayley Psychomotor Development Index at 18 months.
2.15. Analysis.
Comparison 2 Subgroup analysis: formula versus donated breast milk (DBM) given as (i) sole diet or (ii) a supplement to maternal expressed breast milk, Outcome 15 Neurodevelopmental disability at 18 months.
Secondary outcomes
Meta‐analyses did not show significant subgroup differences for all‐cause mortality (Analysis 2.16), or necrotising enterocolitis (Analysis 2.17).
2.16. Analysis.
Comparison 2 Subgroup analysis: formula versus donated breast milk (DBM) given as (i) sole diet or (ii) a supplement to maternal expressed breast milk, Outcome 16 All‐cause mortality.
2.17. Analysis.
Comparison 2 Subgroup analysis: formula versus donated breast milk (DBM) given as (i) sole diet or (ii) a supplement to maternal expressed breast milk, Outcome 17 Necrotising enterocolitis.
Subgroup comparisons showed significant differences for incidence of invasive infection.
Sole diet: RR 1.43, 95% CI 0.97 to 2.11; RD 0.24, 95% CI ‐0.00 to 0.48.
Supplement: RR 0.89, 95% CI 0.73 to 1.08; RD ‐0.03, 95% CI ‐0.09 to 0.02.
Test for subgroup differences: Chi² = 4.70, df = 1 (P = 0.03), I² = 78.7% (Analysis 2.18).
2.18. Analysis.
Comparison 2 Subgroup analysis: formula versus donated breast milk (DBM) given as (i) sole diet or (ii) a supplement to maternal expressed breast milk, Outcome 18 Incidence of invasive infection.
Discussion
Summary of main results
We included 12 randomised controlled trials (RCTs) in which a total of 1879 preterm or low birth weight (LBW) infants participated. Meta‐analyses show that infants who receive formula regain birth weight earlier and have higher in‐hospital rates of weight gain, linear growth, and head growth than infants who receive donor breast milk. These effects on growth parameters are greater in trials that compare feeding with nutrient‐enriched preterm formula rather than standard term formula versus donor breast milk. Follow‐up of the infants who participated in two of the largest trials did not show any effects on long‐term growth. None of the trials that assessed neurodevelopment beyond infancy showed any significant effects.
Meta‐analysis of data from eight trials shows that feeding with formula rather than donor breast milk increases the risk of necrotising enterocolitis in preterm and LBW infants.
Overall completeness and applicability of evidence
These findings should be interpreted with caution. Substantial heterogeneity in the meta‐analyses of weight gain, linear growth, and head growth limits the validity of the pooled estimates of effect size. Many of the trials that contributed data to these meta‐analyses were undertaken more than 20 years ago and the trials used different inclusion criteria and varied with respect to the type of formula and donor breast milk. Five trials have been undertaken in the past 20 years and four of these trials compared feeding with preterm formula versus donor breast milk with added multinutrient fortifier (Schanler 2005; Cristofalo 2013; Corpeleijn 2016; O'Connor 2016). Subgroup analyses of data from these trials, which are more likely to be applicable to current practice in high‐income countries, where nutrient fortification of breast milk is commonly undertaken, shows higher rates of weight gain and linear growth in formula‐fed infants, but no effect on head growth.
The pooled estimate from meta‐analysis of data from nine trials suggests that one extra case of necrotising enterocolitis will occur in every 33 infants who receive formula. This beneficial effect of donor breast milk exists even when donor breast milk is given as a supplement to maternal breast milk, rather than as a sole diet, and when the donor breast milk is nutrient‐fortified. The subgroup meta‐analysis of four trials that compared feeding infants with preterm (nutrient‐enriched) formula versus nutrient‐fortified donor breast milk was moderately heterogeneous (I² = 51%). A possible explanation is that the trials differed in the intensity and duration of exposure to the intervention. Infants participating in Corpeleijn 2016 (the trial that contributed most to the heterogeneity) received the trial interventions for only the first 10 days after birth as maternal (mother's own) breast milk was widely available by this stage. In the other three trials, in contrast, infants received the allocated intervention for up to 90 days or the duration of birth hospitalisation (Schanler 2005; Cristofalo 2013; O'Connor 2016). It is plausible that donor breast milk is less effective in preventing necrotising enterocolitis in settings where formula (rather than maternal breast milk) use is more prevalent.
Most of the trials included in the meta‐analysis did not mask caregivers and assessors to the intervention. This methodological weakness may have resulted in surveillance and ascertainment biases that contributed to the higher rate of detection of necrotising enterocolitis in formula‐fed infants. Caution should be exercised in applying these data to growth‐restricted preterm infants or sick infants since these infants, although at high risk of developing necrotising enterocolitis, were ineligible to participate in many of the included trials.
The data in this review are from trials undertaken in high‐income countries. In low‐ or middle‐incomes countries, the immunoactive properties of breast milk may confer advantages that outweigh the lower rate of short‐term growth. In India, a RCT in LBW infants "at risk of infection" found that serious infections (diarrhoea, pneumonia, septicaemia) were less common in infants allocated to received "expressed human milk" versus formula milk (Narayanan 1982). "Expressed human milk" in this study referred to a mixture of maternal and donor breast milk. As we could not separate these into subgroups, we did not include the data in the review.
Quality of the evidence
The GRADE certainty of evidence was moderate for rates of weight gain, linear growth, and head growth (downgraded for high levels of heterogeneity) and was moderate for neurodevelopmental disability, all‐cause mortality, and necrotising enterocolitis (downgraded for imprecision) (Table 1).
Some of the trials contained various weaknesses in methodological quality, specifically concern about allocation concealment methods in four trials, and about methods to ensure masking in most of the trials. Parents, caregivers, clinicians and investigators were likely to have been aware of the treatment group to which infants had been allocated and this knowledge may have affected some care practices or investigation strategies, including thresholds for screening or diagnosing for necrotising enterocolitis.
Most of the included trials were funded or supported by the manufacturers of the formulas being assessed, but the funders were not involved in trial design or analysis. There remains some concern that formula manufacturers may promote study findings of trials of specialist formulas selectively as part of a marketing strategy that subverts UNICEF Baby Friendly Initiative regulations (Cleminson 2015).
Potential biases in the review process
The main concern with the review process is the possibility that the findings are subject to publication and other reporting biases, including more availability of numerical data for inclusion in meta‐analyses from trials that reported statistically significant or clinically important effects. We attempted to minimise this threat by screening the reference lists of included trials and related reviews and searching the proceedings of the major international perinatal conferences to identify trial reports that are not (or not yet) published in full form in academic journals. However, we cannot be sure whether other trials have been undertaken, but not reported, and the concern remains that such trials are less likely than published trials to have detected statistically significant or clinically important effects. The meta‐analyses that we performed did not contain sufficient trials to explore symmetry of funnel plots as a means of identifying possible publication or reporting bias.
Authors' conclusions
Implications for practice.
There is moderate‐certainty evidence that feeding with formula, particularly preterm formula, compared with donor breast milk increases rates of weight gain, linear growth, and head growth in preterm or low birth weight (LBW) infants in hospital. Formula feeding is associated with a near‐doubling of the risk of necrotising enterocolitis. These is no evidence of an effect on all‐cause mortality, or on long‐term growth and neurodevelopment. There are limited data from RCTs on the comparison of feeding with formula milk versus nutrient‐fortified human milk. This limits the implications for practice from this review as nutrient fortification of human milk is now a common practice in neonatal care (Williams 2016).
Implications for research.
Further RCTs of feeding with formula versus donor breast milk in situations where the expressed breast milk of the preterm or LBW infant's mother is not consistently available are needed. Several such trials are in progress and these propose to recruit more than 1100 infants in total (Characteristics of ongoing studies). Incorporating the data from these trials in meta‐analyses should generate more precise estimates of effect sizes, and strengthen the applicability of the trial evidence base to current practice. In addition to clinical effectiveness, future research efforts to inform practice and policy should assess acceptability and cost‐effectiveness (Buckle 2017).
What's new
| Date | Event | Description |
|---|---|---|
| 7 August 2019 | Amended | Declaration of interest updated for Dr. Nicholas D Embleton. |
History
Protocol first published: Issue 1, 2001 Review first published: Issue 4, 2001
| Date | Event | Description |
|---|---|---|
| 14 June 2019 | New search has been performed | Search updated in May 2019 |
| 14 June 2019 | New citation required but conclusions have not changed | One additional trial included. Conclusions unchanged |
| 14 February 2018 | New search has been performed | Search updated in June 2017 and two new trials included |
| 6 June 2008 | Amended | Converted to new review format |
| 18 June 2007 | New citation required and conclusions have changed | Substantive amendment |
Acknowledgements
We thank the corresponding authors of included trials for providing further information on methods and outcomes.
Appendices
Appendix 1. Electronic search strategy
CINAHL via EBSCO
| Search ID# | Search Terms |
| S1 | (MH "Infant, Newborn+") |
| S2 | TX ( (neonat* or neo nat*) ) OR TX ( (newborn* or new born* or newly born*) ) OR TX ( (preterm or preterms or pre term or pre terms) ) OR TX ( (preemie$ or premie or premies) ) OR TX ( (prematur* N3 (birth* or born or deliver*)) ) OR TX ( (low N3 (birthweight* or birth weight*)) ) OR TX ( (lbw or vlbw or elbw) ) OR TX infan* OR TX ( (baby or babies) ) |
| S3 | S1 OR S2 |
| S4 | (MH "Infant Formula") |
| S5 | TX infant* N2 formula* OR TX pediatric N2 formula* OR TX paediatric N2 formula* OR TX ( (baby or babies) N2 formula* ) OR TX formula* N2 milk |
| S6 | S4 OR S5 |
| S7 | (MH "Milk, Human") OR (MH "Milk Banks") |
| S8 | TX Milk N2 bank* OR TX ( milk N2 (donor* or donat*) ) OR TX milk N2 shar* OR TX breastmilk N2 bank* OR TX ( breastmilk N2 (donor* or donat*) ) OR TX breastmilk N2 shar* OR TX ( milk N10 (DBM or DHM) ) |
| S9 | S7 OR S8 |
| S10 | S3 AND S6 AND S9 |
| S11 | (MH "Randomized Controlled Trials") OR (MH "Clinical Trials") |
| S12 | (MH "Comparative Studies") |
| S13 | (MH "Evaluation Research") |
| S14 | S11 OR S12 OR S13 |
| S15 | S10 AND S14 |
Cochrane Central Register of Controlled Trials (CENTRAL) via John Wiley’s Cochrane Library
#1 MeSH descriptor: [Infant, Newborn] explode all trees
#2 MeSH descriptor: [Premature Birth] explode all trees
#3 neonat* or "neo nat*":ti,ab,kw or newborn* or "new born*" or "newly born*":ti,ab,kw or preterm or preterms or "pre term" or "pre terms":ti,ab,kw or preemie* or premie or premies:ti,ab,kw or prematur* near/3 (birth* or born or deliver*):ti,ab,kw (Word variations have been searched)
#4 low near/3 (birthweight* or "birth weight*"):ti,ab,kw or lbw or vlbw or elbw:ti,ab,kw or infan*:ti,ab,kw or baby or babies:ti,ab,kw (Word variations have been searched)
#5 #1 or #2 or #3 or #4
#6 MeSH descriptor: [Infant Formula] explode all trees
#7 infant* near/2 formula*:ti,ab,kw or pediatric near/2 formula*:ti,ab,kw and paediatric near/2 formula*:ti,ab,kw or (baby or babies) near/2 formula*:ti,ab,kw or formula* near/2 milk:ti,ab,kw (Word variations have been searched)
#8 #6 or #7
#9 MeSH descriptor: [Milk, Human] explode all trees
#10 MeSH descriptor: [Milk Banks] explode all trees
#11 Milk near/2 (bank* or donor* or donat* or shar*):ti,ab,kw or Breastmilk near/2 (bank* or donor* or donat* or shar*):ti,ab,kw or milk near/10 (DBM or DHM):ti,ab,kw (Word variations have been searched)
#12 #9 or #10 or #11
#13 #5 and #8 and #12
Embase via OVID
1 Newborn/
2 Prematurity/
3 (neonat$ or neo nat$).ti,ab.
4 (newborn$ or new born$ or newly born$).ti,ab.
5 (preterm or preterms or pre term or pre terms).ti,ab.
6 (preemie$ or premie or premies).ti,ab.
7 (prematur$ adj3 (birth$ or born or deliver$)).ti,ab.
8 (low adj3 (birthweight$ or birth weight$)).ti,ab.
9 (lbw or vlbw or elbw).ti,ab.
10 infan$.ti,ab.
11 (baby or babies).ti,ab.
12 1 or 2 or 3 or 4 or 5 or 6 or 7 or 8 or 9 or 10 or 11 (
13 Artifical milk/
14 (infant$ adj2 formula$).ti,ab.
15 (pediatric adj2 formula$).ti,ab.
16 (paediatric adj2 formula$).ti,ab.
17 ((baby or babies) adj2 formula$).ti,ab.
18 (formula$ adj2 milk).ti,ab.
19 13 or 14 or 15 or 16 or 17 or 18
20 Breast milk/
21 Milk Bank/
22 (Milk adj2 bank$).ti,ab.
23 (milk adj2 (donor$ or donat$)).ti,ab.
24 (milk adj2 shar$).ti,ab.
25 (breastmilk adj2 bank$).ti,ab.
26 (breastmilk adj2 (donor$ or donat$)).ti,ab.
27 (breastmilk adj2 shar$).ti,ab.
28 (milk and (DBM or DHM)).ti,ab.
29 20 or 21 or 22 or 23 or 24 or 25 or 26 or 27 or 28
30 12 and 19 and 29
31 (random* or factorial* or placebo* or assign* or allocat* or crossover*).tw.
32 (cross adj over*).tw.
33 (trial* and (control* or comparative)).tw.
34 ((blind* or mask*) and (single or double or triple or treble)).tw.
35 (treatment adj arm*).tw.
36 (control* adj group*).tw.
37 (phase adj (III or three)).tw.
38 (versus or vs).tw.
39 rct.tw.
40 Crossover Procedure/
41 Double Blind Procedure/
42 Single Blind Procedure/
43 Randomization/
44 Placebo/
45 exp Clinical Trial/
46 Parallel Design/
47 Latin Square Design/
48 31 or 32 or 33 or 34 or 35 or 36 or 37 or 38 or 39 or 40 or 41 or 42 or 43 or 44 or 45 or 46 or 47
49 exp animal/ or exp nonhuman/ or exp animal experiment/ or exp animal model/
50 exp human/
51 49 not 50
52 48 not 51
53 30 and 52
Maternity & Infant Care via OVID
1 (neonat$ or neo nat$).ti,ab.
2 (newborn$ or new born$ or newly born$).ti,ab.
3 (preterm or preterms or pre term or pre terms).ti,ab.
4 (preemie$ or premie or premies).ti,ab.
5 (prematur$ adj3 (birth$ or born or deliver$)).ti,ab.
6 (low adj3 (birthweight$ or birth weight$)).ti,ab.
7 (lbw or vlbw or elbw).ti,ab.
8 infan$.ti,ab.
9 (baby or babies).ti,ab.
10 1 or 2 or 3 or 4 or 5 or 6 or 7 or 8 or 9
11 (infant$ adj2 formula$).ti,ab.
12 (pediatric adj2 formula$).ti,ab.
13 (paediatric adj2 formula$).ti,ab.
14 ((baby or babies) adj2 formula$).ti,ab.
15 (formula$ adj2 milk).ti,ab.
16 11 or 12 or 13 or 14 or 15
17 Human milk.ti,ab.
18 (Milk adj2 bank$).ti,ab.
19 (milk adj2 (donor$ or donat$)).ti,ab.
20 (milk adj2 shar$).ti,ab. (39)
21 (breastmilk adj2 bank$).ti,ab.
22 (breastmilk adj2 (donor$ or donat$)).ti,ab.
23 (breastmilk adj2 shar$).ti,ab.
24 (milk and (DBM or DHM)).ti,ab.
25 17 or 18 or 19 or 20 or 21 or 22 or 23 or 24
26 10 and 16 and 25
27 limit 26 to randomised controlled trial
MEDLINE via Ovid MEDLINE(R) Epub Ahead of Print, In‐Process & Other Non‐Indexed Citations, Ovid MEDLINE(R) Daily and Ovid MEDLINE(R) <1946 to Present>
1 exp Infant, Newborn/
2 Premature Birth/
3 (neonat$ or neo nat$).ti,ab.
4 (newborn$ or new born$ or newly born$).ti,ab.
5 (preterm or preterms or pre term or pre terms).ti,ab.
6 (preemie$ or premie or premies).ti,ab.
7 (prematur$ adj3 (birth$ or born or deliver$)).ti,ab.
8 (low adj3 (birthweight$ or birth weight$)).ti,ab.
9 (lbw or vlbw or elbw).ti,ab.
10 infan$.ti,ab.
11 (baby or babies).ti,ab.
12 1 or 2 or 3 or 4 or 5 or 6 or 7 or 8 or 9 or 10 or 11
13 Infant Formula/
14 (infant$ adj2 formula$).ti,ab.
15 (pediatric adj2 formula$).ti,ab.
16 (paediatric adj2 formula$).ti,ab.
17 ((baby or babies) adj2 formula$).ti,ab.
18 (formula$ adj2 milk).ti,ab.
19 13 or 14 or 15 or 16 or 17 or 18
20 Milk, Human/
21 Milk Banks/
22 (Milk adj2 bank$).ti,ab.
23 (milk adj2 (donor$ or donat$)).ti,ab.
24 (milk adj2 shar$).ti,ab.
25 (breastmilk adj2 bank$).ti,ab.
26 (breastmilk adj2 (donor$ or donat$)).ti,ab.
27 (breastmilk adj2 shar$).ti,ab.
28 (milk and (DBM or DHM)).ti,ab.
29 20 or 21 or 22 or 23 or 24 or 25 or 26 or 27 or 28
30 12 and 19 and 29
31 randomized controlled trial.pt.
32 controlled clinical trial.pt.
33 randomized.ab.
34 placebo.ab.
35 drug therapy.fs.
36 randomly.ab.
37 trial.ab.
38 groups.ab.
39 31 or 32 or 33 or 34 or 35 or 36 or 37 or 38
40 exp animals/ not humans.sh.
41 39 not 40
42 30 and 41
Appendix 2. 'Risk of bias' tool
1. Sequence generation (checking for possible selection bias). Was the allocation sequence adequately generated?
For each included study, we categorised the method used to generate the allocation sequence as:
low risk (any truly random process, e.g. random number table; computer random number generator);
high risk (any non‐random process, e.g. odd or even date of birth; hospital or clinic record number); or
unclear risk.
2. Allocation concealment (checking for possible selection bias). Was allocation adequately concealed?
For each included study, we categorised the method used to conceal the allocation sequence as:
low risk (e.g. telephone or central randomisation; consecutively numbered sealed opaque envelopes);
high risk (open random allocation; unsealed or non‐opaque envelopes, alternation; date of birth); or
unclear risk.
3. Blinding of participants and personnel (checking for possible performance bias). Was knowledge of the allocated intervention adequately prevented during the study?
For each included study, we categorised the methods used to blind study participants and personnel from knowledge of which intervention a participant received. Blinding was assessed separately for different outcomes or class of outcomes. We categorised the methods as:
low risk, high risk or unclear risk for participants; and
low risk, high risk or unclear risk for personnel.
4. Blinding of outcome assessment (checking for possible detection bias). Was knowledge of the allocated intervention adequately prevented at the time of outcome assessment?
For each included study, we categorised the methods used to blind outcome assessment. Blinding was assessed separately for different outcomes or class of outcomes. We categorised the methods as:
low risk for outcome assessors;
high risk for outcome assessors; or
unclear risk for outcome assessors.
5. Incomplete outcome data (checking for possible attrition bias through withdrawals, dropouts, protocol deviations). Were incomplete outcome data adequately addressed?
For each included study and for each outcome, we described the completeness of data including attrition and exclusions from the analysis. We noted whether attrition and exclusions were reported, the numbers included in the analysis at each stage (compared with the total randomised participants), reasons for attrition or exclusion where reported, and whether missing data were balanced across groups or were related to outcomes. Where sufficient information was reported or supplied by the trial authors, we reincluded missing data in the analyses. We categorised the methods as:
low risk (< 20% missing data);
high risk (≥ 20% missing data); or
unclear risk.
6. Selective reporting bias. Are reports of the study free of suggestion of selective outcome reporting?
For each included study, we described how we investigated the possibility of selective outcome reporting bias and what we found. For studies in which study protocols were published in advance, we compared prespecified outcomes versus outcomes eventually reported in the published results. If the study protocol was not published in advance, we contacted study authors to gain access to the study protocol. We assessed the methods as:
low risk (where it is clear that all of the study's prespecified outcomes and all expected outcomes of interest to the review have been reported);
high risk (where not all the study's prespecified outcomes have been reported; one or more reported primary outcomes were not prespecified outcomes of interest and are reported incompletely and so cannot be used; study fails to include results of a key outcome that would have been expected to have been reported); or
unclear risk.
7. Other sources of bias. Was the study apparently free of other problems that could put it at a high risk of bias?
For each included study, we described any important concerns we had about other possible sources of bias (for example, whether there was a potential source of bias related to the specific study design or whether the trial was stopped early due to some data‐dependent process). We assessed whether each study was free of other problems that could put it at risk of bias as:
low risk;
high risk;
unclear risk.
If needed, we explored the impact of the level of bias through undertaking sensitivity analyses.
Appendix 3. GRADE
GRADE considers that evidence from randomised controlled trials is high certainty, but that assessment may be downgraded based on consideration of any of five areas.
Design (risk of bias).
Consistency across studies.
Directness of the evidence.
Precision of estimates.
Presence of publication bias.
This results in an assessment of the certainty of a body of evidence in one of four grades.: High certainty: we are very confident that the true effect lies close to that of the estimate of the effect. Moderate certainty: we are moderately confident in the effect estimate; the true effect is likely to be close to the estimate of the effect, but there is a possibility that it is substantially different. Low certainty: our confidence in the effect estimate is limited; the true effect may be substantially different from the estimate of the effect. Very low certainty: we have very little confidence in the effect estimate; the true effect is likely to be substantially different from the estimate of effect.
Data and analyses
Comparison 1. Formula (term or preterm) versus donated breast milk (DBM) (unfortified or fortified).
| Outcome or subgroup title | No. of studies | No. of participants | Statistical method | Effect size |
|---|---|---|---|---|
| 1 Time to regain birth weight (days from birth) | 3 | 236 | Mean Difference (IV, Fixed, 95% CI) | ‐3.08 [‐4.38, ‐1.77] |
| 1.1 Term formula versus unfortified DBM | 2 | 166 | Mean Difference (IV, Fixed, 95% CI) | ‐2.00 [‐5.81, ‐2.18] |
| 1.2 Preterm formula versus unfortified DBM | 1 | 70 | Mean Difference (IV, Fixed, 95% CI) | ‐2.10 [‐3.97, ‐0.23] |
| 2 Weight gain (g/kg/day) | 9 | 1028 | Mean Difference (IV, Fixed, 95% CI) | 2.51 [1.93, 3.08] |
| 2.1 Term formula versus unfortified DBM | 3 | 234 | Mean Difference (IV, Fixed, 95% CI) | 1.74 [0.96, 2.53] |
| 2.2 Preterm formula versus unfortified DBM | 3 | 249 | Mean Difference (IV, Fixed, 95% CI) | 4.16 [3.04, 5.28] |
| 2.3 Preterm formula versus fortified DBM | 3 | 545 | Mean Difference (IV, Fixed, 95% CI) | 2.37 [1.09, 3.65] |
| 3 Linear growth (crown‐heel length mm/week) | 8 | 820 | Mean Difference (IV, Fixed, 95% CI) | 1.21 [0.77, 1.65] |
| 3.1 Term formula versus unfortified DBM | 2 | 128 | Mean Difference (IV, Fixed, 95% CI) | 0.80 [0.10, 1.50] |
| 3.2 Preterm formula versus unfortified DBM | 3 | 147 | Mean Difference (IV, Fixed, 95% CI) | 1.96 [1.10, 2.82] |
| 3.3 Preterm formula versus fortified DBM | 3 | 545 | Mean Difference (IV, Fixed, 95% CI) | 1.10 [0.33, 1.87] |
| 4 Linear growth (crown‐rump length mm/week) | 1 | Mean Difference (IV, Fixed, 95% CI) | Subtotals only | |
| 4.1 Term formula versus unfortified DBM | 1 | 106 | Mean Difference (IV, Fixed, 95% CI) | 0.59 [0.08, 1.10] |
| 5 Linear growth (femoral length mm/week) | 1 | Mean Difference (IV, Fixed, 95% CI) | Subtotals only | |
| 5.1 Term formula versus unfortified DBM | 1 | 106 | Mean Difference (IV, Fixed, 95% CI) | 0.34 [0.13, 0.55] |
| 6 Head growth (mm/week) | 8 | 894 | Mean Difference (IV, Fixed, 95% CI) | 0.85 [0.47, 1.23] |
| 6.1 Term formula versus unfortified DBM | 2 | 128 | Mean Difference (IV, Fixed, 95% CI) | 0.81 [0.15, 1.47] |
| 6.2 Preterm formula versus unfortified DBM | 3 | 221 | Mean Difference (IV, Fixed, 95% CI) | 2.01 [1.21, 2.81] |
| 6.3 Preterm formula versus fortified DBM | 3 | 545 | Mean Difference (IV, Fixed, 95% CI) | 0.30 [‐0.27, 0.86] |
| 7 Weight (kg) at 9 months post‐term | 2 | 369 | Mean Difference (IV, Fixed, 95% CI) | ‐0.03 [‐0.26, 0.21] |
| 7.1 Preterm formula versus unfortified DBM | 2 | 369 | Mean Difference (IV, Fixed, 95% CI) | ‐0.03 [‐0.26, 0.21] |
| 8 Length (cm) at 9 months post‐term | 2 | 369 | Mean Difference (IV, Fixed, 95% CI) | 0.03 [‐0.64, 0.70] |
| 8.1 Preterm formula versus unfortified DBM | 2 | 369 | Mean Difference (IV, Fixed, 95% CI) | 0.03 [‐0.64, 0.70] |
| 9 Head circumference (cm) at 9 months post‐term | 2 | 369 | Mean Difference (IV, Fixed, 95% CI) | 0.20 [‐0.13, 0.53] |
| 9.1 Preterm formula versus unfortified DBM | 2 | 369 | Mean Difference (IV, Fixed, 95% CI) | 0.20 [‐0.13, 0.53] |
| 10 Weight (kg) at 18 months post‐term | 2 | 438 | Mean Difference (IV, Fixed, 95% CI) | 0.10 [‐0.15, 0.35] |
| 10.1 Preterm formula versus unfortified DBM | 2 | 438 | Mean Difference (IV, Fixed, 95% CI) | 0.10 [‐0.15, 0.35] |
| 11 Length (cm) at 18 months post‐term | 2 | 438 | Mean Difference (IV, Fixed, 95% CI) | 0.53 [‐0.15, 1.20] |
| 11.1 Preterm formula versus unfortified DBM | 2 | 438 | Mean Difference (IV, Fixed, 95% CI) | 0.53 [‐0.15, 1.20] |
| 12 Head circumference (cm) at 18 months post‐term | 2 | 438 | Mean Difference (IV, Fixed, 95% CI) | 0.10 [‐0.19, 0.39] |
| 12.1 Preterm formula versus unfortified DBM | 2 | 438 | Mean Difference (IV, Fixed, 95% CI) | 0.10 [‐0.19, 0.39] |
| 13 Weight (kg) at 7.5 to 8 years of age | 2 | 420 | Mean Difference (IV, Fixed, 95% CI) | ‐0.56 [‐1.42, 0.29] |
| 13.1 Preterm formula versus unfortified DBM | 2 | 420 | Mean Difference (IV, Fixed, 95% CI) | ‐0.56 [‐1.42, 0.29] |
| 14 Length (cm) at 7.5 to 8 years of age | 2 | 420 | Mean Difference (IV, Fixed, 95% CI) | 0.05 [‐1.12, 1.23] |
| 14.1 Preterm formula versus unfortified DBM | 2 | 420 | Mean Difference (IV, Fixed, 95% CI) | 0.05 [‐1.12, 1.23] |
| 15 Head circumference (cm) at 7.5 to 8 years of age | 2 | 420 | Mean Difference (IV, Fixed, 95% CI) | ‐0.19 [‐0.54, 0.16] |
| 15.1 Preterm formula versus unfortified DBM | 2 | 420 | Mean Difference (IV, Fixed, 95% CI) | ‐0.19 [‐0.54, 0.16] |
| 16 Bayley Mental Development Index at 18 months | 2 | 387 | Mean Difference (IV, Fixed, 95% CI) | 1.24 [‐2.62, 5.09] |
| 16.1 Preterm formula versus unfortified DBM | 2 | 387 | Mean Difference (IV, Fixed, 95% CI) | 1.24 [‐2.62, 5.09] |
| 17 Bayley Psychomotor Development Index at 18 months | 2 | 387 | Mean Difference (IV, Fixed, 95% CI) | ‐0.32 [‐3.43, 2.79] |
| 17.1 Preterm formula versus unfortified DBM | 2 | 387 | Mean Difference (IV, Fixed, 95% CI) | ‐0.32 [‐3.43, 2.79] |
| 18 Neurodevelopmental disability at 18 months | 2 | 400 | Risk Ratio (M‐H, Fixed, 95% CI) | 1.21 [0.62, 2.35] |
| 18.1 Preterm formula versus unfortified DBM | 2 | 400 | Risk Ratio (M‐H, Fixed, 95% CI) | 1.21 [0.62, 2.35] |
| 19 Bayley‐III | 1 | Mean Difference (IV, Fixed, 95% CI) | Subtotals only | |
| 19.1 Cognitive | 1 | 299 | Mean Difference (IV, Fixed, 95% CI) | 1.60 [‐2.71, 5.91] |
| 19.2 Language | 1 | 299 | Mean Difference (IV, Fixed, 95% CI) | 3.0 [‐2.01, 8.01] |
| 19.3 Motor | 1 | 299 | Mean Difference (IV, Fixed, 95% CI) | 2.20 [‐2.07, 6.47] |
| 20 Bayley‐III score < 70 | 1 | 890 | Risk Ratio (M‐H, Fixed, 95% CI) | 0.78 [0.55, 1.11] |
| 20.1 Cognitive | 1 | 299 | Risk Ratio (M‐H, Fixed, 95% CI) | 0.82 [0.40, 1.68] |
| 20.2 Language | 1 | 295 | Risk Ratio (M‐H, Fixed, 95% CI) | 0.78 [0.47, 1.30] |
| 20.3 Motor | 1 | 296 | Risk Ratio (M‐H, Fixed, 95% CI) | 0.73 [0.37, 1.44] |
| 21 Cerebral palsy | 1 | 299 | Risk Ratio (M‐H, Fixed, 95% CI) | 0.51 [0.21, 1.23] |
| 22 Hearing impairment | 1 | 299 | Risk Ratio (M‐H, Fixed, 95% CI) | 1.02 [0.30, 3.45] |
| 23 Visual impairment | 1 | 299 | Risk Ratio (M‐H, Fixed, 95% CI) | 0.0 [0.0, 0.0] |
| 24 All‐cause mortality | 7 | 1527 | Risk Ratio (M‐H, Fixed, 95% CI) | 1.10 [0.80, 1.50] |
| 24.1 Preterm formula versus unfortified DBM | 3 | 572 | Risk Ratio (M‐H, Fixed, 95% CI) | 1.22 [0.70, 2.14] |
| 24.2 Preterm formula versus fortified DBM | 4 | 955 | Risk Ratio (M‐H, Fixed, 95% CI) | 1.04 [0.71, 1.52] |
| 25 Necrotising enterocolitis | 9 | 1675 | Risk Ratio (M‐H, Fixed, 95% CI) | 1.87 [1.23, 2.85] |
| 25.1 Term formula versus unfortified DBM | 1 | 67 | Risk Ratio (M‐H, Fixed, 95% CI) | 4.73 [0.52, 43.09] |
| 25.2 Preterm formula versus unfortified DBM | 4 | 653 | Risk Ratio (M‐H, Fixed, 95% CI) | 2.99 [0.90, 9.87] |
| 25.3 Preterm formula versus fortified DBM | 4 | 955 | Risk Ratio (M‐H, Fixed, 95% CI) | 1.64 [1.03, 2.61] |
| 26 Days after birth to establish full enteral feeding | 2 | 123 | Mean Difference (IV, Fixed, 95% CI) | 0.33 [‐2.57, 3.23] |
| 26.1 Preterm formula versus unfortified DBM | 1 | 70 | Mean Difference (IV, Fixed, 95% CI) | ‐0.5 [‐3.66, 2.66] |
| 26.2 Preterm formula versus fortified DBM | 1 | 53 | Mean Difference (IV, Fixed, 95% CI) | 4.70 [‐2.56, 11.96] |
| 27 Feeding intolerance or diarrhoea | 2 | 148 | Risk Difference (M‐H, Fixed, 95% CI) | 0.10 [0.01, 0.19] |
| 27.1 Term formula versus unfortified DBM | 1 | 67 | Risk Difference (M‐H, Fixed, 95% CI) | 0.21 [0.04, 0.38] |
| 27.2 Preterm formula versus unfortified DBM | 1 | 81 | Risk Difference (M‐H, Fixed, 95% CI) | 0.02 [‐0.06, 0.10] |
| 28 Invasive infection | 5 | 1025 | Risk Ratio (M‐H, Fixed, 95% CI) | 0.94 [0.79, 1.12] |
| 28.1 Preterm formula versus unfortified DBM | 1 | 70 | Risk Ratio (M‐H, Fixed, 95% CI) | 0.4 [0.08, 1.93] |
| 28.2 Preterm formula versus fortified DBM | 4 | 955 | Risk Ratio (M‐H, Fixed, 95% CI) | 0.95 [0.80, 1.14] |
Comparison 2. Subgroup analysis: formula versus donated breast milk (DBM) given as (i) sole diet or (ii) a supplement to maternal expressed breast milk.
| Outcome or subgroup title | No. of studies | No. of participants | Statistical method | Effect size |
|---|---|---|---|---|
| 1 Weight gain (g/kg/day) | 9 | Mean Difference (IV, Fixed, 95% CI) | Subtotals only | |
| 1.1 Sole diet | 6 | 421 | Mean Difference (IV, Fixed, 95% CI) | 2.65 [1.94, 3.36] |
| 1.2 Supplement | 3 | 607 | Mean Difference (IV, Fixed, 95% CI) | 2.22 [1.23, 3.21] |
| 2 Linear growth (crown‐heel length mm/week) | 8 | Mean Difference (IV, Fixed, 95% CI) | Subtotals only | |
| 2.1 Sole diet | 5 | 283 | Mean Difference (IV, Fixed, 95% CI) | 1.54 [0.98, 2.11] |
| 2.2 Supplement | 3 | 537 | Mean Difference (IV, Fixed, 95% CI) | 0.67 [‐0.04, 1.38] |
| 3 Head growth (mm/week) | 8 | Mean Difference (IV, Fixed, 95% CI) | Subtotals only | |
| 3.1 Sole diet | 5 | 305 | Mean Difference (IV, Fixed, 95% CI) | 1.36 [0.85, 1.88] |
| 3.2 Supplement | 3 | 589 | Mean Difference (IV, Fixed, 95% CI) | 0.24 [‐0.32, 0.80] |
| 4 Weight (kg) at 9 months post‐term | 2 | Mean Difference (IV, Fixed, 95% CI) | Subtotals only | |
| 4.1 Sole diet | 1 | 110 | Mean Difference (IV, Fixed, 95% CI) | 0.20 [‐0.27, 0.67] |
| 4.2 Supplement | 1 | 259 | Mean Difference (IV, Fixed, 95% CI) | ‐0.10 [‐0.37, 0.17] |
| 5 Length (cm) at 9 months post‐term | 2 | Mean Difference (IV, Fixed, 95% CI) | Subtotals only | |
| 5.1 Sole diet | 1 | 110 | Mean Difference (IV, Fixed, 95% CI) | 0.40 [‐0.93, 1.73] |
| 5.2 Supplement | 1 | 259 | Mean Difference (IV, Fixed, 95% CI) | ‐0.10 [‐0.88, 0.68] |
| 6 Head circumference (cm) at 9 months post‐term | 2 | Mean Difference (IV, Fixed, 95% CI) | Subtotals only | |
| 6.1 Sole diet | 1 | 110 | Mean Difference (IV, Fixed, 95% CI) | 0.20 [‐0.45, 0.85] |
| 6.2 Supplement | 1 | 259 | Mean Difference (IV, Fixed, 95% CI) | 0.20 [‐0.18, 0.58] |
| 7 Weight (kg) at 18 months post‐term | 2 | Mean Difference (IV, Fixed, 95% CI) | Subtotals only | |
| 7.1 Sole diet | 1 | 136 | Mean Difference (IV, Fixed, 95% CI) | 0.10 [‐0.37, 0.57] |
| 7.2 Supplement | 1 | 302 | Mean Difference (IV, Fixed, 95% CI) | 0.10 [‐0.19, 0.39] |
| 8 Length (cm) at 18 months post‐term | 2 | Mean Difference (IV, Fixed, 95% CI) | Subtotals only | |
| 8.1 Sole diet | 1 | 136 | Mean Difference (IV, Fixed, 95% CI) | 0.60 [‐0.68, 1.88] |
| 8.2 Supplement | 1 | 302 | Mean Difference (IV, Fixed, 95% CI) | 0.5 [‐0.29, 1.29] |
| 9 Head circumference (cm) at 18 months post‐term | 2 | Mean Difference (IV, Fixed, 95% CI) | Subtotals only | |
| 9.1 Sole diet | 1 | 136 | Mean Difference (IV, Fixed, 95% CI) | 0.10 [‐0.44, 0.64] |
| 9.2 Supplement | 1 | 302 | Mean Difference (IV, Fixed, 95% CI) | 0.10 [‐0.25, 0.45] |
| 10 Weight (kg) at 7.5 to 8 years of age | 2 | Mean Difference (IV, Fixed, 95% CI) | Subtotals only | |
| 10.1 Sole diet | 1 | 130 | Mean Difference (IV, Fixed, 95% CI) | 0.5 [‐1.24, 2.24] |
| 10.2 Supplement | 1 | 290 | Mean Difference (IV, Fixed, 95% CI) | ‐0.90 [‐1.88, 0.08] |
| 11 Length (cm) at 7.5 to 8 years of age | 2 | 420 | Mean Difference (IV, Fixed, 95% CI) | 0.05 [‐1.12, 1.23] |
| 11.1 Sole diet | 1 | 130 | Mean Difference (IV, Fixed, 95% CI) | 1.0 [‐1.26, 3.26] |
| 11.2 Supplement | 1 | 290 | Mean Difference (IV, Fixed, 95% CI) | ‐0.30 [‐1.68, 1.08] |
| 12 Head circumference (cm) at 7.5 to 8 years of age | 2 | 420 | Mean Difference (IV, Fixed, 95% CI) | ‐0.19 [‐0.54, 0.16] |
| 12.1 Sole diet | 1 | 130 | Mean Difference (IV, Fixed, 95% CI) | 0.10 [‐0.56, 0.76] |
| 12.2 Supplement | 1 | 290 | Mean Difference (IV, Fixed, 95% CI) | ‐0.30 [‐0.71, 0.11] |
| 13 Bayley Mental Development Index at 18 months | 2 | Mean Difference (IV, Fixed, 95% CI) | Subtotals only | |
| 13.1 Sole diet | 1 | 114 | Mean Difference (IV, Fixed, 95% CI) | 0.5 [‐6.21, 7.21] |
| 13.2 Supplement | 1 | 273 | Mean Difference (IV, Fixed, 95% CI) | 1.60 [‐3.11, 6.31] |
| 14 Bayley Psychomotor Development Index at 18 months | 2 | Mean Difference (IV, Fixed, 95% CI) | Subtotals only | |
| 14.1 Sole diet | 1 | 114 | Mean Difference (IV, Fixed, 95% CI) | 1.20 [‐4.38, 6.78] |
| 14.2 Supplement | 1 | 273 | Mean Difference (IV, Fixed, 95% CI) | ‐1.0 [‐4.74, 2.74] |
| 15 Neurodevelopmental disability at 18 months | 2 | Risk Ratio (M‐H, Fixed, 95% CI) | Subtotals only | |
| 15.1 Sole diet | 1 | 122 | Risk Ratio (M‐H, Fixed, 95% CI) | 2.06 [0.64, 6.68] |
| 15.2 Supplement | 1 | 278 | Risk Ratio (M‐H, Fixed, 95% CI) | 0.92 [0.40, 2.10] |
| 16 All‐cause mortality | 7 | Risk Ratio (M‐H, Fixed, 95% CI) | Subtotals only | |
| 16.1 Sole diet | 2 | 212 | Risk Ratio (M‐H, Fixed, 95% CI) | 1.70 [0.71, 4.07] |
| 16.2 Supplement | 5 | 1315 | Risk Ratio (M‐H, Fixed, 95% CI) | 1.02 [0.73, 1.44] |
| 17 Necrotising enterocolitis | 9 | Risk Ratio (M‐H, Fixed, 95% CI) | Subtotals only | |
| 17.1 Sole diet | 4 | 360 | Risk Ratio (M‐H, Fixed, 95% CI) | 4.62 [1.47, 14.56] |
| 17.2 Supplement | 5 | 1315 | Risk Ratio (M‐H, Fixed, 95% CI) | 1.56 [0.98, 2.47] |
| 18 Incidence of invasive infection | 5 | Risk Ratio (M‐H, Fixed, 95% CI) | Subtotals only | |
| 18.1 Sole diet | 1 | 53 | Risk Ratio (M‐H, Fixed, 95% CI) | 1.43 [0.97, 2.11] |
| 18.2 Supplement | 4 | 972 | Risk Ratio (M‐H, Fixed, 95% CI) | 0.89 [0.73, 1.08] |
Characteristics of studies
Characteristics of included studies [ordered by study ID]
Corpeleijn 2016.
| Methods | Randomised controlled trial | |
| Participants | 373 VLBW infants with insufficient maternal breast milk during the first 10 days after birth. Six neonatal units in the Netherlands, 2012 to 2014 | |
| Interventions | Preterm formula (N = 190) versus donor breast milk (N = 183) given as a supplement to maternal breast milk (with cow's milk‐based multinutrient fortifier) | |
| Outcomes | Invasive infection, NEC, or mortality during the first 60 days after birth (composite) | |
| Notes | Intervention given during first 10 days after birth only | |
| Risk of bias | ||
| Bias | Authors' judgement | Support for judgement |
| Random sequence generation (selection bias) | Low risk | "Online randomisation software" |
| Allocation concealment (selection bias) | Low risk | Computer randomised |
| Blinding (performance bias and detection bias) All outcomes | Low risk | Families and clinicians "blinded" |
| Incomplete outcome data (attrition bias) All outcomes | Low risk | 99% assessment for primary outcome |
| Selective reporting (reporting bias) | High risk | Protocol specified short‐term growth rate, bone density. Bayley Scores of Infant Development III (at 2 years of age), growth rate (at 2 years of age) as outcomes to be assessed ‐ these are not reported |
| Other bias | Unclear risk | Funded by Mead Johnson Nutrition |
Costa 2018.
| Methods | Randomised controlled trial | |
| Participants | 70 infants (< 33 weeks') with insufficient maternal breast milk during the first 14 days after birth. One neonatal unit in Italy, 2015 | |
| Interventions | Preterm formula (N = 35) versus donor breast milk (N = 35) given as a supplement to maternal breast milk | |
| Outcomes | Time to full enteral feeding (150 mL/kg/day), invasive infection, NEC, bronchopulmonary dysplasia (BPD), or mortality until 36 weeks' post‐menstrual age | |
| Notes | Fortification policy not described (author contacted June 2019 for clarification: simonetta.costa@policlinicogemelli.it) | |
| Risk of bias | ||
| Bias | Authors' judgement | Support for judgement |
| Random sequence generation (selection bias) | Low risk | "Computer‐generated list of random numbers" |
| Allocation concealment (selection bias) | Low risk | "...sequence was concealed from researchers" |
| Blinding (performance bias and detection bias) All outcomes | High risk | Families and clinicians not masked |
| Incomplete outcome data (attrition bias) All outcomes | Low risk | Complete assessment for primary outcome |
| Selective reporting (reporting bias) | Unclear risk | Protocol not available |
| Other bias | Unclear risk | Funder not stated |
Cristofalo 2013.
| Methods | Randomised controlled trial | |
| Participants | 53 newborn infants: birth weight 500 g to 1250 g
Exclusions: major congenital abnormalities, high likelihood of transfer to a non‐study site after 48 hours
Seven neonatal intensive care units: six in USA, one in Austria (Probably) 2010 to 2012 |
|
| Interventions | Preterm formula milk (N = 24) versus fortified (with human milk‐based fortifier), pasteurised donor breast milk (N = 29). Assigned until 91 days after birth, or discharge, or oral feeding at least 50% of feeds | |
| Outcomes | Duration of parenteral nutrition, growth, respiratory support, and NEC | |
| Notes | Additional information on methods courtesy of Dr Cristafalo (April 2014) | |
| Risk of bias | ||
| Bias | Authors' judgement | Support for judgement |
| Random sequence generation (selection bias) | Low risk | Random sequence generated centrally in permuted blocks stratified by investigational site |
| Allocation concealment (selection bias) | Low risk | Allocation outcome provided to an individual at each site who was not connected with the evaluation of outcomes for participants |
| Blinding (performance bias and detection bias) All outcomes | Low risk | Investigators, caregivers, and families were masked |
| Incomplete outcome data (attrition bias) All outcomes | Low risk | 100% follow‐up |
| Selective reporting (reporting bias) | Low risk | No deviations from protocol |
| Other bias | Unclear risk | Funded by Prolacta Bioscience |
Davies 1977.
| Methods | Randomised controlled trial | |
| Participants | 68 preterm infants: 28 to 36 weeks in 2 strata Exclusions: multiple births, congenital abnormalities and chromosomal disorders, congenital infection. Growth‐restricted infants (< 5th percentile) may also have been excluded Department of Child Health, University Hospital of Wales, Cardiff 1972 to 1973 | |
| Interventions | Term formula milk (N = 34) versus unfortified, pasteurised donor breast milk (N = 34). Assigned from birth for 2 months | |
| Outcomes | Rates of weight gain, increase in head circumference and length from birth until 1 month and from 1 month until 2 months | |
| Notes | Infants of mothers who wished to breastfeed were initially given expressed breast milk if unable to feed naturally. There were only 2 such infants; their feeding group was not specified and the results for these infants are not presented separately in the paper. Given that this applies to only 2 out of 68 infants, we have included this study in the review | |
| Risk of bias | ||
| Bias | Authors' judgement | Support for judgement |
| Random sequence generation (selection bias) | Unclear risk | Method not stated |
| Allocation concealment (selection bias) | Unclear risk | Method not stated |
| Blinding (performance bias and detection bias) All outcomes | Unclear risk | No information given |
| Incomplete outcome data (attrition bias) All outcomes | Low risk | 100% follow‐up |
| Selective reporting (reporting bias) | Unclear risk | Protocol not available |
| Other bias | Unclear risk | Funder not stated (likely to be unfunded) |
Gross 1983.
| Methods | Randomised controlled trial | |
| Participants | 67 preterm infants (27 to 33 weeks) Birth weight < 1600 g. Excluded if "congenital anomaly or major disease" Department of Pediatrics, Duke University, USA 1980 to 1982 | |
| Interventions | Term formula milk (N = 26) versus unfortified, pasteurised donor breast milk (N = 41). Feeds were assigned until the infant reached a weight of 1800 g or until withdrawn from the study because of feeding intolerance or NEC | |
| Outcomes | Time to regain birth weight Mean daily gain in weight, length and head circumference, from regaining birth weight until reaching 1800 g Data on adverse events can be determined, although these were not primary endpoints of the study | |
| Notes | Although the report gave information on adverse outcomes, the 7 affected infants were withdrawn from the study and not included in the analyses of growth rates. Therefore, growth data are reported for 20 infants in each arm of the trial | |
| Risk of bias | ||
| Bias | Authors' judgement | Support for judgement |
| Random sequence generation (selection bias) | Low risk | Random number table |
| Allocation concealment (selection bias) | Unclear risk | Method not stated "Any infant withdrawn from the study was replaced by the next one enrolled"; implies lack of allocation concealment for these infants |
| Blinding (performance bias and detection bias) All outcomes | Unclear risk | No information given |
| Incomplete outcome data (attrition bias) All outcomes | Unclear risk | 7 out of 67 (10%) with adverse outcomes (NEC, mortality) were not assessed for growth outcomes. This included 6/26 (23%) in the formula group and 1/41 (2.4%) in the donor breast milk group, so potential bias 100% follow‐up and low risk of bias for mortality and NEC |
| Selective reporting (reporting bias) | Unclear risk | Protocol not available |
| Other bias | Unclear risk | Funded by Mead Johnson Nutrition |
Lucas 1984a.
| Methods | Randomised controlled trial | |
| Participants | 159 infants of birth weight < 1850 g Stratified by birth weight < 1200 g and 1201 g to 1850 g Infants with congenital abnormalities excluded. Infants with intrauterine growth restriction not excluded Study undertaken in the early 1980s in neonatal units in the Anglia region of the UK |
|
| Interventions | Preterm formula milk (N = 76) versus donor (mainly "drip") breast milk (N = 83) The formula was intended to be delivered at 180 mL/kg/day versus the breast milk at 200 mL/kg/day Feeds were assigned until the infant reached a weight of 2000 g or until discharge from the neonatal unit |
|
| Outcomes | Short‐term outcomes:
Time to regain birth weight (62 infants). Rates of change in weight (58 infants), crown‐heel length (26 infants) and head circumference (48 infants) from the point of regained birth weight until discharge from the neonatal unit or reaching a weight of 2000 g
Incidence of NEC ‐ suspected and confirmed reported on complete cohort of 159 infants Longer‐term outcomes: Validated neurological assessment at 18 months in 122 (85%) of surviving infants Bayley Mental Development Index and Psychomotor Development Index at 18 months post‐term, in 114 (94%) of surviving infants suitable for the assessment Growth performance in surviving infants (weight, length and head circumference) at 9 months (110 infants), 18 months (136 infants) and 7.5 to 8 years (130 infants) post‐term |
|
| Notes | The first "interim" report provided data on short‐term growth outcomes in a predefined subset of the total cohort recruited. Follow‐up at 18 months was achieved for more than 80% of surviving infants. Developmental assessments (Bayley Psychomotor and Mental Development Indices) at 18 months post‐term were reported for 114 of the 159 children originally enrolled in the study. 16 children had died and 7 had been lost to follow‐up. 12 surviving children had cerebral palsy affecting fine motor skills and these children were not assessed. A further 10 children were not assessed due to severe visual or hearing impairment or because follow‐up data were obtained by telephone for geographical reasons. | |
| Risk of bias | ||
| Bias | Authors' judgement | Support for judgement |
| Random sequence generation (selection bias) | Low risk | Balanced randomisation sequence was prepared for each centre, within strata defined by birth weight (method of sequence generation not stated explicitly) |
| Allocation concealment (selection bias) | Low risk | Sealed, numbered envelopes |
| Blinding (performance bias and detection bias) All outcomes | Unclear risk | No information given |
| Incomplete outcome data (attrition bias) All outcomes | Low risk | 100% assessment of in‐hospital outcomes and > 80% follow‐up for long‐term outcomes (except for cognitive outcomes (verbal and performance intelligence quotient), which were assessed in about 20% of participants at ages 8 and 16 years) |
| Selective reporting (reporting bias) | Unclear risk | Protocol not available |
| Other bias | Unclear risk | Funded by Farley Health Products |
Lucas 1984b.
| Methods | Randomised controlled trial | |
| Participants | 343 infants of birth weight < 1850 g. Stratified by birth weight < 1200 g and 1201 g to 1850 g. Infants with congenital abnormalities excluded. Infants with intrauterine growth restriction not excluded Study undertaken in the early 1980s in neonatal units in the Anglia region of the UK | |
| Interventions | Preterm formula milk (N = 173) versus banked donor breast milk (N = 170) as a supplement to the mother's own breast milk | |
| Outcomes | Short‐term outcomes: time to regain birth weight (132 infants). Rates of change in weight (115 infants), crown‐heel length (45 infants) and head circumference (97 infants) from the point of regained birth weight until discharge from the neonatal unit or reaching a weight of 2000 g Incidence of NEC ‐ suspected and confirmed reported on complete cohort of 343 infants Longer‐term outcomes: Validated neurological assessment, at 18 months, in 278 (88%) of surviving infants Bayley Mental Development Index and Psychomotor Development Index at 18 months, corrected for preterm gestation, in 273 (96%) of surviving infants suitable for the assessment Growth performance in surviving infants (weight, length and head circumference) at 9 months (259 infants), 18 months (302 infants) and 7.5 years to 8 years (290 infants) post‐term | |
| Notes | The first "interim" report provided data on short‐term growth outcomes in a predefined subset of the total cohort recruited. Developmental assessments (Bayley Psychomotor and Mental Development Indices) at 18 months post‐term were reported for 273 of 343 children originally enrolled in the study. 29 children had died and 12 had been lost to follow‐up. 24 surviving children had cerebral palsy affecting fine motor skills and these children were not assessed. A further 5 children were not assessed due to severe visual or hearing impairment or because follow‐up data were obtained by telephone for geographical reasons. | |
| Risk of bias | ||
| Bias | Authors' judgement | Support for judgement |
| Random sequence generation (selection bias) | Unclear risk | Not stated |
| Allocation concealment (selection bias) | Low risk | Sealed, numbered envelopes |
| Blinding (performance bias and detection bias) All outcomes | Unclear risk | No information given |
| Incomplete outcome data (attrition bias) All outcomes | Low risk | 100% assessment of in‐hospital outcomes and > 80% follow‐up for long‐term outcomes except for cognitive outcomes (verbal and performance intelligence quotient) which were assessed in about 20% of participants at ages 8 and 16 years) |
| Selective reporting (reporting bias) | Unclear risk | Protocol not available |
| Other bias | Unclear risk | Funded by Farley Health Products |
O'Connor 2016.
| Methods | Randomised controlled trial | |
| Participants | 363 VLBW infants whose mothers intended to breastfeed but whose own milk became insufficient from birth until 90 days of age or hospital discharge Four neonatal units in Ontario, Canada, 2010 to 2012 | |
| Interventions | Preterm formula (N = 182) versus donor breast milk (N = 181) given as a supplement to maternal breast milk (bovine‐based multinutrient‐fortified) | |
| Outcomes | Cognitive composite score on the Bayley Scales of Infant and Toddler Development, Third Edition (Bayley‐III) at 18 months post‐term Bayley‐III language and motor composite scores, mortality and morbidity index (late‐onset infection, NEC (Bell stage ≥ II), chronic lung disease, or retinopathy of prematurity (treated medically or surgically), and growth during the feeding intervention |
|
| Notes | "A similar percentage of infants in the donor milk group (28.2%) and formula group (26.9%) were exclusively fed mother’s milk". "Infants in both groups were fed substantial amounts of maternal milk, with approximately 25% in each group receiving only maternal milk, and the remainder receiving about 60% maternal milk". |
|
| Risk of bias | ||
| Bias | Authors' judgement | Support for judgement |
| Random sequence generation (selection bias) | Low risk | "Computer‐driven third‐party randomisation service" |
| Allocation concealment (selection bias) | Low risk | Computer‐randomised |
| Blinding (performance bias and detection bias) All outcomes | Low risk | Families and clinicians "blinded" |
| Incomplete outcome data (attrition bias) All outcomes | Low risk | > 90% assessment for primary outcome |
| Selective reporting (reporting bias) | Low risk | No protocol deviations |
| Other bias | Unclear risk | Funded by the Canadian Institutes of Health Research (MOP No. 102638) and the Ontario Ministry of Health and Long‐Term Care (grant No. 06465) |
Raiha 1976.
| Methods | Randomised controlled trial | |
| Participants | 106 preterm infants of birth weight < 2100 g, but between 10th and 90th centiles for birth weight. Infants excluded if evidence of "physical abnormality or obvious disease" Premature Unit, Helsinki University Children's Hospital, 1972 to 1975 |
|
| Interventions | Term formula milk (N = 84) versus unfortified donor breast milk (N = 22) Feeds continued until a weight of 2.4 kg was attained or until infants were withdrawn from the study because of a "medical complication" |
|
| Outcomes | Time, from birth, to regain birth weight. Rate of weight gain from birth and from point of regained birth weight | |
| Notes | Donor breast milk was given at a 170 mL/kg/day, compared with formula at 150 mL/kg/day, "in order to achieve equivalent calorie inputs". Donor breast milk‐fed infants were given supplemental vitamins | |
| Risk of bias | ||
| Bias | Authors' judgement | Support for judgement |
| Random sequence generation (selection bias) | High risk | Randomly selected permutations of 1, 2, 3, 4 were prepared in advance, which were used to allocate to the 4 formula arms. Every 5th infant was assigned to pooled breast milk. Hence, it was not strictly random. Also, no details of how the permutations were generated |
| Allocation concealment (selection bias) | High risk | Every 5th infant was assigned to pooled breast milk so allocation concealment may have been suboptimal |
| Blinding (performance bias and detection bias) All outcomes | Unclear risk | No information given |
| Incomplete outcome data (attrition bias) All outcomes | Low risk | 95% follow‐up (5/106 infants who were enrolled were dropped from the study for medical reasons) |
| Selective reporting (reporting bias) | Unclear risk | Protocol not available |
| Other bias | Unclear risk | Funded by Wyeth Laboratories, the Juselius Foundation, and the New York State Department of Mental Hygiene |
Schanler 2005.
| Methods | Randomised controlled trial | |
| Participants | 173 infants of gestational age < 30 weeks, whose mothers intended to breastfeed but whose own milk became insufficient from birth until 90 days of age or hospital discharge North Shore University Hospital, New York, USA, 2000 to 2003 | |
| Interventions | Preterm formula (N = 81) versus unfortified donor breast milk (N = 92) given as a supplement to maternal breast milk | |
| Outcomes | Incidence of late‐onset invasive infection and NEC, duration of hospitalisation and growth during the study period (weight gain, head circumference increment and length increment) | |
| Notes | Participating infants received small quantities (20 mL/kg/day) of their own mother's milk during the first week after birth and continued for 3 to 5 days before the volume was advanced. Milk intake was increased by 20 mL/kg/day to 100 mL/kg/day at which time human milk fortifier was added. Subsequently the volume of fortified human milk was advanced by 20 mL/kg/day until 160 mL/kg/day was achieved. If no mother's milk was available and the baby was assigned to donor breast milk then a similar advancement and fortification protocol was followed. For all infants, adjustments in milk intake between 160 mL/kg/day and 200 mL/kg/day were recommended to ensure an average weekly weight gain of at least 15 g/kg per day. 17 enrolled infants were switched from donor breast milk to preterm formula because of poor weight gain but all of these analyses were by intention‐to‐treat. However, 7 infants who were never fed (3 in the donor milk group, 4 in the formula group) were excluded from the analyses. | |
| Risk of bias | ||
| Bias | Authors' judgement | Support for judgement |
| Random sequence generation (selection bias) | Low risk | Method not stated explicitly but very likely to be computer‐generated since the random sequence was "an unbalanced blocked design, according to the stratification variables of gestational age and receipt of prenatal steroids" |
| Allocation concealment (selection bias) | Low risk | Allocation was "performed by the research nurse coordinator with sealed opaque envelopes" |
| Blinding (performance bias and detection bias) All outcomes | High risk | Unblinded |
| Incomplete outcome data (attrition bias) All outcomes | Low risk | Complete follow‐up |
| Selective reporting (reporting bias) | Unclear risk | Protocol not available |
| Other bias | Unclear risk | Funded by the US National Institute of Child Health and Human Development and the National Institutes of Health General Clinical Research Center, Baylor College of Medicine, USA |
Schultz 1980.
| Methods | Randomised controlled trial | |
| Participants | 20 preterm or LBW infants; all infants were "physically normal with no further signs of disease" Department of Paediatrics, University Medical School, Pecs, Hungary, prior to 1980 | |
| Interventions | Term formula milk (N = 10) versus donor breast milk (N = 10) for at least 4 weeks from birth | |
| Outcomes | Time, from birth, to regain birth weight (mean but no SD reported) Mean weight gain from birth and from regaining birth weight calculable from graph but no SD | |
| Notes | — | |
| Risk of bias | ||
| Bias | Authors' judgement | Support for judgement |
| Random sequence generation (selection bias) | Unclear risk | Method not stated |
| Allocation concealment (selection bias) | Unclear risk | No information given |
| Blinding (performance bias and detection bias) All outcomes | Unclear risk | No information given |
| Incomplete outcome data (attrition bias) All outcomes | Low risk | 100% follow‐up |
| Selective reporting (reporting bias) | Unclear risk | Protocol not available |
| Other bias | Unclear risk | Funder not stated |
Tyson 1983.
| Methods | Randomised controlled trial | |
| Participants | 81 VLBW infants, excluding infants with "any significant illness" or those who required ventilatory support at day 10 Parklands Memorial Hospital, Dallas, USA, early 1980s | |
| Interventions | Preterm formula milk (N = 44) versus donor breast milk (N = 37). The donor breast milk was not pasteurised. Feeds were allocated on the 10th day of life, and continued until the infant reached a weight of 2000 g or until withdrawn from the study because of "any illness requiring intravenous infusion of fat or protein". | |
| Outcomes | Mean daily rates of change in weight, crown‐heel length and head circumference from the 10th until the 30th day after birth | |
| Notes | The feeds were not allocated until the 10th day after birth in order to avoid the use of protein‐enriched formula "when active growth was unlikely". In the first 9 days of life the infants received a term formula or maternal expressed breast milk (if available). Although the report gave information on adverse outcomes, including NEC, the 5 affected infants were withdrawn from the study and not included in the analyses of growth rates. | |
| Risk of bias | ||
| Bias | Authors' judgement | Support for judgement |
| Random sequence generation (selection bias) | Unclear risk | Infants were stratified by birth weight and randomised, but how the sequence was generated is not stated |
| Allocation concealment (selection bias) | Low risk | Concealed envelope opened only after informed parental consent obtained |
| Blinding (performance bias and detection bias) All outcomes | Unclear risk | No information given |
| Incomplete outcome data (attrition bias) All outcomes | Low risk | Five infants with adverse outcomes did not have growth data |
| Selective reporting (reporting bias) | Unclear risk | Protocol not available |
| Other bias | Unclear risk | Funded by the Robert Wood Johnson Foundation, by the University of Texas Health Science Center at Dallas, and by a grant from Ross Laboratories |
LBW: low birth weight NEC: necrotising enterocolitis SD: standard deviation VLBW: very low birth weight
Characteristics of excluded studies [ordered by study ID]
| Study | Reason for exclusion |
|---|---|
| Brandstetter 2018 | Development and proposal of a "decision tree" for prioritising donor breast milk use |
| Castellano 2019 | Retrospective cohort study if impact of the availability of donor human milk |
| Colaizy 2015 | Review article describing ongoing trials by authors, but without outcome data |
| Cooper 1984 | Non‐randomised study in preterm infants of feeding with formula or donor breast milk |
| Hair 2014 | Randomised trial of human milk "cream" supplementation in very low birth weight infants |
| Jarvenpaa 1983 | Non‐randomised study comparing growth in low birth weight infants fed formula versus breast milk |
| Marseglia 2015 | Randomised trial of a new preterm formula versus another formula, and a "reference" control group of infants fed with human milk based on maternal preference |
| Narayanan 1982 | Comparative trial in low birth weight infants of feeding with formula milk versus "expressed human milk". Many of the infants were allocated to the human milk groups by preference rather than randomly |
| O'Connor 2003 | Non‐randomised study comparing growth, feeding tolerance, morbidity and development in low birth weight infants fed human milk or formula |
| Perrella 2015 | Non‐randomised study of gastric emptying rates in infants fed with fortified versus non‐fortified human milk |
| Putet 1984 | Non‐randomised study of feeding very preterm infants with pooled human milk versus formula |
| Sullivan 2010 | Randomised controlled trial of feeding very low birth weight infants with formula plus bovine milk‐based fortifier versus donor human milk plus human milk‐based fortifier; excluded because type of fortifier was cointervention |
| Svenningsen 1982 | Randomised trial of two different formulas versus breast milk in low birth weight infants‐ most infants in the breast milk group received their own mother's expressed milk rather than donor breast milk (not randomised) |
| Tewari 2018 | Randomised trial of early versus late feeding of very preterm infants with maternal or donor breast milk |
Characteristics of studies awaiting assessment [ordered by study ID]
Perez 2015.
| Methods | Quasi‐randomised controlled trial |
| Participants | 200 low birth weight infants with insufficient maternal breast milk from birth to three weeks or until hospital discharge Neonatal units in San Carlos, Guatemala, 2012 to 2013 |
| Interventions | Preterm formula (N = 100) versus donor breast milk (N = 100) given as a supplement to maternal breast milk (unfortified) |
| Outcomes | Growth parameters for three weeks Necrotising enterocolitis (unclear how defined) |
| Notes | Awaiting further information from authors regarding methods and findings |
Characteristics of ongoing studies [ordered by study ID]
NCT01232725.
| Trial name or title | Donor human milk and neurodevelopmental outcomes in very low birthweight (VLBW) infants |
| Methods | Randomised controlled trial |
| Participants | 121 very low birth weight infants Two neonatal units in USA (2009‐15) |
| Interventions | Donor human milk (obtained from the Mother's Milk of Iowa), "fortified as appropriate" versus preterm formula |
| Outcomes | Primary: Bayley Scales of Infant Development, III scores (18 to 22 months' adjusted age) |
| Starting date | 2009 |
| Contact information | Tarah Colaizy: tarah‐colaizy@uiowa.edu |
| Notes | Awaiting publication (preliminary data available from author but not yet sufficiently complete for inclusion) ClinicalTrials.gov Identifier: NCT01232725 |
NCT01390753.
| Trial name or title | Role of human milk bank in the protection of severe respiratory disease in very low birth weight premature infants |
| Methods | Randomised controlled trial |
| Participants | 300 very low birth weight infants |
| Interventions | Donor breast milk and preterm formula versus preterm formula alone |
| Outcomes | Incidence of respiratory infections in infancy |
| Starting date | 2012 |
| Contact information | Fernando Pedro Polack: malinez@infant.org.ar |
| Notes | www.clinicaltrials.gov/ct2/show/NCT01390753 |
NCT01534481.
| Trial name or title | Donor milk vs. formula in extremely low birth weight (ELBW) infants (the MILK trial) |
| Methods | Randomised controlled trial |
| Participants | 670 extremely low birth weight infants |
| Interventions | Donor breast milk (provided by the Human Milk Banking Association of North America) versus preterm formula |
| Outcomes | Primary: Bayley Scales of Infant Development III (BSID III) at 22 to 26 months post‐term |
| Starting date | 2012 (estimated completion 2018) |
| Contact information | Tarah Colaizy: tarah‐colaizy@uiowa.edu |
| Notes | Eunice Kennedy Shriver National Institute of Child Health and Human Development (NICHD) ‐ sponsored in 17 centres, USA www.clinicaltrials.gov/ct2/show/NCT01534481?term=breast+milk&cond=weight&rank=5 |
NCT01686477.
| Trial name or title | PREterM FOrmula Or Donor breast milk for premature babies (PREMFOOD) |
| Methods | Randomised controlled trial (3 arms) |
| Participants | 66 very preterm infants |
| Interventions | Donor breast milk or donor breast milk with fortifier or preterm formula |
| Outcomes | Primary: total body adiposity measured by magnetic resonance imaging (MRI) at "term equivalent" |
| Starting date | 2012 |
| Contact information | Luke Mills: l.mills@imperial.ac.uk |
| Notes | www.clinicaltrials.gov/ct2/show/NCT01686477 |
Differences between protocol and review
None.
Contributions of authors
William McGuire (WM) and Mary Anthony (MA) developed the protocol and undertook the original review in 2001. Maria Quigley (MQ) and WM revised the protocol and updated the review in 2007 and in 2014. Nicholas D Embleton (NDE), MQ, and WM updated the review in 2018 and 2019.
Sources of support
Internal sources
National Perinatal Epidemiology Unit, UK.
Centre for Reviews and Dissemination, University of York, UK.
External sources
-
National Institute for Health Research (NIHR), UK.
This report is independent research funded by a UK NIHR Cochrane Programme Grant (16/114/03). The views expressed in this publication are those of the review authors and are not necessarily those of the National Health Service, the NIHR, or the UK Department of Health.
-
Vermont Oxford Network, USA.
Cochrane Neonatal Reviews are produced with support from Vermont Oxford Network, a worldwide collaboration of health professionals dedicated to providing evidence‐based care of the highest quality for newborn infants and their families.
-
The Gerber Foundation, USA.
Editorial support for this review, as part of a suite of preterm nutrition reviews, has been provided by a grant from The Gerber Foundation. The Gerber Foundation is a separately endowed, private, 501(c)(3) foundation not related to Gerber Products Company in any way.
Declarations of interest
MQ: nothing to declare.
NDE declares the following: receiving a research grant award for an RCT of breast milk products by Prolacta Bioscience, 2017; receiving a grant from Danone Early Life Nutrition to support a study on feeding in late and moderately preterm infants, 2018; receiving a grant from Nestle Nutrition for transcriptomic analyses of gut tissue, 2016; lectures with Wyeth Nutrition in 2017, Nestle Nutrition Institute in 2017 and 2018, Philipps in 2017, and Fresenius, 2017.
WM: nothing to declare.
Core editorial and administrative support for this review has been provided by a grant from The Gerber Foundation. The Gerber Foundation is a separately endowed, private foundation, distinct from the Gerber Products Company. The grantor has no input on the content of the review or the editorial process.
In order to maintain the utmost editorial independence for this Cochrane Review, an editor outside of the Cochrane Neonatal core editorial team who is not receiving any financial remuneration from the grant, Mohan Pammi, was the Sign‐off Editor for this review. Additionally, a Senior Editor from the Cochrane Children and Families Network, Robert Boyle, assessed and signed off on this Cochrane Review.
Edited (no change to conclusions)
References
References to studies included in this review
Corpeleijn 2016 {published data only}
- Corpeleijn WE, Waard M, Christmann V, Goudoever JB, Jansen‐van der Weide MC, Kooi EM, et al. Effect of donor milk on severe infections and mortality in very low‐birth‐weight Infants: the early nutrition study randomized clinical trial. JAMA Pediatrics 2016;170(7):654‐61. [DOI: 10.1001/jamapediatrics.2016.0183; PUBMED: 27135598] [DOI] [PubMed] [Google Scholar]
Costa 2018 {published data only}
- Costa S, Maggio L, Alighieri G, Barone G, Cota F, Vento G. Tolerance of preterm formula versus pasteurized donor human milk in very preterm infants: a randomized non‐inferiority trial. Italian Journal of Pediatrics 2018;44(1):96. [DOI: 10.1186/s13052-018-0532-7; PUBMED: 30115086] [DOI] [PMC free article] [PubMed] [Google Scholar]
Cristofalo 2013 {published data only}
- Cristofalo EA, Schanler RJ, Blanco CL, Sullivan S, Trawoeger R, Kiechl‐Kohlendorfer U, et al. Randomized trial of exclusive human milk versus preterm formula diets in extremely premature infants. Journal of Pediatrics 2013;163(6):1592‐5.e1. [DOI: 10.1016/j.jpeds.2013.07.011; PUBMED: 23968744] [DOI] [PubMed] [Google Scholar]
Davies 1977 {published data only}
- Davies DP. Adequacy of expressed breast milk for early growth of preterm infants. Archives of Disease in Childhood 1977;52(4):296‐301. [DOI: 10.1136/adc.52.4.296; PUBMED: 558739] [DOI] [PMC free article] [PubMed] [Google Scholar]
Gross 1983 {published data only}
- Gross SJ. Growth and biochemical response of preterm infants fed human milk or modified infant formula. New England Journal of Medicine 1983;308(5):237‐41. [DOI: 10.1056/NEJM198302033080501; PUBMED: 6848932] [DOI] [PubMed] [Google Scholar]
Lucas 1984a {published data only}
- Lucas A, Cole TJ. Breast milk and neonatal necrotising enterocolitis. Lancet 1990;336(8730):1519‐23. [DOI: 10.1016/0140-6736(90)93304-8; PUBMED: 1979363] [DOI] [PubMed] [Google Scholar]
- Lucas A, Gore SM, Cole TJ, Bamford MF, Dossetor JF, Barr I, et al. Multicentre trial on feeding low birthweight infants: effects of diet on early growth. Archives of Disease in Childhood 1984;59(8):722‐30. [PUBMED: 6476868 ] [DOI] [PMC free article] [PubMed] [Google Scholar]
- Lucas A, Morley R, Cole TJ, Gore SM. A randomised multicentre study of human milk versus formula and later development in preterm infants. Archives of Disease in Childhood. Fetal and Neonatal Edition 1994;70(2):F141‐6. [PUBMED: 8154907] [DOI] [PMC free article] [PubMed] [Google Scholar]
- Lucas A, Morley R, Cole TJ, Gore SM, Davis JA, Bamford MF, et al. Early diet in preterm babies and developmental status in infancy. Archives of Disease in Childhood 1989;64(11):1570‐8. [PUBMED: 2690739] [DOI] [PMC free article] [PubMed] [Google Scholar]
- Morley R, Lucas A. Randomized diet in the neonatal period and growth performance until 7.5‐8 y of age in preterm children. American Journal of Clinical Nutrition 2000;71(3):822‐8. [DOI: 10.1093/ajcn/71.3.822; PUBMED: 10702179] [DOI] [PubMed] [Google Scholar]
Lucas 1984b {published data only}
- Lucas A, Cole TJ. Breast milk and neonatal necrotising enterocolitis. Lancet 1990;336(8730):1519‐23. [DOI: 10.1016/0140-6736(90)93304-8; PUBMED: 1979363] [DOI] [PubMed] [Google Scholar]
- Lucas A, Gore SM, Cole TJ, Bamford MF, Dossetor JF, Barr I, et al. Multicentre trial on feeding low birthweight infants: effects of diet on early growth. Archives of Disease in Childhood 1984;59(8):722‐30. [DOI: 10.1136/adc.59.8.722; PUBMED: 6476868] [DOI] [PMC free article] [PubMed] [Google Scholar]
- Lucas A, Morley R, Cole TJ, Gore SM. A randomised multicentre study of human milk versus formula and later development in preterm infants. Archives of Disease in Childhood 1994;70:F141‐6. [DOI: 10.1136/fn.70.2.f141; PUBMED: 8154907] [DOI] [PMC free article] [PubMed] [Google Scholar]
- Lucas A, Morley R, Cole TJ, Gore SM, Davis JA, Bamford MF, et al. Early diet in preterm babies and developmental status in infancy. Archives of Disease in Childhood 1989;64(11):1570‐8. [DOI: 10.1136/adc.64.11.1570; PUBMED: 2690739] [DOI] [PMC free article] [PubMed] [Google Scholar]
- Morley R, Lucas A. Randomized diet in the neonatal period and growth performance until 7.5‐8 y of age in preterm children. American Journal of Clinical Nutrition 2000;71(3):822‐8. [DOI: 10.1093/ajcn/71.3.822; PUBMED: 10702179] [DOI] [PubMed] [Google Scholar]
O'Connor 2016 {published data only}
- O'Connor DL, Gibbins S, Kiss A, Bando N, Brennan‐Donnan J, Ng E, et al. GTA DoMINO Feeding Group. Effect of supplemental donor human milk compared with preterm formula on neurodevelopment of very low‐birth‐weight infants at 18 months: a randomized clinical trial. JAMA 2016;316(18):1897‐905. [DOI: 10.1001/jama.2016.16144; PUBMED: 27825008] [DOI] [PubMed] [Google Scholar]
- Unger S, Gibbins S, Zupancic J, O'Connor DL. DoMINO: Donor milk for improved neurodevelopmental outcomes. BMC Pediatrics 2014;14:123. [DOI: 10.1186/1471-2431-14-123; PUBMED: 24884424] [DOI] [PMC free article] [PubMed] [Google Scholar]
Raiha 1976 {published data only}
- Gaull GE, Rassin DK, Raiha NC, Heinonen K. Milk protein quantity and quality in low‐birth‐weight infants. III. Effects on sulfur amino acids in plasma and urine. Journal of Pediatrics 1977;90(3):348‐55. [PUBMED: 839326] [DOI] [PubMed] [Google Scholar]
- Raiha NC, Heinonen K, Rassin DK, Gaull GE. Milk protein quantity and quality in low‐birthweight infants: I. Metabolic responses and effects on growth. Pediatrics 1976;57(5):659‐84. [PUBMED: 7767] [PubMed] [Google Scholar]
- Rassin DK, Gaull GE, Heinonen K, Raiha NC. Milk protein quantity and quality in low‐birth‐weight infants: II. Effects on selected aliphatic amino acids in plasma and urine. Pediatrics 1977;59(3):407‐22. [PUBMED: 840561] [PubMed] [Google Scholar]
- Rassin DK, Gaull GE, Raiha NC, Heinonen K. Milk protein quantity and quality in low‐birth‐weight infants. IV. Effects on tyrosine and phenylalanine in plasma and urine. Journal of Pediatrics 1977;90(3):356‐60. [PUBMED: 839327] [DOI] [PubMed] [Google Scholar]
Schanler 2005 {published data only}
- Schanler RJ, Lau C, Hurst NM, Smith EO. Randomized trial of donor human milk versus preterm formula as substitutes for mothers' own milk in the feeding of extremely premature infants. Pediatrics 2005;116(2):400‐6. [DOI: 10.1542/peds.2004-1974; PUBMED: 16061595] [DOI] [PubMed] [Google Scholar]
Schultz 1980 {published data only}
- Schultz K, Soltesz G, Mestyan J. The metabolic consequences of human milk and formula feeding in premature infants. Acta Paediatrica Scandinavica 1980;69(5):647‐52. [PUBMED: 7234386] [DOI] [PubMed] [Google Scholar]
Tyson 1983 {published data only}
- Tyson JE, Lasky RE, Mize CE, Richards CJ, Blair‐Smith N, Whyte R, et al. Growth, metabolic response, and development in very‐low‐birth‐weight infants fed banked human milk or enriched formula. I. Neonatal findings. Journal of Pediatrics 1983;103(1):95‐104. [PUBMED: 6864403] [DOI] [PubMed] [Google Scholar]
References to studies excluded from this review
Brandstetter 2018 {published data only}
- Brandstetter S, Mansen K, DeMarchis A, Nguyen Quyhn N, Engmann C, et al. A decision tree for donor human milk: an example tool to protect, promote, and support breastfeeding. Frontiers in Pediatrics 2018;6:324. [DOI: 10.3389/fped.2018.00324; PUBMED: 30430103] [DOI] [PMC free article] [PubMed] [Google Scholar]
Castellano 2019 {published data only}
- Castellano Yanez C, Castillo Barrio B, Munoz Labian MD, Ortiz Movilla R, Garcia Lara NR, Royuela Vicente A, et al. Providing very preterm infants with donor human milk led to faster breastfeeding rates but worse biometric gains. Acta Paediatrica 2019;108(4):766‐7. [PUBMED: 30537331] [DOI] [PubMed] [Google Scholar]
Colaizy 2015 {published data only}
- Colaizy TT. Donor human milk for very low birth weights: patterns of usage, outcomes, and unanswered questions. Current Opinion in Pediatrics 2015;27(2):172‐6. [DOI: 10.1097/MOP.0000000000000201; PUBMED: 25689453] [DOI] [PMC free article] [PubMed] [Google Scholar]
Cooper 1984 {published data only}
- Cooper PA, Rothberg AD, Pettifor JM, Bolton KD, Devenhuis S. Growth and biochemical response of premature infants fed pooled preterm milk or special formula. Journal of Pediatric Gastroenterology and Nutrition 1984;3(5):749‐54. [PUBMED: 6502375] [DOI] [PubMed] [Google Scholar]
Hair 2014 {published data only}
- Hair AB, Bergner EM, Lee ML, Moreira AG, Hawthorne KM, Rechtman DJ, et al. Premature infants 750‐1,250 g birth weight supplemented with a novel human milk‐derived cream are discharged sooner. Breastfeeding Medicine 2016;11:133‐7. [DOI: 10.1089/bfm.2015.0166; PUBMED: 26982282] [DOI] [PMC free article] [PubMed] [Google Scholar]
- Hair AB, Blanco CL, Moreira AG, Hawthorne KM, Lee ML, Rechtman DJ, et al. Randomized trial of human milk cream as a supplement to standard fortification of an exclusive human milk‐based diet in infants 750‐1250 g birth weight. Journal of Pediatrics 2014;165(5):915‐20. [DOI: 10.1016/j.jpeds.2014.07.005; PUBMED: 25130571] [DOI] [PubMed] [Google Scholar]
Jarvenpaa 1983 {published data only}
- Jarvenpaa AL, Raiha NC, Rassin DK, Gaull GE. Feeding the low‐birth‐weight infant: I. Taurine and cholesterol supplementation of formula does not affect growth and metabolism. Pediatrics 1983;71(2):171‐8. [PUBMED: 6823418] [PubMed] [Google Scholar]
Marseglia 2015 {published data only}
- Marseglia L, Pagano G, Arco A, Barberi I, Biasucci G, Riboni S, et al. A new formula for premature infants: effects on growth and nutritional status. Journal of Maternal‐Fetal & Neonatal Medicine 2015;28(12):1482‐5. [DOI: 10.3109/14767058.2014.958460; PUBMED: 25157499] [DOI] [PubMed] [Google Scholar]
Narayanan 1982 {published data only}
- Narayanan I, Prakash K, Gujral VV. The value of human milk in the prevention of infection in the high‐risk low‐birth‐weight infant. Journal of Pediatrics 1981;99(3):496‐8. [PUBMED: 6790690] [DOI] [PubMed] [Google Scholar]
- Narayanan I, Prakash K, Prabhakar AK, Gujral VV. A planned prospective evaluation of the anti‐infective property of varying quantities of expressed human milk. Acta Paediatrica Scandinavica 1982;71(3):441‐5. [PUBMED: 7136659] [DOI] [PubMed] [Google Scholar]
O'Connor 2003 {published data only}
- O'Connor DL, Jacobs J, Hall R, Adamkin D, Auestad N, Castillo M, et al. Growth and development of premature infants fed predominantly human milk, predominantly premature infant formula, or a combination of human milk and premature formula. Journal of Pediatric Gastroenterology and Nutrition 2003;37(4):437‐46. [PUBMED: 14508214] [DOI] [PubMed] [Google Scholar]
Perrella 2015 {published data only}
- Perrella SL, Hepworth AR, Gridneva Z, Simmer KN, Hartmann PE, Geddes DT. Gastric emptying and curding of pasteurized donor human milk and mother's own milk in preterm infants. Journal of Pediatric Gastroenterology and Nutrition 2015;61(1):125‐9. [DOI: 10.1097/MPG.0000000000000776; PUBMED: 25729886] [DOI] [PubMed] [Google Scholar]
Putet 1984 {published data only}
- Putet G, Senterre J, Rigo J, Salle B. Nutrient balance, energy utilization, and composition of weight gain in very‐low‐birth‐weight infants fed pooled human milk or a preterm formula. Journal of Pediatrics 1984;105(1):79‐85. [PUBMED: 6737152] [DOI] [PubMed] [Google Scholar]
Sullivan 2010 {published data only}
- Sullivan S, Schanler RJ, Kim JH, Patel AL, Trawoger R, Kiechl‐Kohlendorfer U, et al. An exclusively human milk‐based diet is associated with a lower rate of necrotizing enterocolitis than a diet of human milk and bovine milk‐based products. Journal of Pediatrics 2010;156(4):562‐7. [DOI: 10.1016/j.jpeds.2009.10.040; PUBMED: 20036378] [DOI] [PubMed] [Google Scholar]
Svenningsen 1982 {published data only}
- Svenningsen NW, Lindroth M, Lindquist B. A comparative study of varying protein intake in low birthweight infant feeding. Acta Paediatrica Scandinavica Supplement 1982;296:28‐31. [PUBMED: 6961737] [DOI] [PubMed] [Google Scholar]
- Svenningsen NW, Lindroth M, Lindquist B. Growth in relation to protein intake of low birth weight infants. Early Human Development 1982;6(1):47‐58. [PUBMED: 7056196] [DOI] [PubMed] [Google Scholar]
Tewari 2018 {published data only}
- Tewari VV, Dubey SK, Kumar R, Vardhan S, Sreedhar CM, Gupta G. Early versus late enteral feeding in preterm intrauterine growth restricted neonates with antenatal Doppler abnormalities: an open‐label randomized trial. Journal of Tropical Pediatrics 2018;64(1):4‐14. [DOI: 10.1093/tropej/fmx018; PUBMED: 28369652] [DOI] [PubMed] [Google Scholar]
References to studies awaiting assessment
Perez 2015 {published data only}
- Calderón Pérez, ML. Effects of feeding with pasteurized human milk compared to standard premature formula in infants less than 2,500 grams [Efectos de la alimentación con leche humana pasteurizada comparada con fórmula para prematuro estándar en recién nacidos menores de 2,500 gramos] [Masters thesis]. San Carlos, Guatemala: University of San Carlos, 2015. [http://www.repositorio.usac.edu.gt/1907/] [Google Scholar]
References to ongoing studies
NCT01232725 {published data only}
- NCT01232725. Donor human milk and neurodevelopmental outcomes in very low birthweight (VLBW) infants [Clinical epidemiologic and biologic studies of donor human milk and breastfeeding]. clinicaltrials.gov/show/NCT01232725 (first received 02 November 2010).
NCT01390753 {published data only}
- NCT01390753. Role of human milk bank in the protection of severe respiratory disease in very low birth weight premature infants [Preventing respiratory disease hospitalizations in premature infants fed donor human milk]. clinicaltrials.gov/show/NCT01390753 (first received 11 July 2011).
NCT01534481 {published data only}
- NCT01534481. Donor milk vs. formula in extremely low birth weight (ELBW) infants [Neurodevelopmental effects of donor human milk vs. preterm formula in extremely low birth weight (ELBW) infants]. clinicaltrials.gov/show/NCT01534481 (first received 16 February 2012).
NCT01686477 {published data only}
- NCT01686477. Preterm formula or donor breast milk for premature babies [Preterm formula or donor breast milk to make up any shortfall in mother's own milk]. clinicaltrials.gov/show/NCT01686477 (first received 18 September 2012).
Additional references
AAP 2012
- American Academy of Pediatrics. Breastfeeding and the use of human milk. Pediatrics 2012;129(3):e827–41. [DOI: 10.1542/peds.2011-3552; PUBMED: 22371471] [DOI] [PubMed] [Google Scholar]
Agostoni 2010
- Agostoni C, Buonocore G, Carnielli VP, Curtis M, Darmaun D, Decsi T, et al. ESPGHAN Committee on Nutrition. Enteral nutrient supply for preterm infants: commentary from the European Society of Paediatric Gastroenterology, Hepatology and Nutrition Committee on Nutrition. Journal of Pediatric Gastroenterology and Nutrition 2010;50(1):85‐91. [DOI: 10.1097/MPG.0b013e3181adaee0; PUBMED: 19881390] [DOI] [PubMed] [Google Scholar]
Amiel‐Tison 1986
- Amiel‐Tison C, Grenier A. Neurological Assessment During the First Year of Life. Oxford (UK): Oxford University Press, 1986. [Google Scholar]
Arslanoglu 2013
- Arslanoglu S, Corpeleijn W, Moro G, Braegger C, Campoy C, Colomb V, et al. ESPGHAN Committee on Nutrition. Donor human milk for preterm infants: current evidence and research directions. Journal of Pediatric Gastroenterology and Nutrition 2013;57(4):535‐42. [DOI: 10.1097/MPG.0b013e3182a3af0a; PUBMED: 24084373] [DOI] [PubMed] [Google Scholar]
Beeby 1992
- Beeby PJ, Jeffrey H. Risk factors for necrotising enterocolitis: the influence of gestational age. Archives of Disease in Childhood 1992;67(4 Spec No):432‐5. [DOI: 10.1136/adc.67.4_spec_no.432; PUBMED: 1586186] [DOI] [PMC free article] [PubMed] [Google Scholar]
Buckle 2017
- Buckle A, Taylor C. Cost and cost‐effectiveness of donor human milk to prevent necrotizing enterocolitis: systematic review. Breastfeeding Medicine 2017;12(9):528‐36. [DOI: 10.1089/bfm.2017.0057; PUBMED: 28829161] [DOI] [PubMed] [Google Scholar]
Castro 2019
- Castro M, Asbury M, Shama S, Stone D, Yoon EW, O'Connor DL, et al. Energy and fat intake for preterm infants fed donor milk Is significantly impacted by enteral feeding method. Journal of Parenteral and Enteral Nutrition 2019;43(1):162‐5. [DOI: 10.1002/jpen.1430; PUBMED: 30070721] [DOI] [PubMed] [Google Scholar]
Cleminson 2015
- Cleminson J, Oddie S, Renfrew MJ, McGuire W. Being baby friendly: evidence‐based breastfeeding support. Archives of Disease in Childhood. Fetal and Neonatal Edition 2015;100(2):F173‐8. [DOI: 10.1136/archdischild-2013-304873; PUBMED: 25293712] [DOI] [PubMed] [Google Scholar]
Fewtrell 1999
- Fewtrell M, Lucas A. Nutritional physiology: dietary requirements of term and preterm infants. In: Rennie JM, Roberton NRC editor(s). Textbook of Neonatology. 3rd Edition. Edinburgh: Churchill Livingstone, 1999:305‐25. [Google Scholar]
GRADEpro GDT 2015 [Computer program]
- McMaster University (developed by Evidence Prime). GRADEpro GDT. Version accessed 15 March 2018. Hamilton (ON): McMaster University (developed by Evidence Prime), 2015.
Gross 1980
- Gross SJ, David RJ, Bauman L, Tomarelli RM. Nutritional composition of milk produced by mothers delivering preterm. Journal of Pediatrics 1980;96(4):641‐4. [PUBMED: 7359266] [DOI] [PubMed] [Google Scholar]
Gross 1981
- Gross SJ, Buckley RH, Wakil SS, McAllister DC, David RJ, Faix RG. Elevated IgA concentration in milk produced by mothers delivered of preterm infants. Journal of Pediatrics 1981;99(3):389‐93. [PUBMED: 7264792] [DOI] [PubMed] [Google Scholar]
Hay 1994
- Hay WW Jr. Nutritional requirements of extremely low birthweight infants. Acta Paediatrica Supplement 1994;402:94‐9. [PUBMED: 7841630] [DOI] [PubMed] [Google Scholar]
Higgins 2011
- Higgins JP, Green S, editor(s). Cochrane Handbook for Systematic Reviews of Interventions Version 5.1.0 (updated March 2011). The Cochrane Collaboration, 2011. Available from www.handbook.cochrane.org.
Isaacs 2009
- Isaacs EB, Morley R, Lucas A. Early diet and general cognitive outcome at adolescence in children born at or below 30 weeks gestation. Journal of Pediatrics 2009;155(2):229‐34. [DOI: 10.1016/j.jpeds.2009.02.030; PUBMED: 19446846] [DOI] [PubMed] [Google Scholar]
Klingenberg 2012
- Klingenberg C, Embleton ND, Jacobs SE, O'Connell LA, Kuschel CA. Enteral feeding practices in very preterm infants: an international survey. Archives of Disease in Childhood. Fetal and Neonatal Edition 2012;97(1):F56‐61. [DOI: 10.1136/adc.2010.204123; PUBMED: 21856644] [DOI] [PubMed] [Google Scholar]
Lucas 1978
- Lucas A, Gibbs JA, Baum JD. The biology of drip breast milk. Early Human Development 1978;2(4):351‐61. [PUBMED: 571325] [DOI] [PubMed] [Google Scholar]
Lucas 1990
- Lucas A, Cole TJ. Breast milk and neonatal necrotising enterocolitis. Lancet 1990;336(8730):1519‐23. [DOI: 10.1016/0140-6736(90)93304-8; PUBMED: 1979363] [DOI] [PubMed] [Google Scholar]
Peila 2016
- Peila C, Moro GE, Bertino E, Cavallarin L, Giribaldi M, Giuliani F, et al. The effect of Holder pasteurization on nutrients and biologically‐active components in donor human milk: a review. Nutrients 2016;8(8):E477. [DOI: 10.3390/nu8080477; PUBMED: 27490567] [DOI] [PMC free article] [PubMed] [Google Scholar]
PRISMA 2009
- Moher D, Liberati A, Tetzlaff J, Altman DG, PRISMA Group. Preferred reporting items for systematic reviews and meta‐analyses: the PRISMA statement. BMJ 2009;339:b2535. [DOI: 10.1136/bmj.b2535; PUBMED: 19622551] [DOI] [PMC free article] [PubMed] [Google Scholar]
Schanler 1995
- Schanler RJ. Suitability of human milk for the low‐birthweight infant. Clinics in Perinatology 1995;22(1):207‐22. [PUBMED: 7781253] [PubMed] [Google Scholar]
Schünemann 2013
- Schünemann H, Brożek J, Guyatt G, Oxman A, editor(s). Handbook for grading the quality of evidence and the strength of recommendations using the GRADE approach (updated October 2013). GRADE Working Group, 2013. Available from gdt.guidelinedevelopment.org/app/handbook/handbook.html.
Tsang 1993
- Tsang RC, Lucas A, Uauy R, Zlotkin S. Nutritional Needs of the Newborn Infant: Scientific Basis and Practical Guidelines. Pawling (NY): Caduceus Medical Publishers, 1993. [Google Scholar]
Williams 2016
- Williams T, Nair H, Simpson J, Embleton N. Use of donor human milk and maternal breastfeeding rates: a systematic review. Journal of Human Lactation 2016;32(2):212‐20. [DOI: 10.1177/0890334416632203; PUBMED: 26887844] [DOI] [PubMed] [Google Scholar]
References to other published versions of this review
Henderson 2001
- Henderson G, McGuire W, Anthony MY. Formula milk versus term human milk for feeding preterm or low birth weight infants. Cochrane Database of Systematic Reviews 2001, Issue 4. [DOI: 10.1002/14651858.CD002971] [DOI] [PubMed] [Google Scholar]
Quigley 2007
- Quigley MA, Henderson G, Anthony MY, McGuire W. Formula milk versus donor breast milk for feeding preterm or low birth weight infants. Cochrane Database of Systematic Reviews 2007, Issue 4. [DOI: 10.1002/14651858.CD002971] [DOI] [PubMed] [Google Scholar]
Quigley 2014
- Quigley M, McGuire W. Formula versus donor breast milk for feeding preterm or low birth weight infants. Cochrane Database of Systematic Reviews 2014, Issue 4. [DOI: 10.1002/14651858.CD002971.pub3] [DOI] [PubMed] [Google Scholar]
Quigley 2018
- Quigley M, Embleton ND, McGuire W. Formula versus donor breast milk for feeding preterm or low birth weight infants. Cochrane Database of Systematic Reviews 2018, Issue 6. [DOI: 10.1002/14651858.CD002971.pub4] [DOI] [PMC free article] [PubMed] [Google Scholar]