

SUMMARY
Plum pox virus (PPV) is responsible for sharka disease, one of the most detrimental stone fruit diseases affecting Prunus trees worldwide. Only a few apricot cultivars have been described as resistant, most originating from North American breeding programmes. Several PPV resistance quantitative trait loci (QTLs) have been mapped in various progenies, consistently highlighting the contribution to the resistance of the upper part of linkage group 1 (LG1). However, to date, no consensus has been reached on the precise number of QTLs linked to the resistance to PPV in apricot and P. davidiana or on their accurate position on the genetic linkage map. In the present study, the quantitative resistance of cultivar ‘Harlayne’ was analysed over five growth periods in a large F1 population. Four QTLs were identified, three mapping on LG1, explaining between 5% and 39% of the observed phenotypic variance. In an effort to further this analysis of PPV resistance in apricot, these results were merged in a single QTL meta‐analysis with those of five other PPV resistance analyses available in the literature. Three consensus QTL regions were identified on LG1 and a putative fourth region on LG3. QTL meta‐analysis also revealed the contribution of each resistant cultivar to metaQTLs, providing interesting comparative data on the resistance factors shared between the resistance sources used in the various studies. Finally, it was shown that one of the metaQTLs co‐localizes with the eukaryotic translation initiation factor eIF4E, thus providing new hypotheses on the mechanisms of PPV resistance in apricot.
INTRODUCTION
Plum pox virus (PPV) is the causal agent of sharka, one of the most detrimental stone fruit diseases affecting Prunus trees worldwide. In Europe, the associated economic cost has been estimated to exceed 10 billion euros over the last 30 years (Cambra et al., 2006). Very few sources of resistance have been identified in Prunus species, with most occurring in P. armeniaca (apricot) and originating from North American breeding programmes (Martinez‐Gomez and Dicenta, 2000). The resistance of several of such cultivars has been studied at the cellular and genetic level. It has been shown to be quantitative and partial (Ion‐Nagy et al., 2006; Lambert et al., 2007; Soriano et al., 2008). Thus, cv. ‘Stark Early Orange’ has been classified as resistant and cv. ‘Goldrich’ as intermediate (Ion‐Nagy et al., 2006). Genetic mapping studies have consistently highlighted one single region encompassing 20–50 cM on linkage group 1 (LG1) (Lalli et al., 2008; Lambert et al., 2007; Romero et al., 2005; Sicard et al., 2008; Soriano et al., 2008; Vilanova et al., 2003). However, the respective environments and genetic backgrounds were distinct among all studies. Moreover, the genetic structure of the populations (F1, F2 and BC1) was not the best suited for quantitative trait locus (QTL) detection because of the restricted number of observed meioses. The size of the mapping populations, which is one of the most limiting factors in precise QTL localization (Darvasi et al., 1993), was limited to an average of 80 individuals for most studies. Different PPV isolates originating from three distinct PPV strains (Marcus, Dideron and Recombinant) were used to inoculate the progenies. The scions were either inoculated directly or buds were first grafted on susceptible rootstocks and then inoculated, with or without replicates. Last but not least, the phenotyping methods were not the same. Either a scale based on symptom severity and distribution in the plant (four‐ or five‐class scale) or a two‐class scoring method (resistant vs. susceptible) was used. Nonetheless, despite all these major differences, all studies consistently highlighted LG1 as the major genomic region bearing PPV resistance factors. Consequently, to date, there is no general consensus on the number of QTLs linked to resistance or their precise position on the Prunus genetic map.
A simple map‐based comparison was tentatively performed and showed the co‐localization of one QTL of ‘Stark Early Orange’ with the QTL detected in ‘Goldrich’, and another QTL of ‘Stark Early Orange’ with one QTL detected in P. davidiana (Lambert et al., 2007). Such a simple map‐based comparison is limited, however. First, there is a lack of anchor molecular markers among the different linkage genetic maps. Second, the conclusion on the existence of shared QTLs relies only on the overlap between QTL confidence intervals, which can be rather large when the population size is small and the QTL effect is low (Darvasi et al., 1993, Lander and Botstein, 1989).
Sicard et al. (2008) developed a common set of polymerase chain reaction (PCR) markers that was used to increase marker density and align the genetic linkage maps of all studied cultivars. These markers have the extra advantage of targeting candidate genes, thus displaying single locus positioning in the resistance region. Among them were the eukaryotic translation initiation factors eIF4E (Cd195) and eIF(iso)4E (Cd211), RNA helicase SDE3 (Cd93), argonaute protein AGO1 (Cd83) (Sicard et al. 2008) and the b‐ZIP transcription factor RF2a (V. Decroocq and A. Abbott, personal observation).
The purpose of the present study was to integrate all information on PPV resistance available in the literature in a QTL meta‐analysis. The first step was to include another apricot resistance source (‘Harlayne’), gaining access to a larger mapping population. The PPV resistance of the 147 F1 hybrids obtained from the cross between ‘Harlayne’ and ‘Marlén’ as the male parent was scored over five growth periods. An extensive search for polymorphism between the two parents was performed using microsatellite markers, and the genetic linkage maps were then established. Resistance factors originating from ‘Harlayne’ were further identified by QTL analysis. In a second step, these results were merged with all previously published PPV resistance loci (Lalli et al., 2008; Lambert et al., 2007; Soriano et al., 2008) in an extensive QTL meta‐analysis using MetaQTL software (Veyrieras et al., 2007). Synteny between apricot and peach genomes enabled the inclusion of PPV resistance information available in P. davidiana in the QTL meta‐analysis (Decroocq et al., 2005; Marandel et al., 2009). Starting from a consensus genetic linkage map, this statistical algorithm‐based analysis identified the model that best fitted the observed QTLs. Three metaQTLs were thus identified on LG1 and one on LG3. This QTL meta‐analysis reveals the level of contribution of each resistant genotype to the various metaQTLs, and provides a basis for the comparison of sources of resistance.
RESULTS
PCR polymorphism, marker genotyping and building a genetic linkage map for apricot
Among the 464 microsatellite markers tested for polymorphism in the ‘Harlayne’ × ‘Marlén’ cross (Table S2, see Supporting Information), 139 were polymorphic on the ‘Harlayne’ map and 125 on the ‘Marlén’ map. The polymorphism rate was consequently evaluated at 46% for the ‘Harlayne’ map and 32% for the ‘Marlén’ map, which are relatively low values compared with those reported in other studies (Dondini et al., 2007; Lalli et al., 2008). In total, complete genotyping results were obtained for 114 markers and used to build parental genetic linkage maps.
As a result of potential outcross and self‐pollination, six individuals were eliminated from the analysis, leaving 147 individuals of the F1 population for map building. Parental genetic linkage maps were built using JoinMap 3.0. Sixty‐six and 57 markers were used to build the ‘Harlayne’ and ‘Marlén’ maps, respectively, with 28 markers in common between the two maps. Nineteen markers were assigned to LGs, but could not be added to any map because of a lack of linkage with other markers of the respective group or because they introduced large distortions in the maps. The assignment of LGs was performed according to the Prunus reference map [Genome Database of Rosaceae (GDR), http://www.rosaceae.org]. The ‘Harlayne’ map covers 391 cM, with an average density of 5.8 cM per marker, and the ‘Marlén’ map covers 443 cM, with an average density of 7.8 cM per marker (Figs 1 and S1, see Supporting Information).
Figure 1.
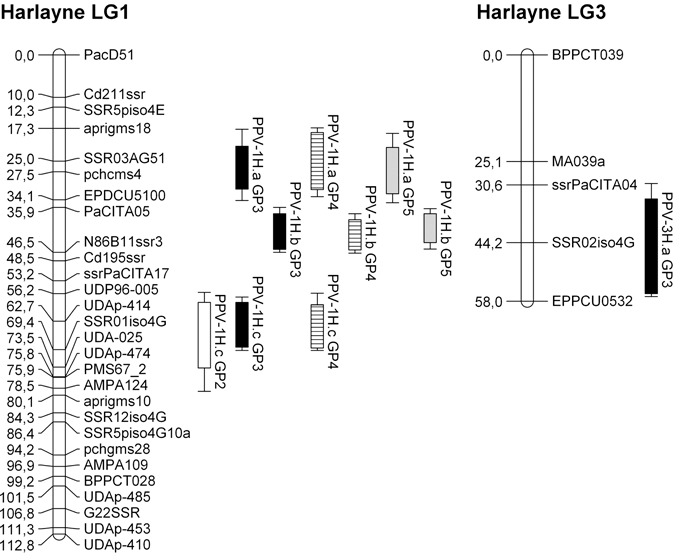
Harlayne’ genetic linkage maps of linkage groups 1 and 3 with quantitative trait loci (QTLs) mapped by composite interval mapping. Rectangles and bars represent 1 – logarithm of odds (1 – LOD) and 2 – LOD confidence intervals, respectively. GP, growth period; white, GP2; black, GP3; striped, GP4; grey, GP5.
Phenotypic analysis of the PPV resistance in the mapping population
Each plant of the mapping population was evaluated twice per growth period. No significant difference between the two evaluations of the same growth period was found by analysis of variance (data not shown). In consequence, the two evaluation scores were averaged for each growth period. This mean score was then used for QTL analysis, and denoted as ‘GPx’ for growth period x, where x is the number of the growth period. The scores for the 147 individuals used to build the linkage maps were retained for QTL analysis. As a result of some missing phenotypic data, depending on the considered growth period, QTL analysis was performed on a distinct subset of between 123 and 145 individuals (Table S3, see Supporting Information). For each growth period, a continuous distribution was observed, supporting the hypothesis of a quantitative trait. Interestingly, the distribution of the trait (Table S3, see Supporting Information) was not as skewed as in other segregating populations (Lambert et al., 2007; Marandel et al., 2009; Soriano et al., 2008). Strong and highly significant Pearson's correlation coefficients were observed between the scores of each growth period (Table S4, see Supporting Information). Increasing correlation coefficients were observed along the succession of the four growth periods, revealing a pattern of evolution towards a stability of the notations.
QTL mapping
In ‘Harlayne’, four distinct dominant resistance QTLs were identified along the four growth periods. Three mapped on LG1 (named PPV‐1H.a, PPV‐1H.b and PPV‐1H.c, respectively, for PPV QTL on ‘Harlayne’ LG1); the last mapped on LG3 (named PPV‐3H.a) (Fig. 1). All were detected at least once by composite interval mapping (CIM) and one of two non‐parametric methods (MultiRegress or Kruskal–Wallis, Table 1). QTLs were declared identical over the different scoring dates when their 1 – logarithm of odds (LOD) confidence intervals overlapped, or when their closest marker was mapped in the 1 – LOD confidence interval of a QTL detected by CIM.
Table 1.
Quantitative trait loci (QTLs) detected for each scoring date.
| Scoring date | QTL | MR* | KW† | CIM‡ | |||||||
|---|---|---|---|---|---|---|---|---|---|---|---|
| Closest marker | P value | Closest marker | K § | Df¶ | P value | Closest marker | LOD** | R 2 †† |
 ‡‡
‡‡
|
||
| GP1 | PPV‐1H.a | ssrPaCITA05 | 3.5 × 10⁻³ | ||||||||
| GP2 | PPV‐1H.a | SSR03AG51 | 11.67 | 1 | 6.4 × 10⁻⁴ | ||||||
| GP2 | PPV‐1H.b | Cd195ssr | 4 × 10⁻⁴ | N86B11ssr3 | 11.75 | 1 | 6.1 × 10⁻⁴ | ||||
| GP2 | PPV‐1H.c | SSR01iso4G | 14.44 | 1 | 1.5 × 10⁻⁴ | SSR01iso4G | 2.84 | 7.15 | 26.90 | ||
| GP3 | PPV‐1H.a | pchcms4 | 32.83 | 1 | 1.0 × 10⁻⁸ | pchcms4 | 3.84 | 7.60 | 40.81 | ||
| GP3 | PPV‐1H.b | Cd195ssr | < 10−4 | N86B11ssr3 | 20.83 | 1 | 5.0 × 10⁻⁶ | N86B11ssr3 | 10.33 | 28.14 | |
| GP3 | PPV‐1H.c | UDAp‐414 | 23.61 | 1 | 1.2 × 10⁻⁶ | UDAp‐414 | 3.76 | 8.21 | |||
| GP3 | PPV‐3H.a | SSR02iso4G | 3.86 | 10.94 | |||||||
| GP4 | PPV‐1H.a | Cd195ssr | < 10−4 | pchcms4 | 47.02 | 1 | 7.0 × 10⁻² | pchcms4 | 7.61 | 14.44 | 48.48 |
| GP4 | PPV‐1H.b | N86B11ssr3 | 37.21 | 1 | 1.1 × 10⁻⁹ | N86B11ssr3 | 15.17 | 39.44 | |||
| GP4 | PPV‐1H.c | SSR01iso4G | 23.29 | 1 | 1.4 × 10⁻⁶ | SSR01iso4G | 2.81 | 4.94 | |||
| GP5 | PPV‐1H.a | pchcms4 | < 10−4 | pchcms4 | 36.93 | 1 | 1.2 × 10⁻⁹ | pchcms4 | 5.25 | 12.59 | 41.44 |
| GP5 | PPV‐1H.b | N86B11ssr3 | 24.58 | 1 | 7.1 × 10⁻⁷ | ssrPaCITA05 | 10.79 | 33.26 | |||
| GP5 | PPV‐1H.c | UDAp‐414 | 13.47 | 1 | 2.4 × 10⁻⁴ | ||||||
| GP5 | PPV‐3H.a | SSR02iso4G | 3.4 × 10⁻³ | ||||||||
QTL detected in ‘Harlayne’ using QTLCartographer MultiRegress procedure.
QTL detected in ‘Harlayne’ using Kruskal–Wallis test.
QTL detected in ‘Harlayne’ using composite interval mapping.
Kruskal–Wallis test value.
Degree of freedom.
Logarithm of odds score (composite interval mapping).
Individual contribution of the QTL to phenotypic variance.
Total contribution of the detected QTL to phenotypic variance.
No QTL was detected during the first growth period (GP1) using either the Kruskal–Wallis test or CIM. Only PPV‐1H.a was detected by multiple linear regression with a weak significant P value (3.5 × 10⁻³) similar to the threshold (5 × 10⁻³).
QTLs detected by CIM individually accounted for between 4.9% and 39.4% of the phenotypic variance. Models fitting all the QTLs detected by CIM explained between 26.9% and 48.5% of the total phenotypic variance depending on the scoring date used. PPV‐1H.b, the QTL with the highest effect (R 2 between 28.1% and 39.4%), mapped near the N86B11SSR3 marker.
The low‐effect QTL PPV‐3H.a was mapped on LG3 by CIM for the GP3 scoring date and by multiple linear regression for the GP5 scoring date. However, it could not be confirmed over the other scoring dates. As a result of its small effect and poor linkage map density in this region, the PPV‐3H.a confidence interval was large. The strongest marker associated with it was the single sequence repeat (SSR) marker SSR02iso4G, an SSR marker linked to the candidate gene eIF(iso)4G (Marandel et al., 2009).
Few digenic epistatic interactions were found in the genome by two‐way analysis of variance. However, interactions were detected between QTLs PPV‐1H.a and PPV‐1H.b (scoring date GP2), PPV‐1H.b and PPV‐1H.c (scoring date GP3) and PPV‐1H.b and PPV‐1H.c (scoring date GP4). The sign of the coefficients for each interaction showed that their cumulated presence in one single genotype was synergistic, meaning that the level of resistance contributed by the simultaneous presence of both QTLs was higher than the sum of the levels of resistance contributed independently by each QTL (Table S5, see Supporting Information). Interestingly, these interactions were detected between QTLs co‐localizing with components of the eukaryotic translation initiation complex.
QTL analysis was performed in similar ways using the ‘Marlén’ map. However, no QTL was detected whatever the method used. This result is consistent with the level of susceptibility observed in this cultivar.
QTL meta‐analysis
To improve the accuracy of the PPV resistance consensus map, the prerequisite is the existence of a common set of markers between all genetic maps. Sicard et al. (2008) developed and mapped markers flanking the major PPV resistance loci in the apricot cultivars ‘Stark Early Orange’, ‘Lito’ and ‘Goldrich’. When possible, these markers were added to the ‘LE‐3246’ map, previously published by Lalli et al. (2008), and to the ‘Harlayne’ map, built in the present study. As PPV resistance QTL analysis was not performed using these improved maps (except for cv. ‘Harlayne’), a preliminary step to the QTL meta‐analysis was to project the detected QTLs onto their respective improved maps (data not shown). Moreover, Lalli et al. (2008) mapped PPV resistance in the Czech selection ‘LE‐3246’ as a single dominant gene, with two potential locations. No information was thus provided on the proportion of variance (R 2) explained by the mapped loci, which is, with the genetic location and the size of the population, the minimum information required to define a confidence interval and to subsequently perform a QTL meta‐analysis. Consequently, the original dataset was analysed once again using QTLCartographer (Basten et al., 2002). Interval mapping and CIM analysis were performed, with co‐factors selected by forward–backward stepwise regression (Marandel et al., 2009). Interval mapping and CIM results confirmed the upper location on LG1 of the resistance QTL detected by Lalli et al. (2008). The alternative position in the middle of LG1 could not be confirmed in this analysis.
When building the consensus map, respect for the marker order is of particular importance. Thus, in maps of cultivars ‘Stark Early Orange’ and its descendants ‘Lito’ and ‘LE‐3246’, an inversion of the Cd195ssr and ssrPaCITA05 marker order was observed in comparison with the ‘Harlayne’ and ‘Goldrich’ maps. No information was available on this sequence order on the Prunus reference map (GDR website), as none of these markers was located in the consensus TxE genetic map. Physical mapping of the area is currently in progress in peach (V. Decroocq, M. L. Badenes and A. Abbott, personal observations), and should thus provide further data. Taking into account this inversion, the Cd195ssr locus was removed from the ‘Stark Early Orange’ map and its descendants, but remained in the ‘Harlayne’ and ‘Goldrich’ maps. With the exception of this issue caused by the inversion between Cd195ssr and ssrPaCITA05 markers, MetaQTL built a consensus map consistent with the Prunus reference map (GDR, http://www.rosaceae.org). The meta‐analysis showed that the best metaQTL model fitting the phenotypic observations was the 3‐QTL model, meaning that three metaQTLs actually underlie the nine QTLs detected on LG1 (hereafter referred to as MetaPPV‐1.a, MetaPPV‐1.b and MetaPPV‐1.c,Fig. 2). Analysis of the localization of metaQTLs revealed that several candidate genes mapped in the metaQTL confidence intervals. Thus, Cd83, a homologue of the Argonaute protein AGO1, and Cd66, an RNA‐directed RNA polymerase, mapped in the MetaPPV‐1.a confidence interval. Cd195, which codes for the translation initiation factor eIF4E, mapped in the MetaPPV‐1.b confidence interval. Eight expressed sequence tags (ESTs) also mapping in this interval were identified from the Prunus reference map (GDR, http://www.rosaceae.org). Five had strong homology with Arabidopsis thaliana proteins (data not shown), but none represented a better candidate gene than eIF4E. No candidate gene was identified for MetaPPV‐1.c.
Figure 2.
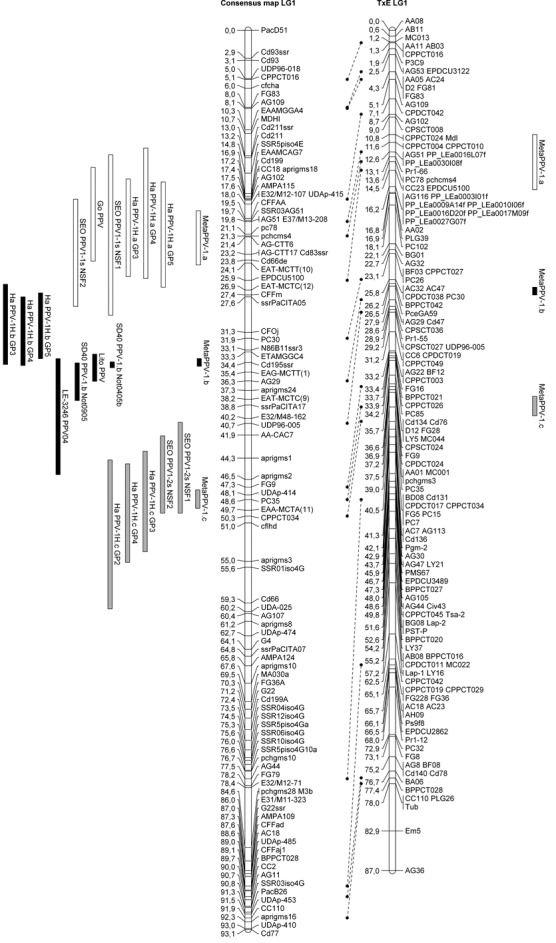
Alignment of the linkage group 1 (LG1) consensus map and LG1 Prunus reference map (TxE, ‘Texas’ × ‘Earlygold’) with quantitative trait loci (QTLs) and projected metaQTLs. Rectangles represent the 1 – logarithm of odds (1 – LOD) confidence interval of the QTLs/metaQTLs.
On LG3, the consensus map was built from the ‘Polonais’, ‘Stark Early Orange’ and ‘Harlayne’ maps where QTLs had been detected previously (this work, Lambert et al., 2007). QTL meta‐analysis of this LG was more shaded. The MetaQTL software was unable to unambiguously identify the best‐fitting model, as three of the five statistical criteria used in the meta‐analysis algorithm were favourable to the 1‐QTL model, whereas the other two were favourable to the 2‐QTL model. When considering the 2‐QTL model and projecting the two metaQTLs on the Prunus reference map, both metaQTL confidence intervals overlapped, consequently supporting the hypothesis of one single metaQTL, hereafter referred to as MetaPPV‐3.a (Fig. 3). Despite the co‐localization of ‘Harlayne’ PPV‐3H.a QTL with the candidate gene eIF(iso)4G, this was excluded from the MetaPPV‐3.a confidence interval. In addition, 12 ESTs mapping in the confidence interval of MetaPPV‐3.a were found, but no clear candidate gene was identified.
Figure 3.
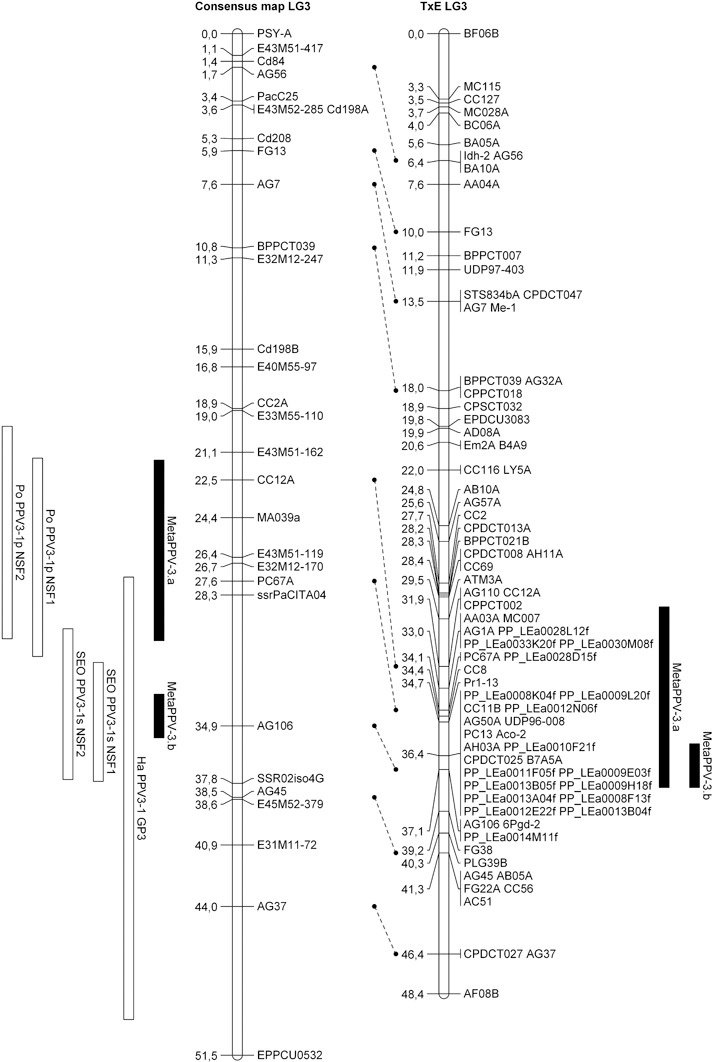
Alignment of the linkage group 3 (LG3) consensus map and LG1 Prunus reference map (TxE, ‘Texas’ × ‘Earlygold’) with quantitative trait loci (QTLs) and projected metaQTLs. Rectangles represent the 1 – logarithm of odds (1 – LOD) confidence intervals of the QTLs/metaQTLs.
DISCUSSION
The North American apricot cultivar ‘Harlayne’ is considered to be one of the most resistant to PPV. Analysis of its resistance was performed in a population of 147 F1 hybrids. In comparison with previous studies, the power of detection was greatly improved because of the larger population size and good coverage of genetic LG1, known to harbour the main factors of resistance in other PPV‐resistant apricot cultivars (Lalli et al., 2008, Lambert et al., 2007; Romero et al., 2005; Soriano et al., 2008; Vilanova et al., 2003). Four distinct QTLs were thus detected, three (named PPV‐1H.a, PPV‐1H.b, PPV‐1H.c) mapping on LG1 and the last (PPV‐3H.a) mapping on LG3. The strongest factors of resistance were mapped on LG1, individually explaining up to 39% of the observed phenotypic variance. On LG3, a low‐effect QTL had previously been mapped in the same region in both cultivars ‘Polonais’ and ‘Stark Early Orange’, but, as for ‘Harlayne’, this QTL could not be confirmed over all scoring dates (Lambert et al., 2007). No QTLs were detected on LG5, where Lambert et al. (2007) mapped a QTL in both cv. ‘Stark Early Orange’ and cv. ‘Polonais’. Lambert et al. (2007) declared this QTL as putative, but ‘Harlayne’ and ‘Stark Early Orange’ could also be different. In addition, no QTL was detected in ‘Harlayne’ during the first growth period, probably resulting from a heterogeneous response of the hybrids to inoculation and a differential set up of the resistance mechanism(s) among the F1 individuals.
Candidate genes eIF4E and eIF(iso)4G mapped in PPV‐1H.b and PPV‐3H.a confidence intervals, respectively. No other resistance gene analogues have previously been mapped on LG3 (Lalli et al., 2005). Nevertheless, co‐localization between resistance QTLs and eukaryotic translation initiation factors has been shown previously in P. davidiana (Marandel et al., 2009), which strongly supports the hypothesis of the involvement of these translation initiation factors in P. davidiana and P. armeniaca resistance to PPV, as reported previously in other plant–Potyvirus pathosystems (for a review, see Robaglia and Caranta, 2006).
Several independent tentative mapping analyses (QTL analysis, binary trait locus analysis and single locus mapping) for PPV resistance have been performed in various apricot cultivars, most related to ‘Stark Early Orange’ (Lalli et al., 2008; Lambert et al., 2007; Soriano et al., 2008). Unfortunately, the resistance assays in each study have been performed in different ways (Table 2), which strongly impairs the comparison of the results. To overcome these difficulties, a QTL meta‐analysis was performed, using all available resistance mapping studies, including the ‘Harlayne’ QTL analysis. As a result of this meta‐analysis, MetaQTL software combined the LG1 PPV resistance QTL in three metaQTLs (Fig. 2). Interestingly, the QTL detected in ‘Lito’ and ‘LE‐3246’, which are both ‘Stark Early Orange’ F1 descendants, contributed to MetaPPV‐1.b, whereas no QTL detected in ‘Stark Early Orange’ contributed to this metaQTL. As ‘Lito’ and ‘LE‐3246’ show a strong level of resistance, it can be assumed that they inherited at least a resistance allele from ‘Stark Early Orange’ (Lalli et al., 2008; Soriano et al., 2008) for one or both QTLs detected in ‘Stark Early Orange’ (Lambert et al., 2007). Logically, PPV_Lito and PPV_LE‐3246 QTLs, detected in ‘Lito’ and ‘LE‐3246’, respectively, should contribute to the metaQTL MetaPPV‐1.a or MetaPPV‐1.c (as is the case for ‘Stark Early Orange’ QTLs PPV‐1.1s and PPV‐1.2s) and not MetaPPV‐1.b. However, these two experiments (Lalli et al., 2008; Soriano et al., 2008) clearly lacked detection power. Indeed, the size of the mapping progenies was slightly smaller than the ‘Polonais’ × ‘Stark Early Orange’ mapping population. Moreover, the scoring was performed in a two‐class manner: resistant vs. susceptible. We can therefore expect that, with a higher power of detection, a different result would have been observed. Clearly, if ‘Stark Early Orange’ possesses two resistance QTLs in this region, its F1 descendants ‘Lito’ and ‘LE‐3246’ should have none, one, or both, depending on the allele to the resistance loci inherited. However, whatever the number of inherited resistance alleles, the true localization of the QTLs remains the same between these three cultivars. Consequently, a first hypothesis is that ‘Lito’ and/or ‘LE‐3246’ truly possess only one of the two QTLs and, because of a lack of power, its localization on the respective maps is biased. Alternatively, the second hypothesis is that ‘Lito’ and/or ‘LE‐3246’ possess both QTLs and, because of a lack of power, algorithms of QTL detection cannot split the detected QTL into two distinct QTLs. Consequently, the resistance loci were mapped as a single QTL, MetaPPV‐1.b, located in an intermediate position between ‘Stark Early Orange’ QTLs PPV‐1.1s and PPV‐1.2s (Fig. 2). This latter hypothesis is supported by the susceptible/resistant segregation ratio described by Vilanova et al. (2003); it is consistent with a digenic dominant control of the resistance.
Table 2.
Comparison of phenotypic assays used to detect quantitative trait loci (QTLs) in apricot cultivars and Prunus davidiana P1908.
| Cross name | Population structure | Effective size | PPV strain | Inoculation* | Replicates | Phenotypic scoring‡ | Reference |
|---|---|---|---|---|---|---|---|
| ‘Polonais’ × ‘Stark Early Orange’ | F1 | 84–104 | PPV‐D RB 3.30 | iR | 3 | Scale (0–3) | Lambert et al. (2007) |
| ‘Lito’ × ‘Lito’ | F2 | 81 | PPV‐D RB 3.30 | iB | 12† | R/S† | Soriano et al. (2008) |
| ‘Goldrich’ × ‘Currot’ | F1 | 81 | PPV‐D RB 3.30 | iB | 12† | R/S† | Soriano et al. (2008) |
| ‘SD40’ × ‘SD40’ | F2 | 68–69 | PPV‐M ‘Vallier’ | igB | 3 | Scale (0–4) | Marandel et al. (2009) |
| ‘LE‐3246’ × ‘Vestar’ | BC1 | 67 | PPV‐M | iS | 0 | R/S | Lalli et al. (2008) |
| ‘Harlayne’ × ‘Marlén’ | F1 | 140–145 | PPV‐Rec | iS | 0 | Scale (0–4) | Present study |
iR, rootstocks are inoculated; iB, budsticks are inoculated before grafting on the rootstock; igB, budsticks are inoculated after grafting on the rootstock; iS, seedlings are inoculated.
12 replicates were observed, but individuals were classified as resistant or susceptible.
Scoring range used or two‐category scoring. R/S, resistant vs. susceptible.
Despite the fact that our analysis proposes that the position of the QTLs PPV_Lito and PPV_LE‐3246 are inaccurate, the existence of MetaPPV‐1.b is still under question. Indeed, it co‐localized with PPV‐1H.b from ‘Harlayne’ and PPV‐1.b from ‘SD40’. However, we cannot rule out the fact that these two QTLs would actually be distinct, as one was detected in an apricot cultivar and the other in P. davidiana, a wild peach‐related species.
QTL meta‐analysis of LG3 differentially clustered the QTL detected in ‘Polonais’ (PPV‐susceptible parent) from the QTL detected in ‘Harlayne’ and ‘Stark Early Orange’ (PPV‐resistant apricot parents) (Fig. 3). However, when projected on the Prunus reference map, one single metaQTL (MetaPPV‐3.a) was obtained (Fig. 3). Alignment of the three respective maps revealed a lack of common markers among them, particularly in the resistance mapping interval. The accuracy of marker projection was thus altered and the QTL meta‐analysis was biased. We can therefore expect that, with additional anchor markers, commonly shared with the Prunus reference map, all three QTLs would unambiguously cluster as a single QTL. Moreover, the implication of the eIF(iso)4G candidate gene in MetaPPV‐3.a would be reconsidered.
One advantage of the QTL meta‐analysis is to combine information originating from QTLs detected in various environments and conditions. Concerning the resistance to PPV in Prunus spp., QTLs were detected using six different mapping populations inoculated with four distinct PPV isolates (Table 1). Nevertheless, they contribute to the same metaQTL (Fig. 2). Indeed, when ‘Stark Early Orange’ was challenged with eight distinct PPV isolates, no difference in resistance level was observed (Decroocq et al., 2006a). We can therefore hypothesize that these QTLs and, consequently, the metaQTLs display a broad‐spectrum range of resistance to PPV, suggesting that a conserved viral determinant may be recognized by the plant. This hypothesis is supported by the high relatedness between these different PPV isolates (Myrta et al., 2006). Alternatively, the resistance QTL may be efficient against several isolates, as shown, for example, for another potyvirus in pepper (Caranta et al., 1997).
The present data highlight new information on the resistance carried by apricot cultivars. The generally accepted hypothesis is that North American PPV‐resistant apricot cultivars used in European breeding programmes share a common or related source of resistance to PPV, presumably inherited from an Asian origin (Badenes et al., 1996), probably from north China (Zhebentyayeva et al., 2008). In the above studies, Zhebentyayeva et al. (2008) showed that resistant cultivars ‘Goldrich’, ‘Harlayne’ and ‘Stark Early Orange’ clustered together, which is in line with our QTL meta‐analysis. However, with an increased resolution power, our QTL meta‐analysis suggested that the ‘Harlayne’ genome‐wide resistance is more similar to that of ‘Stark Early Orange’ than to that of ‘Goldrich’. This result is consistent with the proposition of Ion‐Nagy et al. (2006), who classified ‘Harlayne’ and ‘Stark Early Orange’ as resistant and ‘Goldrich’ as intermediate. Meta‐analysis showed that both ‘Harlayne’ and ‘Stark Early Orange’ displayed three common metaQTLs (two on LG1 and one on LG3), whereas ‘Harlayne’ and ‘Goldrich’ shared one single metaQTL mapping on LG1. ‘Harlayne’ and ‘Stark Early Orange’ also displayed one specific QTL each, on LG1 (PPV‐1H.b) for ‘Harlayne’ and LG5 (PPV5‐1s) for ‘Stark Early Orange’. Moreover, the ‘Harlayne’PPV‐1H.b QTL showed the largest effect (28% < R 2 < 39%). Consequently, the QTL meta‐analysis clearly refined the boundaries of the resistance genomic regions commonly shared by these cultivars, providing a consensus position and a confidence interval for each of the metaQTLs. To draw a final conclusion on the identical origin of resistance among these cultivars, the respective alleles would need to be sequenced. This is not possible as QTLs have not yet been cloned.
To take full advantage of the combined information, QTL meta‐analysis can judiciously be associated with a candidate gene approach (Ballini et al., 2008; Chardon et al., 2004). In Prunus, a large number of resistance gene analogues have already been added to the reference map (Lalli et al., 2005), and SSR markers targeting candidate genes have been developed and mapped in several progenies (Sicard et al., 2008). Recently, different copies of the eIF(iso)4G candidate gene have also been mapped in interspecific peach F1 and F2 populations (Marandel et al., 2009). Although, in P. davidiana, a striking co‐localization between several QTLs of resistance and eukaryotic translation initiation factors has been shown (Marandel et al., 2009), in P. armeniaca the situation is less obvious. Translation initiation factor eIF4E was, however, retained as a reliable candidate to metaQTL MetaPPV‐1.b. This factor and its isoforms have been shown in many plant species to control susceptibility or resistance to virus infection (for a recent review, see Robaglia and Caranta 2006). In most cases, inheritance of the resistance associated with these factors was shown to be recessive. However, Kang et al. (2007) observed a dominant resistance to Tobacco etch virus in a transgenic tomato expressing eIF4E ectopically. The authors suggested that the mutant factor would function to inhibit or interfere with an interaction that is essential for viral infectivity, but not required for host viability. The mutant eIF4E factor, the product of the resistance allele, would have a higher affinity for other proteins of the eIF4F complex. Among them is eIF4G, which would thus be sequestered. In Prunus, such a differential affinity could generate a dominant or, at least, co‐dominant resistance, depending on the level of this differential.
Concerning metaQTL MetaPPV‐1.a, candidate genes implied in the RNA silencing pathway were also identified. Products of these genes, i.e. Argonaute protein 1 and RNA‐directed RNA polymerase, are known to be implied in antiviral defence pathways (Vaucheret, 2008; Yu et al., 2003). Extensive work remains to be performed, however, to identify additional candidate genes, especially for the MetaPPV‐1.c metaQTL.
The QTL meta‐analysis was performed from a consensus Prunus map, gathering data from six distinct populations segregating for resistance to PPV. A step towards the identification of potential candidates to the resistance metaQTL involves the use of a reference map, such as the Prunus reference map, where a large number of ESTs have already been mapped. It is expected that EST mapping in the metaQTL confidence interval would help to identify resistance candidate genes. However, no candidate is more legitimate than another, except if it has already been identified as responsible for the trait in another species. This is the case for the eukaryotic translation initiation factors eIF4E and eIF4G in A. thaliana infected by PPV (Decroocq et al., 2006b; Nicaise et al., 2007).
As the physical map of the Prunus genomic region linked to PPV resistance is currently under construction, and sequencing of the peach whole genome is in progress (GDR, http://www.rosaceae.org), additional data should be integrated into the QTL meta‐analysis in the near future. The detected metaQTL will be projected on the physical map, thus engaging map‐based cloning of the resistance QTL.
In this study, we performed a QTL meta‐analysis applied to PPV resistance in Prunus species. Integration of the data originating from six independent studies led to the identification of four genomic regions, three mapping on LG1 and one on LG3. Candidate genes of interest were identified, among them the eukaryotic translation initiation factor eIF4E and genes implied in RNA silencing pathways. Additional data to be collected in the future and integrated in this analysis will allow cloning of the resistance QTL.
EXPERIMENTAL PROCEDURES
Plant material
‘Harlayne’, a North American cultivar resistant to PPV (Martinez‐Gomez and Dicenta, 2000), was crossed as a female parent with the PPV‐susceptible cultivar ‘Marlén’; 147 hybrids were obtained and maintained at the Crop Research Institute, Prague, Czech Republic.
PPV inoculation and detection of PPV infection
When stems of the seedlings reached about 5 mm in thickness, they were inoculated by chip‐budding using bark pieces from a PPV‐Rec‐infected plum tree (Glasa et al., 2004) showing typical symptoms of sharka. The seedlings were pruned immediately after grafting to promote the growth of the inoculated branch. Plants without sharka symptoms on the shoots growing from the inoculated branch, and with a negative enzyme‐linked immunosorbent assay (ELISA) reaction, were re‐inoculated by chip‐budding.
Symptoms of sharka infection were visually evaluated on apricot leaves. A 0–4‐scale‐based scoring method was used, taking into account the intensity and distribution in the tree as follows: 0, no symptoms; 1, very light yellow discoloration not easily discernible, and symptoms in one or two leaves; 2, at least two marked discolorations bordering leaf veins, and symptoms on more than two leaves; 3, several discolorations covering a large portion of the leaf, and symptoms on 10–30% of leaves; 4, numerous discolorations affecting the whole leaf and associated with leaf distortions, and symptoms on more than 30% of leaves. Each plant was evaluated twice per growth period. Concomitant with the symptom notations, ELISAs were performed to verify the presence or absence of the virus in the leaves of the inoculated seedlings. The plants for which ELISAs were negative were tested by reverse transcriptase‐polymerase chain reaction (RT‐PCR) using the PPV‐specific P1 and P2 primers (Wetzel et al., 1992).
After each 7‐month growth period in the screen house, plants were placed in a cold chamber at 5 °C for 5 months to fulfil chilling requirements and release bud dormancy. Pruning was performed at the beginning of each growth period to induce vigorous new shoots used for symptom scoring. PPV infection was evaluated over five consecutive growth periods from 2003 to 2007.
DNA isolation
DNA isolation was performed following the method of Doyle and Doyle (1987), and the purified DNA was quantified on 0.8% (w/v) agarose gels by comparison with lambda DNA (Sigma, St. Louis, MO, USA).
Development of PCR markers
Several candidate genes of interest have previously been identified, cloned and mapped in Prunus (Decroocq et al., 2005; Lalli et al., 2005). Among them, Cd211, coding for a eukaryotic translation initiation factor eIF(iso)4E, was transformed into a PCR marker. Starting from the fragment cloned by Decroocq et al. (2005), a primer walking strategy was performed, as described in Marandel et al. (2009), resulting in the development of an SSR marker named SSR5piso4E.
The SSR marker pchcms4 and the restriction fragment length polymorphism (RFLP) marker AG51 have been identified previously as the closest markers linked to the major QTLs of resistance to PPV in the apricot cultivar ‘Stark Early Orange’ (Lambert et al., 2007). A search of GDR (http://www.rosaceae.org) revealed three peach Nemared BAC clones (105D23, 105J14 and 107M10) positive for the AG51 marker (P. Lambert, INRA, Avignon, France, personal communication). These BAC clones were therefore targeted for microsatellite enrichment as described in Sicard et al. (2008). Three distinct microsatellite sequences were thus identified.
The genomic region, which flanks the Cd195 marker and contains a QTL of resistance in P. davidiana (Marandel et al., 2009), was targeted for SSR marker development. Two new SSR markers, named N86B11SSR2a and N86B11SSR3, were developed from the fully sequenced ‘Nemared’ BAC clone 86B11, which has been found previously to be positive to the Cd195 probe (V. Decroocq and A. Abbott, personal observations).
For all the developed markers, forward and reverse primers were designed (Table S1, see Supporting Information) using Primer 0.5 software (http://www.broad.mit.edu/ftp/distribution/software/Primer0.5/) with a calculated annealing temperature of 57 °C. Sequences were deposited in GenBank under accession numbers FJ378710–FJ378714. The developed markers were then tested for polymorphism in the ‘Harlayne’ × ‘Marlén’ cross, as described below.
SSR polymorphism and genotyping of the population
A total of 464 microsatellite markers, available in the literature or newly developed but unpublished, was tested for polymorphism in the ‘Harlayne’ × ‘Marlén’ cross (Table S2, see Supporting Information). For this, PCR amplifications were performed on both parents and on six F1 individuals, as described by Sicard et al. (2008). Amplification quality and specificity, as well as amplicon size, were checked by 3% agarose gel electrophoresis. When no amplification occurred, the annealing temperature was lowered from the published temperature of annealing to 46 °C. Thus, 369 markers amplified at different annealing temperatures ranging from 46 to 62 °C, and 95 failed to amplify. The segregation pattern was revealed on silver‐stained 6% denaturing acrylamide gels. If in doubt, the polymorphism was studied in up to 16 additional F1 individuals. Forty‐seven markers showed unclear segregation patterns and were thus not retained for further analysis; 151 markers were not polymorphic in the F1 population, i.e. both parents were homozygous. For 30, both parents were homozygous, but did not bear the same allele, so that the F1 population was homogeneous but heterozygous at these loci. Finally, 139 markers were polymorphic on the ‘Harlayne’ map and 125 on the ‘Marlén’ map, and 93 were found to be polymorphic on both maps; they were used as anchor markers to align the parental maps (Table S2, see Supporting Information). Of the 171 polymorphic markers, 114 SSR markers were selected for genotyping of the whole population based on their distribution on the Prunus reference map.
Genotyping of the whole population using 70 of the 114 selected SSR markers was performed using an ABI PRISM® 3130xl Genetic Analyzer (Applied Biosystems, Foster City, CA, USA) on the high‐throughput genotyping platform of INRA, Clermont‐Ferrand, France. PCR amplifications were carried out using directly dye‐labelled forward primers or, alternatively, M13‐tailed forward primers. The M13‐tailed forward primers were used in combination with a standard M13 primer dye‐labelled at its 5′ end (Boutin‐Ganache et al., 2001). Fragment migration was analysed using ABI PRISM® GeneMapper™ 4.0 software (Applied Biosystems).
PCR amplification of the other 44 selected SSR markers was performed with unlabelled primers. Amplicons were loaded onto 6% denaturing acrylamide gels, which were then silver‐stained as described by Decroocq et al. (2003).
Linkage analysis
Linkage analysis was carried out using Joinmap 3.0 software (Van Ooijen and Voorrips, 2001). Two data files, one for each parent ‘Harlayne’ and ‘Marlén’, were created. They contained the polymorphic loci on their respective maps. In order to evaluate the segregation ratio, the chi‐squared (χ2) goodness‐of‐fit test was performed using the ‘locus genotype frequency’ command. The LGs were established using a minimum threshold of LOD of 5.0 with the ‘LOD grouping’ command. Once the groups were determined, the map was calculated using a maximum recombination fraction θ of 0.4 and a minimum LOD score of 1.0, with a threshold for removing loci with respect to jumps in goodness of fit of 5.0. The framework obtained was then fixed using the ‘fixed order’ command. The Kosambi mapping function (Kosambi, 1944) was used to convert recombination units into genetic distances. Maps of each LG were drawn using MapChart 2.2 (Voorrips, 2002).
QTL analysis
QTL analysis was performed on the mean of the two visual scores of a growth period. The descriptive statistics were computed using R statistical software (R Development Core Team, 2006). Departure from normality of traits was tested using a χ2 goodness‐of‐fit test. Correlations between the phenotypic scores were calculated using the Pearson correlation coefficient. QTL detection was performed separately on both parental maps using both parametric and non‐parametric statistical methods. QTLs were first detected using the Kruskal–Wallis test (R Development Core Team, 2006) and by stepwise multiple linear regression using the MultiRegress procedure of QTLCartographer (Basten et al., 2002). For both tests, a P value of 5 × 10⁻³ was chosen as the detection threshold. QTLs were then detected by interval mapping using the Zmapqtl procedure of QTLCartographer (Basten et al., 2002). QTL mapping was refined by CIM analysis. Co‐factors of analysis were chosen by forward–backward stepwise regression using the SRmapqtl procedure. One thousand permutations were performed on each dataset to compute the experimental LOD threshold, using a 5% genome‐wide error rate. Both 95% and 90% confidence intervals (1 – LOD and 2 – LOD support intervals, respectively) were calculated when possible. Digenic epistatic interactions were investigated by two‐way analysis of variance between all possible combinations of marker pairs for each scoring date.
QTL meta‐analysis
Using all published QTL analyses of PPV resistance in P. davidiana and P. armeniaca (Table 3), a QTL meta‐analysis was performed using MetaQTL software (Veyrieras et al., 2007). The Prunus LG1 was analysed. On this LG, the main QTL of resistance was mapped in apricot cultivars ‘Stark Early Orange’ (Lambert et al., 2007), ‘Lito’ and ‘Goldrich’ (Soriano et al., 2008), ‘Harlayne’ (present study) and ‘LE‐3246’, a Czech selection related to ‘Stark Early Orange’ (Lalli et al., 2008). QTLs with intermediate and minor effects were mapped in P. davidiana, a wild peach‐related species, in F1 and F2 populations issued from a cross with the nectarine cultivar ‘Summergrand’ (Decroocq et al., 2005; Marandel et al., 2009). They were also included in this meta‐analysis. Meta‐analysis of LG3 was also performed, as minor QTLs were mapped on this LG in cultivars ‘Stark Early Orange’, ‘Polonais’ (Lambert et al., 2007) and ‘Harlayne’ (present work). Other LGs were not submitted to QTL meta‐analysis as interesting loci linked to PPV resistance were only detected in P. davidiana and not in P. armeniaca. On P. davidiana LG5, QTLs were not detected by interval mapping (Marandel et al., 2009), and thus could not be submitted to QTL meta‐analysis.
Table 3.
Quantitative trait locus (QTL) data used for meta‐analysis in this study.
| Cross name | Population structure | Trait name | N * | Map† | QTL name | LG‡ | LOD§ | R 2 ¶ | Reference |
|---|---|---|---|---|---|---|---|---|---|
| ‘Polonais’ × ‘Stark Early Orange’ | F1 | NSF1 | 104 | ‘Stark Early Orange’ | PPV1‐1s | 1 | 14.87 | 45.6 | Lambert et al. (2007) |
| PPV1‐2s | 1 | 3.52** | 15 | ||||||
| PPV3‐1s | 3 | 2.82 | 5.7 | ||||||
| ‘Polonais’ | PPV3‐1p | 3 | 2.45 | 9.2 | |||||
| NSF2 | 84 | ‘Stark Early Orange’ | PPV1‐1s | 1 | 15.74 | 56.2 | |||
| PPV1‐2s | 1 | 3.39** | 16.9 | ||||||
| PPV3‐1s | 3 | 2.94 | 5.7 | ||||||
| ‘Polonais’ | PPV3‐1p | 3 | 2.79 | 14.7 | |||||
| ‘Lito’ × ‘Lito’ | F2 | PPV | 81 | ‘Lito’ | PPV_Lito | 1 | 5.14** | 25.4 | Soriano et al. (2008) |
| ‘Goldrich’ × ‘Currot’ | F1 | PPV | 81 | ‘Goldrich’ | PPV_Gold | 1 | 6.05** | 36.8 | Soriano et al. (2008) |
| ‘SD40’ × ‘SD40’ | F2 | Not0405b | 69 | ‘SD40’ (P. davidiana) | PPV‐1.b | 1 | 3.02 | 12 | Marandel et al. (2009) |
| Not0905 | 68 | PPV‐1.b | 1 | 5.02 | 18 | ||||
| ‘LE‐3246’ × ‘Vestar’ | BC1 | PPV04 | 67 | ‘LE‐3246’ | PPV_LE‐3246 | 1 | 4.22†† | 24 | Lalli et al. (2008) |
| ‘Harlayne’ × ‘Marlén’ | F1 | GP2 | 141 | ‘Harlayne’ | PPV‐1H.c | 1 | 2.84 | 7.2 | Present study |
| GP3 | 145 | ‘Harlayne’ | PPV‐1H.a | 1 | 3.84 | 7.6 | |||
| PPV‐1H.b | 1 | 10.33 | 28.1 | ||||||
| PPV‐1H.c | 1 | 3.76 | 8.2 | ||||||
| PPV‐3H.a | 3 | 3.86 | 10.9 | ||||||
| GP4 | 145 | ‘Harlayne’ | PPV‐1H.a | 1 | 7.61 | 14.4 | |||
| PPV‐1H.b | 1 | 15.17 | 39.4 | ||||||
| PPV‐1H.c | 1 | 2.81 | 4.9 | ||||||
| GP5 | 140 | ‘Harlayne’ | PPV‐1H.a | 1 | 5.25 | 12.6 | |||
| PPV‐1H.b | 1 | 10.79 | 33.3 |
Size of the mapping population used to detect QTL.
Parental map on which QTL was detected.
Linkage group.
Logarithm of odds score (composite interval mapping).
Individual contribution of the QTL to phenotypic variance.
QTL detected by simple interval mapping.
Data analysed in this study to map QTL by composite interval mapping.
QTL meta‐analysis was carried out in three steps. First, a consensus map was built from the available genetic linkage maps. Particular attention was paid to potential inversions in marker order between the linkage maps, particularly in the QTL mapping areas. Second, the QTLs detected in each study were then projected on the consensus map. Such a projection is based on specific information related to the detected QTL, i.e. its position, LOD score at peak position, boundaries (1 – LOD support interval) and proportion of variance (R 2) explained by the QTL. Last, the QTL meta‐analysis algorithm implemented in MetaQTL software was used to determine the best‐fitting model, i.e. to determine the number of QTLs effectively underlying the observed QTL and their respective positions and confidence intervals.
Supporting information
Fig. S1 ‘Harlayne’ and ‘Marlen’ genetic linkage maps (all linkage groups except ‘Harlayne’ LG1 and LG3).
Table S1A Polymerase chain reaction (PCR) markers targeting candidate genes or restriction fragment length polymorphism (RFLP) markers.
Table S1B Single sequence repeat (SSR) markers developed from the ‘Nemared’ 86B11 BAC clone sequence.
Table S2 Single sequence repeat (SSR) markers studied for building of the ‘Harlayne’ × ‘Marlén’ genetic linkage map.
Table S3 Statistics of the evaluations for resistance to Plum pox virus (PPV).
Table S4 Pearson correlation coefficients between all scorings.
Table S5 Significant digenic epistatic interactions between quantitative trait locus (QTL) closest markers.
Please note: Wiley‐Blackwell are not responsible for the content or functionality of any supporting materials supplied by the authors. Any queries (other than missing material) should be directed to the corresponding author for the article.
Supporting info item
ACKNOWLEDGEMENTS
We wish to thank Dr P. Arùs and Dr W. Howad (CSIC‐IRTA, Cabrils, Spain), Dr T. Yamamoto (NIFTS, Tsukuba, Japan) and P. Lambert (INRA, Avignon, France) for kindly providing aliquots of labelled SSR primers. We also wish to thank Dr T. Zhebentyayeva for a critical review of the manuscript. GM is funded by a PhD fellowship from the French Ministry of Research and Education. He also received an EMBO short‐term fellowship and a Dufresnoy grant from the French Academy of Agriculture for part of this work. We also wish to thank the French and Czech foreign affairs for the bilateral project BARRANDE (10690YC), which funded GM's visit to the Czech Republic. High‐throughput genotyping of the mapping population on the platform of INRA Clermont‐Ferrand was supported by a special grant from INRA Genetic and Plant Breeding Department (Génotypage 2007 G36). This work is also currently supported by the French Ministry of Agriculture (contract number C05/31) and a fund distributed by Viniflhor. All experiments described in this paper comply with the current laws in the European Union.
REFERENCES
- Badenes, M.L. , Asins, M.J. , Carbonell, E.A. and Glacer, G. (1996) Genetic diversity in apricot, Prunus armeniaca, aimed at improving resistance to plum pox virus . Plant Breeding, 115, 133–139. [Google Scholar]
- Ballini, E. , Morel, J.B. , Droc, G. , Price, A. , Courtois, B. , Notteghem, J.L. and Tharreau, D. (2008) A genome‐wide meta‐analysis of rice blast resistance genes and quantitative trait loci provides new insights into partial and complete resistance. Mol. Plant–Microbe Interact. 21, 859–868. [DOI] [PubMed] [Google Scholar]
- Basten, C.J. , Weir, B.S. and Zeng, Z.B. (2002) QTL Cartographer: A Reference Manual and Tutorial for QTL Mapping (Department of Statistics, North Carolina State University, ed.). Raleigh, NC: North Carolina State University. [Google Scholar]
- Boutin‐Ganache, I. , Raposo, M. , Raymond, M. and Deschepper, C.F. (2001) M13‐tailed primers improve the readability and usability of microsatellite analyses performed with two different allele‐sizing methods. Biotechniques, 31, 24. [PubMed] [Google Scholar]
- Cambra, M. , Capote, N. , Myrta, A. and Llacer, G. (2006) Plum pox virus and the estimated costs associated with sharka disease. EPPO Bull. 36, 202–204. [Google Scholar]
- Caranta, C. , Lefebvre, V. and Palloix, A. (1997) Polygenic resistance of pepper to potyviruses consists of a combination of isolate‐specific and broad‐spectrum quantitative trait loci. Mol. Plant–Microbe Interact. 10, 872–878. [Google Scholar]
- Chardon, F. , Virlon, B. , Moreau, L. , Falque, M. , Joets, J. , Decousset, L. , Murigneux, A. and Charcosset, A. (2004) Genetic architecture of flowering time in maize as inferred from quantitative trait loci meta‐analysis and synteny conservation with the rice genome. Genetics, 168, 2169–2185. [DOI] [PMC free article] [PubMed] [Google Scholar]
- Darvasi, A. , Weinreb, A. , Minke, V. , Weller, J.I. and Soller, M. (1993) Detecting marker‐QTL linkage and estimating QTL gene effect and map location using a saturated genetic map. Genetics, 134, 943–951. [DOI] [PMC free article] [PubMed] [Google Scholar]
- Decroocq, V. , Fave, M.G. , Hagen, L. , Bordenave, L. and Decroocq, S. (2003) Development and transferability of apricot and grape EST microsatellite markers across taxa. Theor. Appl. Genet. 106, 912–922. [DOI] [PubMed] [Google Scholar]
- Decroocq, V. , Foulongne, M. , Lambert, P. , Le Gall, O. , Mantin, C. , Pascal, T. , Schurdi‐Levraud, V. and Kervella, J. (2005) Analogues of virus resistance genes map to QTLs for resistance to sharka disease in Prunus davidiana . Mol. Genet. Genomics, 272, 680–689. [DOI] [PubMed] [Google Scholar]
- Decroocq, V. , Ion, L. , Lansac, M. , Eyquard, J.P. and Schurdi‐Levraud, V. (2006a) Unravelling the prunus/plum pox virus interactions. EPPO Bull. 36, 346–349. [Google Scholar]
- Decroocq, V. , Sicard, O. , Alamillo, J.M. , Lansac, M. , Eyquard, J.P. , Garcia, J.A. , Candresse, T. , Le Gall, O. and Revers, F. (2006b) Multiple resistance traits control Plum pox virus infection in Arabidopsis thaliana . Mol. Plant–Microbe Interact. 19, 541–549. [DOI] [PubMed] [Google Scholar]
- Dondini, L. , Lain, O. , Geuna, F. , Banfi, R. , Gaiotti, F. , Tartarini, S. , Bassi, D. and Testolin, R. (2007) Development of a new SSR‐based linkage map in apricot and analysis of synteny with existing Prunus maps. Tree Genet. Genomes, 3, 239–249. [Google Scholar]
- Doyle, J. and Doyle, J. (1987) A rapid isolation procedure for small quantities of fresh leaf tissue. Phytochem. Bull. 19, 11–15. [Google Scholar]
- Glasa, M. , Palkovics, L. , Kominek, P. , Kabonne, G. , Pittnerova, S. , Kudela, O. , Candresse, T. and Subr, Z. (2004) Geographically and temporally distant natural recombinant isolates of Plum pox virus (PPV) are genetically very similar and form a unique PPV subgroup. J. Gen. Virol. 85, 2671–2681. [DOI] [PubMed] [Google Scholar]
- Ion‐Nagy, L. , Lansac, M. , Eyquard, J.P. , Salvador, B. , Garcia, J.A. , Le Gall, O. , Hernould, M. , Schurdi‐Levraud, V. and Decroocq, V. (2006) PPV long‐distance movement is occasionally permitted in resistant apricot hosts. Virus Res. 120, 70–78. [DOI] [PubMed] [Google Scholar]
- Kang, B.C. , Yeam, I. , Li, H.X. , Perez, K.W. and Jahn, M.M. (2007) Ectopic expression of a recessive resistance gene generates dominant potyvirus resistance in plants. Plant Biotechnol. J. 5, 526–536. [DOI] [PubMed] [Google Scholar]
- Kosambi, D.D. (1944) The estimation of map distance from recombination values. Ann. Eugen. 12, 172–175. [Google Scholar]
- Lalli, D.A. , Decroocq, V. , Blenda, A.V. , Schurdi‐Levraud, V. , Garay, L. , Le Gall, O. , Damsteegt, V. , Reighard, G.L. and Abbott, A.G. (2005) Identification and mapping of resistance gene analogs (RGAs) in Prunus: a resistance map for Prunus . Theor. Appl. Genet. 111, 1504–1513. [DOI] [PubMed] [Google Scholar]
- Lalli, D. , Abbott, A. , Zhebentyayeva, T. , Badenes, M. , Damsteegt, V. , Polák, J. , Krška, B. and Salava, J. (2008) A genetic linkage map for an apricot (Prunus armeniaca L.) BC1 population mapping plum pox virus resistance. Tree Genet. Genomes, 4, 481–493. [Google Scholar]
- Lambert, P. , Dicenta, F. , Rubio, M. and Audergon, J.M. (2007) QTL analysis of resistance to sharka disease in the apricot (Prunus armeniaca L.) ‘Polonais’ × ‘Stark Early Orange’ F1 progeny. Tree Genet. Genomes, 3, 299–309. [Google Scholar]
- Lander, E.S. and Botstein, D. (1989) Mapping Mendelian factors underlying quantitative traits using RFLP linkage maps. Genetics, 121, 185–199. [DOI] [PMC free article] [PubMed] [Google Scholar]
- Marandel, G. , Pascal, T. , Candresse, T. and Decroocq, V. (2009) Quantitative resistance to Plum pox virus in Prunus davidiana P1908 is linked to components of the eukaryotic translation initiation complex. Plant Pathol. DOI: 10.1111/j.1365‐3059.2008.02012.x [Google Scholar]
- Martinez‐Gomez, P. and Dicenta, F. (2000) Evaluation of resistance of apricot cultivars to a Spanish isolate of plum pox potyvirus (PPV). Plant Breed. 119, 179–181. [Google Scholar]
- Myrta, A. , Varga, A. and James, D. (2006) The complete genome sequence of an El Amar isolate of plum pox virus (PPV) and its phylogenetic relationship to other PPV strains. Arch. Virol. 151, 1189–1198. [DOI] [PubMed] [Google Scholar]
- Nicaise, V. , Gallois, J.L. , Chafiai, F. , Allen, L.M. , Schurdi‐Levraud, V. , Browning, K.S. , Candresse, T. , Caranta, C. , Le Gall, O. and German‐Retana, S. (2007) Coordinated and selective recruitment of eIF4E and eIF4G factors for potyvirus infection in Arabidopsis thaliana . FEBS Lett. 581, 1041–1046. [DOI] [PubMed] [Google Scholar]
- R Development Core Team (2006) R: A Language and Environment for Statistical Computing. Vienna: R Foundation for Statistical Computing. [Google Scholar]
- Robaglia, C. and Caranta, C. (2006) Translation initiation factors: a weak link in plant RNA virus infection. Trends Plant Sci. 11, 40–45. [DOI] [PubMed] [Google Scholar]
- Romero, C. , Vilanova, S. , Soriano, J.M. , Martinez‐Calvo, J. , Abernathy, D. , Llacer, G. , Abbott, A.G. and Badenes, M.L. (2005) New approaches for mapping PPV (plum pox virus) resistance in apricot (Prunus armeniaca L.). Phytopathol. Polon. 36, 85–89. [Google Scholar]
- Sicard, O. , Marandel, G. , Soriano, J.M. , Lalli, D.A. , Lambert, P. , Salava, J. , Badenes, M.L. , Abbott, A.G. and Decroocq, V. (2008) Flanking the major Plum pox virus resistance locus in apricot with co‐dominant markers (SSRs) derived from candidate resistance genes. Tree Genet. Genomes, 4, 359–365. [Google Scholar]
- Soriano, J. , Vera‐Ruiz, E. , Vilanova, S. , Martínez‐Calvo, J. , Llácer, G. , Badenes, M. and Romero, C. (2008) Identification and mapping of a locus conferring plum pox virus resistance in two apricot‐improved linkage maps. Tree Genet. Genomes, 4, 391–402. [Google Scholar]
- Van Ooijen, J.W. and Voorrips, R.E. (2001) JoinMap 3.0, Software for the Calculation of Genetic Linkage Maps. Wageningen: Plant Research International. [Google Scholar]
- Vaucheret, H. (2008) Plant ARGONAUTES. Trends Plant Sci. 13, 350–358. [DOI] [PubMed] [Google Scholar]
- Veyrieras, J.B. , Goffinet, B. and Charcosset, A. (2007) MetaQTL: a package of new computational methods for the meta‐analysis of QTL mapping experiments. BMC Bioinformatics, 8, 49. [DOI] [PMC free article] [PubMed] [Google Scholar]
- Vilanova, S. , Romero, C. , Abbott, A.G. , Llacer, G. and Badenes, M.L. (2003) An apricot (Prunus armeniaca L.) F2 progeny linkage map based on SSR and AFLP markers, mapping plum pox virus resistance and self‐incompatibility traits. Theor. Appl. Genet. 107, 239–247. [DOI] [PubMed] [Google Scholar]
- Voorrips, R.E. (2002) MapChart: Software for the graphical presentation of linkage maps and QTLs J. Hered. 93, 77–78. [DOI] [PubMed] [Google Scholar]
- Wetzel, T. , Candresse, T. , Macquaire, G. , Ravelonandro, M. and Dunez, J. (1992) A highly sensitive immunocapture polymerase chain‐reaction method for plum pox potyvirus detection. J. Virol. Methods, 39, 27–37. [DOI] [PubMed] [Google Scholar]
- Yu, D.Q. , Fan, B.F. , MacFarlane, S.A. and Chen, Z.X. (2003) Analysis of the involvement of an inducible Arabidopsis RNA‐dependent RNA polymerase in antiviral defense. Mol. Plant–Microbe Interact. 16, 206–216. [DOI] [PubMed] [Google Scholar]
- Zhebentyayeva, T. , Reighard, G. , Lalli, D. , Gorina, V. , Krška, B. and Abbott, A. (2008) Origin of resistance to plum pox virus in apricot: what new AFLP and targeted SSR data analyses tell. Tree Genet. Genomes, 4, 403–417. [Google Scholar]
Associated Data
This section collects any data citations, data availability statements, or supplementary materials included in this article.
Supplementary Materials
Fig. S1 ‘Harlayne’ and ‘Marlen’ genetic linkage maps (all linkage groups except ‘Harlayne’ LG1 and LG3).
Table S1A Polymerase chain reaction (PCR) markers targeting candidate genes or restriction fragment length polymorphism (RFLP) markers.
Table S1B Single sequence repeat (SSR) markers developed from the ‘Nemared’ 86B11 BAC clone sequence.
Table S2 Single sequence repeat (SSR) markers studied for building of the ‘Harlayne’ × ‘Marlén’ genetic linkage map.
Table S3 Statistics of the evaluations for resistance to Plum pox virus (PPV).
Table S4 Pearson correlation coefficients between all scorings.
Table S5 Significant digenic epistatic interactions between quantitative trait locus (QTL) closest markers.
Please note: Wiley‐Blackwell are not responsible for the content or functionality of any supporting materials supplied by the authors. Any queries (other than missing material) should be directed to the corresponding author for the article.
Supporting info item