

ABSTRACT
Gene technology can offer creative solutions to problems of agronomical relevance, which may not be solved by conventional breeding methods. One of the major problems of wheat cultivation is disease caused by a number of fungal pathogens including the wheat powdery mildew fungus Blumeria graminis f.sp. tritici (Bgt). Transgenic wheat plants that constitutively express the coding sequence of the defence‐related wheat peroxidase TaPrx103 (previously TaPERO) in shoot epidermis under the control of the wheat GstA1 promoter were generated and found to exhibit enhanced resistance to Bgt (Altpeter et al., Plant. Mol. Biol. 57, 271–283). Here, I report on physiological and molecular analyses of these plants in order to assess the mode of action of the peroxidase encoded by the TaGstA1:TaPrx103 transgene. Epidermal cells of transgenic lines with enhanced resistance were found to respond to Bgt attack more frequently with hypersensitive cell death and the generation of hydrogen peroxide. By contrast, resistance of epidermal cell walls to degradation by fungal enzymes appeared to be similar in transgenic and wild‐type plants. Moreover, the analysis of the abundance of approximately 10 000 wheat transcripts revealed no significant effect of the GstA1i:TaPrx103 transgene on host gene expression in non‐inoculated leaves and only a marginal effect in Bgt‐challenged leaves, compared with wild‐type plants treated in the same manner. The results indicate that the TaPrx103 protein is involved in generating reactive oxygen species specifically in pathogen‐attacked cells, which may lead to localized cell death and resistance. I therefore suggest that the transgenic plants presented here can be regarded as substantially equivalent to non‐transgenic wheat.
INTRODUCTION
Wheat plants respond to pathogen attack with the accumulation of a number of transcripts that are speculated to play a role in basal (quantitative) resistance, race‐specific resistance mediated by major resistance (R) genes, or non‐host resistance (Han et al., 2005; Liu et al., 2005; Schweizer et al., 1989). A role for several differentially expressed host genes in either controlling potentially self‐destructive defence responses or in supporting the successful fungus cannot be excluded either (Hückelhoven et al., 2003; Piffanelli et al., 2002). In order to understand gene function in plant pathogen interactions better, a number of genetic and genomic tools and approaches have been developed. In the cereal species of wheat and barley, transient overexpression or silencing of candidate genes in single epidermal cells, which are attacked by powdery mildew fungi, has become instrumental to address gene function (Douchkov et al., 2005; Schweizer et al., 1999b, 2000; Shirasu et al., 1999). This resulted in the identification of a number of host genes in wheat that appear to be required for basal resistance against Blumeria graminis f.sp. tritici Bgt. The gene with the strongest resistance‐enhancing effect by transient overexpression encodes a secreted class III peroxidase, TaPERO, with unknown substrate specificity (Christensen et al., 2004; Schweizer et al., 1999b). Plant peroxidases have recently been systematically classified, which resulted in renaming TaPERO as TaPrx103 (Bakalovic et al., 2006; http://peroxidase.isb‐sib.ch). Thus, I will use the new and more consistent nomenclature for all peroxidases discussed herein. The TaPrx103 protein consists of 312 amino acids, of which the first 22 form a putative signal sequence, and has a calculated mass of 31 kDa and a pI of 5.7 as mature protein, not taking into account possible glycosylation (Rebmann et al., 1991). The barley orthologous protein HvPrx08 has been shown to possess guajacol‐peroxidase activity (Kristensen et al., 1997), which is typical for many class III peroxidases. Interestingly, the TaPrx103 gene or group of paralogous genes are not expressed in Bgt‐attacked wheat epidermis, which is the tissue that directly interacts with the pathogen, but are strongly up‐regulated in inner leaf tissue (Altpeter et al., 2005).
This finding was the starting point for the generation of transgenic wheat plants that overexpress TaPrx103 in the shoot epidermis. For this purpose, the coding sequence of TaPrx103 was fused to the promoter of the glutathione‐S‐transferase (Gst) A1 gene, which was found to direct constitutive transgene expression mainly in leaf epidermis. A preliminary characterization of GstA1i:TaPrx103 transgenic plants revealed that some transgenic lines possessed enhanced resistance of flag leaves to Bgt, whereas plant status and yield parameters remained unaffected by the transgene (Altpeter et al., 2005). Together with the fact that peroxidases are potentially harmful proteins that have been reported to cause stunting or wilting of transgenic plants (Lagrimini et al., 1990, 1997), the more specific phenotype of GstA1i:TaPrx103 transgenic wheat indicated a beneficial effect of using a tissue‐specific promoter. The epidermis‐specific expression of the GstA1i:TaPrx103 transgene may also be compatible with the concept of substantial equivalence of transgenic as compared with non‐transformed plants. This concept has attracted attention recently in the discussion regarding risks associated with genetically engineered crops including wheat (Baker et al., 2006; Baudo et al., 2006).
Here, I present physiological and molecular characterization of GstA1i:TaPrx103 transgenic T2 plants with the aim of addressing the mode of action of TaPrx103 and substantial equivalence of transgenic lines as compared with wild‐type wheat.
RESULTS
Enhanced resistance of transgenic plants
Originally, 19 primary transgenic T0 plants were obtained from biolistic transformation of immature wheat embryos with plasmid pGstA1i:TaPrx103, as reported earlier (supplementary Fig. S1, Altpeter et al., 2005). A pool of approximately 20 T1 progeny of these primary transformants were tested for constitutive accumulation of TaPrx103 protein by using an antiserum directed against the orthologous barley HvPrx08 peroxidase (Kerby and Somerville, 1992). As shown in Fig. 1, all transgenic lines expressed TaPrx103 to different extent, in contrast to cv. Bobwhite (BW) wild‐type plants in which no peroxidase protein was detected. The TaPrx103 protein was accumulating in the intercellular washing fluid of transgenic plants, indicating correct secretion into the leaf apoplast. Based on this result and on preliminary resistance, tests three lines (nos. 2013, 2062 and 2193) were chosen for further analysis (boxed in Fig. 1).
Figure 1.
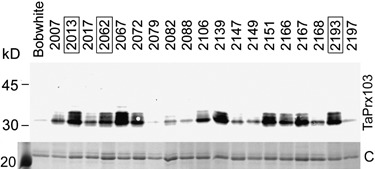
Analysis by Western blotting of TaPrx103 protein accumulation in T1 seedlings of transgenic lines carrying GstA1i::TaPrx103. Acid‐soluble (pH 2.8) proteins in intercellular washing fluid (IWF) were separated by SDS‐PAGE and blotted onto nitrocellulose. TaPrx103 protein was detected by an antiserum directed against the homologous protein HvPrx08 of barley. The transgene product has an expected mass of approximately 31 kDa. Coomassie‐stained IWF run in parallel served as loading controls (C). Shown is the major protein band corresponding to the germin‐like protein HvGER2 (Vallelian‐Bindschedler et al., 1998).
T2 progeny of these T1 plants were tested for resistance to Bgt at the adult plant stage (Table 1). All three transgenic lines showed significantly enhanced resistance of flag leaves. Figure 2 shows examples of engineered adult plant resistance against a spontaneous Bgt epidemic in the greenhouse that was not controlled by fungicide. Please note that although transgenic lines were not fully resistant the number of sporulating pustules was reduced. The same lines were also found to be partially resistant against Bgt at the seedling stage (Table 2). The weaker protection of seedlings compared with adult plants appears not to be due to weak transgene product accumulation in the former because strong signals were obtained in Western blots of first leaves (Fig. 1), although no direct comparison of young versus adult plants has been performed with respect to recombinant TaPrx103 accumulation. Therefore, substrate availability might be more limiting in seedling leaves compared with the flag leaf of adult plants.
Table 1.
Enhanced resistance of adult transgenic plants expressing the TaPrx103 gene.
| Line no. | Bobwhite | Transgenic plants | Chi‐squared test‡ | |
|---|---|---|---|---|
| Percentage infection* | Percentage infection* | Relative infection (%)† | ||
| 2013 | 27.3 | 13.1 | 48.0 | < 0.0001 |
| 2062 | 31.6 | 11.3 | 35.7 | < 0.0001 |
| 2193 | 33.5 | 10.9 | 32.5 | < 0.0001 |
Infection rates (percentage of mildewed leaf surface) on flag leaves.
Infection relative to Bobwhite wild‐type plants.
Test for significant differences in the distribution of disease rating classes between transgenic plants and corresponding Bobwhite plants. Results are based on two to three independent experiments using independent batches of plants sown on different dates.
Figure 2.

Resistance phenotype of adult transgenic T2 plants compared with wild‐type wheat. Pictures were taken approximately 4 weeks after the outbreak of a spontaneous Bgt epidemic in the greenhouse. Numbers in lower left corners of panels indicate transgenic lines.
Table 2.
Enhanced resistance of transgenic seedlings expressing the TaPrx103 gene.
| Line no. | Bobwhite | Transgenic seedlings | Chi‐squared test‡ | |
|---|---|---|---|---|
| Percentage infection* | Percentage infection* | Relative infection (%)† | ||
| 2013 | 42.65 | 28.21 | 66.1 | 0.045 |
| 2062 | 50.5 | 31.61 | 62.6 | 0.0084 |
| 2193 | 65.75 | 46.78 | 71.2 | 0.017 |
Average infection rates (percentage of mildewed leaf surface) on second and third leaves of 4‐week‐old seedlings of the T2 generation.
Infection relative to Bobwhite wild‐type plants.
Test for significant differences in the distribution of disease rating classes between transgenic plants and corresponding Bobwhite plants.
By using a total of ten sister lines from lines 2062 and 2193 I carried out a co‐segregation analysis of transgene expression with resistance to Bgt (Fig. 3). More precisely, TaPrx103 mRNA accumulation in the leaf below the flag leaf was quantified by using a spotted RNA array and associated with observed Bgt resistance in the flag leaf of the same plant. This should be more conclusive than co‐segregation analysis of transgene DNA with protection because transgene expression levels may vary between transgene‐carrying plants, e.g. depending on homo‐ or heterozygosity or silencing of the transgene locus. Line 2013 was not included in this co‐segregation analysis because sister lines 2013/3 and 2013/5 were found to be homozygous for GstA1i:TaPrx103 based on transgene‐specific PCR from a total of 96 plants (data not shown). Homozygosity of these sister lines has been previously suggested, on the basis of segregation of the NptII resistance marker (Altpeter et al., 2005). We previously observed that hybridization of Northern blots with a transgene‐specific oligonucleotide probe hybridizing to the chimeric GstA1i:TaPrx103 5′ non‐translated leader produced no signal, probably due to limited sensitivity of the assay. Therefore, a near full‐length cDNA probe of TaPrx103 was used to detect transgene expression here. In order to confirm that the TaPrx103 signal on the RNA array reflected transgene, and not spurious endogenous TaPrx103 expression, I verified the transgenic nature of the signals on the RNA array by transgene‐specific RT‐PCR in subline 2193b (supplementary Fig. S2). Clearly, the TaPrx103 hybridization signals co‐segregated with the abundance of an amplification product of the expected size obtained by transgene‐specific RT‐PCR of the same plants. As shown in Fig. 3A, all of the analysed sister lines showed a segregating pattern of TaPrx103 mRNA abundance, except for subline 2193d in which no expression was detected. In cv. Bobwhite wild‐type plants, TaPrx103 mRNA was not detectable, unless plants were Bgt inoculated (rows ‘BW’ and ‘BW pools’). Transgene‐specific PCR from genomic DNA of five pooled plants confirmed the presence of a null allele in subline 2193d while all other sublines were positive for the GstA1i:TaPrx103 transgene (Fig. 3C, and data not shown). I conclude from these data that the selected sister sublines were heterozygous for the effector transgene. The presence of approximately 25% null‐allele carriers in lines 2062 and 2193 suggests that the observed resistance may be an underestimation of the protective potential of TaPrx103. Comparison of Bgt resistance of sister lines 2193b and 2193d that were heterozygous and null allelic for the transgene, respectively, resulted in a clear association of resistance with the presence of the transgene (Fig. 3B). The fact that the homozygous line 2013 was not more resistant than the heterozygous lines 2062 and 2193 also indicated that the GstA1i:TaPrx103 transgene was inherited as a fully dominant trait.
Figure 3.

Segregation analysis of GstA1i:TaPrx103 expression in T2 transgenic lines. (A) A spotted RNA array was used to measure the abundance of TaPrx103 mRNA in the non‐inoculated leaf immediately below the flag leaf of adult individual T2 plants (transgenic lines indicated to the right side of the array). BW, non‐inoculated leaf immediately below the flag leaf of five individual wild‐type plants; BW pools, primary leaves of five seedlings (either non‐inoculated or Bgt‐challenged) were pooled for each RNA extraction. The lower panel shows hybridization signals of a 26S rRNA probe that served for signal normalization. (B) Resistance data of two sublines of transgenic line 2193 that either carry the transgene (2193b) or the null‐allele (2193d). Susceptibility (%) relative to wild‐type plants is shown. Statistical significance of difference from the control was tested by chi‐squared analysis, based on two independent experiments with different batches of plants. (C) Bulk analysis of transgene presence in lines 2193b and 2193d by genomic PCR.
Two groups with highest or lowest TaPrx103 mRNA abundance were formed, each containing 48 plants across all transgenic (sister) lines. These two groups of plants were analysed for association of TaPrx103 mRNA abundance with resistance of the flag leaves against Bgt (Fig. 4). There was a significant, positive association between TaPrx103 mRNA abundance and resistance against Bgt (χ2 = 0.03), indicating that plant protection was due to GstA1i:TaPrx103 transgene expression.
Figure 4.
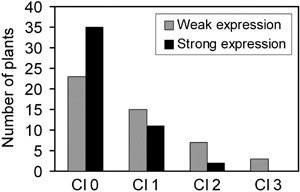
Co‐segregation analysis of transgene expression with resistance to Bgt. Expression of TaPrx103 in non‐inoculated leaves immediately below the flag leaf of adult transgenic plants was related to Bgt resistance of flag leaves from the same individuals. Two groups with highest or lowest TaPrx103 mRNA abundance were formed, each consisting of 48 plants.. For this analysis, plants from all transgenic lines shown in Fig. 3 were pooled. Cl0 to Cl3, disease scoring classes 0 (resistant) to 3 (fully susceptible).
Hypersensitive cell death, H2O2 generation and cell‐wall degradation of transgenic plants
Epidermal cell‐wall reinforcement (papilla formation) and hypersensitive cell death (HR) are typical defence reactions of wheat against Bgt or B. graminis f.sp. hordei whereas no clear association of either reaction with race specificity of an interaction can be found. For example, basal, race‐non‐specific host resistance has been described to be characterized by papilla formation, whereas race‐non‐specific non‐host resistance was found to be associated with HR (Kmecl et al., 1995; Wei et al., 1994). These two types of response can be easily distinguished by a local versus a whole‐cell autofluorescence that builds up in attacked cells. In order to address the question of whether the observed protection by epidermal TaPrx103 overexpression was the result of (1) a direct antifungal effect of the recombinant peroxidase, (2) enhanced papilla formation at sites of attempted penetration or (3) enhanced HR, I performed microscopic analysis of attacked epidermal cells in leaves of 4‐week‐old seedlings that were found to show enhanced resistance aginst Bgt, although somewhat weaker than flag leaves (1, 2). As shown in Table 3 all three analysed transgenic lines exhibited a significantly increased rate of whole‐cell autofluorescence, indicating increased HR (see Fig. 5A for an example of an autofluorescing cell). Virtually no localized autofluorescence was detected on Bobwhite wild‐type or transgenic lines (data not shown). I therefore conclude that the papilla response is not important in the observed wheat–Bgt interaction. Moreover, no enhanced whole‐cell autofluorescence was found in non‐attacked cells of transgenic plants, indicating the absence of spontaneous cell death due to transgene expression (data not shown).
Table 3.
Increased hypersensitive cell death of attacked epidermal cells of transgenic seedlings expressing the GstA1i:TaPrx103 transgene.
| Leaf | Line* | Autofluorescing cells (%)† | P (t‐test) | Leaves | Sites |
|---|---|---|---|---|---|
| 1st | Bobwhite | 9.2 ± 2.7 | 20 | 353 | |
| 1st | 2013 | 22.6 ± 3.1 | 0.002 | 19 | 371 |
| 1st | 2062 | 20.8 ± 1.9 | 0.001 | 20 | 384 |
| 1st | 2193 | 17.0 ± 2.4 | 0.037 | 19 | 326 |
| 2nd | Bobwhite | 12.3 ± 2.4 | 20 | 401 | |
| 2nd | 2013 | 25.1 ± 3.8 | 0.006 | 19 | 359 |
| 2nd | 2062 | 19.6 ± 2.6 | 0.041 | 19 | 375 |
| 2nd | 2193 | 25.8 ± 3.9 | 0.005 | 19 | 380 |
Four‐week‐old seedlings of the T2 generation were used (one subline per line).
Mean values ± SE of pooled data from two independent inoculation experiments with different batches of plants.
Figure 5.

Whole‐cell autofluorescence and H2O2 burst revealed by DAB staining of Bgt‐attacked epidermal cells of transgenic plants. Whole‐cell autofluorescence (A) and DAB staining (B) was recorded at 36 and 20 h post‐inoculation, respectively. Arrows point at fungal appressoria. Scale bars = 25 µm.
The next question was whether the observed HR was associated with enhanced formation of H2O2 as has been observed previously in barley interacting with powdery mildew fungi (Hückelhoven et al., 2001; Piffanelli et al., 2002; Thordal‐Christensen et al., 1997). Indeed, the results presented in Table 4 suggest that attacked epidermal cells of transgenic 4‐week‐old seedlings generated more H2O2 that was reflected by enhanced 3,3‐diaminobenzdine (DAB) staining, although statistical significance was lower compared with the autofluorescence data. In line with the autofluorescence data, DAB staining also encompassed entire cells, supporting the conclusion that these underwent an HR (Fig. 5B).
Table 4.
Increased generation of H2O2 of attacked epidermal cells of transgenic seedlings expressing the GstA1i:TaPrx103 transgene.
| Line* | DAB‐stained cells (%)† | P (Mann–Whitney)‡ | Leaves | Sites |
|---|---|---|---|---|
| Bobwhite | 6.4 ± 1.1 | 51 | 1090 | |
| 2013 | 10.9 ± 2.0 | 0.056 | 39 | 813 |
| 2062 | 15.6 ± 2.2 | 0.0001 | 34 | 772 |
| 2193 | 10.6 ± 2.2 | 0.14 | 40 | 852 |
Secondary and third leaves from 4‐week‐old seedlings of the T2 generation were analysed (one subline per line).
Mean values ± SE of pooled data from two independent inoculation experiments using different batches of plants.
A non‐parametric test was used because data were non‐normally distributed.
Class III peroxidases have long been implicated in cell‐wall lignification although only a limited number of reports are available suggesting a direct effect of altered peroxidase expression on cell‐wall properties of plants (Elfstrand et al., 2002; Li et al., 2003; Ostergaard et al., 2000). In the present study, the enhanced cell death of transgenic plants could have been the consequence of impaired fungal cell‐wall penetration due to constitutive, Prx103‐catalysed cell‐wall modification, thereby preventing the timely release of suppressors of defence (Lyngkjaer and Carver, 1999). Since Bgh, which is closely related to Bgt, has been shown to penetrate barley cell walls with the aid of cell‐wall‐degrading enzymes it appears possible that enhanced penetration resistance of TaPrx103‐overexpressing wheat was due to reduced digestibility of epidermal cell walls by these fungal enzymes (Pryce‐Jones et al., 1999). This possibility was addressed by using a newly developed assay that is based on the quantification of remaining epidermal cross‐cell walls after incubation with cell‐wall‐degrading enzymes (Fig. 6A,B; see Experimental procedures for details). In order to test whether the assay was capable of reporting altered cell‐wall digestibility, I compared the rate of cross‐cell‐wall degradation in older versus young, elongating leaves from wild‐type plants. The result shows a clearly enhanced resistance of cell walls from older leaves to enzymatic degradation, according to previous observations and knowledge regarding secondary cell‐wall formation (Fig. 6C; Scobbie et al., 1993). In contrast to this result, no significant difference in epidermal cell‐wall digestibility was observed between wild‐type and transgenic, 4‐week‐old seedlings, suggesting that preformed cell‐wall reinforcement was not a major mechanism of Prx103‐mediated resistance to Bgt (Fig. 6D).
Figure 6.

Epidermal cell walls of transgenic plants do not exhibit enhanced resistance to fungal cell‐wall‐degrading enzymes. (A) The cell‐wall degradation of immobilized epidermis was measured after incubation beneath a drop of a cell‐wall‐degrading enzyme cocktail. (B) Microscopic image (100× magnification) of partially degraded epidermal cross‐cell walls after 120 min of incubation. Black arrows, still intact walls; red arrows, digested walls. Scale bar = 50 µm. (C) Different rates of cross‐cell walls from old versus young, elongating leaves. Data are shown as mean ± SE from four parallel plants. (D) Comparison of cell‐wall digestibility of wild‐type plants versus homozygous transgenic line #2013. Data are shown as mean ± SE from five parallel plants. A repeated independent experiment using plants from a different sowing date produced a similar result.
Host‐gene expression in GstA1i:TaPrx103 transgenic plants
The ectopic expression of potentially harmful transgenes like peroxidases may lead to pleitropic effects in the recipient organism. This is usually not a desired trait and might be avoided by expressing such transgenes under the control of a tissue‐specific and/or inducible promoter. In order to test whether constitutive TaPrx103 expression in wheat epidermis caused pleiotropic effects, I monitored transcript abundance of approximately 10 000 unigenes by using the ‘barleyPGRC1’ cDNA array of the IPK. This array was found to be useful for transcript profiling not only in barley but also in wheat based on the following observations. First, powdery mildew attack did not result in lower numbers of differentially regulated genes based on statistical criteria mentioned below (558 in wheat at 15 h post‐inoculation versus 187 in barley at 12 h post‐inoculation), indicating that gene‐regulation events were picked up in wheat in a sensitive manner. Secondly, regulation trends of the 558 powdery mildew‐responsive transcripts in wheat were similar in barley (correlation coefficient = 0.56; supplementary Table S1). Moreover, the technical reproducibility of the barleyPGRC1 array was found to be high, based on repeated hybridization of a single 33P‐labelled cDNA probe to different membranes (supplementary Fig. S3).
In resistant interactions of barley with Bgt, which are probably physiologically similar to resistant wheat–Bgt interactions, whole‐cell DAB staining (reflecting HR) was observed from 18 h post‐inoculation onwards (Hückelhoven et al., 2001). Therefore, I decided to analyse the wheat transcriptome at 15 h post‐inoculation, which is 3 h prior to the first reported manifestation of HR. This should maximize the chance to see cell death‐related changes in the transcriptome of Bgt‐attacked, transgenic lines. The data of two independent inoculation experiments are shown in Fig. 7 and supplementary Table S1. In a split‐plot design, half of the Bobwhite wild‐type or TaPrx103‐transgenic seedlings were left non‐inoculated as controls whereas the other half were inoculated with Bgt. Statistical analysis of the normalized signal intensities resulted in the identification of 558 genes that were significantly regulated by Bgt attack in cv. Bobwhite [> two‐fold; P < 0.05 and false‐discovery rate (FDR) < 0.05]. The most dramatically up‐regulated transcripts coded for several peroxidases, a thaumatin‐like protein, ethylene‐forming enzyme, phenylalanine‐ammonia lyase, protein phosphatase, chitinase and glutathione‐S‐transferase (supplementary Table S1). Many of the most dramatically down‐regulated transcripts coded for components and enzymes of photosynthesis. These results are in good agreement with previous findings of Blumeria‐attacked wheat and barley and confirm the sensitivity of the barleyPGRC1 array for the detection of transcriptional changes in the closely related species wheat (Bruggmann et al., 2005; Zierold et al., 2005). By contrast, hierarchical clustering of transcript abundance of these pathogen‐regulated genes did not reveal any clear difference between wild‐type plants and transgenic lines in non‐inoculated or in Bgt‐challenged leaves although the effect of Bgt attack was evident irrespective of plant genotype (Fig. 7). In general, expression patterns among samples from non‐inoculated tissue were more similar, indicating that the external stimulus (Bgt) increased some scattering of the data. By interrogating the entire unigene set of the 10k cDNA array I could not identify any differentially regulated gene between transgenic and wild‐type plants by applying the above‐mentioned statistical criteria, irrespective of whether non‐inoculated or Bgt‐inoculated plants were used for the analysis (data not shown). In inoculated leaves, this lack of differential gene expression might reflect dilution of those epidermal cells that were in direct contact with the fungus and that showed enhanced HR. Therefore, single‐cell sampling of such attacked cells might reveal transgene‐dependent gene regulation events. One transcript that would be expected to show differential abundance between GstA1i:TaPrx103 transgenic lines and Bobwhite would be TaPrx103 itself. However, the array design does not include HvPrx08, which is the proposed barley gene orthologue to TaPrx103. Blast analysis suggested that none of the peroxidase‐encoding cDNAs on the array produced strong enough cross‐hybridizing signals to TaPrx103 (data not shown).
Figure 7.

GstA1:TaPrx103 expression in wheat epidermis does not affect host gene expression in leaves. Hierarchical clustering of 558 pathogen‐regulated host genes in wild‐type and transgenic plants. Signal intensities were log‐transformed and median centred per gene, prior to hierarchical clustering by using Euclidian distance and average linkage settings.
DISCUSSION
Transgenic approaches to durable disease resistance not based on transfer of NBS‐LRR type R‐genes in wheat have produced the first encouraging data regarding the interaction with Bgt, Puccinia sp., Tilletia and Fusarium sp., although in only one case was resistance also tested under field conditions (Altpeter et al., 2005; Bieri et al., 2003; Makandar et al., 2006; Schlaich et al., 2006). The results presented here represent a mode of action study to one of these beneficial transgene products, the TaPrx103 peroxidase of wheat.
Plant class III peroxidases have been proposed as key regulators of the level of extracellular H2O2 and as producers of the extremely reactive oxygen intermediates (ROI) OH• and OOH•, depending on whether the peroxidative (catalytic) or the hydoxylic cycles of the enzyme are operating (Kawano, 2003; Passardi et al., 2004). During one peroxidative cycle, one consumed molecule of H2O2 can maximally lead to two produced H2O2 molecules if the two oxidized peroxidase products (X•) react with two O2 molecules to produce superoxide radicals, which are converted spontaneously or catalysed by superoxide dismutase to H2O2. Apoplastic class III peroxidases have long been proposed as producers of ROI including enzymes from tobacco and french bean (Bindschedler et al., 2006; Bolwell et al., 2002; Mader and Ambergfisher, 1982; Peng and Kuc, 1992). Current models of plant defence responses include peroxidase‐generated radicals and ROI as catalysts of covalent cell‐wall modifications (Barcelo, 1995; Harkin and Obst, 1973; Ostergaard et al., 2000) as well as signals for cell‐death reactions (Bestwick et al., 1998; Martinez et al., 1998; Passardi et al., 2004). NADPH‐oxidase encoded by RBOHA–F genes is considered to represent the second, main source of apoplastic ROI, and many conclusions about the importance of this enzyme in the generation of stress‐induced oxidative burst have been drawn from pharmacological studies using the inhibitor diphenyleneiodonium. However, this compound also inhibits class III peroxidases, which might have led to an underestimation of their role in ROI generation (Frahry and Schopfer, 1998). The enhanced DAB staining in epidermal cells of GstA1i:TaPrx103 transgenic lines that are in contact with an appressorium of Bgt supports a role of the TaPrx103 peroxidase in the generation of H2O2 in pathogen‐attacked wheat. The co‐incidence of enhanced DAB staining and enhanced autofluorescence of attacked epidermal cells of transgenic plants suggests that the proposed H2O2‐generating activity of TaPrx103 provides a signal for cell death. However, the substrate(s) for the underlying peroxidative reaction are currently unknown. Interestingly, one strongly accumulating extracellular marker protein of powdery mildew‐attacked barley epidermis, HvGER4, possesses superoxide‐dismutase activity (Christensen et al., 2004). Powdery mildew attack of wheat causes the accumulation of mRNA encoding an orthologuous protein named TaGLP4, which most probably is a functional superoxide dismutase, too, because both HvGER4 and TaGLP4 enhanced resistance upon transient overexpression in wheat and barley (Christensen et al., 2004; Schweizer et al., 1999a). Therefore, it may be that TaGLP4 is supporting TaPrx103 in generating the observed H2O2 burst upon pathogen attack by efficiently converting the secondary peroxidase product superoxide radical into H2O2.
The question arises as to the role of endogenous TaPrx103, which is expressed in inner leaf tissues, in the pathogen defence of wheat. Why has co‐evolution of wheat with Bgt not selected for enhanced TaPrx103 expression in wheat epidermis (Altpeter et al., 2005)? One possibility would be that expression of the TaPrx103 gene in the epidermis was lost during wheat domestication. Recently, the existence and expression of TmPrx01, the orthologous gene to TaPrx103, has been shown in powdery‐mildew‐attacked Triticum monococcum (Liu et al., 2005), one of the wild relatives of hexaploid wheat. Interestingly, T. monococcum possesses a high level of basal pathogen resistance reflected by scoring data of many accessions in ex‐situ collections (Borner et al., 2006). I tested the hypothesis of domestication‐related loss of ancient gene function by analysing gene expression of three genetically divergent T. monococcum plus three T. aestivum accessions (Hammer et al., 2000). However, no enhanced expression of the orthologous gene to TaPrx103 was found in Bgt‐attacked, stripped epidermis of T. monococcum (supplementary Fig. S4). A second pathogen‐induced peroxidase gene encoding TaPrx02‐1 (orthologous gene in T. monococcum named TmPrx03) was also a marker of inner leaf tissues of Bgt‐attacked leaves (supplementary Fig. S4). These findings are in agreement with the results of Liu et al. (2005) who also considered TmPrx01 and TmPrx03 proteins as markers of inner leaf tissues. Finally, a recently identified, novel peroxidase with specific expression in powdery mildew‐attacked barley epidermis was found to be weakly but constitutively expressed in wheat epidermis as well as inner leaf tissues (Zierold et al., 2005; supplementary Fig. S4). Taken together, these results do not support a natural selection of any of the tested peroxidases for enhanced expression in powdery mildew‐attacked wheat epidermis. On the other hand, a possible role of TaPrx103 might be the triggering of epidermal cell death in incompatible Bgt interactions by mesophyll cells directly underlying the epidermis. This speculation is based on early, conspicuous patterns of DAB staining of powdery mildew‐attacked, resistant barley leaves that start at contact sites between mesophyll and epidermis (Thordal‐Christensen et al., 1997). The re‐location of TaPrx103 from inner leaf tissues to the epidermis in the transgenic lines described here may have enhanced its natural cell‐death triggering function. It also appears possible that wheat does possess defence‐related peroxidase(s) that are specifically expressed in the epidermal layer, comparable with barley peroxidase HvPrx40, which has been shown to enhance resistance upon transient overexpression comparable with TaPrx103 overexpression (Zierold et al., 2005; A. Johrde and P. Schweizer, unpublished data). Several peroxidase transcripts have recently been described to accumulate in wheat epidermis after inoculation with Bgt (Liu et al., 2005). However, all of the encoded proteins are predicted to accumulate in the vacuoles due to the presence of C‐terminal retention signals. Therefore, a functional homologue to HvPrx40 would still have to be identified in wheat. As summarized in Fig. 8, an epidermal defence‐inducing or defence‐enhancing shunt of ROI might consist of an inducible substrate, TaPrx103 or related class III peroxidases plus extracellular SOD encoded by TaGLP4, which would result in the extracellular burst of H2O2 that has been observed in many pathosystems including powdery mildew‐attacked wheat and barley.
Figure 8.

Model of the pathogen‐specific effect of the GstA1i:TaPrx103 transgene. Together with the pathogen‐induced TaGLP4 proteins (orthologous to extracellular SODs of barley), the recombinant TaPrx103 protein might constitute a shunt of reactive oxygen species in pathogen‐attacked epidermal cells, resulting in the accumulation of H2O2 that leads to cell death.
The analysis of the transcriptome in transgenic versus wild‐type wheat revealed no clear transgene‐induced changes in host gene expression prior or after Bgt challenge. In particular, no marker genes for induced resistance of wheat (Görlach et al., 1996; Schweizer et al., 1989) were up‐regulated in non‐attacked transgenic plants. This argues against a pleiotropic effect of the TaPrx103 transgene under the control of the GstA1 promoter, in contrast to the known biological or chemical resistance inducers of wheat. Therefore, the transgene‐encoded protein might have caused conditioning of wheat epidermis to respond more strongly to pathogen attack, as outlined in Fig. 8. Such a scenario appears likely if the substrate for the transgene‐encoded peroxidase accumulates only locally upon pathogen attack. As a consequence, the transgenic plants behave like wild‐type except for those cells in direct contact with a pathogen, where the beneficial transgenic phenotype becomes evident. Thus, the GstA1i:TaPrx103 transgenic plants described here represent an example of substantial equivalence to non‐transformed wheat resulting from the combination of a wheat antifungal coding sequence with an epidermis‐specific wheat promoter.
EXPERIMENTAL PROCEDURES
Plant and fungal material
Transgenic wheat plants have been obtained by biolistic transformation of immature embryos with plasmid pGstA1i:TaPrx103 (supplementary Fig. S1), as previously described. Selected transgenic lines and corresponding wild‐type plants of cv. Bobwhite were grown in compost soil in an air‐conditioned greenhouse with automatic shading and supplementary light (SonAgro 400 high‐pressure sodium bulbs), resulting in a light period of 16 h and a minimum light intensity of 30 000 lux at plant hight. Temperature ranged from 18 °C (night) to 21 °C (day). For experiments at the seedling stage (DAB staining, autofluorescence, transcript profiling), 4‐week‐old plants grown in a climate chamber were used (16 h light from metal halogen lamps; 8 h dark, 60–70% relative humidity, 20 °C constant temperature). All plants were grown in pots of compost soil from IPK nursery.
Blumeria graminis DC Speer f.sp. tritici Em Marchal (Bgt) (Swiss field isolate FAL92315) was maintained at 22 °C constant temperature and 16 h light by weekly transfer to fresh wheat cv. Kanzler.
Infection assays
Resistance of freshly emerged flag leaves of adult transgenic plants was scored in a detached leaf assay, as described (Altpeter et al., 2005). The same detached leaf assay was also applied to 4‐week‐old seedlings for scoring resistance of the second and third leaves. For natural infection experiments in the greenhouse, local Bgt isolates were allowed to spread (Gatersleben, spring/summer 2005) by omitting fungicide treatments. Disease scoring was performed approximately 4 weeks after first recording of mildewed leaves in the greenhouse.
Cell death and H2O2 accumulation
Whole‐cell autofluorescence of wheat epidermis was monitored by using a Zeiss Axioplan 2 epifluorescence microscope (excitation filter 450–490 nm BP, emission filter 515–565 nm BP) at 200× magnification. Autofluorescence of epidermal cells attacked by exactly one Bgt appressorium was recorded at 36 h post inoculation. Prior to microscopy, inoculated leaves were fixed and epiphytic fungal structures were stained with Coomassie blue, as described (Schweizer et al., 1993).
Staining of the H2O2 burst by DAB was performed by leaf infiltration of a solution of 1% (w/v) DAB in H2O (pH adjusted to 4.0 with HCl) using a needle‐less syringe. Detached leaves on water agar containing 20 µg/mL benzimidazole were inoculated with Bgt at a low density (1–10 conidia/mm2) and incubated at 20 °C for 20 h, prior to DAB infiltration. Six hours after DAB infiltration, leaves were destained in 15% (w/v) TCA in ethanol/chloroform (4 : 1 v/v) overnight at room temperature, followed by light microscopy of those cells attacked by exactly one fungal appressorium.
Cell‐wall digestibility
An assay for the direct quantification of in‐situ cell‐wall digestion was developed because the release of epidermal protoplasts as an indirect measure of cell‐wall degradation could not be measured, probably due to rapid bursting of these very large and delicate protoplasts. The in‐situ assay is based on the statistical analysis of remaining cross‐cell walls after the incubation of an immobilized epidermal mono‐cell layer with fungal cell‐wall‐degreading enzymes. Leaf segments were fixed with their abaxial surface onto adhesive tape, followed by one cross‐cut by a scalpel. The upper epidermis as well as the mesophyll were carefully scratched off starting at the cut, resulting in an immobilized epidermal mono‐cell layer. After thoroughly rinsing the treated leaf area with distilled water in order to remove cell debris, the number of epidermal cross‐cell walls of type A, B and C cells not bordering stomata or hair cells was counted per microscopic field. One hundred and fifty microlitres of a cell‐wall‐degrading enzyme cocktail consisting of 0.5% (w/v) Cellulysin (Calbiochem/Merck, Darmstadt, Germany) and 0.05% (w/v) Macerase (Duchefa, Haarlem, the Netherlands) in 5 mm potassium phosphate buffer, pH 5.7, 10 mm l‐arginine and 0.6 m mannitol was added as a drop onto the free epidermis. After 60–180 min incubation at 32 °C, the treated leaf area was gently rinsed with distilled water, followed by quantification of the number of remaining cross‐cell walls.
Co‐segregation analysis
For segregation analysis at the RNA level, total RNA was extracted from the leaf below the flag leaf of adult plants used for resistance scoring of detached flag leaves. For this purpose I used a previously described procedure, except that leaves were squeezed in RNA extraction buffer inside sealed plastic bags by using a rolling device (Stein et al., 2001; Vallelian‐Bindschedler et al., 1998). RNA concentration was adjusted to 1 µg/µL, mixed 1 : 1 (v/v) with bromo‐phenol blue solution in DEPC‐treated H2O and used for spotting onto nylon membranes (Hybond N) by using a spotting robot equipped with a 384‐pin tool with 0.4‐mm tip diameter (MicroGrid II, BioRobotics, Zinsser Analytic GmbH, Frankfurt, Germany). Four spot replicas per RNA sample in a 2 × 2 spotting pattern with four needle strokes per spot were applied. Spotted RNA was crosslinked to the membranes under UV light (Stratalinker, Stratagene Co, La Jolla, CA; 1200 energy units) and used for hybridization with random‐prime 32P‐labelled probes (either TaPrx103 near full‐length cDNA or bean cDNA corresponding to the 26S rRNA gene) as described (Zierold et al., 2005). Hybridization signals were detected by using a Fuji‐BAS 3000 phosphorimager (Raytest, Straubenhardt, Germany). Spot detection and signal‐intensity quantification were performed by using the AIDA Image Analyser 4.08 software package (Raytest). Per subarray (four replicate spots) mean signal intensity was normalized to the mean signal intensity from hybridization with the 26S rRNA probe.
Segregation analysis at the (c)DNA level was performed by PCR by using the PCR MasterMix (Qiagen, Hilden, Germany) and transgene‐specific primers 5′‐GAAACCTCGCTCGAAACGCAC (sense) and 5′‐GCCGGCTTACTAGCTACCTG (reverse) that give rise to 304‐ and 190‐bp fragments from unspliced and spliced templates, respectively. Thirty and 42 cycles (94 °C/58 °C/72 °C) were applied for amplification from cDNA and genomic DNA templates, respectively.
Semi‐quantitative RT‐PCR
Total RNA was extracted from epidermal peels (abaxial) or the remainder of peeled leaves of T. aestivum accessions (accession nos. TRI 7405, TRI 8989 and TRI 2206) or T. monococcum accessions (TRI 4319, TRI 2381 and TRI 2006) of the ex‐situ collection of the Leibniz Institute of Plant Genetics and Crop Plant Research (http://gbis.ipk‐gatersleben.de/gbis_i/). One microgram of RNA was reverse transcribed by using the iScript kit (Bio‐Rad Co., München, Germany). Three microlitres of the 50 µL of resulting cDNA solution was used for semi‐quantitative PCR by using the PCR MasterMix (Qiagen Co.), followed by gel electrophoresis on 1% w/v agarose gels in TAE containing 0.5 µg/mL ethidium bromide. The following PCR primers were used: TaPrx103 and TmPrx01, 5′‐AAGGACAGGATCTACAATGAG (sense) plus 5′‐TGTCTTSGGCGCGATGTTG (reverse); TaPrx02‐1 and TmPrx03, 5′‐ACTCGGATCTACGGCGGTG (sense) plus 5′‐GGTGAGCGGCGCGATGTTT (reverse); TaPrx47, 5′‐GACTGCTTCGTTCGGGGG (sense) plus 5′‐CTGAGGAAGTAGGACGCG (reverse); UBC, 5′‐AAGCAGCCAGAATGTACAGCGAGAAC (sense) and 5′‐GGTACAGACCAGCAAAGCCAGAAATG (reverse); GAPDH, 5′‐CAACGCTAGCTGCACCACTA (sense) 5′‐TTCCACCTCTCCAGTCCTTG (reverse). UBC and GAPDH primers were based on cDNA sequences encoding a ubiquitin‐conjugating enzyme (TC234903 of TIGR wheat gene index) and cytosolic glyceraldehyde dehydrogenase (accession no. AF251217). Primers (except for GAPDH) were designed such as to match perfectly to orthologous sequences of T. aestivum and T. monococcum.
The barleyPGRC1 cDNA array and transcript profiling
A total of 41 600 vector‐trimmed expressed sequence tags (ESTs) of more than 100 bp length were used for clustering by using the StackPack™ software (Electric Genetics PTY Ltd, Reston). In the case of sequence clusters, one representative clone associated with the longest EST sequence was manually selected per primary consensus. Singleton sequences were subjected to ID‐based clone‐linking, and corresponding EST clones were only selected for the unigene set if neither their 5′‐ nor their 3′‐orientated EST was found in a cluster. Diluted plasmid DNA used for sequencing (approximately 1 : 20) of the thus defined unigene set of barley was re‐arrayed by using a Genesis Workstation 100 (TECAN Co., Männedorf, Switzerland). Each re‐arrayed cDNA clone was PCR amplified (30 cycles 95 °C/65 °C/72 °C) in four 50‐µL reactions by using in‐house produced Taq polymerase and primers M13‐21PE (5′‐ACGACGTTGTAAAACGACGGCCAG) and MVR26 (5′‐CTCACTAAAGGGAACAAAAGCTGG). The pooled, amplified PCR fragments were controlled by agarose gel electrophoresis for multiple bands and for the estimated DNA concentration. PCR reactions with more than two DNA fragments or with no visible product were eliminated from the set by re‐arraying. A minority of PCR reactions containing two DNA fragments were left in the unigene set if the abundance of the second fragment was clearly below that of the major one. The accuracy of re‐arraying and clone handling was verified by sequencing (four clones per 384‐well destination plate). No inconsistencies were identified in the set of re‐arrayed PCR fragments. After purification and two‐fold concentration by ultrafiltration (MinElute, Qiagen, Hilden, Germany) resulting in an estimated DNA concentration of 50 ng/µL, samples were mixed 1 : 1 with spotting solution (1 m NaOH, 5 m NaCl, bromophenol blue). DNA was spotted in duplicate onto nylon membranes (Biodyne B, PALL Co., Dreieich, Germany) by using a BioGrid II Robot (Genomics Solutions, Cambridgeshire, UK) equipped with a 0.2‐mm pin tool. Five strokes of the pin tool were applied to each spot, resulting in the transfer of approximately 50 nL DNA, and each cDNA fragment was spotted twice. Membranes were treated as described (Sreenivasulu et al., 2002).
RNA isolation, labelling and hybridization of wheat cDNA probes by 33P‐dCTP was performed as described (Zierold et al., 2005) except for reduced washing stringency (0.5× SSC instead of 0.1× SSC at 65 °C).
Spots were detected and signals were quantified by using the AIDA Image Analyzer 4.08 software package (Raytest Co.). For background subtraction, dynamic definition of background spots was used by selecting four spots producing the lowest signals per subarray and by subtracting the mean intensity of those four spots from all spots of the corresponding subarray. The rationale behind this background subtraction was the presence of four empty spots per subarray that, however, did not always produce the lowest signals due to sporadic overshining from neighbouring spots with extremely strong hybridization signals. Spot‐intensity values were normalized by median centring of the signal distribution per array hybridization (Sreenivasulu et al., 2002). Spotted unigenes producing no signals above 2.5× local background at two hybridizations were excluded from the analysis. Pathogen‐regulated genes in wild‐type plants were identified by using the EDGE software developed by Storey et al. (http://faculty.washington.edu/jstorey/edge/) with significance thresholds set to P < 0.05 and false‐discovery rate (FDR) < 0.05 (Storey and Tibshirani, 2003). Pathogen‐regulated genes were subjected to hierarchical clustering by using the Cluster3 software of Eisen and de Hoon (http://rana.lbl.gov/EisenSoftware.htm). Settings were as follows: log2 transformation of signal intensities, median centring of genes, Euclidian distance, average linkage.
MAGE‐ML export of the complete set of array data to ArrayExpress (http://www.ebi.ac.uk/arrayexpress/) has been performed.
Supporting information
Fig. S1 Schematic drawing of expression plasmid pGstA1i: TaPrx103 that carries the TaPrx103 cDNA (previously named TaPERO) under the control of the epidermis‐specific wheat promoter GstA1. The 2,3 kb GstA1 promoter is followed by part of exon 1 and the single 118 bp intron of the pathogen‐induced wheat WIR1a gene. T, CamV 35S terminator.
Fig. S2 Co‐segregation of TaPrx103 mRNA abundance and GstA1i:TaPrx103 transgene expression in subline 2193b. RNA was extracted from non‐inoculated plants and used for spotting onto an RNA array hybridized with a 32P‐labelled TaPrx103 full‐CDS probe (top panel) or for semi‐quantitative RT‐PCR using a transgene‐specific primer pair (middle panel). The arrow points at the expected amplified fragment from spliced mRNA. The weak upper band either corresponds to genomic DNA contamination or non‐spliced transcript. As control for cDNA synthesis, primers for the constitutively‐expressed reference gene encoding an ubiquitin‐conjugating enzyme (UBC) were used (lower panel).
Fig. S3 Technical reproducibility of the barleyPGRC1 cDNA array. Two membranes of type ‘A’ were hybridized with an identical cDNA probe derived from barley leaves, as described in Materials and Methods. Similar results were obtained by hybridizing membranes of type ‘B’ (not shown).
Fig. S4 Semi‐quantitative RT‐PCR of peroxidase mRNA in peeled epidermis and remaining leaf tissues of cultivated (Acc. 1–3, T.aestivum) and wild (Acc. 4–6, T.monococcum) wheat in response to Bgt attack. Names of peroxidase‐encoding genes are indicated at the right hand side of the figure, and both putative gene orthologues from T.aestivum and T.monococcum (TaPrx103 and TmPrx01; TaPrx02‐1 and TmPrx03) are indicated. No gene orthologue to TaPrx47 has been described in T.monococcum so far. UBC, ubiquitin‐conjugating enzyme used as constitutively‐expressed reference gene. Peroxidase mRNAs were detected by 24 PCR cycles unless otherwise specified; UBC mRNA was detected by 22 PCR cycles.
Table S1 Regulation of identified, defense‐related genes in wheat and barley.
This material is available as part of the online article from:
https://onlinelibrary.wiley.com/doi/full/10.1111/j.1574-6968.2007.00943.x
(This link will take you to the article abstract.)
Please note: Blackwell Publishing are not responsible for the content or functionality of any supplementary materials supplied by the authors. Any queries (other than missing material) should be directed to the corresponding author for the article.
Supporting info item
Supporting info item
Supporting info item
Supporting info item
Supporting info item
Supporting info item
Supporting info item
Supporting info item
Supporting info item
Supporting info item
ACKNOWLEDGEMENTS
The excellent technical assistance of Gabi Brantin, Soja Gentz, Ines Walde and Stefanie Lück is acknowledged. I would also like to thank Dr Axel Himmelbach for supporting RNA extractions, Dr Uwe Scholz for MAGE‐ML expert of array data and Ms Heike Ernst for photography. This work was supported by the Leibniz Institute of Plant Genetics and Crop Plant Research (IPK).
REFERENCES
- Altpeter, F. , Varshney, A. , Abderhalden, O. , Douchkov, D. , Sautter, C. , Kumlehn, J. , Dudler, R. and Schweizer, P. (2005) Stable expression of a defence‐related gene in wheat epidermis under transcriptional control of a novel promoter confers pathogen resistance. Plant Mol. Biol. 57, 271–283. [DOI] [PubMed] [Google Scholar]
- Bakalovic, N. , Passardi, F. , Ioannidis, V. , Cosio, C. , Penel, C. , Falquet, L. and Dunand, C. (2006) PeroxiBase: A class III plant peroxidase database. Phytochemistry, 67, 534–539. [DOI] [PubMed] [Google Scholar]
- Baker, J.M. , Hawkins, N.D. , Ward, J.L. , Lovegrove, A. , Napier, J.A. , Shewry, P.R. and Beale, M.H. (2006) A metabolomic study of substantial equivalence of field‐grown genetically modified wheat. Plant Biotechnol. J. 4, 381–392. [DOI] [PubMed] [Google Scholar]
- Barcelo, A.R. (1995) Peroxidase and not laccase is the enzyme responsible for cell‐wall lignification in the secondary thickening of xylem vessels in lupinus. Protoplasma, 186, 41–44. [Google Scholar]
- Baudo, M.M. , Lyons, R. , Powers, S. , Pastori, G.M. , Edwards, K.J. , Holdsworth, M.J. and Shewry, P.R. (2006) Transgenesis has less impact on the transcriptome of wheat grain than conventional breeding. Plant Biotechnol. J. 4, 369–380. [DOI] [PubMed] [Google Scholar]
- Bestwick, C.S. , Brown, I.R. and Mansfield, J.W. (1998) Localized changes in peroxidase activity accompany hydrogen peroxide generation during the development of a nonhost hypersensitive reaction in lettuce. Plant Physiol. 118, 1067–1078. [DOI] [PMC free article] [PubMed] [Google Scholar]
- Bieri, S. , Potrykus, I. and Futterer, J. (2003) Effects of combined expression of antifungal barley seed proteins in transgenic wheat on powdery mildew infection. Mol. Breeding, 11, 37–48. [Google Scholar]
- Bindschedler, L.V. , Dewdney, J. , Blee, K.A. , Stone, J.M. , Asai, T. , Plotnikov, J. , Denoux, C. , Hayes, T. , Gerrish, C. , Davies, D.R. , Ausubel, F.M. and Bolwell, G.P. (2006) Peroxidase‐dependent apoplastic oxidative burst in Arabidopsis required for pathogen resistance. Plant J. 47, 851–863. [DOI] [PMC free article] [PubMed] [Google Scholar]
- Bolwell, G.P. , Bindschedler, L.V. , Blee, K.A. , Butt, V.S. , Davies, D.R. , Gardner, S.L. , Gerrish, C. and Minibayeva, F. (2002) The apoplastic oxidative burst in response to biotic stress in plants: a three‐component system. J. Exp. Bot. 53, 1367–1376. [PubMed] [Google Scholar]
- Borner, A. , Freytag, U. and Sperling, U. (2006) Analysis of wheat disease resistance data originating from screenings of Gatersleben genebank accessions during 1933 and 1992. Genet. Resources Crop Evol. 53, 453–465. [Google Scholar]
- Bruggmann, R. , Abderhalden, O. , Reymond, P. and Dudler, R. (2005) Analysis of epidermis‐ and mesophyll‐specific transcript accumulation in powdery mildew‐inoculated wheat leaves. Plant Mol. Biol. 58, 247–267. [DOI] [PubMed] [Google Scholar]
- Christensen, A.B. , Thordal‐Christensen, H. , Zimmermann, G. , Gjetting, T. , Lyngkjaer, M.F. , Dudler, R. and Schweizer, P. (2004) The germinlike protein GLP4 exhibits superoxide dismutase activity and is an important component of quantitative resistance in wheat and barley. Mol. Plant–Microbe Interact. 17, 109–117. [DOI] [PubMed] [Google Scholar]
- Douchkov, D. , Nowara, D. , Zierold, U. and Schweizer, P. (2005) A high‐throughput gene‐silencing system for the functional assessment of defence‐related genes in barley epidermal cells. Mol. Plant–Microbe Interact. 18, 755–761. [DOI] [PubMed] [Google Scholar]
- Elfstrand, M. , Sitbon, F. , Lapierre, C. , Bottin, A. and Von Arnold, S. (2002) Altered lignin structure and resistance to pathogens in spi 2‐expressing tobacco plants. Planta, 214, 708–716. [DOI] [PubMed] [Google Scholar]
- Frahry, G. and Schopfer, P. (1998) Inhibition of O‐2‐reducing activity of horseradish peroxidase by diphenyleneiodonium. Phytochemistry, 48, 223–227. [DOI] [PubMed] [Google Scholar]
- Görlach, J. , Volrath, S. , Knauf Beiter, G. , Hengy, G. , Beckhove, U. , Kogel, K.H. , Oostendorp, M. , Staub, T. , Ward, E. , Kessmann, H. , Ryals, J. (1996) Benzothiadiazole, a novel class of inducers of systemic acquired resistance, activates gene expression and disease resistance in wheat. Plant Cell, 8, 629–643. [DOI] [PMC free article] [PubMed] [Google Scholar]
- Hammer, K. , Filatenko, A.A. and Korzun, V. (2000) Microsatellite markers —a new tool for distinguishing diploid wheat species. Genet. Resources Crop Evol. 47, 497–505. [Google Scholar]
- Han, F.P. , Fedak, G. , Ouellet, T. , Dan, H. and Somers, D.J. (2005) Mapping of genes expressed in Fusarium graminearum‐infected heads of wheat cultivar ‘Frontana’. Genome, 48, 88–96. [DOI] [PubMed] [Google Scholar]
- Harkin, J.M. and Obst, J.R. (1973) Lignification in trees – indication of exclusive peroxidase participation. Science, 180, 296–298. [DOI] [PubMed] [Google Scholar]
- Hückelhoven, R. , Dechert, C. and Kogel, K.H. (2003) Overexpression of barley BAX inhibitor 1 induces breakdown of mlo‐mediated penetration resistance to Blumeria graminis . Proc. Natl Acad. Sci. USA 100, 5555–5560. [DOI] [PMC free article] [PubMed] [Google Scholar]
- Hückelhoven, R. , Dechert, C. and Kogel, K‐H. (2001) Non‐host resistance of barley is associated with a hydrogen peroxide burst at sites of attempted penetration by wheat powdery mildew fungus. Mol. Plant Pathol. 2, 199–205. [DOI] [PubMed] [Google Scholar]
- Kawano, T. (2003) Roles of the reactive oxygen species‐generating peroxidase reactions in plant defence and growth induction. Plant Cell Rep. 21, 829–837. [DOI] [PubMed] [Google Scholar]
- Kerby, K. and Somerville, S.C. (1992) Purification of an infection‐related extracellular peroxidase from barley. Plant Physiol. 100, 397–402. [DOI] [PMC free article] [PubMed] [Google Scholar]
- Kmecl, A. , Mauch, F. , Winzeler, M. , Winzeler, H. and Dudler, R. (1995) Quantitative field resistance of wheat to powdery mildew and defence reactions at the seedling stage: Identification of a potential marker. Physiol. Mol. Plant Pathol. 47, 185–199. [Google Scholar]
- Kristensen, B.K. , Brandt, J. , Bojsen, K. , Thordal‐Christensen, H. , Kerby, K.B. , Collinge, D.B. , Mikkelsen, J.D. and Rasmussen, S.K. (1997) Expression of a defence‐related intercellular barley peroxidase in transgenic tobacco. Plant Sci. 122, 173–182. [Google Scholar]
- Lagrimini, L.M. , Bradford, S. and Rothstein, S. (1990) Peroxidase‐induced wilting in transgenic tobacco plants. Plant Cell 2, 7–18. [DOI] [PMC free article] [PubMed] [Google Scholar]
- Lagrimini, L.M. , Joly, R.J. , Dunlap, J.R. and Liu, T.T.Y. (1997) The consequence of peroxidase overexpression in transgenic plants on root growth and development. Plant Mol. Biol. 33, 887–895. [DOI] [PubMed] [Google Scholar]
- Li, Y. , Kajita, S. , Kawai, S. , Katayama, Y. and Morohoshi, N. (2003) Down‐regulation of an anionic peroxidase in transgenic aspen and its effect onlignin characteristics. J. Plant Res. 116, 175–182. [DOI] [PubMed] [Google Scholar]
- Liu, G.S. , Sheng, X.Y. , Greenshields, D.L. , Ogieglo, A. , Kaminskyj, S. , Selvaraj, G. and Wei, Y.D. (2005) Profiling of wheat class III peroxidase genes derived from powdery mildew‐attacked epidermis reveals distinct sequence‐associated expression patterns. Mol. Plant–Microbe Interact. 18, 730–741. [DOI] [PubMed] [Google Scholar]
- Lyngkjaer, M.F. and Carver, T.L.W. (1999) Induced accessibility and inaccessibility to Blumeria graminis f.sp hordei in barley epidermal cells attacked by a compatible isolate. Physiol. Mol. Plant Pathol. 55, 151–162. [Google Scholar]
- Mader, M. and Ambergfisher, V. (1982) Role of peroxidase in lignification of tobacco cells. 1. Oxidation of nicotinamide adenine‐dinucleotide and formation of hydrogen‐peroxide by cell‐wall peroxidases. Plant Physiol. 70, 1128–1131. [DOI] [PMC free article] [PubMed] [Google Scholar]
- Makandar, R. , Essig, J.S. , Schapaugh, M.A. , Trick, H.N. and Shah, J. (2006) Genetically engineered resistance to Fusarium head blight in wheat by expression of Arabidopsis NPR1. Mol. Plant–Microbe Interact. 19, 123–129. [DOI] [PubMed] [Google Scholar]
- Martinez, C. , Montillet, J.L. , Bresson, E. , Agnel, J.P. , Dai, G.H. , Daniel, J.F. , Geiger, J.P. and Nicole, M. (1998) Apoplastic peroxidase generates superoxide anions in cells of cotton cotyledons undergoing the hypersensitive reaction to Xanthomonas campestris pv. malvacearum race 18. Mol. Plant–Microbe Interact. 11, 1038–1047. [Google Scholar]
- Ostergaard, L. , Teilum, K. , Mirza, O. , Mattsson, O. , Petersen, M. , Welinder, K.G. , Mundy, J. , Gajhede, M. and Henriksen, A. (2000) Arabidopsis ATP A2 peroxidase. Expression and high‐resolution structure of a plant peroxidase with implications for lignification. Plant Mol. Biol. 44, 231–243. [DOI] [PubMed] [Google Scholar]
- Passardi, F. , Penel, C. and Dunand, C. (2004) Performing the paradoxical: how plant peroxidases modify the cell wall. Trends Plant Sci. 9, 534–540. [DOI] [PubMed] [Google Scholar]
- Peng, M. and Kuc, J. (1992) Peroxidase‐generated hydrogen peroxide as a source of antifungal activity in‐vitro and on tobacco leaf disks. Phytopathology, 82, 696–699. [Google Scholar]
- Piffanelli, P. , Zhou, F.S. , Casais, C. , Orme, J. , Jarosch, B. , Schaffrath, U. , Collins, N.C. , Panstruga, R. and Schulze‐Lefert, P. (2002) The barley MLO modulator of defence and cell death is responsive to biotic and abiotic stress stimuli. Plant Physiol. 129, 1076–1085. [DOI] [PMC free article] [PubMed] [Google Scholar]
- Pryce‐Jones, E. , Carver, T. and Gurr, S.J. (1999) The roles of cellulase enzymes and mechanical force in host penetration by Erysiphe graminis f.sp hordei . Physiol. Mol. Plant Pathol. 55, 175–182. [Google Scholar]
- Rebmann, G. , Hertig, C. , Bull, J. , Mauch, F. and Dudler, R. (1991) Cloning and sequencing of complementary dnas encoding a pathogen‐induced putative peroxidase of wheat Triticum aestivum L. Plant Mol. Biol. 16, 329–332. [DOI] [PubMed] [Google Scholar]
- Schlaich, T. , Urbaniak, B.M. , Malgras, N. , Ehler, E. , Birrer, C. , Meier, L. and Sautter, C. (2006) Increased field resistance to Tilletia caries provided by a specific antifungal virus gene in genetically engineered wheat. Plant Biotechnol. J. 4, 63–75. [DOI] [PubMed] [Google Scholar]
- Schweizer, P. , Christoffel, A. and Dudler, R. (1999a) Transient expression of members of the germin‐like gene family in epidermal cells of wheat confers disease resistance. Plant J. 20, 541–552. [DOI] [PubMed] [Google Scholar]
- Schweizer, P. , Gees, R. and Mösinger, E. (1993) Effect of jasmonic acid on the interaction of barley (Hordeum vulgare L.) with the powdery mildew Erysiphe graminis f. sp. hordei. Plant Physiol. 102, 503–511. [DOI] [PMC free article] [PubMed] [Google Scholar]
- Schweizer, P. , Hunziker, W. and Mösinger, E. (1989) Complementary DNA cloning In vitro, transcription, and partial sequence analysis of messenger RNA from winter wheat Triticum aestivum L. with induced resistance to Erysiphe graminis f. sp. tritici . Plant Mol. Biol. 12, 643–654. [DOI] [PubMed] [Google Scholar]
- Schweizer, P. , Pokorny, J. , Abderhalden, O. and Dudler, R. (1999b) A transient assay system for the functional assessment of defence‐related genes in wheat. Mol. Plant–Microbe Interact. 12, 647–654. [Google Scholar]
- Schweizer, P. , Pokorny, J. , Schulze‐Lefert, P. and Dudler, R. (2000) Technical advance: double‐stranded RNA interferes with gene function at the single‐cell level in cereals. Plant J 24, 895–903. [DOI] [PubMed] [Google Scholar]
- Scobbie, L. , Russell, W. , Provan, G.J. and Chesson, A. (1993) The newly extended maize internode‐a model for the study of secondary cell‐wall formation and consequences for digestibility. J. Sci. Food Agriculture, 61, 217–225. [Google Scholar]
- Shirasu, K. , Nielsen, K. , Piffanelli, P. , Oliver, R. and Schulze‐Lefert, P. (1999) Cell‐autonomous complementation of mlo resistance using a biolistic transient expression system. Plant J. 17, 293–299. [Google Scholar]
- Sreenivasulu, N. , Altschmied, L. , Panitz, R. , Hähnel, U. , Michalek, W. , Weschke, W. and Wobus, U. (2002) Identification of genes specifically expressed in maternal and filial tissues of barley caryopses: a cDNA array analysis. Mol. Genet. Genomics, 266, 758–767. [DOI] [PubMed] [Google Scholar]
- Stein, N. , Herren, G. and Keller, B. (2001) A new DNA extraction method for high‐throughput marker analysis in a large‐genome species such as Triticum aestivum. Plant Breeding, 120, 354–356. [Google Scholar]
- Storey, J.D. and Tibshirani, R. (2003) Statistical significance for genomewide studies. Proc. Natl Acad. Sci. USA 100, 9440–9445. [DOI] [PMC free article] [PubMed] [Google Scholar]
- Thordal‐Christensen, H. , Zhang, Z.G. , Wei, Y.D. and Collinge, D.B. (1997) Subcellular localization of H2O2 in plants. H2O2 accumulation in papillae and hypersensitive response during the barley‐powdery mildew interaction. Plant J. 11, 1187–1194. [Google Scholar]
- Vallelian‐Bindschedler, L. , Mösinger, E. , Metraux, J.P. and Schweizer, P. (1998) Structure, expression and localization of a germin‐like protein in barley (Hordeum vulgare L.) that is insolubilized in stressed leaves. Plant Mol. Biol. 37, 297–308. [DOI] [PubMed] [Google Scholar]
- Wei, Y.D. , Deneergaard, E. , Thordal‐Christensen, H. , Collinge, D.B. and Smedegaard‐Petersen, V. (1994) Accumulation of a putative guanidine compound in relation to other early defence reactions in epidermal cells of barley and wheat exhibiting resistance to Erysiphe graminis f. sp. hordei . Physiol. Mol. Plant Pathol. 45, 469–484. [Google Scholar]
- Zierold, U. , Scholz, U. and Schweizer, P. (2005) Transcriptome analysis of mlo‐mediated resistance in the epidermis of barley. Mol. Plant Pathol. 6, 139–151. [DOI] [PubMed] [Google Scholar]
Associated Data
This section collects any data citations, data availability statements, or supplementary materials included in this article.
Supplementary Materials
Fig. S1 Schematic drawing of expression plasmid pGstA1i: TaPrx103 that carries the TaPrx103 cDNA (previously named TaPERO) under the control of the epidermis‐specific wheat promoter GstA1. The 2,3 kb GstA1 promoter is followed by part of exon 1 and the single 118 bp intron of the pathogen‐induced wheat WIR1a gene. T, CamV 35S terminator.
Fig. S2 Co‐segregation of TaPrx103 mRNA abundance and GstA1i:TaPrx103 transgene expression in subline 2193b. RNA was extracted from non‐inoculated plants and used for spotting onto an RNA array hybridized with a 32P‐labelled TaPrx103 full‐CDS probe (top panel) or for semi‐quantitative RT‐PCR using a transgene‐specific primer pair (middle panel). The arrow points at the expected amplified fragment from spliced mRNA. The weak upper band either corresponds to genomic DNA contamination or non‐spliced transcript. As control for cDNA synthesis, primers for the constitutively‐expressed reference gene encoding an ubiquitin‐conjugating enzyme (UBC) were used (lower panel).
Fig. S3 Technical reproducibility of the barleyPGRC1 cDNA array. Two membranes of type ‘A’ were hybridized with an identical cDNA probe derived from barley leaves, as described in Materials and Methods. Similar results were obtained by hybridizing membranes of type ‘B’ (not shown).
Fig. S4 Semi‐quantitative RT‐PCR of peroxidase mRNA in peeled epidermis and remaining leaf tissues of cultivated (Acc. 1–3, T.aestivum) and wild (Acc. 4–6, T.monococcum) wheat in response to Bgt attack. Names of peroxidase‐encoding genes are indicated at the right hand side of the figure, and both putative gene orthologues from T.aestivum and T.monococcum (TaPrx103 and TmPrx01; TaPrx02‐1 and TmPrx03) are indicated. No gene orthologue to TaPrx47 has been described in T.monococcum so far. UBC, ubiquitin‐conjugating enzyme used as constitutively‐expressed reference gene. Peroxidase mRNAs were detected by 24 PCR cycles unless otherwise specified; UBC mRNA was detected by 22 PCR cycles.
Table S1 Regulation of identified, defense‐related genes in wheat and barley.
This material is available as part of the online article from:
https://onlinelibrary.wiley.com/doi/full/10.1111/j.1574-6968.2007.00943.x
(This link will take you to the article abstract.)
Please note: Blackwell Publishing are not responsible for the content or functionality of any supplementary materials supplied by the authors. Any queries (other than missing material) should be directed to the corresponding author for the article.
Supporting info item
Supporting info item
Supporting info item
Supporting info item
Supporting info item
Supporting info item
Supporting info item
Supporting info item
Supporting info item
Supporting info item