

SUMMARY
Plant organ gene expression profile analyses are complicated by the various cell types, and therefore transcription patterns, present in each organ. For example, each gall formed in roots following root knot nematode infection contains between four and eight specialized feeding cells (giant cells, GCs) embedded within hypertrophied root tissues. A recent goal in plant science has been the isolation of nematode feeding cell mRNAs for subsequent gene expression analysis. By adapting current protocols for different plant species and cells, we have developed a simple and rapid method for obtaining GCs from frozen tissue sections of tomato with good morphology and preserved RNA. The tissue sections obtained were suitable for the laser capture microdissection of GCs 6–7 days post‐infection, and even of very early developing GCs (48–72 h post‐infection), by fixation of tissue with ethanol–acetic acid, infiltration with sucrose and freezing in isopentane with optimal cutting temperature medium. This process was also successful for obtaining control vascular cells from uninfected roots for direct comparison with GCs. A minimum of about 300 GCs and 600 control vascular cells was required for efficient linear RNA amplification through in vitro transcription. Laser capture microdissection‐derived RNA, after two rounds of amplification, was successfully used for microarray hybridization and validated with several differentially expressed genes by quantitative polymerase chain reaction. Consistent with our results, 117 homologous genes were found to be co‐regulated in a previous microarray analysis of Arabidopsis galls at the same developmental stage. Therefore, we conclude that our method allows the isolation of a sufficient quantity of RNA with a high quality/integrity, appropriate for differential transcriptome analysis.
INTRODUCTION
The development of laser capture microdissection (LCM) has enabled the isolation and rapid collection of target cells from complex tissues, thus allowing relatively large amounts of cell‐specific material to be harvested (Bonner et al., 1997; Emmert‐Buck et al., 1996). Although originally developed in animal tissues, LCM has been used successfully to isolate Arabidopsis embryonic cells, as well as plant cells, from a variety of sources, including rice phloem; Arabidopsis endosperm, vascular bundles, ovule, replum and cotyledon; maize shoot apical meristem, mesophyll, epidermis and vascular tissue; and different tissues from the Urtica dioica stem (Angeles et al., 2006; Asano et al., 2002; Cai and Lashbrook, 2006; Casson et al., 2005; Day et al., 2007a; Kerk et al., 2003; Nakazono et al., 2003; Ohtsu et al., 2007; Schad et al., 2005).
Successful LCM requires the isolation of tissue sections with good morphology. It is also necessary that the nucleic acids, proteins or metabolites used for further analyses are of sufficiently high quality and integrity. Some fixatives can affect the preservation of the cell structure, as well as the recovery of RNA from specimens. Recent reviews dealing with LCM have examined the use of various fixation protocols to preserve both the molecular and morphological features of plant tissues (Day et al., 2007b; Nelson et al., 2006). In animal tissues, several studies have reported that RNA yield and quality after LCM are better with cryopreserved tissue than with paraffin‐embedded tissue. Cryosectioning is commonly used because of its speed and ability to preserve intact molecules, whereas the paraffin procedure provides high histological quality and stability (Gillespie et al., 2002; Goldsworthy et al., 1999; Parlato et al., 2002). In plants, LCM has been performed successfully on cryopreserved tissues, including embryos and leaves, that are embedded in optimal cutting temperature (OCT) medium, frozen (at −80 °C) and sectioned with a cryostat at −22 °C. This method renders good morphology and RNA quality suitable for gene expression analysis (Asano et al., 2002; Casson et al., 2005; Spencer et al., 2007). However, some cryopreserved plant tissues are particularly prone to morphological disruption, as intercellular air spaces and water facilitate ice crystal formation, leading to cell damage.
Plant root parasitic nematodes penetrate the roots and induce morphological and metabolic changes that transform either a group of cells (for root knot nematodes) or a single cell (for cyst nematodes) into a feeding site. Root knot nematodes form visible structures (galls) containing different tissues, including a variable number of specialized feeding cells known as giant cells (GCs), inside the vascular cylinder. GC differentiation involves dramatic changes including endoreduplication, nuclear division without complete cytokinesis, cell expansion and extensive development of endomembrane systems. The rest of the gall consists mainly of disorganized vasculature and hypertrophied cortical cells (Bleve‐Zacheo and Melillo, 1997; Gheysen and Fenoll, 2002). Global gene expression profiles from galls have been obtained by different techniques (reviewed in Caillaud et al., 2008; Escobar and Fenoll, 2008). However, galls represent bulk samples that contain a complex mixture of heterogeneous tissues, even after separation from the rest of the root organs by hand dissection. Therefore, the gene expression profiles of galls are expected to differ from those of newly formed GCs.
For this reason, an important goal in recent years has been the isolation of mRNA from nematode feeding cells. LCM requires tissue fixation and embedding, whereas other methods that employ protoplast preparations or the isolation of cytoplasmic content using microcapillaries do not require these steps. However, the latter techniques are not well suited to the sampling of the cytosol from GCs. First of all, five to eight GCs are located in the centre of the galls in vascular tissue and surrounded by several layers of hypertrophied tissue. GCs also have a very large volume, 100–300‐fold greater than that of a vascular root cell, a dense cytosol and a modified cell wall, compared with vascular cells (reviewed in Caillaud et al., 2008; Gheysen and Fenoll, 2002). Large GC protoplasts are susceptible to shear forces and are unstable, even in hypertonic solution. A second alternative technique, microaspiration, has been used for the isolation of syncytial cytoplasm (Szakasits et al., 2008). However, GCs show different characteristics and ontogeny when compared with syncytial cells (Hoth et al., 2008) and microaspiration is not possible for GCs, except for very late infection stages (Wang et al., 2001). The difficulty in microinjecting solutions into young GCs and then microaspirating them may indicate a high internal pressure (T. Bleve‐Zacheo, CNR, Istituto per la Protezione delle Piante, Bary, Italy, pers. comm.).
RNA has been successfully sampled from syncytia by both LCM from paraffin sections and by the use of microcapillaries, and has been employed for the construction of cDNA libraries and for microarray analysis (Hofmann et al., 2008; Ithal et al., 2007; Klink et al., 2005; Szakasits et al., 2008). However, LCM of differentiating GCs is difficult for the reasons described above. Their morphology and location have previously limited progress in the extraction of high‐quality RNA for differential transcriptomic analysis by LCM. GCs, 4 days post‐inoculation, have been isolated by LCM; expression analysis of their RNA by reverse transcriptase‐polymerase chain reaction (RT‐PCR) has been successful for a relatively small number of genes (Ramsay et al., 2004).
In this article, we describe a rapid protocol for obtaining root cells (GCs and vascular cells) from frozen tissue sections of galls and uninfected tissues of tomato. The morphology of the sections obtained was satisfactory and the RNA of the cells was well preserved. This method was developed by adapting current protocols for different plant species and cells. We also evaluated the minimum number of very early developing GCs [48–72 h post‐infection (hpi)] and control vascular cells (CCs) from uninfected root cells necessary for the efficient linear amplification of good‐quality RNA for efficient and reliable microarray analysis.
RESULTS AND DISCUSSION
The technique of LCM was used to obtain samples highly enriched in individual GCs from early stages of development, formed during the interaction of Meloidogyne javanica with tomato (Solanum lycopersicum) roots, and to obtain CCs from the uninfected root vascular cylinder. To overcome difficulties in the retention of cell morphology and RNA integrity, samples were fixed under vacuum and treated with increasing concentrations of sucrose as a cryoprotective agent prior to freezing. Different fixative solutions and treatments that improved cell morphology were also tested.
Tissue morphology following different fixation and embedding procedures
Fixation with non‐crosslinking precipitative or coagulative tissue fixatives has been commonly recommended for LCM (Nelson et al., 2006). Some authors have suggested that, compared with fixation with non‐coagulating crosslinking fixatives (e.g. aldehydes), fixation with the coagulating fixative ethanol–acetic acid (3 : 1) (EAA) increases both the RNA yield and quality following LCM (Kerk et al., 2003; Nakazono et al., 2003). We therefore compared a range of methods for gall RNA isolation.
When galls at 14 days post‐infection (dpi) were paraffin‐embedded and fixed, fixation with EAA or with the crosslinking fixatives 2.5% glutaraldehyde, 2% paraformaldehyde (PFA) or formaldehyde–glacial acetic acid–95% ethanol (3.7 : 5 : 50 v/v, FAA) yielded similar histological structures (Fig. 1A, before targeting with the laser; data not shown). EAA‐OCT procedure require only 2 days, whereas most protocols for paraffin embedding require longer times (see Experimental procedures). However, it is possible to shorten the procedure by the use of tissue‐handling robots with agitation under pressure or vacuum (Day et al., 2007b). As we desired a rapid method for obtaining high‐quality RNA from microdissected cells, we used the OCT medium‐embedded method (described in Experimental procedures). Gall sections fixed with 2% PFA or EAA, frozen after embedding in OCT medium, were histologically similar to those fixed with EAA embedded in paraffin (Fig. 1A, before targeting with laser).
Figure 1.
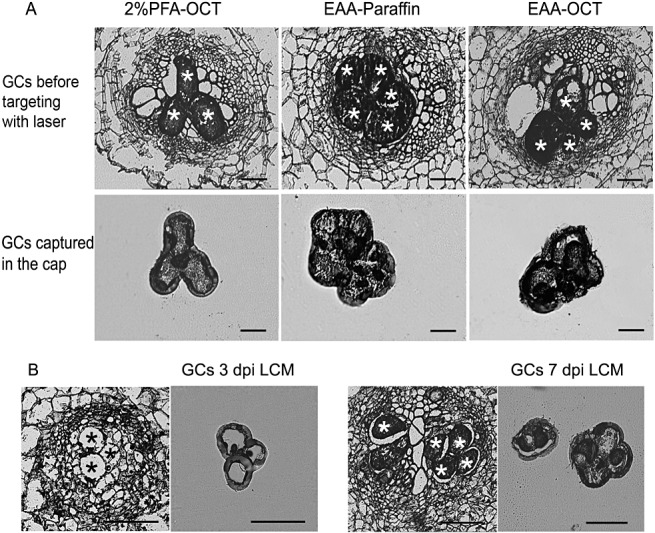
Cryosections of tomato galls and laser capture microdissection (LCM) procedure. Giant cells (GCs) before targeting with laser are indicated by either black or white asterisks. (A) Sections (10 µm) of galls at 14 dpi subjected to different treatments: 2% paraformaldehyde (PFA) and optimal cutting temperature (OCT) medium‐embedded; ethanol–acetic acid (3 : 1) (EAA) and paraffin‐embedded; EAA and OCT medium‐embedded. (B) Cryosections (10 µm) of galls at 3 and 7 days post‐infection (dpi) (see Experimental procedures), EAA‐fixed and OCT medium‐embedded, and LCM of GCs. Bars, 100 µm.
We introduced some important changes to the currently used fixation and cryopreservation protocols, including changes to the sucrose concentration used as a cryoprotectant to preserve cell morphology. A sucrose concentration of up to 34% was required for optimal morphology (Fig. 1A, B, before targeting with laser). Previous attempts to dissect OCT medium‐embedded GCs have failed to preserve gall cell morphology, probably because they result in poor cryopreservation (Ramsay et al., 2004). Current protocols that combine EAA and OCT medium as embedding media and obtain good‐quality RNA use either no, or up to only 10–15%, sucrose to microdissect the tissues (Casson et al., 2005; Nakazono et al., 2003). Our observed need for such a high sucrose concentration in gall tissues may be a result of the intrinsic characteristics of GCs, such as the extreme osmotic or turgor pressures. Although these pressures have not been measured directly, the difficulty in microinjecting solutions into GCs and in microaspirating young GCs suggests a high internal pressure (Wang et al., 2001; T. Bleve‐Zacheo, pers. comm.).
We established 48–72 hpi (hereafter, 3 dpi for simplification) as the limit for unequivocal GC identification as, at earlier infection times (12–48 hpi), they are difficult to distinguish from the rest of the cell tissues that are also becoming hypertrophied. Other authors have reported 72–96 hpi as the limit for clear identification and isolation by LCM (2006, 2004); a 24‐h difference in the infection time induces great variance during GC development at these early developing stages, making their identification in sections more difficult. Using the EAA–OCT medium procedure described in this study, we clearly distinguished GCs from galls at 3 and 7 dpi on the basis of their distinct morphology (Fig. 1B). Subsequently, GCs were captured by LCM as described in Experimental procedures and as shown in Fig. 1B.
Effects of different fixation and embedding procedures on RNA yield and quality
The effects of different fixation and embedding treatments on RNA yield and quality were evaluated, and the results are summarized in Table 1. It was found that the concentrations of RNA obtained directly after 50 GCs or 100 CCs were subjected to EAA–OCT medium–LCM could not be accurately quantified using a NanoDrop‐ND 1000 UV–Vis spectrophotometer (NanoDrop Technologies, Auckland, New Zealand), even though this is generally considered to be a highly sensitive method for nucleic acid quantification. Following two rounds of amplification, amplified RNA (aRNA) was only detectable from the EAA–OCT medium–LCM‐treated GC sample; no RNA was detected in the amplified samples from the EAA–paraffin and 2% PFA–OCT medium treatments (Fig. 2A; Table 1). Although paraffin embedding enhances the retention of the cellular morphology, facilitating cell identification (Kerk et al., 2003), some studies have reported a low RNA quality when using conventional methods for the laser capture of cells from paraffin sections (Cai and Lashbrook, 2006). Our results support this view. It is likely that crosslinking fixatives bind proteins to the RNA, which would prevent a high yield on extraction. EAA has been reported to increase both the yield and quality of RNA above the levels obtained with crosslinking reagents (Kerk et al., 2003; Nakazono et al., 2003). We suggest that EAA–paraffin gives a poorer amplification yield than EAA–OCT medium because of the intrinsic characteristics of GCs. As proposed by Nelson et al. (2006), any single protocol is unlikely to be optimal for all plant tissue sources, and so fixation and processing protocols must be optimized on a case‐by‐case basis.
Table 1.
Comparison of different methods evaluated to obtain a good morphology of gall sections where giant cells (GCs) could be identified for laser capture microdissection (LCM), and to obtain good‐quality RNA from LCM GCs for further transcriptomic analysis.
| Fixative method | Embedding medium | Characteristics |
|---|---|---|
| Crosslinking fixative, 2% PFA | OCT | Adequate preservation of tissue morphology allowing GC identification. After two amplification rounds, RNA was not detectable by conventional RT‐PCR (1, 2) |
| Coagulating fixative, EAA | Paraffin embedded | Good preservation of tissue morphology allowing GC identification, but RNA was not detectable after two linear amplification rounds (1, 2) |
| OCT embedded | Similar preservation of tissue morphology to EAA, paraffin‐embedding method (Fig. 1). Efficient linear RNA amplification after two rounds detectable by conventional RT‐PCR (Fig. 2). Adequate distribution of fragments in the electropherograms, indicating no degradation. Successful hybridization to TOM1 microarrays (Fig. 3; Table 3 and Table S1) |
Fixative solutions: paraformaldehyde (PFA) and ethanol–acetic acid (EAA). Embedding media: optimal cutting temperature (OCT) medium and paraffin. RT‐PCR, reverse transcriptase‐polymerase chain reaction.
Figure 2.
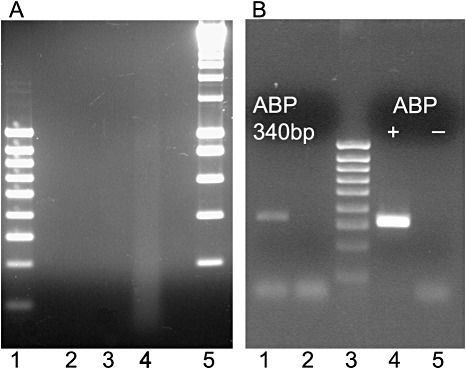
Influence of paraffin and optimal cutting temperature (OCT) embedding medium on RNA recovery. (A) Ethidium bromide‐stained agarose gel showing amplified RNA (aRNA) after two linear amplification rounds from 50 laser‐captured giant cells (GCs) at 3 days post‐infection (dpi) after different treatments. Lane 1, 100‐bp DNA ladder; lane 2, 2% paraformaldehyde (PFA) embedded in OCT medium; lane 3, ethanol–acetic acid (3 : 1) (EAA) embedded in paraffin; lane 4, EAA embedded in OCT medium; lane 5, 1‐kb DNA ladder. (B) Analysis of gene expression by reverse transcriptase‐polymerase chain reaction (RT‐PCR). Lane 1, product (340 bp) of an RT‐PCR from aRNA after two rounds of amplification obtained from 50 GCs at 3 dpi after EAA–OCT medium–laser capture microdissection (LCM), using primers for endoplasmic reticulum auxin binding protein 1 (ERabp1); lane 2, negative control with the former aRNA and primers; lane 3, 100‐bp DNA ladder; lane 4, 323‐bp amplification product obtained using the positive control RNA recommended by the kit; lane 5, corresponding negative control with primers only and no DNA. The sizes of the amplified bands are indicated.
To validate the use of the EAA–OCT medium–LCM combined protocol for differential gene expression analysis, RT‐PCR was employed to determine whether the small aliquots of aRNA produced from two rounds of amplification were suitable templates for differential gene expression. We investigated the expression of a tomato transcript coding for an endoplasmic reticulum auxin binding protein 1 (ERabp1) (GeneID: 543734), which has a very low or non‐detectable expression in uninfected tomato roots (see http://www.ncbi.nlm.nih.gov/sites/entrez?db=gene&cmd=search&term=%20ERabp1%20ER%20auxin%20binding%20protein). We found that the transcript of this gene could be reverse‐transcribed and amplified from 50 GCs at 3 dpi (Fig. 2B). The reaction produced a single band of the expected size (340 bp). This result confirmed that mRNA was recovered from the LCM samples, and that it could be amplified. Other indicators of RNA integrity, which is crucial for most high‐throughput transcript analyses (King et al., 2005; Portillo et al., 2006; Zhu et al., 2006), were also investigated to assess the aRNA yield and quality from EAA–OCT medium–LCM samples.
The average yield, size and distribution of molecules of aRNA from two amplification rounds of RNA from 50 GCs or 100 CCs were evaluated with an Agilent 2100 Bioanalyser using the RNA 6000 Nano LabChip kit (Agilent Technologies, Palo Alto, CA, USA). Figure 3B shows the electrophoretic fluorescence profile and gel images of the aRNA obtained from the captured cells. The preponderance of low‐molecular‐weight products (less than 200 nucleotides) indicates that either the amplification was not optimal or the starting mRNA was partially degraded. Loss of RNA integrity may have occurred either during tissue preparation or during RNA amplification from a limited number of cells (50 GCs). Bias related to the amplification process has been described previously (Van Gelder et al., 1990). This indicates that adequate RT‐PCR amplification of a particular gene does not in itself guarantee the structural integrity of aRNA.
Figure 3.
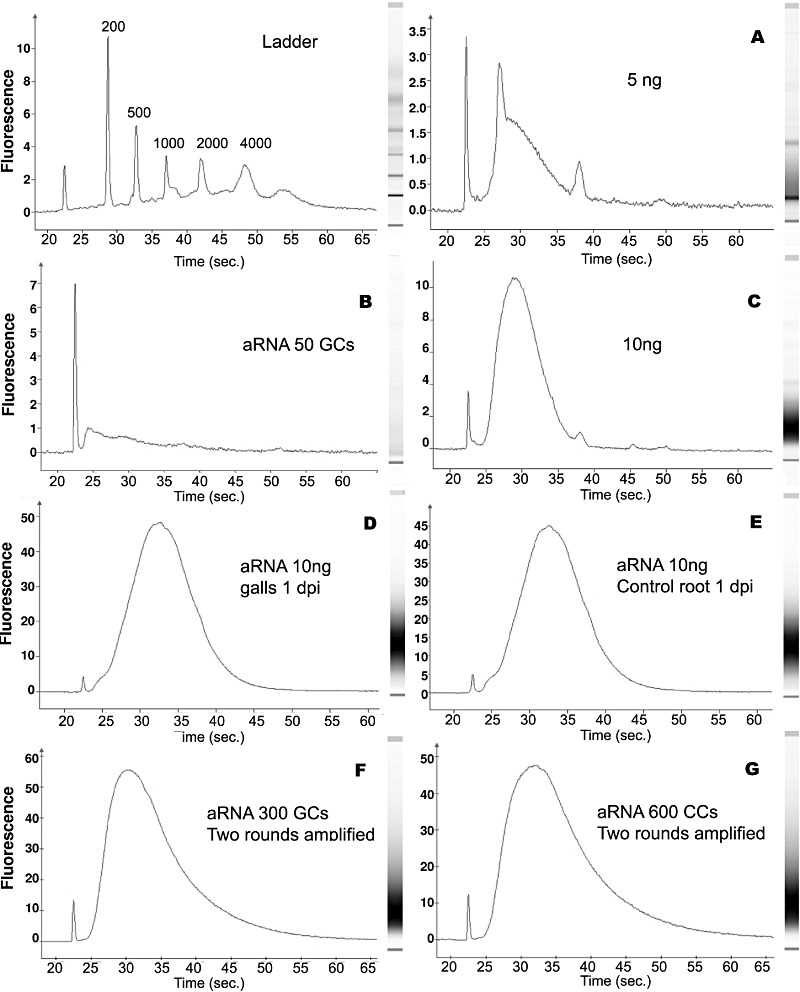
Electropherograms representing the size distribution of amplified RNAs (aRNAs) produced from different RNA inputs after two rounds of amplification. (A–C) The average size distribution of RNA fragments from tomato root RNA (5 ng) and 50 laser‐capture‐microdissected giant cells (GCs) was irregular and difficult to estimate, but abundant RNA fragments were around 300–500 nucleotides for 10 ng. (D–G) The average size from 10 ng of RNA from galls or control roots and from 300 GCs at 3 days post‐infection (dpi) or 600 control vascular cells was around 600–800 nucleotides. Top left, RNA size marker ladder (6000 nanomarker from Ambion). On the right‐hand side of each electropherogram is a gel image generated from aRNAs, with a smear ranging from about 200 to 1000 nucleotides in length.
For linear RNA amplification, Ambion recommends the use of 100–1000 ng of total input RNA. The number of cells necessary to obtain this amount depends on their intrinsic RNA content and the efficiency of RNA extraction. As we could not measure the amount of RNA extracted from 50 GCs, we next sought to determine how many GCs were necessary for an optimal yield of total RNA that could serve as a template for high‐quality amplification. We tested T7‐based linear RNA amplification using different quantities of input RNA from tomato roots, extracted as described in Portillo et al. (2006), and from different numbers of LCM GCs. Amplified RNA was synthesized from 1, 5, 10 or 250 ng of total RNA from tomato root or from the total RNA extracted from 150 GCs and 200 CCs after LCM. The aRNA yields obtained after one or two amplification rounds are given in Table 2. Detectable amounts of aRNA were obtained with as little as 10 ng of input RNA from galls at 1 dpi and from equivalent tissue in non‐infected roots. Smaller amounts of input RNA (i.e. between 1 and 5 ng) from tomato roots did not result in good yields, and the amplification rates were not proportional to the starting RNA input. However, when 10 ng of the same RNA was used, the yield after two rounds of amplification was fivefold higher than when 5 ng RNA (around 2000 ng/µL) was used. Moreover, the RNA amplified from either 150 GCs or 200 CCs was accurately quantifiable (Table 2). Thus, the starting amount of RNA used for the amplification reaction is crucial, and our data suggest that 10 ng is the minimum amount assayed to provide successful amplification rates from roots. In addition, the same amounts of input RNA from different tissues (whole roots, galls, root segments close to the root tip) yielded different amplification rates (Table 2), further suggesting that intrinsic tissue characteristics may influence this process.
Table 2.
Starting amount of RNA and subsequent yields after linear amplification.
| Starting RNA for the 1st round (ng) | 1st round amplification (ng/µL) | Starting RNA for the 2nd round (ng) | 2nd round amplification (ng/µL) |
|---|---|---|---|
| 1 ng TRT | 8.8 | 440 | 26.6 |
| 5 ng TRT | 8.0 | 400 | 97.3 |
| 10 ng TRT | 8.9 | 445 | 616.3 |
| 250 ng TRT | 437.4 | – | – |
| 150 LCM GCs | 14.2 | 720 | 930 |
| 200 LCM CCs | 25.9 | 167 | 766 |
| 10 ng galls, 1 dpi | 148.2 | 1482 | 2725 |
| 10 ng control, 1 dpi | 136.5 | 1365 | 2578 |
LCM CCs, laser‐capture‐microdissected control cells from root vascular tissue; LCM GCs, laser‐capture‐microdissected giant cells at 3 days post‐inoculation; TRT, tomato root tissue.
All samples were subjected to two rounds of T7‐based linear RNA amplification, except for the 250‐ng input sample.
Electropherograms revealed that the quality of the aRNA from input samples of 1 and 5 ng was very poor, as a clear population of transcripts with a particular size range could not be identified (Fig. 3A; and data not shown). These results are similar to those for the 50 GC and 100 CC samples (Fig. 3B; and data not shown). When either 10 ng of RNA from roots or 150 GCs or 200 CCs were used for amplification, an abundant transcript population at around 300–500 nucleotides was seen (e.g. Fig. 3C). This small transcript size range may compromise further analytical techniques, such as microarrays. Consequently, a minimum of 150 GCs at 3 dpi and 200 CCs was required to obtain measurable quantities of aRNA for further analysis, although its integrity was not fully reliable. Therefore, we increased the number of LCM isolated cells. When the same procedure was used with either 10 ng of gall or control root tissue, or with a larger number of GCs and CCs (300 and 600, respectively), the electropherogram profiles showed a good distribution of RNA fragments, with a maximum at around 600–800 nucleotides (Fig. 3D–G). These results indicate that good‐quality RNA was successfully isolated from the cytoplasm of GCs and from the root vascular cells after LCM of cryosections (Table 1). We conclude that the amount of input RNA for the linear amplification reaction is critical for efficient amplification, and for the quality/integrity of aRNA for further high‐throughput molecular analyses.
Microarray analysis using RNA amplified from GCs and CCs
The reproducibility and fidelity of the amplification and extraction methods were assessed by the hybridization of TOM1 tomato microarrays with three independent biological replicates of aRNA from 300 GCs vs. 600 CCs at 3 and 7 dpi. Pearson correlation coefficients and plots for the normalized scan intensity data were calculated for the RNA amplification–hybridization analysis in pair‐wise comparisons, and an example is shown in Fig. 4. Correlation values at a significance of P < 0.01 were high (minimum, 0.84; maximum, 0.95; Fig. 4). In addition, quantitative PCR (qPCR) also validated the microarray data, as three genes, one up‐regulated and the other two down‐regulated in GCs at 3 and 7 dpi, showed parallel expression profiles in hand‐dissected gall RNA at the same infection stages (Table 3A). In addition, 23 genes differentially expressed in tomato GCs at 3 and 7 dpi showed the same expression pattern as their homologues in Arabidopsis galls at 7 dpi (Jammes et al., 2005) (Table 3B). Moreover, 94 genes (53 up‐regulated and 41 down‐regulated) showed the same expression pattern in tomato GCs at 7 dpi when compared with their homologues in Arabidopsis galls at 7 dpi (Table S1, see Supporting Information).
Figure 4.
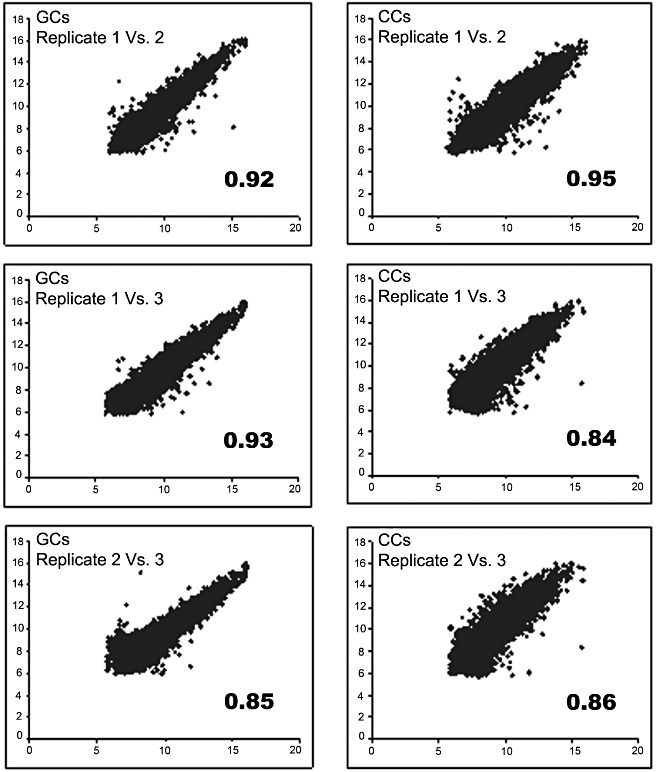
Plots of the normalized intensity data obtained after two‐colour microarray hybridization [RNA from giant cells (GCs) at 7 days post‐infection (dpi) vs. RNA from corresponding control vascular cells (CCs)]. Pair‐wise comparisons are shown of three independent biological replicates used for RNA amplification–hybridization analysis and their Pearson correlation coefficients (bottom right); P < 0.01. Three independent biological replicates of 300 GCs at 7 dpi and 600 CCs were collected for RNA extraction and amplification.
Table 3.
Microarray data validation.
| (A) Quantitative reverse transcriptase‐polymerase chain reaction (qPCR) with RNA from hand‐dissected galls (Ag) at 3 and 7 days post‐infection (dpi) vs. RNA from equivalent uninfected root segments. | |||||||||
|---|---|---|---|---|---|---|---|---|---|
| 3 dpi | 7 dpi | ||||||||
| SGN‐U | Description | qPCR | Ag | TOM1 | CGs/CCs | qPCR | Ag | TOM1 | CGs/CCs |
| SGN‐U152030 | Putative LRP (lateral root primordia) 1 [Oryza sativa (japonica cultivar group)] | 2.40 | 1.71 | 2.40 | 1.85 | ||||
| SGN‐U143838 | Pathogenesis‐related protein PR‐1 precursor [Capsicum annuum] | −0.81 | −2.97 | −2.57 | −4.18 | ||||
| SGN‐U144043 | Peroxidase | −0.64 | −2.68 | −1.15 | −4.58 | ||||
| (B) Comparison of TOM1 log2 ratios with the same data from the homologous genes obtained from the Complete Arabidopsis Transcriptome Microarray (CATMA) hybridized with RNA from whole Arabidopsis galls at 7 dpi vs. control uninfected segments by (Jammes et al., 2005). | |||||
|---|---|---|---|---|---|
| TOM1 3 dpi | TOM1 7 dpi | CATMA 7 dpi | |||
| SGN‐U | Description | GCs/CCs | GCs/CCs | Galls/reference | |
| SGN‐U148611 | Calcium‐binding EF‐hand family protein [Arabidopsis thaliana] | 1.17 | 1.36 | AT3G10300 | 2.21 |
| SGN‐U144918 | Macrophage migration inhibitory factor (MIF) family [A. thaliana] | 1.26 | 1.45 | AT5G01650 | 0.69 |
| SGN‐U143273 | 1‐Aminocyclopropane‐1‐carboxylate oxidase 2 (ACC oxidase 2) (ethylene‐forming enzyme) | −1.73 | −2.05 | At1g05010 | −2.00 |
| SGN‐U145252 | 1‐Aminocyclopropane‐1‐carboxylate oxidase [Solanum tuberosum] | −2.00 | −2.23 | AT1G05010 | −0.76 |
| SGN‐U145393 | At1g17620 [A. thaliana] | −2.46 | −2.65 | AT1G17620 | −1.12 |
| SGN‐U143928 | Xyloglucan endotransglycosylase (XTR4), putative [A. thaliana] | −2.49 | −2.98 | AT1G32170 | −1.26 |
| SGN‐U150639 | Unknown [A. thaliana] | −1.70 | −1.86 | AT1G52200 | −0.96 |
| SGN‐U143303 | Lipoxygenase A | −1.52 | −2.43 | AT1G55020 | *(−1.41) −1.02 |
| SGN‐U143803 | Putative γ TIP [Nicotiana glauca] | −2.39 | −3.12 | AT2G36830 | *(−1.49) −1.60 |
| SGN‐U143455 | Putative peroxidase [Oryza sativa (japonica cultivar group)] | −2.73 | −2.64 | AT2G37130 | −0.95 |
| SGN‐U143822 | Embryo‐abundant protein EMB [Pisum sativum] | −2.53 | −3.12 | AT2G41380 | −1.20 |
| SGN‐U143771 | axi 1 protein from Nicotiana tabacum‐related [A. thaliana] | −1.15 | −1.75 | AT2G44500 | −0.74 |
| SGN‐U146284 | Pathogen‐inducible α‐dioxygenase [Nicotiana attenuata] | −1.76 | −2.01 | AT3G01420 | −1.97 |
| SGN‐U159571 | No apical meristem (NAM) protein family [A. thaliana] | −1.76 | −3.45 | AT3G18400 | −0.73 |
| SGN‐U150800 | Hypothetical protein [A. thaliana] | −1.90 | −3.38 | AT3G48180 | −0.68 |
| SGN‐U152291 | Auxin‐induced (indole‐3‐acetic acid induced) protein family [A. thaliana] | −1.48 | −1.91 | AT3G60690 | −0.73 |
| SGN‐U145645 | Hypothetical protein SENU1, senescence up‐regulated – tomato (fragment) | −1.98 | −3.34 | AT3G62420 | −0.97 |
| SGN‐U143226 | Oxidoreductase, zinc‐binding dehydrogenase family [A. thaliana] | −1.55 | −1.58 | AT4G13010 | −0.77 |
| SGN‐U146724 | Expressed protein [A. thaliana] | −1.49 | −2.04 | AT4G17900 | −0.86 |
| SGN‐U149079 | Hypothetical protein [A. thaliana] | −1.92 | −2.23 | AT4G28050 | −0.70 |
| SGN‐U155547 | Ribulose bisphosphate carboxylase small chain 2A, chloroplast precursor (RuBisCO s.s2A) | −1.58 | −2.12 | AT4G39980 | −0.82 |
| SGN‐U145263 | AT5g25110/T11H3_120 [A. thaliana] | −1.19 | −2.22 | AT5G25110 | −1.32 |
| SGN‐U152349 | bZIP transcription factor, TGA1 [A. thaliana] | −1.53 | −2.8 | AT5G65210 | −0.79 |
The log2 expression ratios obtained from the TOM1 hybridizations with RNA doubly amplified from giant cells (GCs) induced by Meloidogyne javanica at 3 and 7 dpi vs. the corresponding controls (CCs). A positive ratio indicates that the gene is induced in GCs; a negative ratio indicates that the gene is repressed in GCs.
Results of qPCR validation (Jammes et al., 2005).
In conclusion, we have shown that fixation with EAA and infiltration with sucrose, prior to freezing in isopentane with OCT embedding medium, generates cryosections suitable for LCM of GCs at early and very early differentiation stages (7 and 3 dpi, respectively) and of root vascular cells. This method provides good tissue morphology, which is essential for unequivocal identification of GCs during LCM. It should also not significantly affect the ability of a researcher to perform subsequent molecular analyses on the RNA, as a high integrity/quality of RNA is obtained after two rounds of amplification with a starting number of around 300 GCs or 600 CCs. Therefore, the protocol reported in this study provides a simple and rapid method for obtaining frozen tissue sections of roots and galls, and RNA from LCM GCs, resulting in good tissue morphology and RNA preservation. Furthermore, our results show that the hybridization patterns of three independent biological replicates from either CCs or GCs at 3 and 7 dpi displayed consistent and reliable profiles. These were further confirmed for several genes by qPCR performed with total gall RNA, and by the parallel expression patterns of 117 gene homologues in Arabidopsis at the same developmental stages from the RNA of whole galls. Therefore, the methodology described could be used for different purposes, and could either substitute or complement more time‐consuming in situ hybridization and histochemical procedures.
Our most important methodological findings are that we have isolated RNA from GCs at the earliest developmental stage ever described in the literature (48–72 hpi), and have demonstrated for the first time that the RNA extracted specifically from these early developing cells is suitable for differential transcriptomic analysis, such as microarrays. In consequence, it is expected that a wide range of holistic approaches for gene expression in GCs could also be performed. These procedures will provide the molecular plant pathology community with a powerful additional tool to elucidate specific transduction and metabolic pathways of GCs, especially at the very early development stages, which are still very poorly characterized. In addition, no gene promoter capable of specifically directing gene expression in GCs has been identified to date, an objective of value for engineering plant protection strategies against parasitic nematodes. The methodology discussed in this paper for the isolation of RNA from GCs should help achieve this goal.
EXPERIMENTAL PROCEDURES
Plant material and nematode infection
Meloidogyne javanica populations were maintained under sterile conditions on cucumber roots in vitro. Tomato seeds (Solanum lycopersicum Mill cv. Moneymaker) were surface‐sterilized by soaking for 30 min in 20% commercial bleach with 0.1% v/v Triton X‐100, followed by eight washes with Milli‐Q water. Forty seeds were germinated in vitro in Petri dishes (125 mm) on Gamborg B5 medium (Gamborg et al., 1968) supplemented with 20 g/L sucrose and 1.5% Daishin agar (Duchefa Biochemie, Haarlem, the Netherlands), pH 6.2. The plates were tilted horizontally and kept in the dark at 4 °C for 48 h. They were then placed vertically, to allow the roots to grow along the surface, in the dark at 28 °C and 65% humidity for 3 days. Between 8 and 10 seedlings were transferred to new Gamborg plates. Each primary tomato root was inoculated just behind the root tip with sterile, freshly hatched M. javanica (20–30 stage 2 juveniles, J2). The growth of the root tips from non‐inoculated and inoculated seedlings, as well as the galls formed after penetration of J2, were carefully monitored every 24 h by labelling the bottom of the plates. Therefore, we collected galls for microdissection at two different time points (48–72 hpi and 6–7 dpi; for simplification, these are referred to as 3 and 7 dpi). The plates were incubated at 28 °C vertically in the dark during the infection time course. Finally, tissues were collected at different dpi.
Tomato root tissues (Table 2) were hand‐dissected tomato roots obtained from seedlings grown for 4–5 days in in vitro culture, as described above. Control samples at 1 dpi (Table 2) were collected as root segments from the main root in equivalent positions to the galls from uninfected roots at 1 dpi.
Fixation and cryopreservation
Single galls at 3 and 7 dpi, and control uninfected root fragments equivalent in growth to galls, were individually hand dissected. They were fixed immediately on ice in a fixative solution composed of 75% (v/v) ethanol and 25% (v/v) acetic acid (Kerk et al., 2003; Sass, 1958). A modified protocol from Nakazono et al. (2003) for tissue fixation was adapted to obtain optimal RNA quality from microdissected, cryosectioned samples. Tissues were vacuum infiltrated with the fixative solution in an Eppendorf Concentrator 5301 (Eppendorf, Hamburg, Germany) for 10 min on ice. The vials containing the root samples in the fixative solution were swirled in a rotator at 70 r.p.m. for 1 h at 4 °C. The solution was replaced by new fixative solution, the vacuum infiltration step was repeated for 10 min and the samples were incubated under the same conditions for 2 h.
To minimize ice crystal formation, the fixative solution was removed and replaced with 10% (w/v) sucrose in 0.01 m phosphate‐buffered saline, pH 7.4 [Sigma‐Aldrich, Poole, Dorset, UK; 0.138 m NaCl and 0.0027 m KCl in diethyl pyrocarbonate (DEPC)‐treated water]. The sucrose solution was infiltrated into the tissue under vacuum in an Eppendorf Concentrator 5301 on ice for 10 min, and the samples were incubated for 2 h at 4 °C in a rotator at 70 r.p.m. This was followed by the infiltration of fresh 15% (w/v) sucrose in 0.01 m PBS for 10 min under vacuum, 2 h incubation in a rotator at 4 °C, followed by infiltration of 34% sucrose and incubation overnight as in the previous step. Finally, the galls and control tissue were embedded in Tissue Tek OCT embedding medium in plastic tissue moulds (RA Lamb, Eastbourne, Sussex, UK) and quickly frozen by placing the mould into a beaker with liquid isopentene constantly cooled with liquid nitrogen at –100 °C. The moulds were then transferred to liquid nitrogen and stored at −80 °C until cryosectioning.
Paraffin embedding
Fixed tissue was dehydrated at room temperature in an ethanol series (30 min each: 20%, 30%, 40%, 50%, 70%, 80% and 95% v/v), and then incubated in 95% ethanol and 0.1% safranin‐O for 2 h, 95% ethanol for 1 h, 100% ethanol for 1 h and 100% ethanol overnight. The solution was replaced by fresh 100% ethanol for 1 h, followed by a xylene–ethanol series (30 min each: 25% : 75%, 50% : 50% and 75% : 25%, v/v) and 9 : 1 xylene–chloroform (three times, 1 h each). Xylene is typically used as an organic solvent for the infiltration of paraffin. In the presence of 100% xylene, paraffin will sink to the bottom of the vial, resting on the tissue. In the presence of 90% : 10% xylene–chloroform, paraffin floats; 90% : 10% xylene–chloroform was used as an organic solvent to allow for a more gradual infiltration of paraffin into the tissue.
Eight Paraplast X‐tra® embedding media chips (P‐3808, Sigma‐Aldrich) were added to 10‐mL glass vials containing 5 mL of xylene–chloroform solution, and were incubated at room temperature overnight, followed by incubation at 42 °C for 30 min. Eight Paraplast chips were added every 30 min four to five times, followed by incubation at 42 °C with occasional swirling. Finally, the Paraplast–xylene solution was removed and 10 mL of melted Paraplast was added and incubated at 58 °C for 10 h. Paraplast was replaced every 10 h for 2 days. Samples were positioned in moulds (Cat Ref E10.6/2001/33, RA Lamb) with liquid Paraplast, and allowed to set overnight at 4 °C; 10‐µm sections were cut from the blocks using a rotary microtome (Leica RM2235, Leica Microsystems, Nussloch, Germany), transferred to glass microscope slides (76 × 26 mm; BDH Laboratory Supplies, Poole, Dorset, UK), and floated on DEPC‐treated water (Sigma‐Aldrich).
LCM technique
Galls and control samples in moulds were cryosectioned (10 µm) using a Leica CM3050S cryostat (Leica Microsystems) at −20 °C. Sections were adhered to polylysine‐coated glass slides (76 × 26 mm, BDH Laboratory Supplies) and stored in 70% v/v ethanol with DEPC‐treated water at −20 °C until collected. Samples were rinsed with fresh 70% ethanol at room temperature for 30 s, washed with 0.01% PBS pH 7.4 for 30 s, and stored in 95% ethanol at −20 °C overnight. The 95% ethanol was replaced and samples were incubated for 30 s at room temperature, followed by 100% ethanol for 30 s, and washed twice for 1 min in 100% xylene. The slides were air‐dried at room temperature until the xylene had completely evaporated, and were then placed in boxes with silica gel until laser microdissection. The slides were never kept for more than 6 h before use.
A PixCell II system using CapSure HS LCM caps (Arcturus, Mountain View, CA, USA) was used for LCM. The GCs and CCs were located and microdissected. The power and length of the laser beam were typically set to 90–110 mW for 70 µs, using a spot size of 7.5 µm. These settings allowed the capture of single cells. Fifty single GCs and 100 CCs were processed per LCM cap. The number of cells indicated represents the total number of 10‐µm‐thick GC slides (three to five per section) processed. Non‐specific material was removed from the surface of each LCM cap using a Post‐It note. An ExtracSure Sample Extraction Device (Arcturus) was then attached to the LCM cap for RNA extraction.
RNA extraction procedures
The RNA from LCM cells was immediately extracted using the Absolutely RNA Nanoprep kit (Stratagene, CA, USA) according to the manufacturer's instructions, with minor modifications. Briefly, 100 µL of lysis buffer was applied to the cap via the ExtracSure Sample Extraction Device that was then connected to a 0.5‐mL microcentrifuge tube. After vortexing, the sample was incubated at 60 °C for 5 min. The lysis buffer was then collected and mixed with an equal volume (ca. 100 µL) of 70% ethanol before being applied to the RNA‐binding column. DNase was added and incubated at room temperature for 10 min, followed by washing. Finally, the RNA was eluted twice in 10 µL of DEPC‐treated water.
Fifty GCs and 100 CCs were independently captured from sections onto separate CapSure HS LCM caps, and total RNA isolation was performed from each cap. RNA from six separate caps was pooled for a single biological replicate of GCs or CCs, respectively. In total, three independent biological replicates were processed. Thus, near to 7000 individual cells were harvested by LCM. The material was obtained from more that 18 independent infection experiments.
RNA amplification
For each replicate, total mRNA from the LCM GCs and CCs was separately amplified using the MessageAmp II aRNA Amplification Kit (Ambion Europe Ltd., Huntingdon, UK); two rounds of amplification were used according to the manufacturer's instructions. The RNA eluted from each cap (in 20 µL) was concentrated to 11 µL in an Eppendorf Concentrator 5301 to start the first amplification process. The aRNA was purified according to the manufacturer's instructions and used in a second round of aRNA amplification labelled with 5‐(3‐aminoallyl)‐UTP (Cat #AM8437, Ambion Europe Ltd.). The doubly amplified aRNA was purified and eluted in 20 µL of water and stored at −80 °C. The in vitro transcription reaction was performed at 37 °C for 14 h for both the first and second rounds of amplification. The aRNA yield from each round was measured in a NanoDrop‐ND 1000 UV–Vis spectrophotometer (NanoDrop Technologies), and its quality and size distribution were evaluated using an Agilent 2100 Bioanalyser with the RNA 6000 Nano LabChip kit (Agilent Technologies), employing 1 µL of total aRNA according to the manufacturer's instructions.
RT‐PCR
RT‐PCR was performed using the Access RT‐PCR System kit (Cat #A1250, Promega, Southampton, UK), according to the manufacturer's instructions. One microlitre of purified aRNA after two amplification rounds was used per reaction. The amplification conditions were as follows: 48 °C for 45 min, 94 °C for 2 min and 40 cycles of (94 °C for 30 s, 55 °C for 30 s and 68 °C for 1 min), followed by an extension at 68 °C for 7 min. The primer pairs used for RT‐PCR of ERabp1 were as follows: forward, ABP (+61) 5′‐CAGACTGATGCTACGATAATG‐3′; reverse, ABP (−399) 5′‐TGGGTACTTTGAATGTGAACT‐3′. The PCR products were electrophoretically separated on a 1.8% agarose gel, stained with ethidium bromide, and the product size was determined by comparison with a DNA ladder (100 bp, Cat #G2101, Promega). A positive control RNA supplied with the kit was prepared in nuclease‐free water. RT‐PCR containing the indicated amount of positive control RNA was performed according to the manufacturer's instructions, using control oligonucleotide primers.
Microarray hybridization
Labelling of aRNA probe
aRNA (7.5 µg) was suspended in 14 µL of DEPC‐treated water, 2 µL of 1 m Na2CO3 and 4 µL of cyanine‐3 (Cy3) or cyanine‐5 (Cy5) reactive dye (Cat. No. Q13104 and Q15104, Amersham Biosciences Corp., Little Chalfont, Buckinghamshire, UK). The reaction was mixed and incubated in the dark for 1 h at room temperature; 35 µL of 100 mm sodium acetate, pH 5, was added and incubated in the dark for 5 min at room temperature. The final volume was brought to 100 µL with RNAse‐free water. Labelled aRNA was purified with a Megaclear kit (Cat #1908, Ambion Europe Ltd.) according to the manufacturer's protocol. The labelling efficiency was calculated by analysing the sample with the array program in a NanoDrop®‐ND 1000 UV–Vis spectrophotometer (NanoDrop Technologies).
Pre‐hybridization
TOM1 microarray slides from the Center for Gene Expression Profiling (CGEP) at the Boyce Thompson Institute (BTI), Cornell University (see the Functional Genomics Database, http://ted.bti.cornell.edu/) were pre‐hybridized in a humidified hybridization chamber for 45 min at 42 °C using 80 µL of pre‐heated buffer containing 5 × standard saline citrate (SSC), 0.1% sodium dodecylsulphate (SDS), 1% bovine serum albumin (BSA), 10 mm ethylenediaminetetraacetic acid (EDTA), pH 8, and DEPC‐treated water, covered with a clean glass LifterSlip 22x601‐2‐4861 (Erie Scientific, Portsmouth, NH, USA). The slides were removed from the chamber and washed five times with Milli‐Q water at room temperature, dipped in isopropanol and dried by centrifugation (490 g for 1 min).
Hybridization
A hybridization mix was prepared with 250 pmol each of either Cy5‐ or Cy3‐labelled aRNA (in 17 µL), 4 µL of 0.5 m EDTA, pH 8, and 2 µL of poly(A)+ DNA to a final volume of 40 µL. Probes were denatured at 65 °C for 3 min, followed by instant cooling on ice for 1 min, and combined with 40 µL of hybridization buffer containing 50% formamide, 5 × SSC and 0.1% SDS. Probe solution was pipetted onto the spotted surface of the slide and hybridization was carried out under a LifterSlip in the dark within a humidified hybridization chamber for 16–24 h in a water bath at 42 °C. Three slides were hybridized independently with aRNA from three biological replicates, including one dye‐swap. Two independent treatments were assayed (3 and 7 dpi GCs vs. CCs).
Post‐hybridization
After hybridization, the slides were washed using a black jar as follows: two washes at 42 °C for 5 min in 0.5 × SSC/0.2% SDS, two washes for 5 min in 0.1 × SSC at room temperature, one wash for 5 min in 0.05 × SSC at room temperature and one quick wash in Milli‐Q water at room temperature. The slides were dried by immediately centrifuging at 490 g for 1 min. The microarray scanning was carried out using an Axon 4000B scanner running Gene Pix 5.1 software (Axon Instruments/Molecular Devices Corporation, Sunnydale, CA, USA). Data were collected in the Cy3 and Cy5 channels and the microarray analysis was obtained using the LIMMA package, as described by Adie et al. (2007).
qRT‐PCR
qRT‐PCR was carried out using the Applied Biosystems 7900 Real‐Time PCR system. Specific primers for each gene selected were designed from the expressed sequence tags (ESTs) of Unigenes (SGN; http://sgn.cornell.edu) using Primer Express software (Applied Biosystems, Foster City, CA, USA.). The primers used are detailed in Table 4. The cDNA template was obtained from total RNA (isolated as described; Portillo et al., 2006) from three biological replicates of hand‐dissected galls at 3 and 7 dpi and equivalent controls (fragment of uninfected roots at the same developmental stage). qRT‐PCR was conduced in triplicate for each independent biological replicate in a final volume of 10 µL using SYBR Green PCR Master Mix (Applied Biosystems). The PCR conditions used were as follows: 50 °C for 2 min and 95 °C for 10 min, followed by 40 cycles of 95 °C for 15 s and 60 °C for 1 min. A hypothetical protein coding cDNA (SGN‐U150992) was used as an internal control for tomato galls. This gene showed a steady state transcript profile along the infection times (1, 3, 7 and 14 days, data not shown) on the TOM1 array. The quantification of gene expression was performed using the relative ΔΔC T method by comparing the data with the internal control gene.
Table 4.
Sequences of primers used for quantitative reverse transcriptase‐polymerase chain reaction.
| SGN‐U | Forward primers | Reverse primers |
|---|---|---|
| SGN‐U 152030 | 5′‐GGTGCATCAACAACAACAACAAC‐3′ | 5′‐TTTCTTAGCACTTGATGTTGATTGG‐3′ |
| SGN‐U 143838 | 5′‐ACTCAGGTGGTGTGGCGTAAC‐3′ | 5′‐AAAGTACCACCCGTTGTTGCA‐3′ |
| SGN‐U 144043 | 5′‐TGTTGACTGTTGAGTTAATTGTTTGGT‐3′ | 5′‐TCTTCATCACATCACTTTTATTGCTACA‐3′ |
| SGN‐U 150992 | 5′‐TCAGAAAGGAACAAGTGAGGGTTC‐3′ | 5′‐TGTCCACTAATCTTCACAACACCTG‐3′ |
Genes of interest encoding a putative LRP (lateral root primordia 1) (SGN‐U 152030), pathogenesis‐related protein PR‐1 precursor (SGN‐U143838), a peroxidase (SGN‐U144043) and internal control (SGN‐U150992).
Supporting information
Table S1 The log2 expression ratios obtained from the TOM1 hybridizations with RNA doubly amplified from giant cells (GCs) induced by Meloidogyne javanica at 7 days post‐infection (dpi) vs. corresponding controls (CCs). Positive ratio indicates that the gene is induced in GCs (red boxes) and negative ratio indicates that the gene is repressed in GCs (green boxes). Also shown is a comparison of TOM1 log2 ratios with the same data from the homologous genes obtained from the Complete Arabidopsis Transcriptome Microarray (CATMA) hybridized with RNA from Arabidopsis galls at 7 dpi vs. control uninfected segments (reference).
Please note: Wiley‐Blackwell are not responsible for the content or functionality of any supporting materials supplied by the authors. Any queries (other than missing material) should be directed to the corresponding author for the article.
Supporting info item
ACKNOWLEDGEMENTS
This work was supported by grants from the Fundación Ramón Areces and the Ministerio de Educacion (AGL‐2004‐08103‐C02‐02; AGL2007‐60273/AGR) to CE, and the Junta de Comunidades de Castilla‐La Mancha (JCCM, PCI08‐0074‐0294 (2008–2010) to CF.
REFERENCES
- Adie, B.A. , Pérez‐Pérez, M.M. , Godoy, M.P. , Sánchez‐Serrano, J.J. , Schmelz, E.A. and Solano, R. (2007) ABA is an essential signal for plant resistance to pathogens affecting JA biosynthesis and the activation of defenses in Arabidopsis. Plant Cell, 19, 1665–1681. [DOI] [PMC free article] [PubMed] [Google Scholar]
- Angeles, G. , Berrio‐Sierra, J. , Joseleau, J.P. , Lorimier, P. , Lefebvre, A. and Ruel, K. (2006) Preparative laser capture microdissection and single‐pot cell wall material preparation: a novel method for tissue‐specific analysis. Planta, 224, 228–232. [DOI] [PubMed] [Google Scholar]
- Asano, T. , Masumura, T. , Kusano, H. , Kikuchi, S. , Kurita, A. , Shimada, H. et al. (2002) Construction of a specialized cDNA library from plant cells isolated by laser capture microdissection: toward comprehensive analysis of the genes expressed in the rice phloem. Plant J. 32, 401–408. [DOI] [PubMed] [Google Scholar]
- Bleve‐Zacheo, T. and Melillo, M.T. (1997) The structure of giant cells In: Cellular and Molecular Aspects of Plant–Nematode Interactions. (Fenoll C., Grundler F. M. W. and Ohl S. A., eds), pp. 65–79. Dordrecht: Kluwer Academic Publishers. [Google Scholar]
- Bonner, R.F. , Emmert‐Buck, M. , Cole, K. , Pohida, T. , Chuaqui, R. , Goldstein, S. et al. (1997) Laser capture microdissection: molecular analysis of tissue. Science, 278, 1481–1483. [DOI] [PubMed] [Google Scholar]
- Cai, S. and Lashbrook, C.C. (2006) Laser capture microdissection of plant cells from tape‐transferred paraffin sections promotes recovery of structurally intact RNA for global gene profiling. Plant J. 48, 628–637. [DOI] [PubMed] [Google Scholar]
- Caillaud, M.C. , Dubreuil, G. , Quentin, M. , Perfus‐Barbeoch, L. , Lecomte, P. , De Almeida Engler, J. et al. (2008) Root‐knot nematodes manipulate plant cell functions during a compatible interaction. J. Plant Physiol. 165, 104–113. [DOI] [PubMed] [Google Scholar]
- Casson, S. , Spencer, M. , Walker, K. and Lindsey, K. (2005) Laser capture microdissection for the analysis of gene expression during embryogenesis of Arabidopsis. Plant J. 42, 111–123. [DOI] [PubMed] [Google Scholar]
- Day, R.C. , McNoe, L. , and Macknight, R.C. (2007a) Evaluation of global RNA amplification and its use for high‐throughput transcript analysis of laser‐microdissected endosperm. Int. J. Plant Genomics, 2007, 1–17. [DOI] [PMC free article] [PubMed] [Google Scholar]
- Day, R.C. , McNoe, L.A. and Macknight, R.C. (2007b) Transcript analysis of laser microdissected plant cells. Physiol. Plantarum, 129, 267–282. [DOI] [PMC free article] [PubMed] [Google Scholar]
- Emmert‐Buck, M.R. , Bonner, R.F. , Smith, P.D. , Chuaqui, R.F. , Zhuang, Z. , Goldstein, S.R. et al. (1996) Laser capture microdissection. Science, 274, 998–1001. [DOI] [PubMed] [Google Scholar]
- Escobar, C. and Fenoll, C. (2008) Cambios en la expresión génica como resultado de la interacción planta‐nematodo: métodos de estudio In: Herramientas biotecnológicas en fitopatología (Pallas V., Escobar C., Rodriguez Palenzuela P. and Marcos J., eds), pp. 1–56. Madrid: Mundi Prensa SEF. [Google Scholar]
- Gamborg, O.L. , Miller, R.A. and Ojima, K. (1968) Nutrient requirements of suspension cultures of soybean root cells. Exp. Cell Res. 50, 151–158. [DOI] [PubMed] [Google Scholar]
- Gheysen, G. and Fenoll, C. (2002) Gene expression in nematode feeding sites. Annu. Rev. Phytopathol. 40, 191–219. [DOI] [PubMed] [Google Scholar]
- Gillespie, J.W. , Best, C.J. , Bichsel, V.E. , Cole, K.A. , Greenhut, S.F. , Hewitt, S.M. et al. (2002) Evaluation of non‐formalin tissue fixation for molecular profiling studies. Am. J. Pathol. 160, 449–457. [DOI] [PMC free article] [PubMed] [Google Scholar]
- Goldsworthy, S.M. , Stockton, P.S. , Trempus, C.S. , Foley, J.F. and Maronpot, R.R. (1999) Effects of fixation on RNA extraction and amplification from laser capture microdissected tissue. Mol. Carcinogen. 25, 86–91. [PubMed] [Google Scholar]
- Hofmann, J. , Szakasits, D. , Blochl, A. , Sobczak, M. , Daxbock‐Horvath, S. , Golinowski, W. et al. (2008) Starch serves as carbohydrate storage in nematode‐induced syncytia. Plant Physiol. 146, 228–235. [DOI] [PMC free article] [PubMed] [Google Scholar]
- Hoth, S. , Stadler, R. , Sauer, N. and Hammes, U.Z. (2008) Differential vascularization of nematode‐induced feeding sites. Proc. Natl. Acad. Sci. USA, 105, 12617–12622. [DOI] [PMC free article] [PubMed] [Google Scholar]
- Ithal, N. , Recknor, J. , Nettleton, D. , Maier, T. , Baum, T.J. and Mitchum, M.G. (2007) Developmental transcript profiling of cyst nematode feeding cells in soybean roots. Mol. Plant–Microbe Interact. 20, 510–525. [DOI] [PubMed] [Google Scholar]
- Jammes, F. , Lecomte, P. , De Almeida‐Engler, J. , Bitton, F. , Martin‐Magniette, M.L. , Renou, J.P. et al. (2005) Genome‐wide expression profiling of the host response to root‐knot nematode infection in Arabidopsis. Plant J. 44, 447–458. [DOI] [PubMed] [Google Scholar]
- Kerk, N.M. , Ceserani, T. , Tausta, S.L. , Sussex, I.M. and Nelson, T.M. (2003) Laser capture microdissection of cells from plant tissues. Plant Physiol. 132, 27–35. [DOI] [PMC free article] [PubMed] [Google Scholar]
- King, C. , Guo, N. , Frampton, G.M. , Gerry, N.P. , Lenburg, M.E. and Rosenberg, C.L. (2005) Reliability and reproducibility of gene expression measurements using amplified RNA from laser‐microdissected primary breast tissue with oligonucleotide arrays. J. Mol. Diagn. 7, 57–64. [DOI] [PMC free article] [PubMed] [Google Scholar]
- Klink, V.P. , Alkharouf, N. , MacDonald, M. and Matthews, B. (2005) Laser capture microdissection (LCM) and expression analyses of Glycine max (soybean) syncytium containing root regions formed by the plant pathogen Heterodera glycines (soybean cyst nematode). Plant Mol. Biol. 59, 965–979. [DOI] [PubMed] [Google Scholar]
- Nakazono, M. , Qiu, F. , Borsuk, L.A. and Schnable, P.S. (2003) Laser‐capture microdissection, a tool for the global analysis of gene expression in specific plant cell types: identification of genes expressed differentially in epidermal cells or vascular tissues of maize. Plant Cell, 15, 583–596. [DOI] [PMC free article] [PubMed] [Google Scholar]
- Nelson, T. , Tausta, S.L. , Gandotra, N. and Liu, T. (2006) Laser microdissection of plant tissue: what you see is what you get. Annu. Rev. Plant Biol. 57, 181–201. [DOI] [PubMed] [Google Scholar]
- Ohtsu, K. , Smith, M.B. , Emrich, S.J. , Borsuk, L.A. , Zhou, R. , Chen, T. et al. (2007) Global gene expression analysis of the shoot apical meristem of maize (Zea mays L.). Plant J. 52, 391–404. [DOI] [PMC free article] [PubMed] [Google Scholar]
- Parlato, R. , Rosica, A. , Cuccurullo, V. , Mansi, L. , Macchia, P. , Owens, J.D. et al. (2002) A preservation method that allows recovery of intact RNA from tissues dissected by laser capture microdissection. Anal. Biochem. 300, 139–145. [DOI] [PubMed] [Google Scholar]
- Portillo, M. , Fenoll, C. and Escobar, C. (2006) Evaluation of different RNA extraction methods for small quantities of plant tissue: combined effects of reagent type and homogenization procedure on RNA quality‐integrity and yield. Physiol. Plantarum, 128, 1–7. [Google Scholar]
- Ramsay, K. , Jones, M.G.K. and Wang, Z. (2006) Laser capture microdissection: a novel approach to microanalysis of plant–microbe interactions. Mol. Plant Pathol. 7, 429–435. [DOI] [PubMed] [Google Scholar]
- Ramsay, K. , Wang, Z. and Jones, M.G.K. (2004) Using laser capture microdissection to study gene expression in early stages of giant cells induced by root‐knot nematodes. Mol. Plant Pathol. 5, 587–592. [DOI] [PubMed] [Google Scholar]
- Sass, J.E. (1958) Botanical Microtechnique. Ames, IA: Iowa State College Press. [Google Scholar]
- Schad, M. , Mungur, R. , Fiehn, O. and Kehr, J. (2005) Metabolic profiling of laser microdissected vascular bundles of Arabidopsis thaliana . Plant Methods, 1, 2. [DOI] [PMC free article] [PubMed] [Google Scholar]
- Spencer, M.W. , Casson, S.A. and Lindsey, K. (2007) Transcriptional profiling of the Arabidopsis embryo. Plant Physiol. 143, 924–940. [DOI] [PMC free article] [PubMed] [Google Scholar]
- Szakasits, D. , Heinen, P. , Wieczorek, K. , Hofmann, J. , Wagner, F. , Kreil, D.P. et al. (2008) The transcriptome of syncytia induced by the cyst nematode Heterodera schachtii in Arabidopsis roots. Plant J. 57, 771–784. [DOI] [PMC free article] [PubMed] [Google Scholar]
- Van Gelder, R.N. , Von Zastrow, M.E. , Yool, A. , Dement, W.C. , Barchas, J.D. and Eberwine, J.H. (1990) Amplified RNA synthesized from limited quantities of heterogeneous cDNA. Proc. Natl. Acad. Sci. USA, 87, 1663–1667. [DOI] [PMC free article] [PubMed] [Google Scholar]
- Wang, Z. , Potter, R.H. and Jones, M.G.K. (2001) A novel approach to extract and analyse cytoplasmic contents from individual giant cells in tomato roots induced by Meloidogyne javanica . Int. J. Nematol. 11, 219–225. [Google Scholar]
- Zhu, B. , Xu, F. and Baba, Y. (2006) An evaluation of linear RNA amplification in cDNA microarray gene expression analysis. Mol. Genet. Metab. 87, 71–79. [DOI] [PubMed] [Google Scholar]
Associated Data
This section collects any data citations, data availability statements, or supplementary materials included in this article.
Supplementary Materials
Table S1 The log2 expression ratios obtained from the TOM1 hybridizations with RNA doubly amplified from giant cells (GCs) induced by Meloidogyne javanica at 7 days post‐infection (dpi) vs. corresponding controls (CCs). Positive ratio indicates that the gene is induced in GCs (red boxes) and negative ratio indicates that the gene is repressed in GCs (green boxes). Also shown is a comparison of TOM1 log2 ratios with the same data from the homologous genes obtained from the Complete Arabidopsis Transcriptome Microarray (CATMA) hybridized with RNA from Arabidopsis galls at 7 dpi vs. control uninfected segments (reference).
Please note: Wiley‐Blackwell are not responsible for the content or functionality of any supporting materials supplied by the authors. Any queries (other than missing material) should be directed to the corresponding author for the article.
Supporting info item