Abstract
An interferometer for measuring change in index of refraction with pressure is described. Absolute indices of refraction are reported to five decimals for benzene, carbon tetrachloride, and water at pressures as high as 1100 bars over a small temperature range. The results of replicate measurements agree to within ±0.0001. Various equations relating index and specific volume show systematic deviations in all cases. At constant specific volume, the index of carbon tetrachloride increases with increasing temperature, while the index of water decreases with increasing temperature. The refractive index of benzene shows no effect due solely to temperature within the experimental error. Possible explanations for this behavior are discussed.
1. Introduction
Recently there has been great interest in studying optical properties of materials at high pressure as a method of examining short range molecular interactions, the present emphasis being confined largely to spectroscopic measurements. To a large extent index of refraction measurements have been neglected in these studies, although it would appear that index studies with their inherent precision might be of assistance in interpreting spectroscopic data. Index-density studies on condensed phases have been made previously, but the objectives of the previous experiments were usually to determine the applicability of index-density relationships or the usefulness of index as a measure of volume change. Most of the data published have been given to about the fourth decimal, and although such precision is excellent for many measurements, it is not particularly good for index of refraction. The present work was undertaken in an attempt to increase the precision of index measurements at elevated pressures. For these studies an interferometer for use at high pressures has been developed, and this report contains the results of measurements on three liquids at pressures up to about 1000 bars.
Poulter, Ritchey, and Benz [1]1 used the minimum deviation method for studying the refractive indices of liquids to 13,600 atm. The windows [2] of their pressure vessel were mounted at an angle of 30° to each other and with the enclosed liquid constituted a 30° prism. Poulter and Benz [3] discussed the errors arising from distortion of the windows. Rosen [4] used a similar method for studying water to 1800 bars. This equipment as described by Lyons and Poindexter [5] utilized windows forming a prism with a 51° angle. These workers estimated the errors arising from distortion to be of the order of 0.0003 in index but concluded that this error was less than other experimental errors. Gibson and Kincaid [6] used the immersion method for studying the index of benzene. In these studies glass particles were immersed in benzene and pressure was used to match the index of the benzene to that of the glass. A sensitivity of 0.00004 is reported for index but the data are reported to the fourth decimal in index. In these studies the index of the glass was known at 1 bar but its value at elevated pressure was calculated.
As early as 1857, Jamin [7] described the use of an interferometer for measuring change in refractive index of fluids under pressure. Most subsequent work has been done on gases, the most notable being that of Michels and Hamers [8]. The windows limit the pressure range of interference methods. The present report describes an interferometer which is completely enclosed in the pressure vessel so that distortion of the windows at elevated pressure has a negligible effect on the interference pattern. In the present experiments, change in refractive index was measured with a sensitivity of 0.00001 and estimated limits of reproducibility, expressed as twice the standard deviations about the mean, of the order of ±0.0001. With modifications it is believed that both the precision and the pressure range can be extended by at least one order of magnitude. It is also apparent that the principle can be used to obtain precise data on PVT behavior of solids.
2. Apparatus and Experimental Method
2.1. Interferometer Construction
The interferometer, figure 1, was constructed using a stainless steel bar, A, which was about 130 mm long and 13 mm square. The optical portion consisted of two optical flats separated by a steel spacer. Recesses 11 mm in diameter to accommodate the flats were made in opposite sides near one end of the bar. The recesses were of such depth as to leave a web, D, of steel about 3 mm thick in the center of the bar. The steel web served as a seat and spacer for the optical flats and was machined so that its surfaces were parallel. The flats were held firmly against the web by threaded brass rings, E, screwed into the upper threaded portion of the recesses. A small neoprene rubber gasket, F, under each ring was used to seal the cell against leakage and to prevent cracking of the flat. It was necessary to silver both flats to produce bright fringes because they were in contact with liquids having indices of refraction not appreciably different from that of the glass. Thus the front flat, B, was half-silvered on its rear surface and the back plate, C, was a front surface mirror, the light being incident from the right as shown in figure 1. The small glass flats 11 mm in diameter were cut from larger optical flats obtained commercially.
Figure 1.
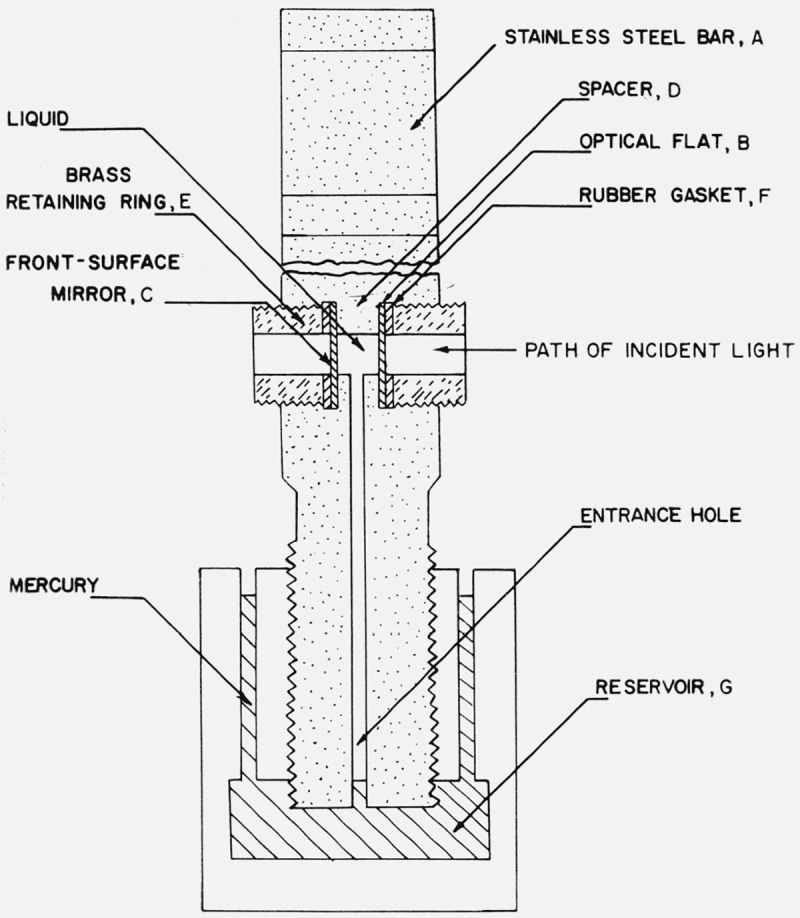
Cross section of the interferometer.
A small hole 3 mm in diameter drilled through the web served as the interferometer chamber. To permit introduction of liquid into the chamber, a small axial hole about 1.5 mm in diameter connected the chamber with the lower end of the bar. This end of the bar was threaded and screwed into a stainless steel reservoir, G, containing mercury to separate the liquid under study from the oil used as a pressure-transmitting medium. A small hole was drilled into the reservoir to permit transmission of pressure. The upper end of the bar was slotted to facilitate alinement of the interferometer inside the pressure vessel before applying pressure.
2.2. Pressure Vessel
The pressure vessel was mounted on a large optical bench with the associated optical equipment. This vessel was the one used by Gibson [9] in his classic experiments on liquids. The heavy-walled steel container was fitted with two heavy plate glass windows. The windows were supported by hardened optically flat steel plugs of a design proposed by Poulter [2]. The windows provided an aperture of 8 mm which was adequate for viewing the fringes in the 3 mm interferometer chamber placed opposite the windows inside the vessel. The pressure vessel was thermostatted by means of a temperature-controlled oil bath capable of control to within ±0.02 °C. To obtain temperatures below room temperature, the bath was cooled with the immersion coil of a portable refrigerator.
In studying each liquid, the oil bath was brought to constant temperatures of 25, 35, and 55 °C. In the case of water, additional experiments were conducted where the bath was brought to temperatures of 2 and 8 °C. By probing with a calibrated thermo-couple it was discovered that temperature gradients existed within the pressure vessel itself. A calibrated thermocouple was fastened to the interferometer at a position very close to the liquid under study to determine the actual temperatures at which the experiments were conducted.
Pressures were measured to ±0.3 bar with a thermostatted manganin pressure gage mounted in the oil line external to the pressure vessel. The pressure gage was calibrated at the freezing point of benzene as reported by Gibson [10].
2.3. Optics
The optical system was similar to the one described by Saunders [11] and the measurements were made photographically. The light source was a helium discharge tube used in conjunction with a constant deviation prism to permit isolation of individual helium lines for illumination. In these studies the 5875.62 A line was used because it was found to produce fringes best suited for photographing. The optical design permitted visual observation of the interference fringes while photographing, and incorporated a right-angle prism so that the observer was out of direct line of the windows in the pressure vessel. This right-angle prism was turned 90° from its normal position [11] so that all the elements of the optical system were in a horizontal plane. In these experiments one window of the pressure vessel and the oil used to transmit pressure were in the path. They were not expected to affect the fringe pattern even when the window became distorted at elevated pressures. To check this prediction, a thin microscope cover glass (0.015 mm thick) was placed in the vessel. The surfaces of the cover glass were sufficiently flat and parallel to produce internal interference, while the glass was so thin that a negligible change in thickness would be produced by a pressure change of 1000 bars. No change in the fringe system was detected at pressures between 1 bar and 1000 bars and it was concluded that distortion of the windows would have no appreciable effect on the measurements.
3. Experimental Technique
A typical experiment was performed as follows: The interferometer was assembled and adjusted to produce a fringe system. The instrument was then filled with the liquid under study. In order to remove air and to ensure that air bubbles were not formed at elevated temperatures it was found necessary to fill the interferometer under vacuum with freshly boiled liquid. The fringe system was rechecked and the interferometer placed inside the pressure vessel and alined. After waiting for about 20 min for attainment of thermal equilibrium, the pressure was raised to some value between 1 bar and 1000 bars and an interval of about 20 min permitted for dissipation of the heat generated by compression. The pressure was then decreased slowly to 1 bar and the fringes photographed as they passed a reference mark on one of the flats. Another 20 min interval was allowed for restoration of thermal equilibrium at 1 bar. Each measurement, therefore, represented an independent experiment between an elevated pressure and 1 bar. Pressure intervals were chosen to give essentially four measurements between 1 bar and 1000 bars.
4. Materials
Measurements were made on benzene, carbon tetrachloride, and water at approximately 25, 35, and 55 °C. Additional measurements were made on water at approximately 2 and 8 °C. The water was freshly distilled while the organic liquids were commercially available materials of high purity used with no further purification. In all cases the purity was corroborated by determination of the index of refraction as described later.
5. Index Calculation
The change in index under pressure was calculated from the equation
| (1) |
where Δμ is the change in refractive index, Δn—the number of fringes passing the reference mark, t—the spacing between the optical flats and θ—the angle of incidence of the light. In these experiments θ=90°, λ=5875.62A, and t=0.2664 cm; so that
| (2) |
Therefore, a shift of one interference fringe represents a change of approximately 1 in the fourth decimal place of refractive index. Estimates of fractional fringes were made to one-tenth of a fringe so that the measurements were made to approximately 1×10⁻⁵ in the index. With this sensitivity it was necessary to correct for the compressibility of the steel spacer. The volume compressibility of the steel was taken to be 0.59×10⁻⁶/bar [12] with the linear compressibility being one-third of this value. At 1000 bars the correction for the compression of the steel was approximately 3 fringes.
It was feared that unequal differential compressions might cause tilting of the interferometer plates and introduce an error in the fringe count. The error from this source was largely eliminated by counting the number of fringes in the field and noting the fringe orientation before and after each run. In some experiments changes were noted in number or orientation of fringes and these data were discarded. Only those experiments showing no changes in the fringe system were considered acceptable.
6. Initial Index Measurement
In order to ascertain the purity of the materials, the indices were first measured to the fourth decimal place with an Abbé refractometer using sodium light. Refractive indices for the 5875.62 A He line were calculated from these results and published dispersion data on the liquids [13, 14, 15].
To use the data of the present investigation for change in index it was necessary to know the initial indices to five decimals. For benzene and water, refractive indices to the fifth decimal were taken from published data on dispersion over a range of temperatures [13, 14]. The initial refractive index of carbon tetrachloride was determined by the method of minimum deviation, the liquid being enclosed in a hollow glass prism [14].
For benzene and carbon tetrachloride the initial refractive indices were only known at temperatures very close to 25 °C. The refractive index at other temperatures of interest was determined in a manner completely analogous to the pressure measurements. In these experiments it was necessary to correct for the expansivity of the steel spacer. This expansivity was determined by experiment using air in the interferometer to be 14.9×10⁻⁶/°C.
It may be noted that all changes in refractive index as determined with the interferometer were absolute values. The initial measurements of refractive index referred to air but were converted to absolute values from a knowledge of the refractive index of air at various temperatures [16].
7. Results and Discussion
The experimental results are given in tables 1 to 4. Tables 1 to 3 include specific volumes in addition to the indices of refraction, while table 4 shows only the index data. Specific volumes given in columns 3 of tables 1 to 3 were computed from values of the constants of the Tait equation given by Gibson and his coworkers [6, 17] who studied these liquids over the same pressure and temperature range. Data of equal precision do not appear to be available for water at 1.56 and 7.64 °C. The data of several workers [18] who studied water at the lower temperatures were compared with the results of Gibson at higher temperatures where there was overlapping of experimental conditions. Although most of the data agreed reasonably well it was considered that the agreement was not sufficiently close to permit calculations involving specific volumes from different sources to be compared. Consequently only index data are reported for water at 1.56 and 7.64 °C and no further discussion of these data are contemplated at this time.
Table 1.
Effect of temperature and pressure upon the refractive index and specific volume of benzene
| Pressure | Absolute refractive index | Specific volume |
|---|---|---|
| 24.80 °C | ||
| Bars | ml/g | |
| 1.0 | 1.49859 | 1.14433 |
| 250.1 | 1.51031 | 1.11973 |
| 489.0 | 1.51982 | 1.10057 |
| 666.1 | 1.52593 | 1.08828 |
| 34.50 °C | ||
| 1.0 | 1.49221 | 1.15805 |
| 246.2 | 1.50438 | 1.13187 |
| 484.8 | 1.51445 | 1.11138 |
| 757.2 | 1.52418 | 1.09192 |
| 1107.7 | 1.53489 | 1.07112 |
| 54.34 °C | ||
| 1.0 | 1.47910 | 1.18757 |
| 274.5 | 1.49422 | 1.15350 |
| 484.4 | 1.50382 | 1.13305 |
| 770.2 | 1.51478 | 1.11014 |
| 1124.5 | 1.52633 | 1.08705 |
Table 4.
Effect of temperature and pressure upon the refractive index of water at two lower temperatures
| Pressure | Absolute refractive index |
|---|---|
| 1.56 °C | |
| Bars | |
| 1.0 | 1.33439 |
| 269.5 | 1.33859 |
| 507.4 | 1.34213 |
| 768.5 | 1.34581 |
| 1049.7 | 1.34948 |
| 7.64 °C | |
| 1.0 | 1.33423 |
| 256.1 | 1.33805 |
| 497.8 | 1.34161 |
| 730.7 | 1.34495 |
| 1088.9 | 1.34929 |
Table 3.
Effect of temperature and pressure upon the refractive index and specific volume of water
| Pressure | Absolute refractive index | Specific volume |
|---|---|---|
| 24.80 °C | ||
| Bars | ml/g | |
| 1.0 | 1.33293 | 1.00288 |
| 259.6 | 1.33652 | .99152 |
| 463.6 | 1.33942 | .98318 |
| 762.8 | 1.34322 | .97180 |
| 1108.6 | 1.34747 | .95973 |
| 34.50 °C | ||
| 1.0 | 1.33177 | 1.00580 |
| 259.3 | 1.33531 | .99463 |
| 480.9 | 1.33832 | .98572 |
| 799.2 | 1.34228 | .97385 |
| 1110.0 | 1.34588 | .96318 |
| 54.34 °C | ||
| 1.0 | 1.32866 | 1.01415 |
| 241.6 | 3.33192 | 1.00372 |
| 489.7 | 1.33517 | .99371 |
| 785.1 | 1.33883 | .98267 |
| 1127.7 | 1.34274 | .97089 |
7.1. Internal Consistency of the Data
Several replicate measurements were made where the interferometer was completely disassembled and refilled with liquid before each measurement. In each experiment the system was brought to the same pressure as nearly as possible, and then small interpolations were made in order to compare the data directly. On the basis of two experiments of five and four determinations each, the standard deviation was computed to be 0.00005 in refractive index, corresponding to limits of reproducibility of measurements of ±0.0001, or twice the standard deviation about the mean. Inspection of large scale graphs of index versus pressure, figures 2 and 3, shows that the points lie on a smooth curve with random deviations in the fifth decimal. As a matter of interest, it may be noted that the pressure measurement although assumed exact in this discussion may be subject to a greater relative error than the measurement of index. Of the present data those for water and benzene appear to be slightly more consistent than those for carbon tetrachloride.
Figure 2.
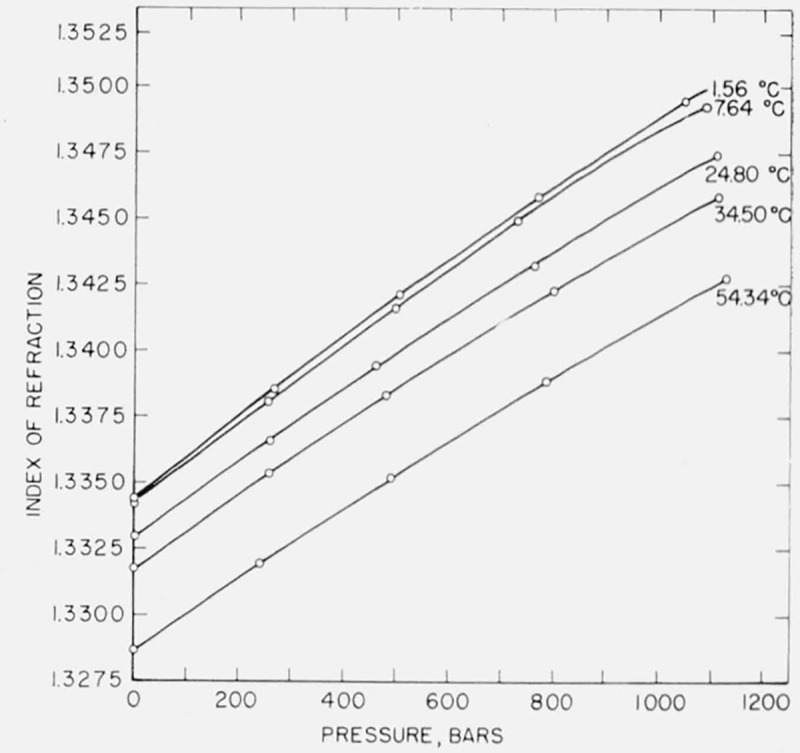
Pressure dependence of index of refraction of water.
Figure 3.
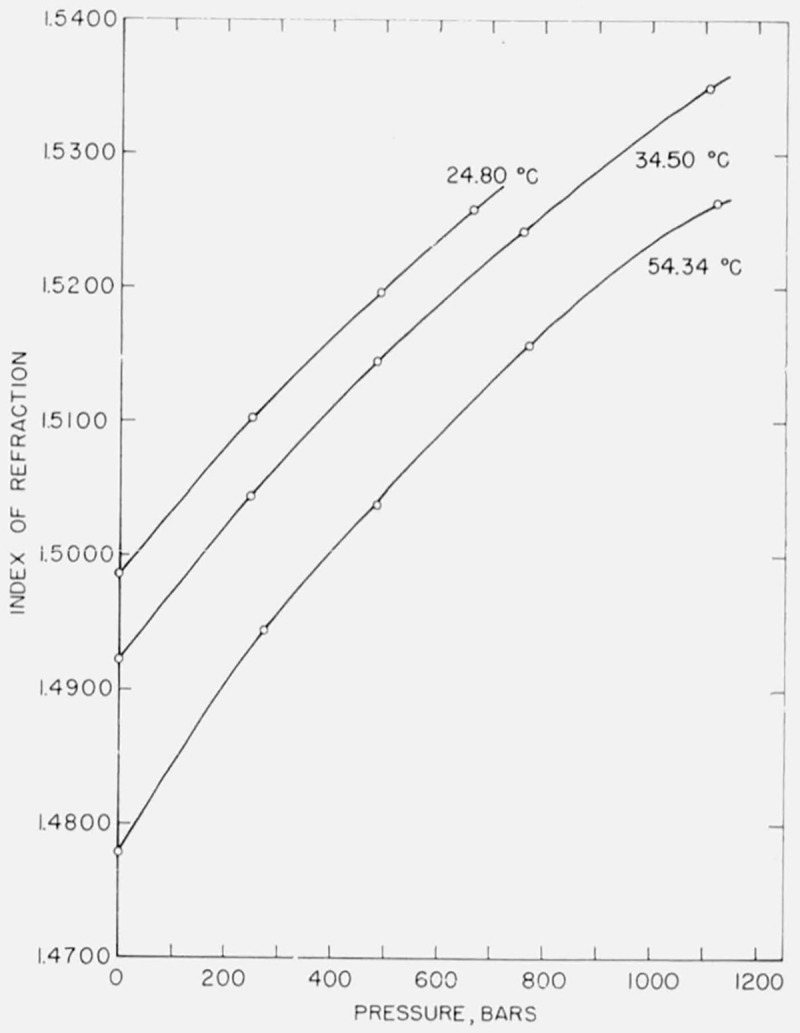
Pressure dependence of index of refraction of benzene.
7.2. Comparison With Other Data
For purposes of comparing the present data there appear to be only two previously published sets of data, those of Gibson and Kincaid on benzene [6] and those of Rosen on water [4]. Gibson and Kincaid covered essentially the same pressure and temperature range as the present experiments, but Rosen restricted his measurements to 25 °C. Gibson and Kincaid used the immersion method of determining index while Rosen employed the minimum deviation method. Both sets of data are reported to four decimals. Both authors made measurements for more than one wavelength, all differing from the wavelength used here. These data may best be compared with the data of the present investigation by plotting change in refractive index versus pressure, if allowance is made for dispersion, temperature, and vacuum corrections, it is found that the present data agree with the data of Gibson and Kincaid [6] and Rosen [4] exactly to the third decimal with maximum deviations of two or three units in the fourth decimal or last significant figure reported by these authors.
A similar approach was followed in comparing the data of the present investigation for change of refractive index with temperature at 1 bar with that of Pesce for benzene [19]. Pesce found the change in absolute refractive index in going from 24.80 to 54.34 °C to be −0.01934. The measurement from the present study over the same temperature range was −0.01949.
7.3. Variation of Index at Constant Volume
In the case of the present data, a graph of index versus specific volume is of considerable interest. These graphs are given in figures 4, 5, and 6 for water, benzene, and carbon tetrachloride. The relationship is not linear but rather that of a curve convex to the specific volume axis with a very large radius of curvature. In the case of water, the refractive index decreases with increasing temperature at constant specific volume, while in carbon tetrachloride the refractive index increases with increasing temperature, the changes in index in both cases being small—of the order of a few parts in the fourth decimal for a temperature change of 10 °C. It appears that, in the case of benzene, there is no significant dependence of refractive index upon temperature at constant volume, although a larger scale graph of the data shows a separation into three curves of constant temperature with the refractive index decreasing with increase of temperature at the same specific volume. For each liquid there appears to be a tendency for the refractive index to vary less with temperature at higher specific volumes.
Figure 4.
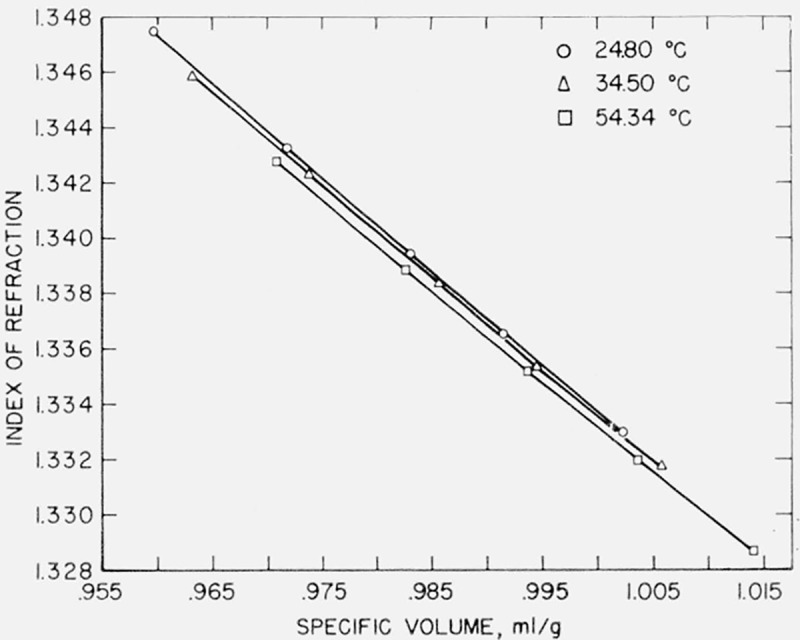
Index of refraction-specific volume relationship in water.
Figure 5.
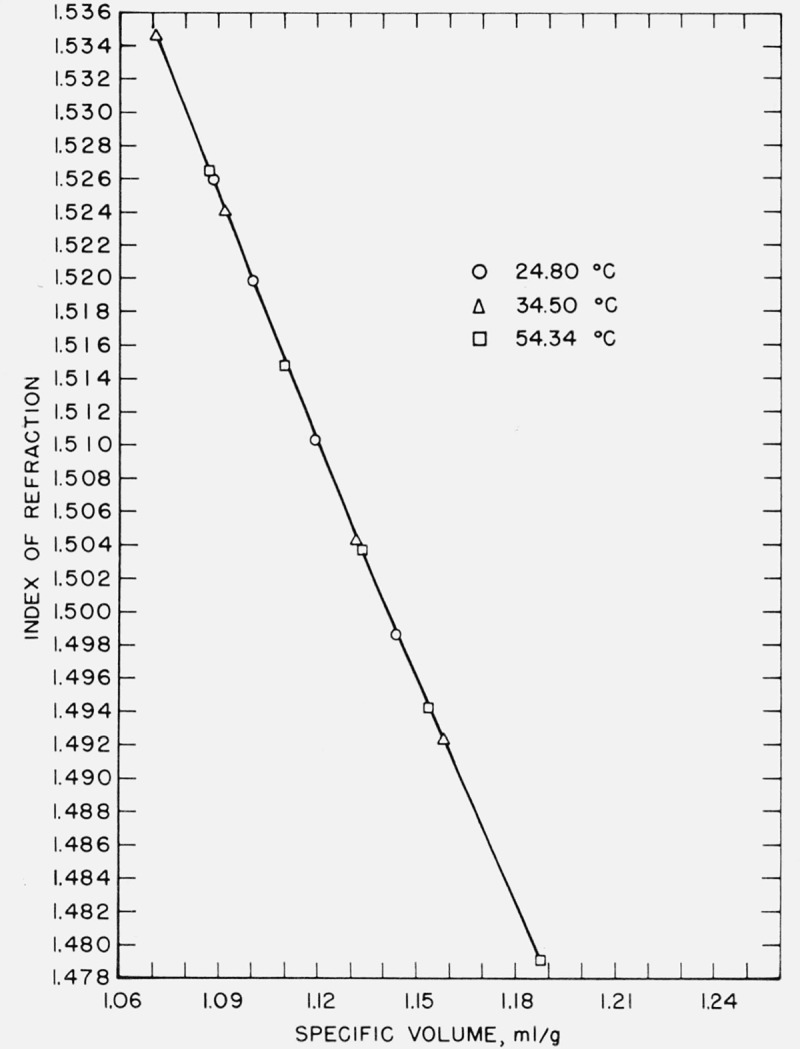
Index of refraction-specific volume relationship in benzene.
Figure 6.
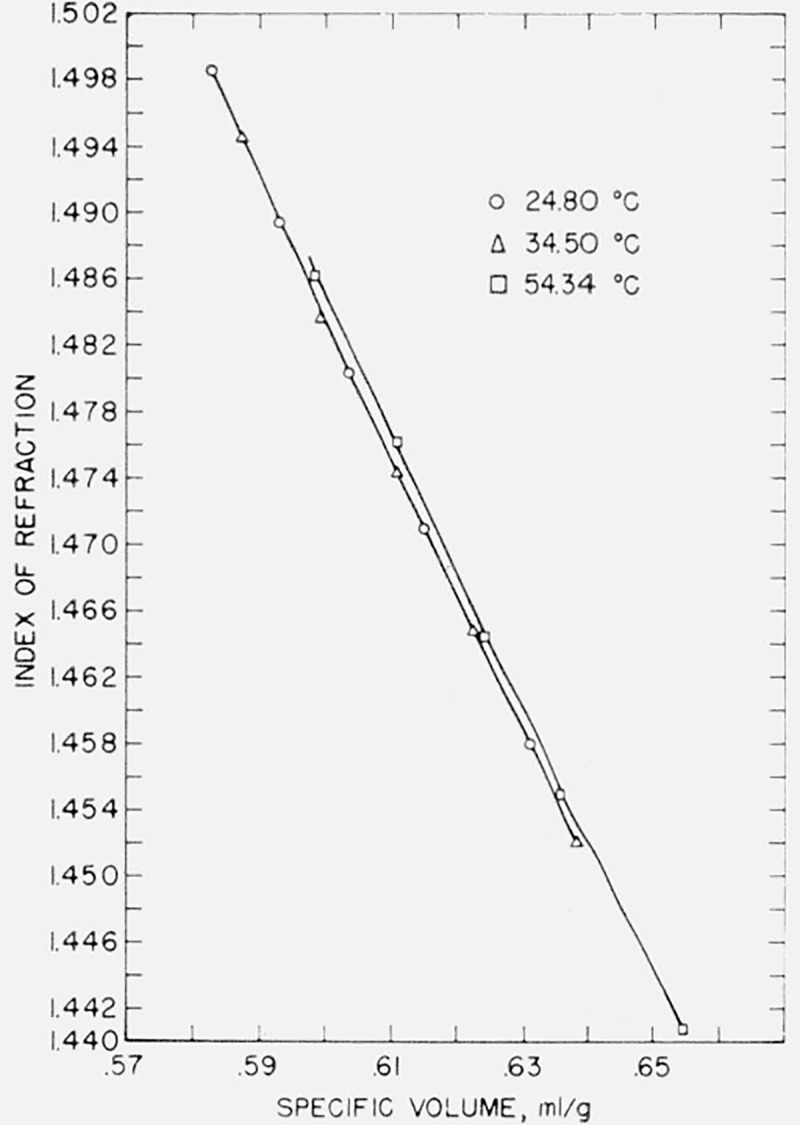
Index of refraction-specific volume relationship in carbon tetrachloride.
These results show that in a liquid where specific volume is held constant, it does not necessarily follow that the refractive index is constant. Despite the fact that this appears to be the first report of this effect, it is not completely unexpected. Gibson and Loeffler [20] observed a shift in the absorption band of solutions of chromophoric materials with temperature at constant volume. Oksengorn [21, 22] has demonstrated a shift of the ultraviolet absorption band of C6H6 to longer wavelengths with increasing temperature at constant volume. Robertson [23] has given analogous data for solutions of organic materials in an inert solvent. Gibson and Loeffler [20] attributed the shift to the fact that at higher temperatures the molecules spend a greater fraction of time at close distances to their neighbors. The increased perturbation arising in the close approaches would produce a shift in position of the electronic levels and shift the band. Robertson [23], although attributing the shift with changing specific volume at constant temperature to perturbations arising from Van der Waal forces, believes the shift with temperature at constant volume arises from changes in band shape as a result of increased population of the higher vibrational levels at high temperatures. It is well known that band shapes vary when pressure and temperature are changed [24, 25, 26].
Inasmuch as this represents the first report of change in index at constant volume, as far as can be ascertained, it is of some importance to inquire whether the effect is real or might arise from experimental errors. In order to produce coincidence in the curves for water a maximum shift of the order of 0.0006 in index, or a shift of 0.002 in specific volume or some combination of these two is required. According to the estimates of precision in index the value 0.0006 lies far outside the experimental precision and the value of 0.002 in specific volume is not comparable with the precision of ±0.00005 in specific volume claimed by Gibson [9]. There remains the additional possibility that the temperatures reported here might be in error sufficiently to produce the observed spread in figures 4 and 6. Temperatures were measured using both a thermo-couple and platinum resistance thermometer, with a maximum difference over the temperature range of 0.11 °C. This maximum uncertainty cannot attribute appreciably to the observed separation of the data. In addition, all measurements were performed in exactly the same manner at identical temperatures. The fact that the shifts for water and C Cl4 are in opposite directions, while C6H6 shows no shift within experimental error, plus the estimates of errors involved requires the conclusion that the shifts of index at constant volume are real for H2O and C Cl4.
From the previous discussion it is concluded that at constant volume the position and shape of the absorption bands change with temperature. For the liquids studied here data at constant volume appear to be available only for benzene which was studied by Oksengorn [21, 22]. The frequency used here is on the low frequency tail of the uv absorption band as shown by the dispersion data of Gibson and Kincaid [6]. The shift in the uv band with increasing temperature at constant volume is toward lower frequencies and, at the frequency of measurement used here, a higher index should result from this shift.
If it is assumed that the shift in absorption frequency with temperature at constant volume is equivalent to a change in frequency of measurement at constant temperature and pressure, the available data can be combined to calculate the change in index resulting from the shift in the absorption band. This assumption specifically requires that the shape of the absorption band be unchanged by the shift. At a specific volume of 1.10 cm3/g, Oksengorn’s data show a shift Δv/ΔT≈−1.5 cm−1/°C. Gibson and Kincaid report a frequency dependence Δμ/Δv≈2.5 ×10−6/cm−1 at 1 atm and 25 °C. Therefore, the change in index at constant volume would be Δμ/ΔT≈3.7×10−6/°C with the change in sign resulting from the fact that shift of the absorption band is of opposite sense to the change in index. The calculated change in index in increasing the temperature from 24.80 to 54.34 °C, at constant volume is 1.1×10⁻⁴. Considering the several measurements required for the experimental determination of change in index at constant volume, i.e., change in index with pressure at various temperatures, change in index with temperature at 1 bar and expansivity and compressibility of the interferometer, it appears that the predicted change in index of 1.1×10⁻⁴ would most probably not be detected. The results of the present study do not indicate any significant change in refractive index with temperature at constant specific volume for benzene.
The shift of an absorption band in the ultraviolet region of the spectrum is not the only possible explanation for change in index with temperature at constant volume. Since the dispersion of benzene is large, the index would be very sensitive to changes in band contour. According to Robertson [23] at constant volume an enhancement of the low frequency tail of the absorption band with increasing temperature is to be expected. The results of the present study do not appear to be in accordance with this expectation. Measurements of index at different wavelengths might provide a sensitive method for studying changes in contour of the band tail.
No comparable data at constant volume appear to be available for C Cl4 or H2O. The magnitude of the change in index of C Cl4 with temperature at a constant volume of 0.60 ml/g is about 4.8×10⁻⁵/°C. This result might be explained by a shift of the uv band to longer wavelengths with increasing temperature at constant volume. Alternatively, changes in band contour might cause the observed changes in refractive index.
The data for H2O show a decrease in index with increasing temperature of magnitude 2.6×10⁻⁵/°C at a constant volume of 0.97 ml/g. From dispersion data on H2O [14] it is apparent that the frequency used here is on the tail of the uv absorption band near 1800 A [27]. Therefore, it would appear that the data on index might be explained by a shift of the uv band to shorter wavelengths with increasing temperature at constant volume. It is not clear that shifts in this direction occur since no data at constant volume are available, and data of Collins [28] on the near infrared absorption of water to 5000 atm show no appreciable shifts or intensity changes in this region. However, an appropriate change in contour without a shift of the center of gravity of the band would also produce the observed result. It is possible that the effect observed in water with temperature at constant volume is due to small changes in the hydrogen binding.
7.4. Refractive Index Formulas
Various equations have been proposed which express a relationship between refractive index and specific volume in such a way that the relationship is independent of temperature. The following equations may be mentioned: the Gladstone-Dale [29], (μ−1)V=constant, the Lorentz-Lorenz [30, 31], (μ2−1/μ2+2)V=constant, the Newton [32], (μ2−1)V=constant and the Eykman [33], (μ2−1/μ+0.4)V=constant, where μ represents the index of refraction and V the specific volume. Upon fitting the data of the present investigation to the various equations it was found, in agreement with the earlier conclusion of Gibson [6], that the Eykman equation for benzene gives a satisfactory fit to four significant figures. However, none of the formulations give satisfactory agreement for each liquid over the range of temperature and pressure employed. This observation is not new [4, 6, 34] and a considerable amount of work has been done, particularly on the Clausius-Mosotti equation, the dielectric analog of the Lorentz-Lorenz equation with the dielectric behavior of both gases and liquids at elevated pressures. Danforth [35] who measured the dielectric constant of liquids up to 12,000 bars believed that his data indicated both a change of polarizability and a failure of the Clausius-Mosotti equation at elevated pressures. A comprehensive survey of much of this work is given by Ten Seldam [36]. More recently it has been realized that the intermolecular forces may be investigated directly by spectroscopic studies at elevated pressures and a survey of current work in this field is available [24].
By using a more refined approximation of the local field acting upon a molecule Böttcher [37] gives as an improved form of the Lorentz-Lorenz equation
| (3) |
where m is the molecular weight, NA is Avogadro’s number, α is the polarizability of the molecule and a is the effective radius of the molecule. It can be seen that by plotting
a straight line results with an intercept involving α and a slope involving a. The data for water, benzene, and carbon tetrachloride were plotted according to eq (3) and the graphs are shown in figures 7, 8, and 9. Values of α and a determined by least squares are given in table 5.
Figure 7.
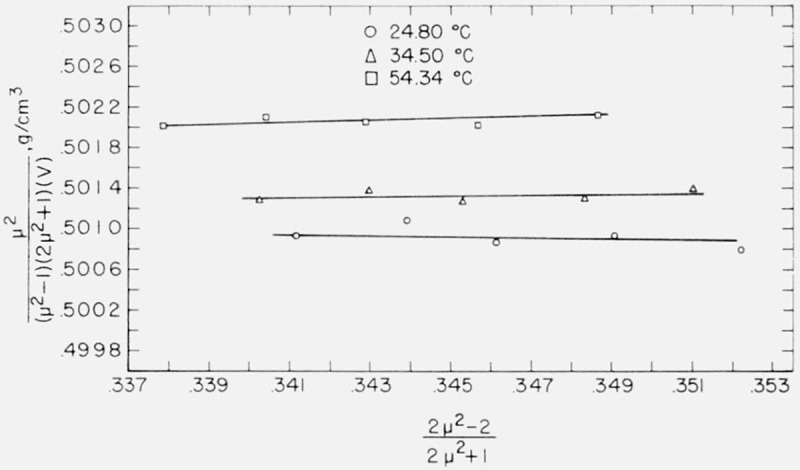
Relationship between and for the water molecule.
Figure 8.
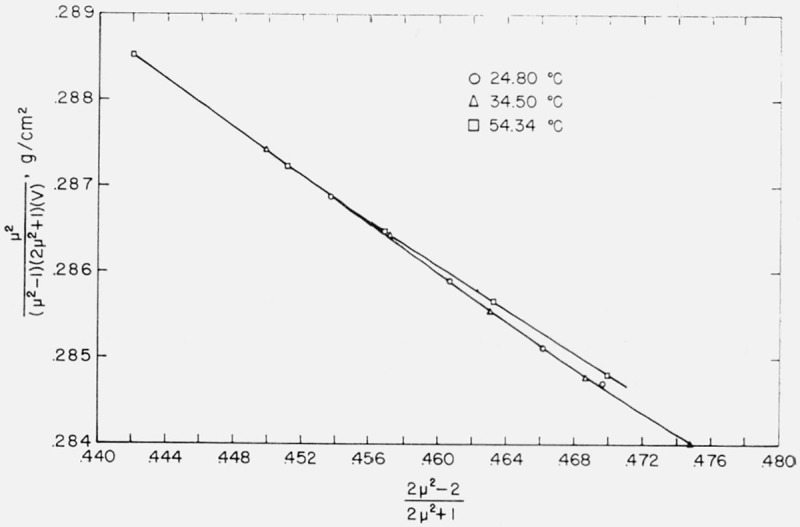
Relationship between and for the benzene molecule.
Figure 9.
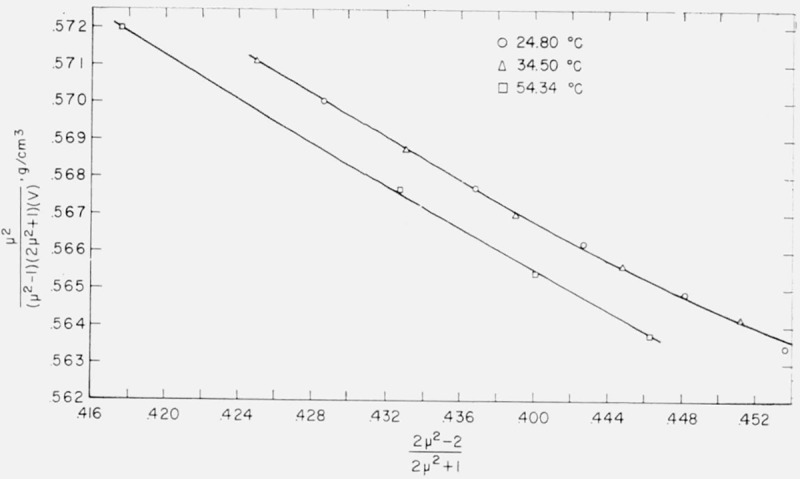
Relationship between and for the carbon tetrachloride molecule.
Table 5.
Polarizabilities and molecular radii as determined from Böttcher’s equation
| Molecule | Temperature | Polarizability, α | Average polarizability, α | Molecular radius, a | Average molecular radius, a |
|---|---|---|---|---|---|
| °C | A3 | A3 | A | A | |
| Water | 24.80 34.50 54.34 |
1.57 1.59 1.59 |
1.58 | 3.77 | 3.77 |
| Benzene | 24.80 34.50 54.34 |
9.86 9.83 9.90 |
9.86 | 2.93 2.92 2.95 |
2.93 |
| Carbon tetrachloride | 24.80 34.50 54.34 |
9.93 9.93 9.79 |
9.88 | 2.96 2.96 2.87 |
2.93 |
Böttcher used as his model a spherical molecule whose polarizability and radius were independent of temperature and pressure. It can be seen from the figures that, of the three liquids, benzene fits this model best, but even with benzene an increasing curvature is apparent at the right-hand side of the graph. This region corresponds to the physical situation of the liquid being under greater pressure. It may be inferred, therefore, that polarizability and/or radius of the benzene molecule is not completely independent of pressure.
This curvature may also be observed for carbon tetrachloride in figure 9. There is here, in addition, a lateral displacement of the isotherms. The fact that both the intercept and the slope of the lines representing the data for 24.80 and 54.34 °C are distinctly different indicates that both polarizability and radius are not independent of temperature (as well as pressure) for C Cl4.
Böttcher’s formula, eq (3), was developed for a nonpolar dielectric, and figure 7 shows that water fits Böttcher’s model least well of the liquids studied. Despite some scattering of points there appears to be a definite separation of the isotherms. A meaningful estimate of molecular radius, a, may only be had for the data at 24.80 °C, because the slope of the curve at this temperature is negative as is necessary for the calculation. The slopes of the curves at the two higher temperatures are slightly positive.
For each liquid average values of α and a over the temperature range involved are shown in table 5. For carbon tetrachloride it was found that α =9.88 A3 and a = 2.93 A. Böttcher calculated α =9.07 A3 and a = 2.42 A by applying his equation to a series of mixtures of carbon disulfide and carbon tetrachloride. Average values of a for water, carbon tetrachloride, and benzene were found to be 3.77 A, 2.93 A, and 2.93 A, respectively. From molar volume data for these liquids over the same temperature range, corresponding values of a were found to be 1.94 A, 3.33 A, and 3.40 A. The large difference in the case of water is again presumed to be due to the fact that water is a polar liquid.
Table 2.
Effect of temperature and pressure upon the refractive index and specific volume of carbon tetrachloride
| Pressure | Absolute refractive index | Specific volume |
|---|---|---|
| 24.80 °C | ||
| Bars | ml/g | |
| 1.0 | 1.45791 | 0.63093 |
| 276.9 | 1.47089 | .61486 |
| 523.6 | 1.48037 | .60347 |
| 797.4 | 1.48934 | .59299 |
| 1116.7 | 1.49847 | .58276 |
| 34.50 °C | ||
| 1.0 | 1.45197 | 0.63855 |
| 255.4 | 1.46481 | .62234 |
| 480.9 | 1.47426 | .61094 |
| 756.1 | 1.48381 | .59948 |
| 1119.9 | 1.49441 | .58710 |
| 54.34 °C | ||
| 1.0 | 1.44067 | 0.65496 |
| 248.7 | 1.45493 | .63623 |
| 452.7 | 1.46428 | .62423 |
| 751.9 | 1.47616 | .61006 |
| 1059.2 | 1.48617 | .59830 |
Acknowledgments
The authors are indebted to R. E. Gibson, Director of the Applied Physics Laboratory of the Johns Hopkins University, for the use of the pressure vessel in which the experiments were conducted. The authors also thank I. Malitson of the Refractometry Section of the National Bureau of Standards for his initial measurements of the refractive index of carbon tetrachloride.
Footnotes
Figures in brackets indicate the literature references at the end of this paper.
8. References
- [1].Poulter T. C., Ritchey C., and Benz C. A., Phvs. Rev 41, 366 (1932). [Google Scholar]
- [2].Poulter T. C., Phvs. Rev. 40, 860 (1932). [Google Scholar]
- [3].Poulter T. C. and Benz C. A., Phys. Rev. 40, 872 (1932). [Google Scholar]
- [4].Rosen J. S., J. Opt. Soc. Am. 37, 932 (1947). [DOI] [PubMed] [Google Scholar]
- [5].Lyons W. J. and Poindexter F. E., J. Opt. Soc. Am. 26, 146 (1936). [Google Scholar]
- [6].Gibson R. E. and Kincaid J. F., J. Am. Chem. Soc. 60, 511 (1938). [Google Scholar]
- [7].Jamin J., Compt. rend 45, 892 (1857). [Google Scholar]
- [8].Michels A. and Hamers J., Physica 4, 995 (1937). [Google Scholar]
- [9].Gibson R. E., J. Am. Chem. Soc. 59, 1521 (1937). [Google Scholar]
- [10].Gibson R. E., J. Am. Chem. Soc. 57, 284 (1935). [Google Scholar]
- [11].Saunders J. B., J. Research NBS 35,157 (1945) RP1668. [Google Scholar]
- [12].Bridgman P. W., The Physics of High Pressure (G. Bell & Sons Ltd., London: 1949). [Google Scholar]
- [13].Forziati A. F., J. Research NBS 44, 373 (1950) RP2085. [Google Scholar]
- [14].Tilton L. W. and Taylor J. K., J. Research NBS 20, 419 (1939) RP1085. [Google Scholar]
- [15].Smithsonian Physical Tables, 9th ed. (Washington, D.C., 1954). [Google Scholar]
- [16].Pérard A., Travaux et Memoires du Bureau International des Poids et Mesures 19 (1932). [Google Scholar]
- [17].Gibson R. E. and Loeffler O. H., J. Am. Chem. Soc. 63, 898 (1941). [Google Scholar]
- [18].Dorsey N. E., Properties of Ordinary Water Substance (Reinhold Publ. Corp., New York, N.Y., 1940). [Google Scholar]
- [19].Pesce B., Gazz. Chim. ital. 65, 440 (1935). [Google Scholar]
- [20].Gibson R. E. and Loeffler O. H., J. Am. Chem. Soc. 62, 1324 (1940). [Google Scholar]
- [21].Oksengorn B., Compt, rènd. 242, 2324 (1956). [Google Scholar]
- [22].Ref. 24; p. 323.
- [23].Robertson W. W., J. Chem. Phys. 33, 362 (1960). [Google Scholar]
- [24].Colloques Internationaux du Centre National de la Recherche Scientifique Proprietes Optiques et Acoustiques des Fluides Comprimes et Actions Intermoleculaires (Centre National de la Recherche Scientifique, Paris, 1959). [Google Scholar]
- [25].Kronenberger A. and Pringsheim P., Z. Physik 40, 75 (1926). [Google Scholar]
- [26].Fishman E. and Drickamer H. G., J. Chem. Phvs. 24, 548 (1956). [Google Scholar]
- [27].Watanabe K. and Zelikoff M., J. Opt. Soc. Am. 43, 753 (1953). [Google Scholar]
- [28].Collins J. R., Phys. Rev. 36, 305 (1930). [Google Scholar]
- [29].Gladstone J. H. and Dale T. P., Phil. Trans. 153, 337 (1863). [Google Scholar]
- [30].Lorentz H. A., Ann. Physik 9, 641 (1880). [Google Scholar]
- [31].Lorenz L., Ann. Physik 11, 70 (1880). [Google Scholar]
- [32].Houstoun R. A., A Treatise on Light (Longmans, Green & Co., New York, 1938). [Google Scholar]
- [33].Eykman J. F., Rec. Trav. Chim. 14, 177 (1895). [Google Scholar]
- [34].Poindexter F. E. and James L. E., Phys. Rev. 42, 910 (1932). [Google Scholar]
- [35].Danforth W. E., Phys. Rev. 38, 1224 (1931). [Google Scholar]
- [36].Ten Seldam C. A., Dissertation Univ. of Utrecht, March 1953. (Van Gorcum & Co., N. V., Assen, Netherlands, 1953). [Google Scholar]
- [37].Böttcher C. J. F., Theory of Electric Polarization (Elsevier Publishing Co., Amsterdam, 1952). [Google Scholar]


